 filings.tools
Fastenal (FAST) 10-K risk factor changes: FY2018 vs FY2017
The 2018-12-31 10-K against the 2017-12-31 one, compared heading by heading and sentence by sentence. One of these filings carries no fiscal year tag, so its year is the calendar year of the period end.
Item 1A43 rewritten26 added16 removed172 unchanged
All filing items627 rewritten349 added308 removed1,407 unchanged
Summary
counted, not written
- Item 1A headings could not be compared: only 0 carried over between the two years, which usually means one filing was read wrongly, so none is reported as new or removed.
- Sentence by sentence, 349 added, 308 removed, 627 rewritten and 1,407 unchanged across 15 items that differ.
Sentences by item
22 items, with every count and a link to each item that changed
Underlined words on a shaded ground are new in FY2018; struck-through words were in FY2017. Sentences that are wholly new or wholly gone are labelled rather than marked.
Item 1A. RISK FACTORS
43 rewritten, 26 added, 16 removed, 172 unchanged
In recent years, however, we have devoted increased resources to other growth drivers, including our industrial vending business, our Onsite business, [removed: and] our national accounts [removed: team.][added: team, and our international operations.]
[removed: Failure to achieve any of our goals regarding industrial vending,] Onsite locations, national accounts signings, [added: digital solutions, international operations,] or other growth drivers could negatively impact our long-term sales growth.
Further, failure to identify appropriate [removed: customer sites] [added: targets] for our Onsite [added: and industrial vending] businesses or failure to find suitable locations for [removed: our Onsite businesses] [added: them] once appropriate [removed: customer sites] [added: targets] are identified may adversely impact our goals regarding the number of new Onsite locations we are able to [removed: open.][added: open or the number of industrial vending devices we are able to deploy.]
Customer and product mix have contributed to the decline in our gross profit percentage over time, including in [removed: 2017] [added: 2018] and [removed: 2016,] [added: 2017,] and will likely continue to affect our gross profit percentage in [removed: 2018] [added: 2019] and beyond.
The ability to identify new products and product lines, and integrate them into our selling locations and distribution network, may impact our ability to [removed: compete and] [added: compete,] our [removed: sales] [added: ability to generate additional sales,] and [added: our] profit margins.
Our success depends in part on our ability to attract, motivate, and retain a sufficient number of qualified employees, including inside and outside branch associates, Onsite managers, [removed: and] national account sales representatives, [added: and support personnel,] who understand and appreciate our culture and are able to adequately represent this culture to our customers.
[removed: If we are unable to hire] and retain personnel capable of consistently providing a high level of customer service, as demonstrated by their enthusiasm for our culture and product knowledge, our sales could be materially adversely affected.
An inability to recruit and retain a sufficient number of qualified individuals in the future may also delay the planned [removed: openings of new branches and planned] expansion of our [removed: other] [added: various] selling channels.
We may not be able to compete effectively against traditional or non-traditional competitors, which could cause us to lose market share or erode our operating [removed: income.][added: income profit and/or percentage.]
Interruptions in the proper functioning of information systems [added: or the inability to maintain or upgrade our information systems, or convert to alternate systems in a timely and efficient manner,] could disrupt [removed: operations and] [added: operations,] cause unanticipated increases in costs and/or decreases in [removed: revenues.][added: revenues, and result in less efficient operations.]
[removed: Although our information systems are protected with robust backup systems, including physical and software safeguards and remote processing capabilities,] [added: Still,] information systems are [removed: still] vulnerable to natural disasters, power losses, unauthorized access, telecommunication failures, and other problems.
In addition, certain software used by us is licensed from, and certain services related to our information systems are provided by, third parties who could choose to discontinue their [added: products or services or their] relationship with us.
[removed: If critical information systems fail or these systems or related software or services are otherwise unavailable, our] [added: Our] ability to process orders, maintain proper levels of inventories, collect accounts receivable, pay expenses, and maintain the security of company and customer [removed: data could be adversely affected.][added: data, as well as the success of our growth drivers, is dependent in varying degrees on the effective and timely operation and support of our information technology systems.]
The nature of our business requires us to receive, retain, and transmit certain personally identifying information that our customers provide [added: to purchase products or services, register on our websites, or otherwise communicate and interact with us.]
We develop and update processes and maintain systems in an effort to try to prevent this from [removed: occurring,] [added: occurring and have established and maintained disclosure controls and procedures that would permit us to make accurate and timely disclosures of any material event, including any cyber security event,] but the development and maintenance of these processes and systems are costly and require ongoing monitoring and updating as technologies change and efforts to overcome security measures become more sophisticated.
[removed: We depend on] [added: The proper functioning of our] information systems [removed: for] [added: is critical to] many aspects of our business and we could be adversely affected if we experience a disruption or data loss relating to our information systems and are unable to recover in a timely manner.
[removed: We could] [added: It is] also [removed: be adversely impacted if] [added: possible that] we are unable to improve, upgrade, maintain, and expand our information systems.
[removed: Extended] [added: If critical information systems fail or these systems or related software or services are otherwise unavailable, or if we experience extended] delays or unexpected expenses in securing, developing, and otherwise implementing technology solutions to support our growth [removed: drivers] [added: and operations, it] could [removed: delay the achievement of] [added: adversely affect] our [removed: goals regarding these growth drivers.][added: profitability and/or ability to grow.]
Our business is subject to a wide array of [added: operating] laws and regulations in every jurisdiction where we operate.
We are subject to a variety of laws and regulations including without limitation; import and export requirements, anti-bribery and corruption laws, [removed: tax laws (including U.S. taxes on foreign subsidiaries),] product compliance laws, environmental laws, foreign exchange controls and cash repatriation restrictions, advertising regulations, data privacy and cyber security requirements, regulations on suppliers regarding the sources of supplies or products, labor and employment laws, and anti-competition regulations.
[removed: In particular,] [added: Further,] our future effective tax rates [added: in any of these jurisdictions] could be [removed: affected] [added: affected, positively or negatively,] by [removed: legislative] [added: changing] tax [removed: reform,] [added: priorities,] changes in statutory rates, or changes in tax laws or the interpretation thereof.
[removed: In addition, notwithstanding the reduction in] [added: The Tax Act reduced] the [added: U.S. federal] corporate income tax [removed: rate] [added: rate,] included [removed: in the recently enacted comprehensive tax legislation commonly referred to as the Tax Cuts and Jobs Act (the 'Tax Act'), the overall impact of the Tax Act on our future financial results is subject to uncertainties and our financial results could be adversely impacted by certain other aspects of the Tax Act, including] [added: a] one-time [removed: taxes] [added: tax] on accumulated offshore earnings, [removed: requiring] [added: eliminated certain deductions for which we had previously qualified, requires] a current inclusion in U.S. federal income of certain earnings of controlled foreign corporations, [removed: allowing] [added: allows] a domestic corporation an immediate deduction in U.S. taxable income for a portion of its foreign-derived intangible income, and [removed: the] [added: introduced a] base erosion anti-abuse tax.
This risk was [added: most recently] demonstrated in 2015 and 2016.
This improvement in customer spending helped to improve our net sales and sales [removed: growth.][added: growth in 2017 and throughout 2018.]
Products manufactured in foreign countries may cease to be [removed: available,] [added: available for reasons unrelated to trade policy,] which could adversely affect our inventory levels and operating results.
Our suppliers could discontinue selling products manufactured in foreign countries at any time for reasons that may or may not be in our control or our suppliers' control, including foreign government regulations, domestic government regulations, political unrest, war, disruption or delays in shipments, [added: or] changes in local economic [removed: conditions, or trade issues.][added: conditions.]
New trade policies could make sourcing product from overseas more difficult and/or more [removed: costly.][added: costly, and could adversely impact our operating profit percentage.]
[removed: This sourcing is] [added: We have made significant structural investments over time to be able to source] both [removed: direct (through] [added: directly from Asia through] our wholly-owned, Asia-based subsidiary, FASTCO Trading Co., [removed: Ltd.)] [added: Ltd.] and [removed: indirect (from] [added: indirectly from] suppliers that [removed: themselves] procure product from international [removed: sources).][added: sources.]
Such changes could adversely affect our [removed: ability to secure sufficient product to service our customers and/or adversely affect our cost of operating in a way that hurts our] financial results.
Costs of raw materials used in our products (e.g., steel) and energy costs [removed: have fluctuated during the last several years.][added: can fluctuate significantly over time.]
While we typically try to pass [removed: increased] [added: higher] supplier prices and fuel costs through to our customers or to modify our activities to mitigate the impact, we may not be successful, particularly if supplier prices or fuel costs rise rapidly.
While increases in the cost of fuel or raw materials could be damaging to us, decreases in those costs, particularly if severe, could also adversely impact us by creating deflation in selling prices, which could cause our gross profit [added: to deteriorate, or by negatively impacting customers in certain industries, which could cause our sales to those customers to decline.]
To the extent that the United States government enacts tariffs or taxes that penalize imports to benefit domestic manufacturing, we may improve our domestic sales which may have an overall positive impact on us given that [removed: 88%] [added: 86%] of our total revenue is derived from the United States.
There can be no assurance we will be able in the future to take [added: effective] advantage [removed: effectively] of the trend toward consolidation.
In addition, the market potential of a particular business strategy may vary from expectations due to a change in the marketplace (such as changes in customer concentration or needs), a change in the nature of that business strategy, or weaker [removed: than anticipated acceptance by customers of that business strategy.]
We cannot guarantee that our market potential estimates are accurate or that we will ultimately decide to expand our industrial vending or Onsite service models [added: as we anticipate] to reach the full market opportunity.
We are exposed to foreign currency exchange rate risk, and changes in foreign exchange rates could increase [removed: our costs to procure] [added: the cost of purchasing] products and impact our foreign sales.
Fluctuations in the relative strength of foreign economies and their related currencies could adversely [added: impact our ability to procure products overseas at competitive prices and our foreign sales.]
As of December 31, [removed: 2017,] [added: 2018,] we had [removed: $415.0] [added: $500.0] of outstanding debt obligations, including loans outstanding under our revolving credit facility (the 'Credit Facility') of [removed: $280.0] [added: $365.0] and senior unsecured promissory notes issued under our master note agreement (the 'Master Note Agreement') in the aggregate principal amount of $135.0.
Loans under the Credit Facility bear interest at a rate per annum based on the London Interbank Offered Rate ('LIBOR') and mature on [removed: March 10, 2020.][added: November 30, 2023.]
Our information systems are protected with robust backup systems and processes, including physical and software safeguards and remote processing capabilities.
We have not encountered any meaningful incidents but there can be no assurance that we will not experience a cyber security incident that may materially impact our consolidated financial statements.
Failure to achieve any of our goals regarding industrial vending, FMI,
If we are unable to hire
Increased competition from brick-and-mortar retailers could cause us to lose market share or reduce our prices or increase our spending.
Similarly, the emergence of on-line retailers, whether as extensions of our traditional competition or in the form of major, non-traditional competitors, could result in easier and quicker price discovery and the adoption of aggressive pricing strategies and sales methods.
These pressures could have the effect of eroding our operating income profit and/or percentage over time.
Tax laws and regulations require compliance efforts that can increase our cost of doing business and changes to these laws and regulations could impact financial results.
We are subject to a variety of tax laws and regulations in the jurisdictions in which we operate.
Maintaining compliance with these laws can increase our cost of doing business and failure to comply could result in audits or the imposition of fines or penalties.
The most significant recent example of this is the comprehensive tax legislation commonly referred to as the Tax Cuts and Jobs Act (the 'Tax Act'), which was enacted in the United States in December 2017.
There is also a longer term risk that the beneficial aspects of the Tax Act on our business could be reversed depending on changes in future fiscal or political priorities.
| • | government regulations and actions, including around trade policy, |
This was initially necessary due to the absence of significant domestic fastener production, but over time we have expanded our non-fastener sourcing as well, and at this time it may be difficult to adjust our sourcing in the short term.
In light of this, changes in trade policies could affect our sourcing operations, our ability to secure sufficient product to serve our customers and/or impact the cost or price of our products, with potentially adverse impacts on our gross and operating profit percentages and financial results.
These risks are particularly acute currently in light of an increase in tariffs, either directly on products we trade in or indirectly on industries we sell into, between the United States and its trading partners, as well as greater uncertainty around regional and global trade agreements generally.
China and Canada represent significant sources of product and Canada and Mexico represent our two largest markets in terms of revenue generation after the United States, and each of these countries are currently and/or have been previously subject to disruption due to historical trade policies.
There can be no assurances that these disruptions will not continue or increase in the future, with the previously mentioned countries or additional countries with which we do business.
The degree to which these changes in the global marketplace affect our financial results will be influenced by the specific details of the changes in trade policies, their timing and duration, and our effectiveness in deploying tools to address these issues.
In particular, the tariffs levied on certain products originating in China, including many that we source and sell, that went into effect on September 24, 2018, have caused us to review and implement potential solutions to the increase in our product costs with our customers.
However, it is too early to determine the ultimate impact and effectiveness of these discussions.
In September 2018, hurricane Florence had a similar impact in our Carolinas region.
than anticipated acceptance by customers of that business strategy.
There can be no assurance that currency exchange rate fluctuations with the Canadian dollar and other foreign currencies will not adversely affect our results of operations, financial condition, and cash flows.
While the use of currency hedging instruments may provide us with protection from adverse fluctuations in currency exchange rates, we are not currently using these instruments and we have not historically hedged this exposure.
If we decide to do so in the future, we could potentially forego the benefits that might result from favorable fluctuations in currency exchange rates.
Increased competition from brick and mortar retailers in markets in which we have in-market locations or from on-line retailers (particularly those major internet providers who can offer a wide range of products and rapid delivery), and the adoption by competitors of aggressive pricing strategies and sales methods, could cause us to lose market share or reduce our prices or increase our spending, thus eroding our operating income.
The proper functioning of our information systems is critical to the successful operation of our business.
to purchase products or services, register on our websites, or otherwise communicate and interact with us.
If we experience a loss related to our information systems or are unable to maintain or upgrade our information systems, or convert to alternate systems, in a timely and efficient manner, our operations may be disrupted or become less efficient.
Difficulties resulting from the transition of our industrial vending hosting services could also be disruptive to the success of our efforts to grow our industrial vending presence.
The success of our growth drivers is dependent in varying degrees on the timely delivery and the functionality of information technology systems to support them.
These factors could result in our 2018 provisional income tax expense booking rate to differ from our expectations.
| • | government regulations, |
Considerable political uncertainty in the United States may result in changes to trade policies that may affect our sourcing operations.
Should this occur, it may be difficult in light of the significant structural investments made over time and the absence of significant domestic fastener production for us to adjust our capabilities to any new policies in the short term, which could increase the difficulty and/or cost of sourcing products.
to deteriorate, or by negatively impacting customers in certain industries, which could cause our sales to those customers to decline.
It is difficult to know in advance what the net effect of such actions will be on companies such as ours, but it is possible that such changes could adversely affect our financial results.
impact our ability to procure products overseas at competitive prices and our foreign sales.
For more information relating to borrowing and interest rates, see the following sections below: Liquidity and Capital Resources – Debt under the heading 'Item 7.
Management's Discussion and Analysis of Financial Condition and Results of Operations', 'Item 7A.
Quantitative and Qualitative Disclosures about Market Risks', and Note 10 of the Notes to Consolidated Financial Statements.
An excerpt. Shown here: 40 of 43 rewritten, all 26 added and all 16 removed. The counts are complete. For every sentence, read Item 1A. RISK FACTORS in the FY2018 filing and the FY2017 filing.
Item 7. MANAGEMENT'S DISCUSSION AND ANALYSIS OF FINANCIAL CONDITION AND RESULTS OF OPERATIONS
176 rewritten, 94 added, 85 removed, 276 unchanged
We distribute these supplies through a network of approximately [removed: 3,000] [added: 3,100] in-market locations.
The manufacturing market includes both [removed: original equipment manufacturers (OEM) and maintenance, repair,] [added: OEM] and [removed: operations (MRO).][added: MRO customers.]
Other users of our [removed: product] [added: products] include farmers, truckers, railroads, oil exploration, production and refinement companies, mining companies, federal, state, and local governmental entities, schools, and certain retail trades.
[removed: It is helpful to appreciate several aspects of our marketplace: (1) It's big,] [added: We estimate] the North American marketplace for industrial supplies is [removed: estimated to be] in excess of $140 billion per year (and we have expanded beyond North America) and no company has a significant portion of this market.
Our gross profit as a percentage of net sales declined to [removed: 49.3%] [added: 48.3%] in [removed: 2017] [added: 2018] from [removed: 49.6%] [added: 49.3%] in [removed: 2016.][added: 2017.]
Our operating income as a percentage of net sales in [removed: 2017] [added: 2018] was comparable to [removed: 2016] [added: 2017] at 20.1% in both years.
We recorded [removed: a provisional] income tax expense of [removed: $294.5] [added: $235.1] in [removed: 2017,] [added: 2018,] or [removed: 33.7%] [added: 23.8%] of earnings before income taxes.
This amount reflects [removed: an estimated] [added: a provisional estimate for the] reduction in our deferred income tax liabilities of $30.8 as a result of the income tax rate decrease included in the Tax Act, [added: partially] offset by an estimated increase in income tax payable in the amount of $6.5 as a result of the transition tax on cash and cash equivalent balances related to accumulated earnings associated with our international operations, also included in the Tax Act.
Our net earnings in [removed: 2017] [added: 2018] were [removed: $578.6,] [added: $751.9,] an increase of [removed: 15.8%] [added: 29.9%] when compared to [removed: 2016.][added: 2017.]
Our diluted net earnings per share were [removed: $2.01] [added: $2.62] in [removed: 2017] [added: 2018] compared to [removed: $1.73] [added: $2.01] in [removed: 2016.][added: 2017, an increase of 30.5%.]
[removed: If we excluded the discrete items that benefited our income tax rate in the fourth quarter of 2017 (primarily related to] [added: (2) Absent] the impact of the Tax [removed: Act),] [added: Act,] our net earnings [removed: in the period] [added: for 2017] would have been [removed: approximately] $554.2, an increase of 11.0% when compared to 2016, and our [added: basic and] diluted [removed: net] earnings per share would have [added: each] been [removed: $1.92.][added: $1.92, an increase of 11.2% and 11.3%, respectively.]
We continued to focus on our growth drivers in [removed: 2017.][added: 2018.]
We signed [removed: 168] [added: 152] new national account contracts (defined as new customer accounts with a multi-site [removed: contract).][added: contract) and our national accounts revenues grew 18.1% in the period.]
Additionally, we signed [removed: 270] [added: 336] new Onsite customer locations (defined as dedicated sales and service provided from within, or in close proximity to, the customer's facility) and [removed: 19,355] [added: 22,073] new industrial vending devices.
| | Q4 [removed: 2017] [added: 2018] | | | Q4 [removed: 2016] [added: 2017] | | | Twelve-month % Change | |
| Number of public branch locations | [removed: 2,383] [added: 2,227] | | | [removed: 2,503] [added: 2,383] | | | [removed: \-4.8] [added: \-6.5] | % |
| Number of active Onsite locations | [removed: 605] [added: 894] | | | [removed: 401] [added: 605] | | | [removed: 50.9] [added: 47.8] | % |
| Number of in-market locations [removed: (1)] | [removed: 2,988] [added: 3,121] | | | [removed: 2,904] [added: 2,988] | | | [removed: 2.9] [added: 4.5] | % |
| Industrial vending devices (installed count) [removed: (2)] [added: (1)] | [removed: 71,421] [added: 81,137] | | | [removed: 62,822] [added: 71,421] | | | [removed: 13.7] [added: 13.6] | % |
| Ratio of industrial vending devices to in-market locations | [removed: 24:1] [added: 26:1] | | | [removed: 22:1] [added: 24:1] | | | | |
[removed: (2)] [added: (1)] This number [added: primarily] represents devices which principally dispense product and produce product revenues, and excludes approximately 15,000 devices [removed: which] [added: that] are [added: part of a locker lease program where the devices are] principally used for the check-in/check-out of equipment.
During the last twelve months, we increased our [added: absolute employee] headcount by [removed: 458] [added: 591] people in our in-market locations and [removed: 941] [added: 1,079] people in total.
[removed: The remaining] [added: This] increase is mostly a function of additions we have made to support customer growth in the field as well as investments in our growth drivers.
We opened [removed: 18] [added: 11] branches and closed [removed: 130] [added: 157] branches in [removed: 2017.][added: 2018.]
Additionally, [removed: eight] [added: ten] branches were converted from public branches to non-public locations.
Our [removed: branch] [added: in-market] network forms the foundation of our business strategy, and we will continue to open or close [removed: branches] [added: locations] as is deemed necessary to sustain and improve our network and support our growth drivers.
| | | [removed: 2017] [added: 2018] | | | [removed: 2016] [added: 2017] | | | [removed: 2015] [added: 2016] | |
| Gross profit | | [removed: 49.3] [added: 48.3] | % | | [removed: 49.6] [added: 49.3] | % | | [removed: 50.4] [added: 49.6] | % |
| Operating and administrative expenses | | [removed: 29.2] [added: 28.2] | % | | [removed: 29.5] [added: 29.2] | % | | [removed: 29.0] [added: 29.5] | % |
| Operating income | | 20.1 | % | | 20.1 | % | | [removed: 21.4] [added: 20.1] | % |
| Net interest expense | | [removed: \-0.2] [added: \-0.3] | % | | \-0.2 | % | | [removed: \-0.1] [added: \-0.2] | % |
| Earnings before income taxes | | 19.9 | % | | 19.9 | % | | [removed: 21.3] [added: 19.9] | % |
| | [removed: 2017] [added: 2018] | | | [removed: 2016] | [added: 2017] | | [removed: 2015] | [added: 2016] | [added: |]
| Net sales | [removed: 4,390.5] [added: $] | [added: 4,965.1] | | [removed: 3,962.0] | [added: 4,390.5] | | [removed: 3,869.2] | [added: 3,962.0] | [added: |]
| Percentage change | [removed: 10.8] [added: 13.1] | [added: |] % | | [removed: 2.4] [added: 10.8] | % | | [removed: 3.6] [added: 2.4] | % |
| Business days | 254 | | | [removed: 255] | [added: 254] | | [removed: 254] | [added: 255] | [added: |]
| Daily sales | [removed: 17.3] [added: $] | [added: 19.5] | | [removed: 15.5] | [added: 17.3] | | [removed: 15.2] | [added: 15.5] | [added: |]
| Percentage change | [removed: 11.3] [added: 13.1] | [added: |] % | | [removed: 2.0] [added: 11.3] | % | | [removed: 3.2] [added: 2.0] | % |
| Daily sales impact of acquisitions | [removed: 1.0] [added: 0.4] | [added: |] % | | [removed: 0.6] [added: 1.0] | % | | [removed: 0.2] [added: 0.6] | % |
| [removed: Impact] [added: Daily sales impact] of currency fluctuations | 0.1 | [added: |] % | | [removed: \-0.4] [added: 0.1] | % | | [removed: \-1.2] [added: \-0.4] | % |
It is helpful to appreciate several aspects of our marketplace: (1) It's big.
Net sales increased $574.6, or 13.1%, in 2018 relative to 2017.
Both periods included discrete tax items, primarily related to the Tax Act.
Excluding these discrete items (a benefit of $7.1 in 2018 and a benefit of $24.4 in 2017), our net earnings in 2018 would have been $744.8, an increase of 34.4% when compared to 2017.
Further, our diluted net earnings per share would have been $2.59 in 2018 compared to $1.92 in 2017, an increase of 34.9%.
A portion of this increase relates to a lower tax rate in 2018 that is a feature of the Tax Act.
Sales growth in 2018 exceeded 20% through both our vending devices and our Onsite locations (excluding sales transferred from a branch).
The table below summarizes our total employee headcount, our investments in in-market locations (defined as the sum of the total number of public branch locations and the total number of active Onsite locations), and industrial vending devices at the end of the periods presented and the percentage change compared to the end of the prior period.
| In-market locations - absolute employee headcount | 14,015 | | | 13,424 | | | 4.4 | % |
| Total absolute employee headcount | 21,644 | | | 20,565 | | | 5.2 | % |
The increase in net sales noted above for 2018 was a result of higher unit sales and, to a lesser degree, higher prices.
Higher product prices were realized throughout 2018 as a result of actions (beginning initially in late 2017) taken to offset increases in product costs, and we believe these increases contributed 0.7% to 0.8% to growth for the year.
Price increases were not a material factor in 2017 or 2016.
For instance, the U.S. Purchasing Managers Index, published by the Institute for Supply Chain Management, averaged 58.8 in 2018 and 57.6 in 2017.
Readings above 50 are indicative of growing demand, and we believe the levels described above were consistent with favorable business conditions and consistent with an increase in our sales growth rates.
We signed 22,073 industrial vending devices during 2018, an increase of 14.0% over 2017.
In addition to an increase in our installed base, we achieved a low-single digit increase in average sales per device.
These variables combined to generate sales growth through our vending devices in excess of 20% in 2018.
We signed 336 new Onsite locations in 2018, an increase of 24.4% over 2017, and had 894 active sites on December 31, 2018, an increase of 47.8% over December 31, 2017.
We signed 152 new national account contracts in 2018.
The contribution of these new contracts and strong penetration of existing national account customers resulted in daily sales from our national account customers growing 18.1% in 2018 compared to 2017.
We experienced success with our growth initiatives in 2016, similar to 2017 and 2018; however, their impact to our net sales growth in 2016 was largely offset by a weaker economic environment.
| 2018 | 12.0 | % | | 14.8 | % | | 13.1 | % | | 13.4 | % | | 12.5 | % | | 13.5 | % | | 12.0 | % | | 13.7 | % | | 13.5 | % | | 12.4 | % | | 12.3 | % | | 14.5 | % |
| Benchmark | \-1.0 | % | | 1.1 | % | | 3.9 | % | | \-0.6 | % | | 2.1 | % | | 1.9 | % | | \-3.7 | % | | 4.0 | % | | 1.7 | % | | \-1.9 | % | | 8.6 | % |
| 2018 | \-1.3 | % | | 4.0 | % | | 2.1 | % | | 2.4 | % | | 0.6 | % | | 3.7 | % | | \-3.6 | % | | 3.8 | % | | 3.6 | % | | \-3.0 | % | | 13.9 | % |
| 18Delta | \-0.4 | % | | 2.9 | % | | \-1.9 | % | | 3.1 | % | | \-1.5 | % | | 1.9 | % | | 0.0 | % | | \-0.2 | % | | 1.9 | % | | \-1.2 | % | | 5.3 | % |
| 17Delta | 1.2 | % | | 0.4 | % | | \-0.4 | % | | 2.8 | % | | \-0.7 | % | | 1.0 | % | | 1.3 | % | | \-1.8 | % | | 2.1 | % | | \-0.3 | % | | 4.9 | % |
| 16Delta | 1.3 | % | | \-1.9 | % | | \-2.5 | % | | 2.3 | % | | \-1.5 | % | | \-2.0 | % | | 1.4 | % | | \-1.7 | % | | \-0.1 | % | | 1.0 | % | | \-5.1 | % |
| 2018 | 14.3 | % | | 13.3 | % | | 13.0 | % | | 13.3 | % | | 13.5 | % |
| 2018 | 11.8 | % | | 11.1 | % | | 10.8 | % | | 11.3 | % | | 11.2 | % |
| 2018 | 14.5 | % | | 14.8 | % | | 14.9 | % | | 14.6 | % | | 14.7 | % |
The non-fastener business has enjoyed superior growth in the strong 2018 and 2017 periods when compared to our fastener business and to the distribution industry in general.
Further, while not immune to the impact of a weak industrial environment as was experienced in 2016, our non-fastener business did demonstrate greater relative resilience when compared to our fastener business and to the distribution industry in general.
We believe this is due to both the growth of our vending business and our lower penetration of the non-fastener marketplace relative to our penetration of the fastener marketplace.
| 2018 | 11.7 | % | | 17.6 | % | | 19.2 | % | | 16.4 | % | | 16.3 | % |
In 2016, volatility and weakness in commodity markets, particularly energy, and lower industrial capital spending contributed to slower growth.
| 2018 | 48.7 | % | | 48.7 | % | | 48.1 | % | | 47.7 | % | | 48.3 | % |
Our fastener product line declined to 34.9% of sales in 2018 from 35.6% of sales in 2017.
Sales to our national account customers increased to 51.2% in 2018 from 48.7% of sales in 2017.
(2) Rising costs related to transporting products, particularly shipping fees, driver wages, and fuel, caused our freight expense to rise faster than sales, hurting our gross profit margin.
Net sales increased $428.5, or 10.8%, in 2017 relative to 2016.
Absent the impact of the Tax Act, our income tax expense for 2017 would have been approximately $318.8, or 36.5% of earnings before income taxes.
Income tax expense was $290.3 in 2016, or 36.8% of earnings before income taxes.
The table below summarizes our in-market location employee count and our total employee count at the end of the periods presented, and changes in that count from the end of the prior periods to the end of the most recent period.
The final four items below summarize our cumulative investments in branch locations, Onsite locations, total in-market locations, and industrial vending devices.
| End of period total in-market locations (1) - employee count | 13,424 | | | 12,966 | | | 3.5 | % |
| End of period total employee count | 20,565 | | | 19,624 | | | 4.8 | % |
(1) 'In-market locations' is defined as the sum of the total number of public branch locations and the total number of active Onsite locations.
Our total headcount at the end of 2017 includes 127 people related to our Mansco acquisition.
Price was not a material factor in the periods presented.
For instance, the Purchasing Managers Index, published by the Institute for Supply Chain Management, averaged 57.0, 55.8, 58.6, and 58.9 in the first, second, third, and fourth quarters of 2017, respectively, well above 49.8, 51.8, 51.2, and 53.3 in the first, second, third, and fourth quarters of 2016, respectively.
Readings above 50 are indicative of growing demand, and we believe this favorably influenced our unit sales.
As business conditions strengthen, they tend to lift our net sales growth rates as well.
During 2015, our business weakened compared to 2014.
This initially involved customers tied to the oil and gas sector, but expanded during the course of the year to include customers across additional industries and in geographic areas not typically associated with the oil and gas sector.
November and especially December experienced a greater frequency and duration of customer plant shutdowns than is typical of these holiday-affected periods.
Over time, this
| 2015 | 12.0 | % | | 8.6 | % | | 5.6 | % | | 6.1 | % | | 5.3 | % | | 3.7 | % | | 3.2 | % | | 1.6 | % | | \-0.3 | % | | \-0.8 | % | | \-1.1 | % | | \-3.8 | % |
| Benchmark | \-1.1 | % | | 0.9 | % | | 4.5 | % | | \-1.0 | % | | 1.9 | % | | 1.8 | % | | \-3.7 | % | | 3.8 | % | | 1.8 | % | | \-2.4 | % | | 7.6 | % |
| 17Delta | 1.3 | % | | 0.6 | % | | \-0.9 | % | | 3.1 | % | | \-0.5 | % | | 1.0 | % | | 1.3 | % | | \-1.6 | % | | 2.0 | % | | 0.3 | % | | 5.9 | % |
| 16Delta | 1.5 | % | | \-1.7 | % | | \-3.0 | % | | 2.7 | % | | \-1.3 | % | | \-1.9 | % | | 1.4 | % | | \-1.4 | % | | \-0.2 | % | | 1.5 | % | | \-4.0 | % |
| 2015 | \-3.6 | % | | \-0.1 | % | | 4.2 | % | | \-2.1 | % | | 3.4 | % | | 0.9 | % | | \-4.3 | % | | 4.1 | % | | \-0.9 | % | | \-2.0 | % | | 2.9 | % |
| 15Delta | \-2.5 | % | | \-1.0 | % | | \-0.4 | % | | \-1.1 | % | | 1.4 | % | | \-0.9 | % | | \-0.6 | % | | 0.3 | % | | \-2.7 | % | | 0.4 | % | | \-4.7 | % |
| 2015 | 8.2 | % | | 4.6 | % | | 1.6 | % | | \-2.5 | % | | 2.9 | % |
| 2015 | 5.5 | % | | 0.0 | % | | \-4.4 | % | | \-6.2 | % | | \-1.4 | % |
| 2015 | 11.7 | % | | 9.0 | % | | 5.9 | % | | 1.2 | % | | 6.8 | % |
The non-fastener business demonstrated greater relative resilience over the last several years, when compared to our fastener business and to the distribution industry in general, due to our industrial vending program.
However, this business was not immune to the impact of a weak industrial environment.
| 2015 | 10.1 | % | | 5.6 | % | | 0.1 | % | | \-2.6 | % | | 3.1 | % |
The volatility and weakness of energy prices weakened this business, particularly beginning in the second quarter of
2015 and throughout 2016.
| 2015 | 50.8 | % | | 50.3 | % | | 50.5 | % | | 49.9 | % | | 50.4 | % |
As a result, the decline in our fastener product line to 35.6% of sales in 2017 from 36.6% of sales in 2016 contributed to the decline in our gross profit margin.
This effect was exacerbated by relative growth in the period from sales of our OEM fasteners, which tend to have a lower gross profit margin than our MRO fasteners.
Sales to our national account customers increased to 48.7% in 2017 from 47.4% of sales in 2016, which contributed to the decline in our gross profit margin.
The second element of mix was driven by the acquisition of Mansco.
The primary contributor to this improvement was relatively modest growth in occupancy-related expenses.
Though our employee-related and selling transportation expenses grew more quickly than our occupancy expenses, they also contributed to this leverage in 2017.
| Selling transportation expenses | 5% | 8.1 | % | | 2.9 | % | | \-13.1 | % |
The slight increase in 2015, when compared to 2014, was caused by increases in full-time equivalent headcount and growth in our profit sharing contribution, primarily due to our expanding growth in operating income.
An excerpt. Shown here: 40 of 176 rewritten, 40 of 94 added and 40 of 85 removed. The counts are complete. For every sentence, read Item 7. MANAGEMENT'S DISCUSSION AND ANALYSIS OF FINANCIAL CONDITION AND RESULTS OF OPERATIONS in the FY2018 filing and the FY2017 filing.
Item 7A. QUANTITATIVE AND QUALITATIVE DISCLOSURES ABOUT MARKET RISKS
7 rewritten, 6 added, 1 removed, 12 unchanged
Foreign currency exchange rates – Foreign currency fluctuations can affect our net [removed: investments] [added: investments, our operations in countries other than the U.S.,] and earnings denominated in foreign currencies.
During 2017, we experienced some inflation in [removed: overall] [added: the cost of] steel [removed: pricing.][added: products.]
During the first half of 2016, we experienced some deflation in [added: the cost of] steel [removed: pricing.][added: products.]
[removed: Commodity energy prices –] We [removed: have market risk for changes in prices of gasoline, diesel fuel, natural gas, and electricity; however, this risk is] [added: believe that over time these risks are] mitigated in part by our ability to pass freight [added: and product] costs to our customers, the efficiency of our trucking distribution network, and the ability, over time, to manage our occupancy costs related to the heating and cooling of our facilities through better efficiency.
Interest rates - Loans under our Credit Facility bear interest at floating rates tied to [removed: LIBOR.][added: LIBOR (or, if LIBOR is no longer available, at a replacement rate to be determined by the administrative agent for the Credit Facility and consented to by us).]
A one percentage point increase in LIBOR in [removed: 2017] [added: 2018] would have resulted in approximately [removed: $2.8] [added: $3.0] of additional interest expense.
A description of our Credit Facility is contained in Note [removed: 10] [added: 9] of the Notes to Consolidated Financial Statements.
We have not historically hedged our foreign currency risk given that exposure to date has not been material.
During 2018, we experienced inflation in the cost of steel products.
Commodity energy prices – We have market risk for changes in prices of gasoline, diesel fuel, natural gas, and electricity.
Prices for these commodities began to ease late in the year, but for most of 2018, we saw rising costs for these commodities, and that resulted in increases in fuel costs for our hub and field-based vehicles and utility costs for our in-market locations, distribution centers, and manufacturing facilities.
Fossil fuels are also often a key feedstock for chemicals and plastics that comprise a key raw material for many products that we sell.
As a result, rising costs for these commodities in recent months are resulting in higher costs for many of these products.
In 2015, we noted some overall deflation in steel pricing.
Item 1. BUSINESS
91 rewritten, 52 added, 19 removed, 190 unchanged
The year end is December 31, [removed: 2017] [added: 2018] unless additional years are included or noted.
Over time, that mandate has expanded to a broader range of industrial and construction supplies [removed: that we break into twelve] [added: spanning more than nine major] product lines (described later in this document).
At the end of [removed: 2017,] [added: 2018,] we had [removed: 2,988] [added: 3,121] in-market locations (defined in the table below) in [removed: 24] [added: 26] countries supported by 14 distribution centers in North America (11 in the United States, two in Canada, and one in Mexico), and we employed [removed: 20,565] [added: 21,644] people.
| | [removed: 2017] [added: 2018] | | | [added: 2017 | |] 2016 | | 2015 | | 2014 | | 2013 | | 2012 | | 2011 | | 2010 | | 2009 | | [removed: 2008 | |]
| Net sales | $ | [added: 4,965.1 | |] 4,390.5 | | 3,962.0 | | 3,869.2 | | 3,733.5 | | 3,326.1 | | 3,133.6 | | 2,766.9 | | 2,269.5 | | 1,930.3 | | [removed: 2,340.4 | |]
| Public branches | [removed: 2,383] [added: 2,227] | | | [added: 2,383 | |] 2,503 | | 2,622 | | 2,637 | | 2,687 | | 2,652 | | 2,585 | | 2,490 | | 2,369 | | [removed: 2,311 | |]
| Onsite locations(1) | [removed: 605] [added: 894] | | | [added: 605 | |] 401 | | 264 | | 214 | | | | | | | | | | | | [removed: | |]
| Total in-market locations(2) | [removed: 2,988] [added: 3,121] | | | [added: 2,988 | |] 2,904 | | 2,886 | | 2,851 | | 2,687 | | 2,652 | | 2,585 | | 2,490 | | 2,369 | | [removed: 2,311 | |]
We currently have several versions of selling locations: (1) a 'traditional (or public) branch' services a wide variety of customers and stocks a wide selection of products we offer, (2) an 'overseas branch' focuses on manufacturing customers and our fastener product line and is the format we typically deploy outside the United States and Canada, (3) a 'strategic account branch' is a unique location that sells to multiple large accounts in a market, (4) a 'strategic account site' is similar to a strategic account branch, but typically operates out of an existing branch rather than from a unique location, and (5) an 'Onsite location' [removed: (defined as] [added: provides] dedicated sales and service [removed: provided] from within, or in close proximity [removed: to] [added: to,] the customer's [removed: facility).][added: facility.]
This model [removed: is] also [removed: beginning to represent] [added: represents] a meaningful portion of the company's total revenue, and we expect that share to grow materially over time.
As a result, we [removed: have begun to] refer to our network in terms of in-market locations, which includes our total branches and Onsite locations, and we [removed: began to] refer to strategic account sites as non-in-market locations.
We stock all [removed: new] branches with inventory drawn from all of our product lines, and over time, where appropriate, our district and branch personnel may tailor the inventory [removed: offering to the needs of the local customer base.]
[added: We have long] maintained that marketplace demographics could support a North American network of 3,500 traditional branches.
However, since establishing this figure, new growth drivers and business models (Onsite, vending, [removed: e-commerce)] [added: digital solutions)] have emerged and diminished the direct role of traditional branch openings in our growth.
However, in each year since 2013, the company has experienced a net decline in its total branch count including net declines of [removed: 15] [added: 156] branches in [removed: 2015, 119] [added: 2018, 120] branches in [removed: 2016,] [added: 2017,] and [removed: 120] [added: 119] branches in [removed: 2017.][added: 2016.]
| Opened branches | [removed: 27] [added: 2] | | [removed: 3] [added: 1] | | [removed: 5] [added: —] | | — | | [removed: 35] [added: 3] | | | — | | — | | — | | [removed: 4] [added: 8] | | [removed: 1] [added: —] | | [removed: 40] [added: 11] | |
| Converted branches(6) | [removed: (13] [added: (9] | ) | [removed: (2] [added: —] | [removed: )] | [removed: —] [added: (1] | [added: )] | — | | [removed: (15] [added: (10] | ) | | — | | — | | — | | — | | — | | [removed: (15] [added: (10] | ) |
(4) The Netherlands, Hungary, United Kingdom, Germany, Czech Republic, Italy, Romania, [removed: Poland,] Sweden, [added: Poland, Austria,] Ireland, [added: Spain,] and [removed: Switzerland][added: France]
In this model, [removed: the company services] [added: we service] a customer from a location that is physically within the customer's facility (or, in some cases, at a strategically placed off-site location), with inventory that is specific to the customer's needs.
In [removed: most] [added: many] cases, we are shifting revenue with the customer from an existing branch.
It has been our [removed: experience, however,] [added: experience] that [removed: while] gross profit [removed: margins] [added: percentages] at Onsite locations tend to be lower than at branches, [added: but] we gain significant revenue with the customer and our cost to serve is materially lower.
However, [removed: the company] [added: we] identified it as a growth driver in 2014 and [added: have] made substantial investments toward accelerating its traction in the marketplace [removed: beginning in] [added: since] 2015.
[removed: As a result, we] [added: We] have identified over 15,000 customer locations with potential to implement the Onsite service model.
[removed: These customers include those where we have a] [added: an existing] national account relationship today, as well as [removed: new] [added: potential] customers we [removed: know] [added: are aware] of due to our local market presence.
We experienced net increases of [removed: 50, 137,] [added: 289, 204,] and [removed: 204] [added: 137] Onsite locations in [removed: 2015, 2016, and] [added: 2018,] 2017, [added: and 2016,] respectively.
| Opened Onsite locations | | | [removed: 161] [added: 318] | |
| Closed Onsite locations | | | [removed: (24] [added: (29] | ) |
In [removed: 1997,] [added: 1995,] we developed a national accounts program aimed at making our products and services more competitive with customers that operate multiple facilities.
These customers tend to have more complex supply chains and structures for managing the [removed: MRO] [added: original equipment manufacturing (OEM)] and [removed: OEM] [added: maintenance, repair, and operations (MRO)] products we provide while at the same time, by virtue of their size and opportunity, have more negotiating power.
We believe our advantage with these customers has only been strengthened as we have added other channels, such as industrial vending, Onsite, [removed: and] Fastenal Managed Inventory ('FMI®'), [added: digital solutions,] and resources to serve these customers' unique demands.
As a result, in [removed: 2017,] [added: 2018,] national accounts represented [removed: 48.7%] [added: 51.2%] of our net sales, compared to [removed: 47.4%] [added: 48.7%] and [removed: 46.4%] [added: 47.4%] in [removed: 2016] [added: 2017] and [removed: 2015,] [added: 2016,] respectively.
For these reasons, the initiative began to gain significant traction in 2011 and we finished [removed: 2017] [added: 2018] with over [removed: 86,000] [added: 96,000] devices in the field [removed: (71,000] [added: (81,000] generating product revenue and 15,000 in a locker lease program).
Our discussion generally focuses on the [removed: 71,000] [added: 81,000] product revenue devices.
| [removed: Device count signed during the period] | 2017 | | 5,437 | | | 4,881 | | | 4,771 | | | 4,266 | | | 19,355 | |
| [removed: 'Machine equivalent' count signed during the period] | 2017 | | 4,476 | | | 4,032 | | | 4,010 | | | 3,640 | | | 16,158 | |
| [removed: Device count installed at the end of the period] | 2017 | | 64,430 | | | 66,577 | | | 69,058 | | | 71,421 | | | |
| [removed: 'Machine equivalent' count installed at the end of the] | 2017 | | 49,921 | | | 51,950 | | | 54,215 | | | 56,436 | | | |
| [removed: period] | 2016 | | 43,329 | | | 44,707 | | | 46,399 | | | 48,399 | | | |
In addition to industrial vending noted above, which primarily relates to our non-fastener business, we also provide Fastenal Managed Inventory ('FMI') programs, (also known as 'keep fill' or [removed: bin stock] [added: 'bin stock'] programs in the industry) to numerous customers.
However, the device is typically an open bin which is clustered with other bins in a racking system, each of which holds OEM fasteners, MRO fasteners, and/or non-fastener products that are consumed in the [removed: customers'] [added: customer's] operations.
In 2018, roughly 54% of our sales and 52% of our branches were in major Metropolitan Statistical Areas ('MSAs'; populations greater than 500,000 people), while 19% of our sales and 16% of our branches were in small MSAs (populations under 500,000 people), and 27% of our sales and 32% of our branches were not in a MSA.
offering to the needs of the local customer base.
We first went international when we opened a branch in Canada in 1994.
Since then, we have continued to expand our global footprint and at the end of 2018, we operated in 25 countries outside of the United States.
Canada and Mexico are the largest of these, representing approximately 11% of total sales collectively, and we also operate in Europe, Asia, Southeast Asia, and Central and South America.
This remaining international business is approximately 3% of total sales.
Our go-to-market strategy in countries outside of North America, focuses primarily on servicing large, national account customers.
From a product perspective, these customers are more heavily oriented toward planned fastener spend.
Though in recent years the international business has been growing faster than the U.S. business, we are not as well recognized in many of our foreign locations as we are in the U.S. and, to a lesser extent, Canada.
However, our ability to provide a consistent service model, including vending, bin stocks, and Onsites, on a global basis is attractive to our foreign customer base, much of which are the foreign operations of U.S.-based companies.
Our international subsidiaries now have over 450 in-market locations, including over 150 Onsite locations, have over 9,600 vending devices installed, and employ over 3,300 people from around the world.
| Closed branches | (145 | ) | (10 | ) | — | | — | | (155 | ) | | — | | — | | — | | — | | (2 | ) | (157 | ) |
| Total as of December 31, 2018 | 1,924 | | 186 | | 52 | | 8 | | 2,170 | | | 6 | | 7 | | 7 | | 37 | | — | | 2,227 | |
These include customers with which we have
We had 894 Onsite locations as of December 31, 2018, and anticipate signing 375 to 400 new Onsite locations in 2019.
| Total as of December 31, 2018 | 336 | | 894 | |
We anticipate signing 23,000 to 25,000 new devices in 2019.
Our industrial vending portfolio consists of 23 different vending devices, with 15 of these being in either a helix or locker format.
Our most utilized models include the helix-based FAST 5000, which is approximately 40% of our installed base of devices, and our 12- and 18-door lockers, which combined are approximately 35% of our installed base of devices.
The lockers are available in multiple configurations and the helix format is configurable to accommodate the various sizes and forms of products that will be dispensed to match the unique needs of our customer.
Target monthly revenues per device typically range from under $1,000 to in excess of $3,000, depending on the type of device and products dispensed.
| Device count signed during the period | 2018 | | 5,679 | | | 5,537 | | | 5,877 | | | 4,980 | | | 22,073 | |
| 'Machine equivalent' count signed during the period | 2018 | | 5,271 | | | 5,250 | | | 5,251 | | | 4,610 | | | 20,382 | |
| Device count installed at the end of the period | 2018 | | 73,561 | | | 76,069 | | | 78,706 | | | 81,137 | | | |
| 'Machine equivalent' count installed at the end of the period | 2018 | | 58,571 | | | 61,405 | | | 64,205 | | | 66,784 | | | |
We believe our fully integrated distribution network allows us to manage the supply chain for all sizes of customers.
We also invest in digital solutions that aim to deliver strategic value for our customers, leverage local inventory for same-day solutions, and provide efficient service.
These solutions take many forms.
For instance, the above noted technologies (vending and FMI), provide locational data that we can utilize to provide strategic value to our customers.
An example of this is FAST 360, which surfaces data around our managed services, providing our customers with one central source of information as we manage their OEM and MRO products.
We also provide eProcurement Solutions (Electronic Data Interface, or 'EDI' and 'punchouts').
These provide system-to-system exchange of documents (such as purchase orders, advance shipping notices, and invoices for direct and indirect spend) through a direct integration into our customer's Enterprise Resource Planning (ERP) systems or through a third party procurement network or marketplace.
This creates an efficient, accurate, and streamlined procure-to-pay process.
We also have an e-commerce offering that allows us to provide same-day solutions for online orders.
We believe our integrated physical and virtual model, when paired with our national (and increasingly international) scope, represents a unique capability in industrial distribution when compared to e-commerce as an independent sales channel.
One of our web solutions, Fastenal EXPRESS, guides our customers to products that are locally stocked, capitalizing on our existing location footprint, in order to provide same-day service for online orders.
This positions us to outperform what is more typically a 24 to 48 hour fulfillment expectation for MRO and unplanned transactions.
We expect to continue to build out and develop our digital solutions over time.
as selling (in-market and otherwise) and non-selling (engineering, product specialists, manufacturing, etc.) employees, we offer a range of capabilities that is difficult for large and small competitors to replicate.
as from our distribution centers to our branch, Onsite, and customer locations.
We have long
There is one branch subset, overseas, that we anticipate expanding in the future.
Selling locations outside of the United States and Canada contributed approximately 7% of our consolidated net sales in 2017, with approximately 4% and 3% of this amount attributable to our Mexican and 'rest-of-world' operations, respectively.
| Total as of December 31, 2015 | 2,320 | | 200 | | 47 | | 8 | | 2,575 | | | 9 | | 10 | | 7 | | 20 | | 1 | | 2,622 | |
| Closed branches | (140 | ) | (3 | ) | — | | — | | (143 | ) | | (1 | ) | — | | — | | — | | — | | (144 | ) |
We currently have over 600 Onsite locations and we believe we will have 1,000 Onsite locations in the next 12 to 18 months.
| Total as of December 31, 2015 | 80 | | 264 | |
We believe we will have 100,000 total devices deployed in the next 12 to 18 months.
Our expanded industrial vending portfolio consists of 23 different vending devices, with the FAST 5000 device, our helix-based machine, representing approximately 40% of the installed product revenue devices.
We have learned much about these devices over the last several years and currently the target monthly revenue ranges from under $1,000 per device to in excess of $3,000 per device.
| | 2015 | | 3,962 | | | 5,144 | | | 4,689 | | | 4,016 | | | 17,811 | |
| | 2015 | | 2,916 | | | 3,931 | | | 3,769 | | | 3,319 | | | 13,935 | |
| | 2015 | | 48,545 | | | 50,620 | | | 53,547 | | | 55,510 | | | |
| | 2015 | | 35,997 | | | 37,714 | | | 40,067 | | | 41,905 | | | |
The computer system monitors the inventory
Geographic Information
Information regarding our revenues and long-lived assets by geographic location is set forth in Note 8 of the Notes to Consolidated Financial Statements included later in this Form 10-K.
Our ability to procure products overseas at competitive prices, as well as net sales at our foreign locations, could be impacted by foreign currency fluctuations, changes in trade relations, or fluctuations in the relative strength of foreign economies.
| | 2017 | | 2016 | |
An excerpt. Shown here: 40 of 91 rewritten, 40 of 52 added and all 19 removed. The counts are complete. For every sentence, read Item 1. BUSINESS in the FY2018 filing and the FY2017 filing.
Item 3. LEGAL PROCEEDINGS
1 rewritten, 0 added, 0 removed, 2 unchanged
A description of our legal proceedings, if any, is contained in Note [removed: 11] [added: 10] of the Notes to Consolidated Financial Statements.
Cover and table of contents
32 rewritten, 5 added, 5 removed, 81 unchanged
| | For the fiscal year ended December 31, [removed: 2017] [added: 2018] |
Indicate by check mark whether the registrant has submitted electronically [removed: and posted on its corporate Web site, if any,] every Interactive Data File required to be submitted [removed: and posted] pursuant to Rule 405 of Regulation S-T (§ 232.405 of this chapter) during the preceding 12 months (or for such shorter period that the registrant was required to submit [removed: and post] such files).
Indicate by check mark if disclosure of delinquent filers pursuant to Item 405 of Regulation S-K is not contained herein, and will not be contained, to the best of the registrant's knowledge, in definitive proxy or information statements incorporated by reference in Part III of this Form 10-K or any amendment to this Form 10-K. [removed: o][added: x]
| Non-accelerated Filer | o [removed: (Do not check if a smaller reporting company)] | Smaller Reporting Company | o |
The aggregate market value of the Common Stock held by non-affiliates of the registrant as of June 30, [removed: 2017,] [added: 2018,] the last business day of the registrant's most recently completed second fiscal quarter, was [removed: $12,488,792,738,] [added: $13,762,835,828,] based on the closing sale price of the Common Stock on that date.
For purposes of determining this number, all executive officers and directors of the registrant as of June 30, [removed: 2017] [added: 2018] are considered to be affiliates of the registrant.
As of January [removed: 19, 2018,] [added: 18, 2019,] the registrant had [removed: 287,603,912] [added: 285,931,529] shares of Common Stock issued and outstanding.
| Item 1. | | [removed: [Business](#s5726133DA9984B3664D91A8B513C4B5D)] [added: [Business](#s2669C0BFB01456518CE7633D8CE70BAA)] | [removed: [3](#s5726133DA9984B3664D91A8B513C4B5D)] [added: [3](#s2669C0BFB01456518CE7633D8CE70BAA)] |
| Item 1A. | | [Risk [removed: Factors](#s251FFD2EE50E466A65E21A8B51E83FD7)] [added: Factors](#s0DFEFB2C1C42516A8C64F89B50D9E1AC)] | [removed: [11](#s251FFD2EE50E466A65E21A8B51E83FD7)] [added: [12](#s0DFEFB2C1C42516A8C64F89B50D9E1AC)] |
| Item 1B. | | [Unresolved Staff [removed: Comments](#s8C5428F6898F8715CEA61A8B51E982C6)] [added: Comments](#s40BE532A4C145378BB94788DD28F3D10)] | [removed: [16](#s8C5428F6898F8715CEA61A8B51E982C6)] [added: [17](#s40BE532A4C145378BB94788DD28F3D10)] |
| Item 2. | | [removed: [Properties](#s07C42033B57E5F5A42FF1A8B51F03A57)] [added: [Properties](#s171344A15F77532DA0BD1A90035C214B)] | [removed: [17](#s07C42033B57E5F5A42FF1A8B51F03A57)] [added: [18](#s171344A15F77532DA0BD1A90035C214B)] |
| Item 3. | | [Legal [removed: Proceedings](#sCE93D0F9EFFBE4A655291A8B520E9AA0)] [added: Proceedings](#s628EB9E89C6C5CCE8FB5E0CE7AF5B9B1)] | [removed: [18](#sCE93D0F9EFFBE4A655291A8B520E9AA0)] [added: [19](#s628EB9E89C6C5CCE8FB5E0CE7AF5B9B1)] |
| Item 4. | | [Mine Safety [removed: Disclosures](#sFA57A4D0C3AA16888CD91A8B52139289)] [added: Disclosures](#s8AD0A7312D8F5A74A6A5341C9B9AFA0F)] | [removed: [18](#sFA57A4D0C3AA16888CD91A8B52139289)] [added: [19](#s8AD0A7312D8F5A74A6A5341C9B9AFA0F)] |
| Item 5. | | [Market for Registrant's Common Equity, Related Stockholder Matters, and Issuer Purchases of Equity [removed: Securities](#s84E0A107A7E73C13E5861A8B498C2253)] [added: Securities](#s70CBBE0ACB075FF78B5FEB1514215552)] | [removed: [19](#s84E0A107A7E73C13E5861A8B498C2253)] [added: [20](#s70CBBE0ACB075FF78B5FEB1514215552)] |
| Item 6. | | [Selected Financial [removed: Data](#sBA8FAEA72D472459C2A71A8B5289524C)] [added: Data](#s8B2059C4531851C987E2D52E6C8F6309)] | [removed: [20](#sBA8FAEA72D472459C2A71A8B5289524C)] [added: [21](#s8B2059C4531851C987E2D52E6C8F6309)] |
| Item 7. | | [Management's Discussion and Analysis of Financial Condition and Results of [removed: Operations](#s41276F05A43684A5CCBA1A8B52AAD9CB)] [added: Operations](#sB8235ABF7BE35B7AB604697928B85B33)] | [removed: [21](#s41276F05A43684A5CCBA1A8B52AAD9CB)] [added: [22](#sB8235ABF7BE35B7AB604697928B85B33)] |
| Item 7A. | | [Quantitative and Qualitative Disclosures About Market [removed: Risks](#s1E173806AC64043D0AE11A8B54D1095B)] [added: Risks](#sF1A69200DE8150CE8BC134AF67579234)] | [removed: [34](#s1E173806AC64043D0AE11A8B54D1095B)] [added: [36](#sF1A69200DE8150CE8BC134AF67579234)] |
| Item 8. | | [Financial Statements and Supplementary [removed: Data](#s81CCB359570DF7210A491A8B498C2B11)] [added: Data](#s6F578DF53E4A5C7A99ABE80673D0D961)] | [removed: [35](#s81CCB359570DF7210A491A8B498C2B11)] [added: [37](#s6F578DF53E4A5C7A99ABE80673D0D961)] |
| Item 9. | | [Changes in and Disagreements with Accountants on Accounting and Financial [removed: Disclosure](#sE4195182D81D4940583C1A8B593CD420)] [added: Disclosure](#s8BF685C86AC75304812E5C16BE5DEB1B)] | [removed: [56](#sE4195182D81D4940583C1A8B593CD420)] [added: [56](#s8BF685C86AC75304812E5C16BE5DEB1B)] |
| Item 9A. | | [Controls and [removed: Procedures](#sCCA9AE9415A91FBEC9FA1A8B595F1AA2)] [added: Procedures](#s1CDA63DAD9C45C858B13EE795FB06D5E)] | [removed: [56](#sCCA9AE9415A91FBEC9FA1A8B595F1AA2)] [added: [56](#s1CDA63DAD9C45C858B13EE795FB06D5E)] |
| Item 9B. | | [Other [removed: Information](#s5426E46B207A29D94CDC1A8B5980E357)] [added: Information](#s83FC34FED63C57F8B3B5F38401C88C84)] | [removed: [57](#s5426E46B207A29D94CDC1A8B5980E357)] [added: [57](#s83FC34FED63C57F8B3B5F38401C88C84)] |
| | | [PART [removed: III](#s83C9D0D2C2B5825181EE1A8B59DE1764)] [added: III](#s26727444BC8755DE8D9E17F127F4F029)] | |
| Item 10. | | [Directors, Executive Officers, and Corporate [removed: Governance](#s4B48ACF31C1BB07FA6801A8B59E1BE99)] [added: Governance](#s2F94D33E1990567DBD59A071FD995D26)] | [removed: [58](#s4B48ACF31C1BB07FA6801A8B59E1BE99)] [added: [57](#s2F94D33E1990567DBD59A071FD995D26)] |
| Item 11. | | [Executive [removed: Compensation](#s2E215993B7D37BCA7FE51A8B5A13DF9A)] [added: Compensation](#s1EF00BCDC03F5322A87A11EE68B29A3B)] | [removed: [60](#s2E215993B7D37BCA7FE51A8B5A13DF9A)] [added: [59](#s1EF00BCDC03F5322A87A11EE68B29A3B)] |
| Item 12. | | [Security Ownership of Certain Beneficial Owners and Management and Related Stockholder [removed: Matters](#sAEBCEE57708783B4ED2C1A8B5A2871BE)] [added: Matters](#sFAE260FCC0C35EDA91D4145DA21F453F)] | [removed: [60](#sAEBCEE57708783B4ED2C1A8B5A2871BE)] [added: [59](#sFAE260FCC0C35EDA91D4145DA21F453F)] |
| Item 13. | | [Certain Relationships and Related Transactions, and Director [removed: Independence](#sABADCAC6DDD803BEFBD81A8B5A833C43)] [added: Independence](#sFAFBECC2245B556EAA4B4DA4681BAA60)] | [removed: [60](#sABADCAC6DDD803BEFBD81A8B5A833C43)] [added: [59](#sFAFBECC2245B556EAA4B4DA4681BAA60)] |
| Item 14. | | [Principal Accountant Fees and [removed: Services](#s39E4728F443ACF2939341A8B5A872A9B)] [added: Services](#s3F124D88C0275FB9AEF9CED0A32FE983)] | [removed: [60](#s39E4728F443ACF2939341A8B5A872A9B)] [added: [59](#s3F124D88C0275FB9AEF9CED0A32FE983)] |
| Item 15. | | [Exhibits and Financial Statement [removed: Schedules](#sE62475C597E7B1AB8E1F1A8B4B65F975)] [added: Schedules](#s70388B1A23F15F56BEFC3BA3668537A4)] | [removed: [61](#sE62475C597E7B1AB8E1F1A8B4B65F975)] [added: [60](#s70388B1A23F15F56BEFC3BA3668537A4)] |
| Item 16. | | [Form 10-K [removed: Summary](#s5148ECABDDFDFAA839811A8B5B01A091)] [added: Summary](#s742F8A3A66D851C1BBBECCDBBF762BAA)] | [removed: [62](#s5148ECABDDFDFAA839811A8B5B01A091)] [added: [61](#s742F8A3A66D851C1BBBECCDBBF762BAA)] |
Portions of our Proxy Statement for the annual meeting of shareholders to be held Tuesday, April [removed: 24, 2018] [added: 23, 2019] ('Proxy Statement') are incorporated by reference in Part III.
Portions of our [removed: 2017] [added: 2018] Annual Report to Shareholders are incorporated by reference in Part II.
Factors that could cause our actual results to differ from those discussed in the forward-looking statements include, but are not limited to, economic downturns, weakness in the manufacturing or commercial construction industries, competitive pressure on selling prices, changes in [added: trade policies or tariffs, changes in] our current mix of products, customers, or geographic locations, changes in our average branch size, changes in our purchasing patterns, changes in customer needs, changes in fuel or commodity prices, inclement weather, changes in foreign currency exchange rates, difficulty in adapting our business model to different foreign business environments, failure to accurately predict the market potential of our business strategies, the introduction or expansion of new business strategies, [removed: weak acceptance or adoption of our vending or Onsite business models,] increased competition in industrial vending or Onsite, difficulty in maintaining installation quality as our industrial vending business expands, the leasing to customers of a significant number of additional industrial vending devices, the failure to meet our goals and expectations regarding branch openings, branch closings, or expansion of our industrial vending or Onsite operations, changes in the implementation objectives of our business strategies, difficulty in hiring, relocating, training, or retaining qualified personnel, difficulty in controlling operating expenses, difficulty in collecting receivables or accurately predicting future inventory needs, dramatic changes in sales trends, changes in supplier production lead times, changes in our cash position or our need to make capital expenditures, credit market volatility, changes in tax law or the impact of any such changes on future tax rates, changes in the availability or price of commercial real estate, changes in the nature, price, or availability of distribution, supply chain, or other technology (including software licensed from third parties) and services related to that technology, cyber-security incidents, potential liability and reputational damage that can arise if our products are defective, and other risks and uncertainties detailed in this Form 10-K under the heading 'Item 1A.
10-K 1 fast1231201810-k.htm 10-K
| | | [PART I](#sF84F0C863B1B502191FB02D1307A66E9) | |
| | | [PART II](#s391E78E2C0DE5ED3AE194B8C2543E64B) | |
| | | [PART IV](#s6668F7DF923953A1B321B3857B0A9000) | |
| | | [Signatures](#sE744A69B28F6585E98E341DA36B54F0A) | [63](#sE744A69B28F6585E98E341DA36B54F0A) |
10-K 1 fast1231201710-k.htm 10-K
| | | [PART I](#s5C433A2B3398CCAB1AF21A8B511F23E5) | |
| | | [PART II](#s79BCBCE8DA162DB324BC1A8B52368572) | |
| | | [PART IV](#s0148EFB858663F76587B1A8B5AADC6B0) | |
| | | [Signatures](#sF20DFDE1529DFC48FC491A8B5B602F5B) | [64](#sF20DFDE1529DFC48FC491A8B5B602F5B) |
Item 2. PROPERTIES
8 rewritten, 9 added, 2 removed, 51 unchanged
Note – Information in this section is as of December 31, [removed: 2017,] [added: 2018,] unless otherwise noted.
| Distribution center and home office [added: (2)] | | 246,000 | | | 259,000 | |
| Distribution center | Kansas City, Kansas | [removed: —] [added: 170,000] | | [removed: (4)] | 300,000 | |
(2) This property contains an ASRS with capacity of 52,000 pallet locations, in addition to the 561,000 tote locations for small [removed: parts noted above;] [added: parts;] 105,000 of these small part tote locations are located in the industrial vending automated replenishment facility, which is also located on this property.
(3) This facility contains an ASRS with capacity of 14,000 pallet locations, in addition to the 41,000 tote locations for small [removed: parts noted above.][added: parts.]
[removed: (4)] [added: (6)] Construction of [removed: an ASRS] [added: a new distribution center in Mississippi] began in [removed: 2017 at our Kansas distribution center,] [added: 2018,] and we expect this project to be [removed: completed] [added: complete] in the [removed: first] [added: third] quarter of [removed: 2018.][added: 2019.]
In addition, we own [removed: 179] [added: 172] buildings that house our in-market locations in various cities throughout North America.
(1) We currently own land in the Seattle, Washington area for the construction of a new distribution center, which [removed: is scheduled to begin] [added: began] in 2018, and when completed, will replace the current leased facility.
| Customer support center | | | | | 100,000 | |
(2) During 2018, we acquired land for future expansion of our home office.
| Distribution center (4) | Seattle, Washington | — | | | — | |
| Distribution center (5) | High Point, North Carolina | — | | | 350,000 | |
| Distribution center (6) | Jackson, Mississippi | — | | | — | |
(4) Construction of a new distribution center in Washington, which will include ASRS technology, began in 2018 and we expect this to be completed in the fourth quarter of 2019.
(5) In late December 2018, we purchased an additional distribution center in High Point, North Carolina with approximately 750,000 total square feet.
Approximately 400,000 square feet will continue to be leased by the previous owner for three years.
We began utilizing approximately 350,000 square feet for distribution activities in early 2019.
| Supplemental warehouse, office, and potential branch space | | | | | 100,000 | |
This facility will contain approximately 170,000 tote locations.
Item 5. MARKET FOR REGISTRANT'S COMMON EQUITY, RELATED STOCKHOLDER MATTERS, AND ISSUER PURCHASES OF EQUITY SECURITIES
12 rewritten, 8 added, 27 removed, 14 unchanged
As of January [removed: 19, 2018,] [added: 18, 2019,] there were approximately 1,100 record holders of our common stock, which includes nominees or broker dealers holding stock on behalf of an estimated [removed: 220,000] [added: 283,000] beneficial owners.
The table below sets forth information regarding purchases of our common stock during each of the last three months of [removed: 2017:][added: 2018:]
| Period | Total Number of Shares Purchased | | Average Price Paid per Share | | | [added: |] Total Number of Shares Purchased as Part of Publicly Announced Plans or Programs (1) | | Maximum Number (or Approximate Dollar Value) of Shares that May Yet Be Purchased Under the Plans or Programs (1) |
| November 1-30, [removed: 2017] [added: 2018] | 0 | | [removed: $0.00] [added: —] | | | [added: |] 0 | | [removed: 4,400,000] [added: 2,400,000] |
| December 1-31, [removed: 2017] [added: 2018] | 0 | | [removed: $0.00] [added: —] | | | [added: |] 0 | | [removed: 4,400,000] [added: 2,400,000] |
| Total | [removed: 0] [added: 1,200,000] | | [removed: $0.00] [added: $52.16] | | | [added: |] 0 | | [removed: 4,400,000] [added: 2,400,000] |
As of December 31, [removed: 2017,] [added: 2018,] we had remaining authority to repurchase [removed: 4,400,000] [added: 2,400,000] shares under this authorization.
Purchases of shares of our common stock throughout [removed: 2017] [added: 2018] are described later in this Form 10-K under the heading 'Item 7.
Set forth below is a graph comparing, for the five years ended December 31, [removed: 2017,] [added: 2018,] the yearly cumulative total shareholder return on our common stock with the yearly cumulative total shareholder return of the S&P 500 Index and the Dow Jones US Industrial Suppliers Index.
The comparison of total shareholder returns in the performance graph assumes that $100 was invested on December 31, [removed: 2012] [added: 2013] in Fastenal Company, the S&P 500 Index, and the Dow Jones US Industrial Suppliers Index, and that dividends were reinvested when and as paid.
[removed: 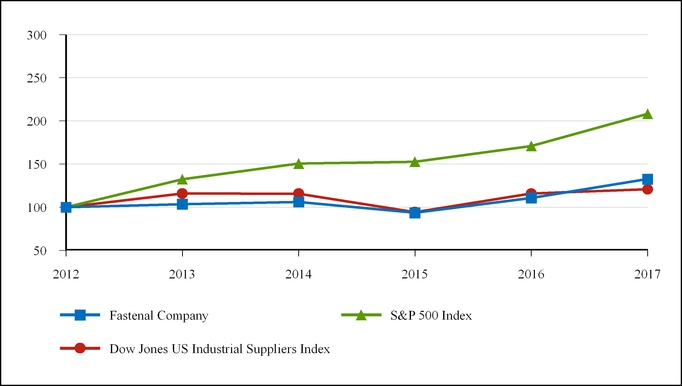][added: 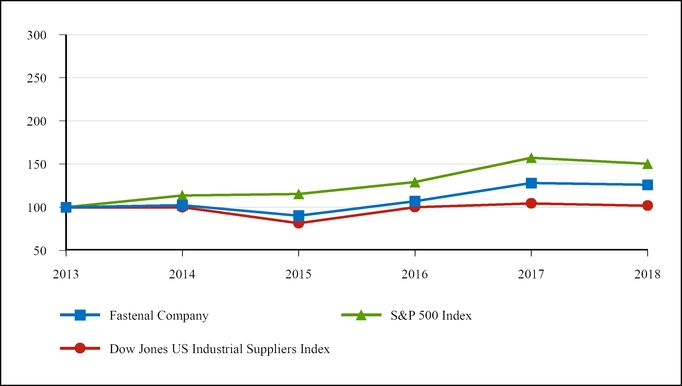]
| | | [removed: 2012 | |] 2013 | | 2014 | | 2015 | | 2016 | | 2017 | [added: | 2018 |]
| | | | | | | | | | |
| --- | --- | --- | --- | --- | --- | --- | --- | --- | --- |
| | | | | | | | | | |
| | (a) | | (b) | | | | (c) | | (d) |
| October 1-31, 2018 | 1,200,000 | | $52.16 | | | | 0 | | 2,400,000 |
| Fastenal Company | $ | 100.00 | | 102.36 | | 90.26 | | 106.97 | | 128.01 | | 126.01 |
| S&P 500 Index | | 100.00 | | 113.69 | | 115.26 | | 129.05 | | 157.22 | | 150.33 |
| Dow Jones US Industrial Suppliers Index | | 100.00 | | 99.94 | | 81.47 | | 100.08 | | 104.35 | | 101.83 |
The following table sets forth, by quarter, the high and low closing sale price(1) of our shares on The Nasdaq Stock Market for 2017 and 2016.
| | | | | | | | | | | | | | | | | | |
| --- | --- | --- | --- | --- | --- | --- | --- | --- | --- | --- | --- | --- | --- | --- | --- | --- | --- |
| 2017 | High | | | | Low | | | | 2016 | | High | | | | Low | | |
| First quarter | $ | 52.22 | | | $ | 46.17 | | | First quarter | | $ | 49.87 | | | $ | 36.53 | |
| Second quarter | 51.76 | | | | 42.10 | | | | Second quarter | | 48.93 | | | | 42.70 | | |
| Third quarter | 45.73 | | | | 39.97 | | | | Third quarter | | 45.36 | | | | 39.92 | | |
| Fourth quarter | 55.14 | | | | 44.51 | | | | Fourth quarter | | 49.17 | | | | 38.16 | | |
(1) The closing sale price was obtained from Shareholder.com, a division of Nasdaq OMX.
The following table sets forth our dividend payout (on a per share basis) in each of the last two years:
| | | | | | | | |
| --- | --- | --- | --- | --- | --- | --- | --- |
| | 2017 | | | | 2016 | | |
| First quarter | $ | 0.32 | | | $ | 0.30 | |
| Second quarter | 0.32 | | | | 0.30 | | |
| Third quarter | 0.32 | | | | 0.30 | | |
| Fourth quarter | 0.32 | | | | 0.30 | | |
| Total | $ | 1.28 | | | $ | 1.20 | |
On January 16, 2018, we announced a quarterly dividend of $0.37 per share to be paid on February 27, 2018 to shareholders of record at the close of business on January 31, 2018.
Our board of directors intends to continue paying quarterly dividends, provided that any future determination as to payment of dividends will depend upon the financial condition and results of operations of the company and such other factors as are deemed relevant by the board of directors.
| | | | | | | | | |
| --- | --- | --- | --- | --- | --- | --- | --- | --- |
| | (a) | | (b) | | | (c) | | (d) |
| October 1-31, 2017 | 0 | | $0.00 | | | 0 | | 4,400,000 |
| Fastenal Company | $ | 100.00 | | 103.56 | | 106.00 | | 93.47 | | 110.78 | | 132.57 |
| S&P 500 Index | | 100.00 | | 132.39 | | 150.51 | | 152.59 | | 170.84 | | 208.14 |
| Dow Jones US Industrial Suppliers Index | | 100.00 | | 115.76 | | 115.70 | | 94.31 | | 115.86 | | 120.80 |
Item 6. SELECTED FINANCIAL DATA
1 rewritten, 0 added, 0 removed, 3 unchanged
Incorporated herein by reference is Ten-Year Selected Financial Data on pages 4 and 5 of Fastenal's [removed: 2017] [added: 2018] Annual Report to Shareholders of which this Form 10-K forms a part, a portion of which is filed as Exhibit 13 to this annual report on
Item 8. FINANCIAL STATEMENTS AND SUPPLEMENTARY DATA
214 rewritten, 138 added, 137 removed, 385 unchanged
We have audited the accompanying consolidated balance sheets of Fastenal Company and subsidiaries (the 'Company') as of December 31, [removed: 2017] [added: 2018] and [removed: 2016,] [added: 2017,] the related consolidated statements of earnings, comprehensive income, stockholders’ equity, and cash flows for each of the years in the three-year period ended December 31, [removed: 2017,] [added: 2018,] and the related notes and financial statement schedule listed in the table of contents at Item 15 (collectively, the 'consolidated financial statements').
We also have audited the Company's internal control over financial reporting as of December 31, [removed: 2017,] [added: 2018,] based on criteria established in Internal Control - Integrated Framework (2013) issued by the Committee of Sponsoring Organizations of the Treadway Commission.
In our opinion, the consolidated financial statements referred to above present fairly, in all material respects, the financial position of the Company as of December 31, [removed: 2017] [added: 2018] and [removed: 2016,] [added: 2017,] and the results of its operations and its cash flows for each of the years in the three-year period ended December 31, [removed: 2017,] [added: 2018,] in conformity with U.S. generally accepted accounting principles.
Also in our opinion, the Company maintained, in all material respects, effective internal control over financial reporting as of December 31, [removed: 2017,] [added: 2018,] based on criteria established in Internal Control - Integrated Framework (2013) issued by the Committee of Sponsoring Organizations of the Treadway Commission.
Basis for [removed: Opinion][added: Opinions]
| | [removed: 2017] [added: 2018] | | | | [added: 2017 | | |] 2016 | |
| Cash and cash equivalents | $ | [removed: 116.9] [added: 167.2] | | | [removed: 112.7] [added: 116.9] | |
| Trade accounts receivable, net of allowance for doubtful accounts of [removed: $11.9] [added: $12.8] and [removed: $11.2,] [added: $11.9,] respectively | [removed: 607.8] [added: 714.3] | | | | [removed: 499.7] [added: 607.8] | |
| Inventories | [removed: 1,092.9] [added: 1,278.7] | | | | [removed: 993.0] [added: 1,092.9] | |
| Prepaid income taxes | [removed: —] [added: 9.0] | | | | [removed: 12.9] [added: —] | |
| Other current assets | [removed: 118.1] [added: 147.0] | | | | [removed: 102.5] [added: 118.1] | |
| Total current assets | [removed: 1,935.7] [added: 2,316.2] | | | | [removed: 1,720.8] [added: 1,935.7] | |
| Property and equipment, net | [removed: 893.6] [added: 924.8] | | | | [removed: 899.7] [added: 893.6] | |
| Other assets | [removed: 81.2] [added: 80.5] | | | | [removed: 48.4] [added: 81.2] | |
| Total assets | $ | [removed: 2,910.5] [added: 3,321.5] | | | [removed: 2,668.9] [added: 2,910.5] | |
| Current portion of debt | $ | 3.0 | | | [removed: 10.5] [added: 3.0] | |
| Accounts payable | [removed: 147.5] [added: 193.6] | | | | [removed: 108.8] [added: 147.5] | |
| Accrued expenses | [removed: 194.0] [added: 240.8] | | | | [removed: 156.4] [added: 194.0] | |
| Income taxes payable | [removed: 6.5] [added: —] | | | | [removed: —] [added: 6.5] | |
| Total current liabilities | [removed: 351.0] [added: 437.4] | | | | [removed: 275.7] [added: 351.0] | |
| Long-term debt | [removed: 412.0] [added: 497.0] | | | | [removed: 379.5] [added: 412.0] | |
| Deferred income tax liabilities | [removed: 50.6] [added: $] | [added: (79.1] | [added: )] | | [removed: 80.6] [added: (50.6] | [added: )] |
| Commitments and contingencies (Notes 5, [added: 8,] 9, [removed: 10,] and [removed: 11)] [added: 10)] | | | | | | |
| Common stock: $0.01 par value, 400,000,000 shares authorized, [removed: 287,591,536] [added: 285,901,919] and [removed: 289,161,924] [added: 287,591,536] shares issued and outstanding, respectively | 2.9 | | | | 2.9 | |
| Additional paid-in capital | [removed: 8.5] [added: 3.0] | | | | [removed: 37.4] [added: 8.5] | |
| Retained earnings | [removed: 2,110.6] [added: 2,341.6] | | | | [removed: 1,940.1] [added: 2,110.6] | |
| Accumulated other comprehensive loss | [removed: (25.1] [added: (44.8] | | ) | | [removed: (47.3] [added: (25.1] | ) |
| Total stockholders’ equity | [removed: 2,096.9] [added: 2,302.7] | | | | [removed: 1,933.1] [added: 2,096.9] | |
| Total liabilities and stockholders’ equity | $ | [removed: 2,910.5] [added: 3,321.5] | | | [removed: 2,668.9] [added: 2,910.5] | |
| | [removed: 2017] [added: 2018] | | | | [removed: 2016] [added: 2017] | | | [removed: 2015] [added: 2016] | |
| Net sales | $ | [removed: 4,390.5] [added: 4,965.1] | | | [removed: 3,962.0] [added: 4,390.5] | | | [removed: 3,869.2] [added: 3,962.0] | |
| Cost of sales | [removed: 2,226.9] [added: 2,566.2] | | | | [removed: 1,997.2] [added: 2,226.9] | | | [removed: 1,920.3] [added: 1,997.2] | |
| Gross profit | [removed: 2,163.6] [added: 2,398.9] | | | | [removed: 1,964.8] [added: 2,163.6] | | | [removed: 1,948.9] [added: 1,964.8] | |
| Operating and administrative expenses | [removed: 1,282.8] [added: 1,400.2] | | | | [removed: 1,169.5] [added: 1,282.8] | | | [removed: 1,121.5] [added: 1,169.5] | |
| Gain on sale of property and equipment | [removed: (1.0] [added: (0.5] | | ) | | [removed: (0.5] [added: (1.0] | ) | | [removed: (1.4] [added: (0.5] | ) |
| Operating income | [removed: 881.8] [added: 999.2] | | | | [removed: 795.8] [added: 881.8] | | | [removed: 828.8] [added: 795.8] | |
| Interest expense | [removed: (9.1] [added: (12.6] | | ) | | [removed: (6.5] [added: (9.1] | ) | | [removed: (3.1] [added: (6.5] | ) |
| Earnings before income taxes | [removed: 873.1] [added: 987.0] | | | | [removed: 789.7] [added: 873.1] | | | [removed: 826.1] [added: 789.7] | |
| Income tax expense | [removed: 294.5] [added: 235.1] | | | | [removed: 290.3] [added: 294.5] | | | [removed: 309.7] [added: 290.3] | |
| Net earnings | $ | [removed: 578.6] [added: 751.9] | | | [removed: 499.4] [added: 578.6] | | | [removed: 516.4] [added: 499.4] | |
February 6, 2019
| | 2018 | | | | 2017 | |
| Deferred income taxes | 84.4 | | | | 50.6 | |
| Net earnings | $ | 751.9 | | | 578.6 | | | 499.4 | |
| Purchases of common stock | (2.0 | ) | | — | | | | (24.0 | ) | | (79.0 | ) | | — | | | (103.0 | ) |
| Balance as of December 31, 2018 | 285.9 | | | $ | 2.9 | | | 3.0 | | | 2,341.6 | | | (44.8 | ) | | 2,302.7 | |
| Net earnings | $ | 751.9 | | | 578.6 | | | 499.4 | |
| Gain on sale of property and equipment | (0.5 | | ) | | (1.0 | ) | | (0.5 | ) |
incentives.
Revenue is measured as the amount of consideration we expect to receive in exchange for transferring products.
All
revenue is recognized when we satisfy our performance obligations under the contract.
We recognize revenue by transferring
the promised products to the customer, with the majority of revenue recognized at the point in time the customer obtains control
of the products.
by the customer.
Using probability assessments, we estimate sales
incentives expected to be paid over the term of the contract.
The majority of our contracts have a single performance obligation
and are short term in nature.
Sales taxes and value added taxes in foreign jurisdictions that are collected from customers and
Accounts Receivable
Credit is extended based upon an evaluation of the customer's financial condition.
estimated net realizable value.
historical experience with accounts receivable write-offs.
We establish a reserve for excess, slow-moving, and obsolete inventory that is equal to the difference between the cost and estimated net realizable value for that inventory.
These reserves are based on a review and comparison of the current inventory levels to projected and historical sales of inventory.
If the carrying value of the long-lived asset or
Effective January 1, 2018, we adopted the Financial Accounting Standards Board ('FASB') Accounting Standards Update
('ASU') 2014-09, Revenue from Contracts with Customers (Topic 606), and ASU 2015-14, Revenue from Contracts with
ASU
2014-09 supersedes the revenue recognition requirements in ASC 605, Revenue Recognition, and is based on the principle that
revenue is recognized to depict the transfer of goods or services to customers in an amount that reflects the consideration to
which the entity expects to be entitled in exchange for those goods or services.
It also requires additional disclosure about the
The adoption of ASU
2014-09, using the modified retrospective approach, had no significant impact on our results of operations, cash flows, or
financial position.
Revenue continues to be recognized at a point in time for our product sales when products are delivered to or
picked up by the customer and revenue for shipping and handling charges continues to be recognized when products are
Fastenal Company acquired certain assets and assumed certain liabilities of Manufacturers Supply Company (‘Mansco’) on March 31, 2017, and management excluded from their assessment of the effectiveness of internal control over financial reporting as of December 31, 2017, Mansco's internal control over financial reporting associated with assets of approximately one percent of Fastenal Company's total assets and revenues of approximately one percent of Fastenal Company's total revenues included in the consolidated financial statements of Fastenal Company and subsidiaries as of and for the year ended December 31, 2017.
Our audit of internal control over financial reporting of Fastenal Company also excluded an evaluation of the internal control over financial reporting of Mansco.
February 5, 2018
FASTENAL COMPANY AND SUBSIDIARIES
| Balance as of December 31, 2014 | 295.9 | | | $ | 3.0 | | | 33.7 | | | 1,886.4 | | | (7.8 | ) | | 1,915.3 | |
| Purchases of common stock | (7.1 | ) | | (0.1 | | ) | | (60.0 | ) | | (232.8 | ) | | — | | | (292.9 | ) |
| Excess tax benefits from stock-based compensation | — | | | — | | | | 3.4 | | | — | | | — | | | 3.4 | |
We recognize revenue when persuasive evidence of an arrangement exists, title and risk of ownership have passed, the sales price is fixed or determinable, and collectibility is reasonably assured.
These criteria are met at the time the product is shipped to or picked up by the customer.
We recognize services at the time the service is completed and the product is provided to the customer.
We recognize revenue for lease fees on a straight-line basis over the corresponding lease term.
Notes to Consolidated Financial Statements—Continued
Effective January 1, 2017, we adopted the FASB ASU 2016-09, Improvements to Employee Share-Based Payment Accounting.
The standard simplifies several aspects of the accounting for employee share-based payment transactions, including accounting for income taxes, forfeitures, and statutory withholding requirements, as well as classification in the Consolidated Statements of Cash Flows.
As a result of the adoption, on a prospective basis, for the year ended December 31, 2017, we recognized $1.8 of excess tax benefits from stock-based compensation as a discrete item in our income tax expense.
Historically, these amounts were recorded as additional paid-in capital.
Upon adoption, we elected to apply the change retrospectively to our Consolidated Statements of Cash Flows for the years ended December 31, 2016 and December 31, 2015, which resulted in a reclassification of excess tax benefits from stock-based compensation of $5.9 and $3.4, respectively, offsetting cash flows used in financing activities to cash flows provided by operating activities.
We elected not to change our policy on accounting for forfeitures and will continue to estimate a requisite forfeiture rate.
Additional amendments to the accounting for income taxes and minimum statutory withholding requirements had no impact on our results of operations.
On December 22, 2017, the Securities and Exchange Commission ('SEC') staff issued Staff Accounting Bulletin No. 118 ('SAB 118') to address the application of U.S. GAAP related to the enactment of the comprehensive tax legislation, commonly referred to as the Tax Cut and Jobs Act (the 'Tax Act').
This guidance was adopted in the fourth quarter of 2017.
This update is effective for public business entities for annual reporting periods beginning after December 15, 2017, including interim periods within those reporting periods.
Earlier application was permitted only as of annual reporting periods beginning after December 15, 2016, including interim reporting periods within that reporting period.
ASU 2014-09 was to become effective for us beginning January 2017; however, ASU 2015-14 deferred our effective date until January 2018, which is when we plan to adopt this standard.
The ASU permits two methods of adoption: retrospectively to each prior reporting period presented (full retrospective method), or retrospectively with the cumulative effect of initially applying the guidance recognized at the date of initial application (the modified retrospective method).
We have completed the process of evaluating the effect of the adoption and determined there were no changes required to our reported revenues as a result of the adoption.
The majority of our revenue arrangements generally consist of a single performance obligation to transfer promised goods or services.
Based on our evaluation process and review of our contracts with customers, the timing and amount of revenue recognized based on ASU 2015-14 is consistent with our revenue recognition policy under previous guidance.
We adopted the new standard effective January 1, 2018, using the modified retrospective approach, and will expand our consolidated financial statement disclosures in order to comply with the ASU.
We have determined the adoption of ASU 2015-14 will not have a material impact on our results of operations, cash flows, or financial position.
While we are still in the process of evaluating the effect of adoption on our consolidated financial statements and are currently assessing our leases, we expect the adoption will lead to a material increase in the assets and liabilities recorded on our Consolidated Balance Sheets.
As part of our assessment, we will need to determine the impact of lease extension provisions provided in our facility and vehicle leases which will impact the amount of the right of use asset and lease liability recorded under the ASU.
Acquisition
On March 31, 2017, we acquired certain assets and assumed certain liabilities of Manufacturers Supply Company (‘Mansco’).
Mansco, based in Hudsonville, Michigan, is a distributor of industrial and fastener supplies with a particularly strong market position with commercial furniture original equipment manufacturers.
As such, this acquisition gives us a presence in a market where we have not meaningfully participated in the past, and provides Mansco with additional tools with which to service its customer base and reduce costs through economies of scale.
The total purchase price for this acquisition, based on the acquisition date fair value, consisted of $57.9 paid in cash at closing, $0.8 paid in cash after closing pursuant to a post-closing purchase price adjustment, and a contingent consideration arrangement which requires us to pay the former owner up to a maximum of $2.5 (undiscounted) in cash after closing based on sales growth of the acquired business.
The fair value of the assets acquired and liabilities assumed as of the acquisition date is summarized below.
| | | | |
| --- | --- | --- | --- |
An excerpt. Shown here: 40 of 214 rewritten, 40 of 138 added and 40 of 137 removed. The counts are complete. For every sentence, read Item 8. FINANCIAL STATEMENTS AND SUPPLEMENTARY DATA in the FY2018 filing and the FY2017 filing.
Item 9A. CONTROLS AND PROCEDURES
1 rewritten, 1 added, 3 removed, 32 unchanged
Based on our assessment and those criteria, management believes that the company maintained effective internal control over financial reporting as of December 31, [removed: 2017.][added: 2018.]
| February 6, 2019 | | |
We have excluded Mansco from our assessment of the effectiveness of our internal control over financial reporting as of December 31, 2017, which represented 0.8% of total assets and 0.9% of net sales included in our consolidated financial statements as of and for the year ended December 31, 2017.
As discussed in Note 2 of the Notes to Consolidated Financial Statements, on March 31, 2017, we acquired certain assets and assumed certain liabilities of Manufacturers Supply Company (‘Mansco’).
| February 5, 2018 | | |
Item 10. DIRECTORS, EXECUTIVE OFFICERS, AND CORPORATE GOVERNANCE
17 rewritten, 1 added, 8 removed, 67 unchanged
In the event we amend or waive any portion of the standards of conduct, as supplemented, that constitutes a required element of a Code of Ethics and such amendment or waiver applies to any of our Senior Financial Officers, we intend to post on our [removed: website,] [added: website at www.fastenal.com,] within four business days after the date of such amendment or waiver, a brief description of such amendment or waiver, the name of each Senior Financial Officer to whom the amendment or waiver applies, and the date of the amendment or waiver.
| Daniel L. Florness | 1996 | | [removed: 54] [added: 55] | | President, Chief Executive Officer, and Director |
| William J. Drazkowski | 1995 | | [removed: 46] [added: 47] | | Executive Vice President – National Accounts Sales |
| Leland J. Hein | 1985 | | [removed: 57] [added: 58] | | Senior Executive Vice President – Sales |
| James C. Jansen | 1992 | | [removed: 47] [added: 48] | | Executive Vice President – Manufacturing |
| Holden Lewis | 2016 | | [removed: 48] [added: 49] | | Executive Vice President and Chief Financial Officer |
| Sheryl A. Lisowski | 1994 | | [removed: 50] [added: 51] | | Controller, Chief Accounting Officer, and Treasurer |
| Nicholas J. Lundquist | 1979 | | [removed: 60] [added: 61] | | Senior Executive Vice President – Operations |
| Charles S. Miller | 1999 | | [removed: 43] [added: 44] | | Executive Vice President – Sales |
| Terry M. Owen | 1999 | | [removed: 49] [added: 50] | | Senior Executive Vice President – Sales Operations |
| John L. Soderberg | 1993 | | [removed: 46] [added: 47] | | Executive Vice President – Information Technology |
| Jeffery M. Watts | 1996 | | [removed: 46] [added: 47] | | Executive Vice President – International Sales |
| Reyne K. Wisecup | 1988 | | [removed: 54] [added: 55] | | Senior Executive Vice President – Human Resources and Director |
Mr. Florness has served as one [added: of] our directors since January 2016.
From November 2007 to July 2012, Mr. Hein was one [removed: of our executive vice presidents – sales.]
From April 2000 to April 2005, Mr. Jansen served as [removed: sales leader] [added: regional vice president] of our Texas based region.
Mr. Owen's responsibilities include oversight of our information technology, [removed: sales operations and support,] [added: e-commerce, marketing,] international sales, national accounts, [added: government sales,] FAST Solutions®, [added: our Mansco division,] and manufacturing operations.
of our executive vice presidents – sales.
| Gary A. Polipnick | 1983 | | 55 | | Executive Vice President – FAST Solutions® |
Mr. Polipnick has been our executive vice president – FAST Solutions® since January 2016.
Mr. Polipnick's responsibilities include our FAST Solutions® programs and branch inventory modeling and merchandising programs.
From July 2015 to December 2015, Mr. Polipnick was our executive vice president – e-business.
From July 2012 to June 2015, Mr. Polipnick served as one of our executive vice president – sales.
From November 2007 to July 2012, Mr. Polipnick was regional vice president of our Winona based region.
Prior to November 2007, Mr. Polipnick served in various sales leadership roles at our company.
After 34 years with Fastenal, Mr. Polipnick has indicated his intention to retire effective March 31, 2018.
Item 12. SECURITY OWNERSHIP OF CERTAIN BENEFICIAL OWNERS AND MANAGEMENT AND RELATED STOCKHOLDER MATTERS
2 rewritten, 2 added, 3 removed, 11 unchanged
| Equity compensation plans [added: not] approved by security holders [removed: (1)] | [removed: 3,948,908] [added: —] | | | [removed: $] [added: —] | [removed: 48.28] | | | [removed: 5,169,233] [added: —] | |
[added: |] (1) [added: |] Reflects [removed: securities to be] [added: stock option awards] issued [added: and issuable in the future] under our Fastenal Company Stock Option [added: Plan and our Fastenal Company Non-Employee Director Stock Option] Plan. [added: |]
| Equity compensation plans approved by security holders (1) | 3,999,632 | | | $ | 49.53 | | | 7,314,063 | |
| Total | 3,999,632 | | | | | | | 7,314,063 | |
| Equity compensation plans not approved by security holders (2) | 21,185 | | | 55.00 | | | | 2,478,815 | |
| Total | 3,970,093 | | | | | | | 7,648,048 | |
| (2) | Reflects stock option awards issued and issuable in the future under the Fastenal Company Non-Employee Director Stock Option Plan, which was approved by our board of directors on October 10, 2017 but has not yet been approved by our shareholders. Our shareholders are being asked to approve this plan at our April 2018 annual meeting, and the exercisability and continued existence of the plan and all option awards currently outstanding thereunder is expressly conditioned on shareholder approval of that plan at the annual meeting. A description of the material terms of the plan and a summary of option awards currently outstanding thereunder will be provided in the Proxy Statement. |
Item 15. EXHIBITS AND FINANCIAL STATEMENT SCHEDULES
19 rewritten, 4 added, 0 removed, 31 unchanged
Consolidated Balance Sheets as of December 31, [removed: 2017] [added: 2018] and [removed: 2016][added: 2017]
Consolidated Statements of Earnings for the years ended December 31, [added: 2018,] 2017, [removed: 2016,] and [removed: 2015][added: 2016]
Consolidated Statements of Comprehensive Income for the years ended December 31, [added: 2018,] 2017, [removed: 2016,] and [removed: 2015][added: 2016]
Consolidated Statements of Stockholders' Equity for the years ended December 31, [added: 2018,] 2017, [removed: 2016,] and [removed: 2015][added: 2016]
Consolidated Statements of Cash Flows for the years ended December 31, [added: 2018,] 2017, [removed: 2016,] and [removed: 2015][added: 2016]
| 3.2 | [Restated By-Laws of Fastenal Company (incorporated by reference to Exhibit 3.2 to Fastenal Company's Form 8-K dated as of [removed: October 15, 2010] [added: January 17, 2019] (file no. [removed: 000-16125))](http://www.sec.gov/Archives/edgar/data/815556/000119312510229904/dex32.htm)] [added: 000-16125))](http://www.sec.gov/Archives/edgar/data/815556/000081555619000007/exhibit32restatedbylaws.htm)] |
| 4.1 | [Form of Senior Notes due July 20, 2021 (incorporated by reference to Exhibit 4.1 to Fastenal Company’s Form 8‑K dated as of July 20, [removed: 2016)](http://www.sec.gov/Archives/edgar/data/815556/000081555616000115/exhibit41.htm)] [added: 2016 (file no. 000-16125))](http://www.sec.gov/Archives/edgar/data/815556/000081555616000115/exhibit41.htm)] |
| 4.2 | [Form of Senior Notes due July 20, 2022 (incorporated by reference to Exhibit 4.2 to Fastenal Company’s Form 8‑K dated as of July 20, [removed: 2016)](http://www.sec.gov/Archives/edgar/data/815556/000081555616000115/exhibit42.htm)] [added: 2016 (file no. 000-16125))](http://www.sec.gov/Archives/edgar/data/815556/000081555616000115/exhibit42.htm)] |
| 10.1 | [Bonus Program for Executive [removed: Officers*](https://www.sec.gov/Archives/edgar/data/815556/000081555618000010/fast1231201710-kexhibit101.htm)] [added: Officers*](https://www.sec.gov/Archives/edgar/data/815556/000081555619000015/fast1231201810-kexhibit101.htm)] |
| 10.2 | [Fastenal Company Stock Option Plan as amended and restated effective as of December 12, 2014 (incorporated by reference to Exhibit 10.1 to Fastenal Company's Form 8-K dated December 17, [removed: 2014)*](http://www.sec.gov/Archives/edgar/data/815556/000081555614000073/exhibit101stockoptionplana.htm)] [added: 2014 (file no. 000-16125))*](http://www.sec.gov/Archives/edgar/data/815556/000081555614000073/exhibit101stockoptionplana.htm)] |
| 10.3 | [Fastenal Company Incentive Plan (incorporated by reference to Appendix A to Fastenal Company's Proxy Statement dated February 23, [removed: 2012)*](http://www.sec.gov/Archives/edgar/data/815556/000119312512074269/d296107ddef14a.htm)] [added: 2012 (file no. 000-16125))*](http://www.sec.gov/Archives/edgar/data/815556/000119312512074269/d296107ddef14a.htm)] |
| [removed: 10.4] [added: 10.5] | [Credit [removed: Agreement] [added: Agreement,] dated as of May 1, [removed: 2015] [added: 2015,] among Fastenal Company, the Lenders from time to time party thereto, and Wells Fargo Bank, National Association, as Administrative Agent, Swingline Lender and Issuing Lender (incorporated by reference to Exhibit 10.1 to Fastenal Company's Form 8-K dated May 5, [removed: 2015), as amended by the First Amendment to Credit Agreement dated as of November 23,] 2015 [removed: (incorporated by reference to Exhibit 10.1 to Fastenal Company's Form 8-K dated November 25, 2015), and as amended by the Second Amendment to Credit Agreement dated as of March 10, 2017 (incorporated by reference to Exhibit 10.1 to Fastenal Company's Form 8-K dated March 14, 2017)](http://www.sec.gov/Archives/edgar/data/815556/000081555615000036/exhibit10105012015creditag.htm)] [added: (file no. 001‑16125)).](http://www.sec.gov/Archives/edgar/data/815556/000081555615000036/exhibit10105012015creditag.htm)] |
| [removed: 10.5] [added: 10.7] | [Second Amendment to Credit [removed: Agreement] [added: Agreement,] dated as of March 10, [removed: 2017] [added: 2017,] by and among Fastenal Company, the [removed: lenders] [added: Lenders] party [removed: thereto] [added: thereto,] and Wells Fargo Bank, National Association, as Administrative Agent (incorporated by reference to Exhibit 10.1 to Fastenal Company's Form 8-K dated as of March 14, 2017 (file no. [removed: 000-016125))](http://www.sec.gov/Archives/edgar/data/815556/000081555617000015/exhibit101creditfacilityse.htm)] [added: 001‑16125)).](http://www.sec.gov/Archives/edgar/data/815556/000081555617000015/exhibit101creditfacilityse.htm)] |
| [removed: 10.6] [added: 10.9] | [Master Note Agreement dated as of July 20, 2016 by and among (i) Fastenal Company, (ii) Metropolitan Life Insurance Company, NYL Investors LLC and PGIM, Inc. (formerly known as Prudential Investment Management, Inc.), as investor group representatives (each, an 'Investor Group Representative'), and (iii) Metropolitan Life Insurance Company (in its capacity as a purchaser of notes under such Master Note Agreement) and/or affiliates of any Investor Group Representative who become purchasers of notes under such Master Note Agreement (incorporated by reference to Exhibit 10.1 to Fastenal Company’s Form [removed: 8‑K] [added: 8-K] dated as of July 20, [removed: 2016)](http://www.sec.gov/Archives/edgar/data/815556/000081555616000115/exhibit101agreement07202016.htm)] [added: 2016 (file no. 001-16125)).](http://www.sec.gov/Archives/edgar/data/815556/000081555616000115/exhibit101agreement07202016.htm)] |
| 13 | [Portions of [removed: 2017] [added: 2018] Annual Report to Shareholders not included in this Form 10-K (only those sections specifically incorporated by reference in this Form 10-K shall be deemed filed with the [removed: SEC)](https://www.sec.gov/Archives/edgar/data/815556/000081555618000010/final2017annualreportweb.htm)] [added: SEC)](https://www.sec.gov/Archives/edgar/data/815556/000081555619000015/a2018finalannualreport.htm)] |
| 21 | [List of [removed: Subsidiaries](https://www.sec.gov/Archives/edgar/data/815556/000081555618000010/fast1231201710-kexhibit21.htm)] [added: Subsidiaries](https://www.sec.gov/Archives/edgar/data/815556/000081555619000015/fast1231201810-kexhibit21.htm)] |
| 23 | [Consent of Independent Registered Public Accounting [removed: Firm](https://www.sec.gov/Archives/edgar/data/815556/000081555618000010/fast1231201710-kexhibit23.htm)] [added: Firm](https://www.sec.gov/Archives/edgar/data/815556/000081555619000015/fast1231201810-kexhibit23.htm)] |
| 31 | [Certifications under Section 302 of the Sarbanes-Oxley Act of [removed: 2002](https://www.sec.gov/Archives/edgar/data/815556/000081555618000010/fast1231201710-kexhibit31.htm)] [added: 2002](https://www.sec.gov/Archives/edgar/data/815556/000081555619000015/fast1231201810-kexhibit31.htm)] |
| 32 | [Certification under Section 906 of the Sarbanes-Oxley Act of [removed: 2002](https://www.sec.gov/Archives/edgar/data/815556/000081555618000010/fast1231201710-kexhibit32.htm)] [added: 2002](https://www.sec.gov/Archives/edgar/data/815556/000081555619000015/fast1231201810-kexhibit32.htm)] |
| 10.4 | [Fastenal Company Non-Employee Director Stock Option Plan (incorporated by reference to Exhibit 99 to Fastenal Company's Registration Statement on Form S-8 filed on April 25, 2018 (file no. 333‑224441)).*](http://www.sec.gov/Archives/edgar/data/815556/000081555618000026/exhibit99-nonxemployeedire.htm) |
| 10.6 | [First Amendment to Credit Agreement, dated as of November 23, 2015, among Fastenal Company, the Lenders from time to time party thereto, and Wells Fargo Bank, National Association, as Administrative Agent (incorporated by reference to Exhibit 10.1 to Fastenal Company's Form 8-K dated November 25, 2015 (file no. 001‑16125)).](http://www.sec.gov/Archives/edgar/data/815556/000081555615000074/exhibit101amendment11232015.htm) |
| 10.8 | [Third Amendment to Credit Agreement dated as of November 30, 2018 among Fastenal Company, the Lenders party thereto, and Wells Fargo Bank, National Association, as Administrative Agent (incorporated by reference to Exhibit 10.1 to Fastenal Company's Form 8‑K dated December 3, 2018 (file no. 001-16125)).](http://www.sec.gov/Archives/edgar/data/815556/000081555618000052/exhibit101-thirdamendmentt.htm) |
| 10.10 | [Omnibus First Amendment to Master Note Agreement and Subsidiary Guaranty Agreement dated as of November 30, 2018 by and among Fastenal Company, Fastenal Company Purchasing, and Fastenal IP Company, on one hand, and Metropolitan Life Insurance Company, NYL Investors LLC, PGIM, Inc., and each holder of Notes that are signatory thereto, on the other hand (incorporated by reference to Exhibit 10.2 to Fastenal Company's Form 8-K dated December 3, 2018 (file no. 001-16125)).](http://www.sec.gov/Archives/edgar/data/815556/000081555618000052/exhibit102-firstamendmentt.htm) |
Item 16. FORM 10-K SUMMARY
3 rewritten, 3 added, 2 removed, 56 unchanged
Years ended December 31, [added: 2018,] 2017, [removed: 2016,] and [removed: 2015][added: 2016]
| Year ended December 31, [removed: 2015] [added: 2018] | | | | | | | | | | | | | | | |
| Date: | | February [removed: 5, 2018] [added: 6, 2019] |
| Allowance for doubtful accounts | $ | 11.9 | | | 8.1 | | | — | | | 7.2 | | | 12.8 | |
| Insurance reserves | $ | 39.0 | | | 66.9 | | (1) | — | | | 68.3 | | (2) | 37.6 | |
| Date: | | February 6, 2019 |
| Allowance for doubtful accounts | $ | 12.6 | | | 8.8 | | | — | | | 9.7 | | | 11.7 | |
| Insurance reserves | $ | 31.1 | | | 54.3 | | (1) | — | | | 53.6 | | (2) | 31.8 | |