 filings.tools
Fastenal (FAST) 10-K risk factor changes: FY2020 vs FY2019
The 2020-12-31 10-K against the 2019-12-31 one, compared heading by heading and sentence by sentence.
Item 1A58 rewritten43 added22 removed108 unchanged
All filing items889 rewritten770 added438 removed813 unchanged
Summary
counted, not written
- Item 1A lists 26 risk factor headings: 1 new, 3 reworded and 22 unchanged since FY2019. 1 heading from FY2019 no longer appears.
- Sentence by sentence, 770 added, 438 removed, 889 rewritten and 813 unchanged across 22 items that differ.
New Item 1A headings (1)
- The COVID-19 pandemic has significantly impacted worldwide economic conditions and could have a material adverse effect on our operations and business.
Removed Item 1A headings (1)
- We may not be successful in integrating acquisitions and achieving intended benefits and synergies.
Reworded Item 1A headings (3)
[removed: In the event of a cyber][added: Cyber] security[removed: incident, we][added: incidents, or violations of data privacy laws and regulations,] could [added: cause us to] experience certain operational interruptions, incur substantial additional costs, become subject to legal or regulatory proceedings, or suffer damage to our reputation in the marketplace.- Changes in customer or product mix, downward pressure on sales prices, and changes in volume [added: or timing] of orders [added: have caused and] could cause our gross profit percentage to fluctuate or decline in the future.
- Our competitive advantage in
[removed: our]industrial vending[removed: business][added: (FAST Vend) and bin stock (FAST Stock and FAST Bin) tools] could be eliminated[removed: and][added: and, in] the [added: case of FAST Vend, the] loss of key suppliers of equipment and services[removed: for that business]could be[removed: disruptive][added: impactful] and[removed: could]result in failure to deploy devices.
A heading is new when no FY2019 heading matches it after ignoring case and punctuation, and reworded when it shares at least 60 percent of its words with one that went away. All current risk factor headings.
Sentences by item
22 items, with every count and a link to each item that changed
Underlined words on a shaded ground are new in FY2020; struck-through words were in FY2019. Sentences that are wholly new or wholly gone are labelled rather than marked.
Item 1A. RISK FACTORS
58 rewritten, 43 added, 22 removed, 108 unchanged
The [removed: most significant] [added: material] risks and uncertainties known to us which may cause our operating results to vary from anticipated results or which may negatively affect our operating results and profitability are as follows:
[removed: In the event of a cyber] [added: Cyber] security [removed: incident, we] [added: incidents, or violations of data privacy laws and regulations,] could [added: cause us to] experience certain operational interruptions, incur substantial additional costs, become subject to legal or regulatory proceedings, or suffer damage to our reputation in the marketplace. The nature of our business requires us to receive, retain, and transmit certain personally identifying information that our customers provide to purchase products or services, register on our websites, or otherwise communicate and interact with us.
We may be unable to meet our goals regarding the growth drivers of our business. Our sales growth is dependent primarily on our ability to attract new customers and increase our activity with existing [removed: customers.][added: customers within North America and abroad.]
In recent years, [removed: however,] we have [removed: devoted] increased [added: the] resources [added: devoted] to [removed: other] [added: our] growth drivers, including [removed: our industrial vending business, our Onsite business, our] [added: FMI, Onsites,] national [removed: accounts team, and our international operations.][added: accounts, digital]
While we have taken steps to build momentum in the growth drivers of our business, we cannot assure you those steps will lead to [removed: additional] sales [removed: growth.][added: growth and, due to the COVID-19 pandemic, our growth drivers did not contribute meaningfully to higher sales in 2020.]
Failure to achieve any of our goals regarding [removed: industrial vending,] FMI, [removed: Onsite locations,] [added: Onsites,] national [removed: accounts signings,] [added: accounts,] digital solutions, [added: and] international operations, or other growth drivers could negatively impact our long-term sales growth.
[removed: businesses or] [added: Further,] failure to [removed: find suitable locations] [added: identify appropriate targets] for [removed: them once] [added: our Onsite channel and FMI tools or failure to persuade the] appropriate targets [removed: are] [added: to adopt these offerings once] identified may adversely impact our goals regarding the number of new Onsite locations we are able to open or the number of [removed: industrial vending devices] [added: FMI installations] we are able to deploy.
Changes in customer or product mix, downward pressure on sales prices, and changes in volume [added: or timing] of orders [added: have caused and] could cause our gross profit percentage to fluctuate or decline in the future. Changes in our customer or product mix [added: have caused our gross profit percentage to decline and] could cause our gross profit percentage to [added: further] fluctuate or decline.
For example, the portion of our sales attributable to fasteners has been decreasing [removed: in recent] [added: for approximately twenty] years.
Similarly, in recent years, revenues from national accounts [added: and/or Onsite] customers, which typically have lower gross profit margins by virtue of their [removed: scale and] [added: scale,] available business, [added: and broader offering of products which typically] have [added: lower gross margins, have] tended to grow faster than revenues from smaller customers.
Customer and product mix have contributed to the decline in our gross profit percentage over time, including in [removed: 2019] [added: 2020] and [removed: 2018,] [added: 2019,] and will likely continue to affect our gross profit percentage in [removed: 2020] [added: 2021] and beyond.
However, whether [added: and to what extent] this adverse mix impact will result in a decline of our gross profit percentage in any given year will depend on the extent to which they are, or are not, offset by positive impacts to gross profit margin during such year.
Downward pressure on sales prices, changes in the volume [added: or timing] of our orders, and an inability to pass higher product costs on to customers could also cause our gross profit percentage to fluctuate or decline.
For instance, it is typical that when demand declines, most commonly from cyclical [added: or general market] factors (though it could be due to customer losses or some other company-specific event), our operating and administrative expenses do not fall as quickly as net sales.
Our competitive advantage in [removed: our] industrial vending [removed: business] [added: (FAST Vend) and bin stock (FAST Stock and FAST Bin) tools] could be eliminated [removed: and] [added: and, in] the [added: case of FAST Vend, the] loss of key suppliers of equipment and services [removed: for that business] could be [removed: disruptive] [added: impactful] and [removed: could] result in failure to deploy devices. We believe we have a competitive advantage in industrial vending [added: and bin stock] due to our [removed: vending] hardware and software, our local branch presence (allowing us to service devices [added: and bins] more rapidly), our [removed: 'vendible' product depth,] [added: depth of products that lend themselves to being dispensed through industrial vending devices or bin stocks,] and, in North America, our distribution strength.
These advantages have developed over time; however, other competitors could respond to our expanding industrial vending [removed: business] [added: and bin stock position] with highly competitive platforms of their own.
Such competition could negatively impact our ability to expand our industrial vending [removed: business] [added: and bin stock tools] or negatively impact the economics of that business.
In addition, we currently rely on a limited number of suppliers for the vending devices used [removed: in, and certain software and services needed to operate,] [added: in] our [removed: industrial vending business.][added: FAST Vend platform.]
The ability to identify new products and product lines, and integrate them into our selling locations and distribution network, may impact our ability to compete, our ability to generate additional sales, and our profit margins. Our success depends in part on our ability to develop product expertise at the selling location level and identify future products and product [removed: lines that complement existing products and product lines and that respond to our customers' needs.]
If we are unable to hire and retain personnel capable of consistently providing a high level of customer [added: service, as demonstrated by their enthusiasm for our culture and product knowledge, our sales could be materially adversely affected.]
Increased competition from brick-and-mortar retailers could cause us to lose market [removed: share or] [added: share,] reduce our [removed: prices] [added: prices,] or increase our spending.
Compliance with these laws and regulations increases the cost of doing business and failure to comply could result in the imposition of fines or penalties and the termination of contracts. We are subject to a variety of laws and regulations including without limitation; import and export requirements, anti-bribery and corruption laws, product compliance laws, environmental laws, foreign exchange controls and cash repatriation restrictions, advertising regulations, data privacy [added: (including in the U.S., the California Consumer Privacy Act,] and [added: in the European Union, the General Data Protection Regulation 2016, with interpretations varying from state to state and country to country) and] cyber security [removed: requirements,] [added: requirements (including protection of information and incident responses),] regulations on suppliers regarding the sources of supplies or products, labor and employment laws, and anti-competition regulations.
[removed: Any such] violations could result in the imposition of fines and penalties, damage to our reputation, and, in the case of laws and regulations relating specifically to governmental contracts, the loss of those contracts.
Further, our future effective tax rates in any of these jurisdictions could be affected, positively or negatively, by changing tax priorities, changes in statutory rates, [removed: or] [added: and/or] changes in tax laws or the interpretation thereof.
There is [removed: also] a [removed: longer term] [added: longer-term] risk that the beneficial aspects of the Tax Act on our business could be reversed depending on changes in future fiscal or political priorities.
We may not be successful in integrating acquisitions and achieving intended benefits and [removed: synergies. We have completed several acquisitions of businesses in recent years.][added: synergies.]
[removed: | • |] [added: -] general business conditions, [removed: |]
[removed: | • |] [added: -] business conditions in our principal markets, [removed: |]
[removed: | • |] [added: -] interest rates, [removed: |]
[removed: | • |] [added: -] inflation, [removed: |]
[removed: | • |] [added: -] liquidity in credit markets, [removed: |]
[removed: | • |] [added: -] taxation, [removed: |]
[removed: | • |] [added: -] government regulations and actions, including around trade policy, [removed: |]
[removed: | • |] [added: -] energy and fuel prices and electrical power rates, [removed: |]
[removed: | • |] [added: -] unemployment trends, [removed: |]
[removed: | • |] [added: -] terrorist attacks and acts of war, [removed: |]
[removed: | • |] [added: -] other matters that influence customer confidence and spending. [removed: |]
This risk was [removed: most recently] demonstrated in [removed: 2019.][added: 2019 and 2020.]
[removed: After experiencing] [added: We experienced] strong demand in 2017 and 2018 that produced double-digit sales growth for [removed: Fastenal, our growth slowed into the mid-single digits beginning in the second quarter of 2019.][added: Fastenal.]
[removed: During that period,] [added: Our growth slowed into the mid-single digits beginning in the second quarter of 2019 as] many of our customers involved in the manufacture of components, capital goods, and heavy equipment were impacted by higher costs and reduced confidence stemming from global trade uncertainty.
Operational Risks
In addition, regulatory authorities have increased their focus on how companies collect, process, use, store, share, and transmit personal data.
New privacy security laws and regulations, including the European Union General Data Protection Regulation 2016, the California Consumer Protection Act, and other similar state privacy laws, pose increasingly complex compliance challenges, which may increase compliance costs, and any failure to comply with data privacy laws and regulations could result in significant penalties.
solutions, and our international operations.
In addition, as a result of the COVID-19 pandemic, our sales were impacted by surge sales of pandemic-related supplies, such as PPE and other safety-related products that have traditionally lower gross profit margins.
For example, in the second quarter of 2020, we had to quickly purchase large volumes of pandemic-related products from non-traditional sources and non-optimized supply chains, which had a negative impact on gross profit.
In addition, our ability to expand deployment of our industrial vending and bin stock tools could be limited by events similar to the COVID-19 pandemic if customers shift their energy to short-term disruptions instead of long-term strategic planning.
lines that complement existing products and product lines and that respond to our customers' needs.
We have completed several acquisitions of businesses in recent years.
Legal, Regulatory, and Compliance Risks
Any such
Operational Risks
- acts of God, which may include, but are not limited to, weather events, earthquakes, pandemics, etc., and
In the second and third quarters of 2020, the reaction to the COVID-19 pandemic resulted in sharply reduced spending by our traditional customers as they implemented shutdowns, social distancing, and safety policies.
However, the weakness that was experienced by many of our business units in the second and third quarters of 2020 was more than offset by sales of pandemic-related supplies, such as PPE and sanitation products, to traditional and less traditional (e.g., government and healthcare) customers.
While we intend to retain some of these less traditional customers as regular buyers of safety and other products once the pandemic subsides, it is uncertain whether they will continue to purchase products from us.
The COVID-19 pandemic has significantly impacted worldwide economic conditions and could have a material adverse
effect on our operations and business. The COVID-19 pandemic began to impact our operations late in the first quarter of 2020 and may continue to affect our business, particularly should government authorities impose mandatory closures, work-from-home orders and/or social distancing protocols, seek voluntary facility closures and/or impose other restrictions.
Should such actions be taken, it could materially adversely affect our ability to adequately staff and maintain our operations, impair our ability to sustain sufficient financial liquidity, and impact our financial results.
The COVID-19 pandemic has had some favorable impacts on our financial results through much of 2020.
However, as supply chains adapt to the environment, it is not certain that those favorable impacts will recur in the future to offset any resumption of public access restrictions we might impose on our branches or reductions in capacity by our customers, including facility closures.
The COVID-19 pandemic has also produced shifts in the mix of our business resulting from a decrease in sales of our fasteners and increases in sales through our safety business.
Based on the traditionally lower gross profit margin percentage of our safety business, these shifts have contributed to a lower gross profit margin percentage for us.
This impact on our gross profit margin percentage may persist in the short term until the impacts of COVID-19 start to moderate.
It is also possible that the impact on our gross profit margin percentage will be long term in the event that COVID-19 alters customer purchasing patterns to include a sustainably higher
mix of safety and sanitation products.
As we cannot predict the duration or scope of the COVID-19 pandemic, the net financial impact to our operating results cannot be reasonably estimated, but it could be material and last for an extended period of time.
China represents a significant source of product for North America.
In addition, we move and source products within North America.
Any trading disruption (tariffs, product restrictions, etc.) between Canada, the United States, and Mexico, or disruption in their respective trading relationships with other nations can adversely impact our business.
This dynamic would apply to every country in which we operate, but no other country represents more than 10% of our net sales.
We have identified additional markets, such as government, healthcare, and academia, and geographies into which we can sell our FMI solutions, which would increase the number of identified potential industrial vending or customer locations.
However, our presence in emerging markets and geographies is not as established as is the case in our traditional markets and geographies, which could extend the sales cycle.
We are exposed to foreign currency exchange rate risk, and changes in foreign exchange rates could increase the cost of purchasing products and impact our foreign sales. Because our company was started in the United States and because we are publicly-traded in the United States, we report our results based on the United States dollar.
Credit and Liquidity Risks
We did not have loans outstanding under our revolving credit facility (the 'Credit Facility') as of December 31, 2020.
The notes issued under our Master Note Agreement consist of eight series and are described in further detail in Note 10 of the Notes to Consolidated Financial Statements included later in this Form 10-K.
In July 2017, the Financial Conduct Authority in the United Kingdom, the governing body responsible for regulating LIBOR, announced that it no longer will compel or persuade financial institutions and panel banks to make LIBOR submissions after 2021.
The cessation date for submission and publication of rates for certain tenors of LIBOR has since been extended until mid-2023, but it is uncertain when applicable tenors of LIBOR will cease to exist and whether additional reforms to LIBOR may be enacted, but LIBOR is still expected to cease to be the reference rate for commercial loans and other indebtedness.
Our Credit Facility currently uses LIBOR as a reference rate, and, while there are customary LIBOR replacement provisions in our Credit Facility, the transition to alternatives to LIBOR could be modestly disruptive to the credit markets.
Historically, the most effective way to attract new customers has been opening new branches.
Further, failure to identify appropriate targets for our Onsite and industrial vending
This factor has become more significant as revenues from Onsite locations have grown in the mix.
service, as demonstrated by their enthusiasm for our culture and product knowledge, our sales could be materially adversely affected.
The Tax Act reduced the U.S. federal corporate income tax rate, included a one-time tax on accumulated offshore earnings, eliminated certain deductions for which we had previously qualified, requires a current inclusion in U.S. federal income of certain earnings of controlled foreign corporations, allows a domestic corporation an immediate deduction in U.S. taxable income for a portion of its foreign-derived intangible income, and introduced a base erosion anti-abuse tax.
| | |
| --- | --- |
| • | weather conditions, and |
China and Canada represent significant sources of product and Canada and Mexico represent our two largest markets in terms of revenue generation after the United States, and each of these countries are currently and/or have been previously subject to disruption due to historical trade policies.
The first of these actions occurred on September 24, 2018, but since that date there have been additional actions to both increase the number of products covered by tariffs and to raise the tariff rates themselves.
We have taken actions, including increasing product prices, re-sourcing product, and seeking exemptions for certain products, that have been mostly effective at offsetting the impacts of tariffs on our financial results.
In August and September 2017, we experienced temporary disruptions in our distribution network in our Gulf Coast, Florida, Georgia, and Puerto Rico regions due to hurricanes Harvey, Irma, and Maria.
These storms adversely impacted our product demand and revenues, as well as our gross and operating profit percentages, due to an increase in demand for storm-related products which have a lower gross profit margin, and inefficiencies in delivery services in the immediate aftermath of the storms.
In September 2018, hurricane Florence had a similar impact in our Carolinas region, and in the first quarter of 2019, severe winter weather had a similar impact across the northern part of the United States.
marketplace (such as changes in customer concentration or needs), a change in the nature of that business strategy, or weaker than anticipated acceptance by customers of that business strategy.
The notes issued under our Master Note Agreement consist of three series.
The first is in an aggregate principal amount of $40.0, bears interest at a fixed rate of 2.00% per annum, and is due and payable on July 20, 2021.
The second is in an aggregate principal amount of $35.0, bears interest at a fixed rate of 2.45% per annum, and is due and payable on July 20, 2022.
The third is in an aggregate principal amount of $60.0, bears interest at a fixed rate of 3.22% per annum, and is due and payable on March 1, 2024.
Our aggregate borrowing capacity under the Credit Facility is $700.0.
Our aggregate borrowing capacity under the Master Note Agreement is $600.0; however, none of the institutional investors that are parties to that agreement are committed to purchase notes thereunder.
Investment Risk
An excerpt. Shown here: 40 of 58 rewritten, 40 of 43 added and all 22 removed. The counts are complete. For every sentence, read Item 1A. RISK FACTORS in the FY2020 filing and the FY2019 filing.
Item 7. MANAGEMENT'S DISCUSSION AND ANALYSIS OF FINANCIAL CONDITION AND RESULTS OF OPERATIONS
191 rewritten, 232 added, 143 removed, 154 unchanged
The following is management's discussion and analysis of certain significant factors which have affected our financial position and operating results during the periods included in the accompanying consolidated financial [added: statements and should be read in conjunction with those consolidated financial] statements.
(3) Purchasing professionals often expend disproportionate effort managing the high [removed: SKU] [added: stock keeping unit (SKU)] count of low-volume, low value MRO supplies which is better allocated to their higher volume, higher value OEM supplies.
Today, in [removed: some] [added: many] cases, we have moved the branch inside the [removed: customer's] [added: customers'] facility.
We also are frequently positioned right at the point of consumption within customers' facilities through our [removed: industrial vending or] [added: suite of] FMI [added: devices and] capabilities.
Our gross profit [added: increased $52.3, or 2.1%, in 2020 relative to 2019, and] as a percentage of net sales declined to [removed: 47.2%] [added: 45.5%] in [removed: 2019] [added: 2020] from [removed: 48.3%] [added: 47.2%] in [removed: 2018.][added: 2019.]
Our operating income [added: increased $84.5, or 8.0%, in 2020 relative to 2019, and] as a percentage of net sales [removed: declined] [added: increased] to [removed: 19.8%] [added: 20.2%] in [removed: 2019] [added: 2020] from [removed: 20.1%] [added: 19.8%] in [removed: 2018.][added: 2019.]
Our net earnings in [removed: 2019] [added: 2020] were [removed: $790.9,] [added: $859.1,] an increase of [removed: 5.2%] [added: 8.6%] when compared to [removed: 2018.][added: 2019.]
Our diluted net earnings per share were [removed: $1.38] [added: $1.49] in [removed: 2019] [added: 2020] compared to [removed: $1.31] [added: $1.38] in [removed: 2018,] [added: 2019,] an increase of [removed: 5.2%.][added: 8.4%.]
The table below summarizes our [removed: total] [added: absolute and full-time equivalent (FTE; based on 40 hours per week)] employee headcount, our investments in in-market locations (defined as the sum of the total number of public branch locations and the total number of active Onsite locations), and industrial vending devices at the end of the periods presented and the percentage change compared to the end of the prior period.
| | [removed: Q4 2019] | | [added: Q4 2020] | [added: | | | | |] Q4 [removed: 2018] [added: 2019] | | | [added: | | |] Twelve-month % Change | | [added: |]
| In-market locations [removed: -] [added: \-] absolute employee headcount | [removed: 13,977] | | [added: 12,680] | [removed: 14,015] | | | [removed: \-0.3] | [added: | 13,977 | | | | | | \-9.3 | |] % |
| Total absolute employee headcount | [removed: 21,948] | | [added: 20,365] | [removed: 21,644] | | | [removed: 1.4] | [added: | 21,948 | | | | | | \-7.2 | |] % |
| Number of public branch locations | [removed: 2,114] | | [added: 2,003] | [removed: 2,227] | | | [removed: \-5.1] | [added: | 2,114 | | | | | | \-5.3 | |] % |
| Number of active Onsite locations | [removed: 1,114] | | [added: 1,265] | [removed: 894] | | | [removed: 24.6] | [added: | 1,114 | | | | | | 13.6 | |] % |
| Number of in-market locations | [removed: 3,228] | | [added: 3,268] | [removed: 3,121] | | | [removed: 3.4] | [added: | 3,228 | | | | | | 1.2 | |] % |
| Industrial vending devices (installed count) (1) | [removed: 89,937] | | [added: 95,733] | [removed: 81,137] | | | [removed: 10.8] | [added: | 89,937 | | | | | | 6.4 | |] % |
| *Ratio of industrial vending devices to in-market locations* | [removed: 28:1] | | [added: 29:1] | [removed: *26:1*] | | | | | [added: *28:1* | | | | | | | | |]
During the last twelve months, we reduced our [removed: absolute] [added: total FTE] employee headcount by [removed: 38 people in our in-market locations and increased by 304 people in total.][added: 1,132.]
We opened twelve branches and closed [removed: 125] [added: 123] branches, net of conversions, in [removed: 2019.][added: 2020.]
We activated [removed: 312] [added: 257] Onsite locations and closed [removed: 92,] [added: 106,] net of conversions, in [removed: 2019.][added: 2020.]
The number of closings reflects both normal churn in our business, whether due to [added: redefining or] exiting customer relationships, the shutting or relocation of a customer facility, or a customer decision, as well as [removed: a] [added: our ongoing] review of [removed: certain] underperforming locations.
| | | [removed: 2019] | | | [removed: 2018] | [added: 2020] | | [removed: 2017] | | [added: | | 2019 | | | | | | 2018 | | |]
| Net sales | | [added: | | | |] 100.0 | [added: |] % | | [added: | |] 100.0 | [added: |] % | | [added: | |] 100.0 | [added: |] % |
| Gross profit | | [removed: 47.2] | [added: | | | 45.5 | |] % | | [removed: 48.3] | [added: | 47.2 | |] % | | [removed: 49.3] | [added: | 48.3 | |] % |
| Operating and administrative expenses | | [removed: 27.4] | [added: | | | 25.3 | |] % | | [removed: 28.2] | [added: | 27.4 | |] % | | [removed: 29.2] | [added: | 28.2 | |] % |
| Gain on sale of property and equipment | | [added: | | | |] 0.0 | [added: |] % | | [added: | |] 0.0 | [added: |] % | | [added: | |] 0.0 | [added: |] % |
| Operating income | | [removed: 19.8] | [added: | | | 20.2 | |] % | | [removed: 20.1] | [added: | 19.8 | |] % | | [added: | |] 20.1 | [added: |] % |
| Net interest expense | | [removed: \-0.3] | [added: | | | \-0.2 | |] % | | [added: | |] \-0.3 | [added: |] % | | [removed: \-0.2] | [added: | \-0.3 | |] % |
| Earnings before income taxes | | [removed: 19.6] | [added: | | | 20.1 | |] % | | [removed: 19.9] | [added: | 19.6 | |] % | | [added: | |] 19.9 | [added: |] % |
| Note – Amounts may not foot due to rounding difference. | | | | | | | | | | [added: | | | | | | | | | | |]
| | [removed: 2019] | | [added: 2020] | | [removed: 2018] | | | [removed: 2017] | [added: 2019] | [added: | | | | | 2018 | | |]
| Net sales | [added: | |] $ | [removed: 5,333.7] [added: 5,647.3] | | | [removed: 4,965.1] | | [added: 5,333.7] | [removed: 4,390.5] | | [added: | | | 4,965.1 | | |]
| Percentage change | [removed: 7.4] | | [added: 5.9 | |] % | | [removed: 13.1] | [added: | 7.4 | |] % | | [removed: 10.8] | [added: | 13.1 | |] % |
| Business days | [removed: 254] | | [added: 255] | | [added: | | | |] 254 | | | [added: | | |] 254 | | [added: |]
| Daily sales | [added: | |] $ | [removed: 21.0] [added: 22.1] | | | [removed: 19.5] | | [added: 21.0] | [removed: 17.3] | | [added: | | | 19.5 | | |]
| Percentage change | [removed: 7.4] | | [added: 5.5 | |] % | | [removed: 13.1] | [added: | 7.4 | |] % | | [removed: 11.3] | [added: | 13.1 | |] % |
| Daily sales impact of currency fluctuations | [removed: \-0.3] | | [added: \-0.1 | |] % | | [removed: 0.1] | [added: | \-0.3 | |] % | | [added: | |] 0.1 | [added: |] % |
| Daily sales impact of acquisitions | [removed: 0.1] | | [added: 0.0 | |] % | | [removed: 0.4] | [added: | 0.1 | |] % | | [removed: 1.0] | [added: | 0.4 | |] % |
The [removed: increases] [added: increase] in net sales noted above for [removed: both] 2019 [removed: and 2018 were] [added: was] a result of higher unit sales and, to a lesser degree, higher prices.
Higher product prices [removed: were realized throughout] [added: in] 2019 [removed: and 2018 as] [added: were] a result of actions [removed: (beginning initially in late 2017)] taken to offset increases in product costs, and we believe these increases contributed 0.9% to 1.0% [removed: and 0.7%] to [removed: 0.8% to] sales growth during [removed: 2019 and 2018, respectively.][added: 2019.]
This section of this 10-K generally discusses 2020 and 2019 items and year-to-year comparisons between 2020 and 2019.
Discussions of 2018 items and year-to-date comparisons between 2019 and 2018 that are not included in this Form 10-K, can be found in 'Management's Discussion and Analysis of Financial Condition and Results of Operations' in Part II, Item 7 of our annual report on Form 10-K for the fiscal year ended December 31, 2019.
The manufacturing market includes sales of products for both original equipment manufacturing (OEM), where our products are consumed in the final products of our customers, and manufacturing, repair and operations (MRO), where are products are consumed to support the facilities and ongoing operations of our customers.
Impact of COVID-19 on Our Business
In the second quarter of 2020, the impacts of the COVID-19 pandemic on our business were dramatic in two respects.
First, local and national actions taken, such as stay-at-home mandates, reduced business activity sharply as many customers either closed their locations or operated at significantly diminished capacity.
This effect was illustrated in a significant decline in sales for our fastener products.
Second, social actions taken to mitigate the effects of the pandemic produced significant demand for personal protection equipment (PPE) and sanitation products, generating significant sales of such products not only to certain traditional customers but also to state and local government entities as well as front line responders.
This effect was illustrated by a significant increase in sales for our safety products.
During that period, improved sales of PPE and sanitation products more than offset the general economic weakness.
These dynamics affected our business throughout the second quarter of 2020, but the effects were greatest in April, with sequential improvements in May and June as business restrictions gradually eased.
The pandemic continued to have a significant impact on our business in the third and fourth quarters of 2020.
The marketplace broadly, and Fastenal specifically, continued to operate with certain modifications to balance re-opening with employee and customer safety.
However, most of the markets in which we operate began to normalize in the second half of 2020.
This improved the outlook of the manufacturing and construction customers that support our traditional branch and Onsite business and moderated the level of demand for PPE and sanitation products that we experienced at the onset of the pandemic.
We
believe that the sequential gains in economic activity that we experienced in the latter part of the second quarter of 2020 continued through the third and fourth quarters of 2020, although the rate of improvement remains gradual.
Consistent with broader social trends, we have taken steps to safeguard the health of our employees.
This includes closing branch and corporate facilities to outside personnel, adjusting work schedules to maximize social distance, creating space between work areas, providing ample PPE and cleaning supplies, having formal policies for mitigation in the event of cases of illness, utilizing technologies where work duties allow to enable work from home capabilities, and utilizing technologies such as vending and mobility to create social distancing.
Due to these precautions, our operations have continued to function effectively, including our internal controls over financial reporting.
While there are exceptions, our customers have largely continued to operate their businesses despite a continued high rate of viral infections that exist as of this date, in contrast to the second quarter of 2020 when many temporarily suspended operations.
Still, there remains significant uncertainty concerning the magnitude of the impact and duration of the COVID-19 pandemic.
Factors deriving from the COVID-19 response that have or may negatively impact sales and gross margin in the future include, but are not limited to: limitations on the ability of our suppliers to manufacture, or procure from manufacturers, the products we sell, or to meet delivery requirements and commitments; limitations on the ability of our employees to perform their work due to illness caused by the pandemic or local, state, or federal orders requiring employees to remain at home; limitations on the ability of carriers to deliver our products to customers; limitations on the ability of our customers to conduct their business and purchase our products and services; and limitations on the ability of our customers to pay us on a timely basis.
With respect to liquidity, as of the end of 2020, we have substantially all of our $700.0 bank revolver available for use in the event that the need arises.
We will continue to actively monitor the situation and may take further actions that alter our business operations as may be required by federal, state, or local authorities or that we determine are in the best interests of our employees, customers, suppliers, and shareholders.
While we are unable to determine or predict the nature, duration, or scope of the overall impact the COVID-19 pandemic will have on our business, results of operations, liquidity, or capital resources, we believe that it is important to share where our company stands today, how our response to COVID-19 is progressing, and how our operations and financial condition may change as the fight against COVID-19 progresses.
Net sales increased $313.7, or 5.9%, in 2020 relative to 2019.
Although we continued to market our growth drivers in 2020, COVID-19 created an environment that was not conducive to the level of signings we would have expected under normal business conditions.
At the same time, significant resources shifted to focus on rapidly and efficiently securing, transporting, and providing PPE to new and existing customers that found themselves managing short-term crisis conditions brought on by the pandemic.
These dynamics produced signings of just 223 new Onsite customer locations and 16,417 new industrial vending devices in 2020.
Those same dynamics also produced very strong daily sales growth of 51.0% in our safety product line and 129.7% from government and healthcare customers in the period, which more than offset the low growth driver signings and weak activity in our traditional manufacturing and construction customer base.
| | | | | | | | | | | | | | | | | | |
| --- | --- | --- | --- | --- | --- | --- | --- | --- | --- | --- | --- | --- | --- | --- | --- | --- | --- |
| In-market locations - FTE employee headcount | | | 11,260 | | | | | | 12,236 | | | | | | \-8.0 | | % |
| Total FTE employee headcount | | | 17,836 | | | | | | 18,968 | | | | | | \-6.0 | | % |
| | | | | | | | | | | | | | | | | | |
| *Ratio of in-market location FTE headcount to in-market locations* | | | 3:1 | | | | | | *4:1* | | | | | | | | |
This reflects a decline in our in-market FTE employee headcount of 976, as well as declines in headcount at our distribution centers and manufacturing operations.
These reductions are primarily related to efforts to manage expenses in response to weaker demand from traditional manufacturing and construction customers resulting from the COVID-19 pandemic.
This was only partly offset by additions in non-branch selling and support roles.
The manufacturing market includes both OEM and MRO customers.
Net sales increased $368.6, or 7.4%, in 2019 relative to 2018.
Discrete tax items benefited net earnings by $7.1 in 2018.
We continued to focus on our growth drivers in 2019.
Daily sales to our national account customers (defined as customer accounts with a multi-site contract) grew 11.9% in the period.
Additionally, we signed 362 new Onsite customer locations (defined as dedicated sales and service provided from within, or in close proximity to, the customer's facility) and 21,857 new industrial vending devices.
We experienced sales growth in the mid-teens through both our vending devices and our Onsite locations (excluding sales transferred from a branch).
| | | | | | | | | |
| --- | --- | --- | --- | --- | --- | --- | --- | --- |
The reduction in our absolute employee headcount in our in-market locations reflects actions taken by leadership in our public branches over the past couple of quarters to control expenses in response to weaker demand, which was only partly offset by increases to support growth in our number of Onsite locations.
The increase in our total absolute employee headcount is mostly from additions we have made to support customer acquisition, implementation, and growth in the field, particularly as it relates to our growth drivers and to support general corporate and hub functions.
| | | | | | | | | | |
| --- | --- | --- | --- | --- | --- | --- | --- | --- | --- |
Price increases were not a material factor in 2017.
The first is higher underlying market demand, which we believe is reflected in a number of metrics.
For instance, the U.S. Purchasing Managers Index, published by the Institute for Supply Chain Management, averaged 51.2 in 2019 and 58.8 in 2018.
Readings above 50 are indicative of growing demand, and we believe these levels are consistent with the sales growth rates we experienced in the respective periods.
In addition, U.S. Industrial Production, which is published by the Federal Reserve, increased 0.8% in 2019 and increased 3.9% in 2018.
We also experienced growth in sales to 75 of our top 100 customers in 2019, which compares to growth in sales to 84 of our top 100 customers in 2018.
For instance, the U.S. Purchasing Managers Index averaged 55.4 in the first quarter of 2019 but averaged 47.9 in the fourth quarter of 2019.
We signed 22,073 industrial vending devices during 2018, an increase of 14.0% over 2017.
In addition to an increase in our installed base, we achieved a low-single digit increase in average sales per device.
These variables combined to generate sales growth through our vending devices in excess of 20% in 2018.
We signed 336 new Onsite locations in 2018, an increase of 24.4% over 2017, and had 894 active sites on December 31, 2018, an increase of 47.8% over December 31, 2017.
We signed 152 new national account contracts in 2018.
The contribution of these new contracts and strong penetration of existing national account customers resulted in daily sales from our national account customers growing 18.1% in 2018 compared to 2017.
We signed 19,355 industrial vending devices during 2017, an increase of 7.2% over 2016.
In addition to an increase in our
installed base, we were also more efficient with the existing base, resulting in a modest increase in average sales per device and
a decrease in our device removals of 3.8%.
Combined sales through our vending devices accelerated throughout 2017, finishing
with growth in the high teens.
We signed 270 new Onsite locations in 2017, an increase of 53.4% over 2016, and had 605 active
sites on December 31, 2017, an increase of 50.9% over December 31, 2016.
We signed 168 new national account contracts in
2017.
The contribution of these new contracts and strong penetration of existing national account customers resulted in daily
sales from our national account customers growing 14.5% in 2017 compared to 2016.
| | | | | | |
| --- | --- | --- | --- | --- | --- |
An excerpt. Shown here: 40 of 191 rewritten, 40 of 232 added and 40 of 143 removed. The counts are complete. For every sentence, read Item 7. MANAGEMENT'S DISCUSSION AND ANALYSIS OF FINANCIAL CONDITION AND RESULTS OF OPERATIONS in the FY2020 filing and the FY2019 filing.
Item 7A. QUANTITATIVE AND QUALITATIVE DISCLOSURES ABOUT MARKET RISKS
5 rewritten, 7 added, 8 removed, 15 unchanged
In [removed: 2019,] [added: 2020,] changes in foreign currency exchange rates reduced our reported net sales by [removed: $14.8] [added: $5.7] with the estimated effect on our net earnings being immaterial.
During 2019, the price of commodity steel as reflected in many market indexes [removed: has] declined.
In [removed: 2019,] [added: 2020,] our estimated net earnings exposure for commodity energy prices was immaterial.
A one percentage point increase in LIBOR in [removed: 2019] [added: 2020] would have resulted in approximately [removed: $3.2] [added: $1.3] of additional interest expense.
A description of our Credit Facility is contained in Note [removed: 9] [added: 10] of the Notes to Consolidated Financial Statements.
During 2020, the price of commodity steel as reflected in many market indexes fell sharply early in the year as business activity declined in response to actions to address the COVID-19 pandemic, recovered sharply as business activity rebounded, and finished 2020 above the preceding year end levels.
Prices for gasoline and diesel were mostly lower over the course of 2020 as business activity declined in response to actions to address the COVID-19 pandemic.
As a result, we experienced lower fuel costs through most of 2020.
In 2019, prices for gasoline and diesel were stable in the early part of the year, but began to decline in the latter part of the year with slowing economic activity.
As a result, we experienced stable fuel costs through 2019.
Although fuel prices were lower through much of 2020, we experienced stable, not lower, prices for products with high chemical or plastic content.
Stable fuel costs in 2019 resulted in stable product costs.
During 2018, we experienced inflation in the cost of steel products.
During 2017, we experienced some inflation in the cost of steel products.
Prices for gasoline and diesel were mostly stable over the course of 2019, resulting in our fuel costs being similarly stable during the period.
This carried over from the latter part of 2018 when the costs of these commodities began to ease.
However, through most of 2018 the prices of these commodities increased, resulting in higher fuel costs for our hub and field-based vehicles and utility costs for our in-market locations, distribution centers, and manufacturing facilities in the period.
As a result, rising costs for these commodities resulted in higher costs for many of these products.
| | |
| --- | --- |
Item 1. BUSINESS
131 rewritten, 217 added, 68 removed, 127 unchanged
The year end is December 31, [removed: 2019] [added: 2020] unless additional years are included or noted.
At the end of [removed: 2019,] [added: 2020,] we had [removed: 3,228] [added: 3,268] in-market locations (defined in the table below) in 25 countries supported by 15 distribution centers in North America (12 in the United States, two in Canada, and one in Mexico), and [added: one in Europe, and] we employed [removed: 21,948] [added: 20,365] people.
The following table shows our consolidated net sales for each [added: of the last ten] fiscal [removed: year as well as] [added: years;] the number of [removed: public branches, Onsite locations,] [added: branch, Onsite,] and total in-market locations at the end of each of the last ten [removed: years:][added: fiscal years; their respective sales, as well as the average monthly sales per location that were generated from our branch and Onsite locations; and our revenue generated from non-traditional sources:]
| | [removed: 2019] | | [added: 2020] | [added: | | 2019 | | |] 2018 | | [added: |] 2017 | | [added: |] 2016 | | [added: |] 2015 | | [added: |] 2014 | | [added: |] 2013 | | [added: |] 2012 | | [removed: 2011] | [added: 2011] | [removed: 2010] | |
| Net sales | [added: | |] $ | [removed: 5,333.7] [added: 5,647.3] | | [added: 5,333.7 | | |] 4,965.1 | | [added: |] 4,390.5 | | [added: |] 3,962.0 | | [added: |] 3,869.2 | | [added: |] 3,733.5 | | [added: |] 3,326.1 | | [added: |] 3,133.6 | | [removed: 2,766.9] | [added: 2,766.9] | [removed: 2,269.5] | |
| Public branches | [removed: 2,114] | | [added: 2,003] | [added: | | 2,114 | | |] 2,227 | | [added: |] 2,383 | | [added: |] 2,503 | | [added: |] 2,622 | | [added: |] 2,637 | | [added: |] 2,687 | | [added: |] 2,652 | | [removed: 2,585] | [added: 2,585] | [removed: 2,490] | |
| Onsite [removed: locations(1)] [added: locations(3)] | [removed: 1,114] | | [added: 1,265] | [added: | | 1,114 | | |] 894 | | [added: |] 605 | | [added: |] 401 | | [added: |] 264 | | [added: |] 214 | | | | | | | | | | [added: | |]
| Total in-market [removed: locations(2)] [added: locations(5)] | [removed: 3,228] | | [added: 3,268] | [added: | | 3,228 | | |] 3,121 | | [added: |] 2,988 | | [added: |] 2,904 | | [added: |] 2,886 | | [added: |] 2,851 | | [added: |] 2,687 | | [added: |] 2,652 | | [removed: 2,585] | [added: 2,585] | [removed: 2,490] | |
[removed: (1)] [added: (3)] Onsite [removed: location] information prior to 2014 is intentionally omitted.
[removed: (2)] [added: (5)] 'In-market locations' is defined as the sum of the total number of public branches and the total number of Onsite locations.
[removed: One] [added: This structure has evolved over time as a result] of [added: one of] Fastenal's guiding principles since [removed: inception is] [added: inception:] that we can improve our service by getting closer to the customer.
Through much of our history, this was achieved by opening branches, and more [removed: recently] [added: recently,] through new Onsite locations.
[removed: In 2019, roughly 53% of our sales and 53% of our in-market locations were in major Metropolitan Statistical] Areas [removed: ('MSAs'; populations] [added: (MSAs); (populations] in the United States and Canada greater than 500,000 people), while [removed: 19%] [added: 20%] of our sales and [removed: 17%] [added: 18%] of our in-market locations were in small MSAs (populations under 500,000 people), and [removed: 28%] [added: 26%] of our sales and 30% of our in-market locations were not in an MSA.
[removed: Branches] [added: Maintaining operations that are physically proximate to our customers' operations] have represented, and continue to represent, the foundation of our service approach.
[removed: Branch locations] [added: Locations] are selected primarily based on their proximity to our distribution network, population statistics, and employment data for manufacturing and non-residential construction companies.
[added: We stock all branches with inventory drawn] from all of our product lines, and over time, where appropriate, our district and branch personnel may tailor the inventory offering to the needs of the local customer base.
Since Fastenal's founding and through 2013, [added: traditional] branch openings were a primary growth driver for the company, and we experienced net openings each year over that time span.
However, [removed: since establishing this figure,] new growth [removed: drivers] [added: drivers, business models,] and business [removed: models] [added: tools] (Onsite, vending, digital solutions) have emerged and diminished the direct role of traditional branch openings in our growth.
However, in each year since 2013, the company has experienced a net decline in its total branch count including net declines of [removed: 113] [added: 111] branches in [removed: 2019, 156] [added: 2020, 113] branches in [removed: 2018,] [added: 2019,] and [removed: 120] [added: 156] branches in [removed: 2017.][added: 2018.]
[removed: Onsite locations] [added: Onsite locations] may influence the trend in [removed: total] [added: our traditional] branch count over time, but are not the primary reason for our [added: traditional] branch closings.
[removed: However, we identified it as a growth driver in 2014 and] [added: We] have made substantial investments toward accelerating its traction in the marketplace since 2015.
In this model, we [added: provide dedicated sales and] service [added: to] a [added: single] customer from a location that is physically within the [removed: customer's] [added: customers'] facility (or, in some cases, at a strategically placed off-site location), with inventory that is specific to the [removed: customer's] [added: customers'] needs.
In many cases, we are shifting revenue with the customer from an existing [removed: branch,] [added: branch location,] though we are beginning to see more new customer opportunities arise as a result of our Onsite capabilities.
It has been our experience that [removed: gross profit percentages] [added: sales mix] at [added: our] Onsite locations [removed: tend to be] [added: produces a] lower [added: gross profit percentage] than at [removed: branches,] [added: our branch locations,] but we gain [removed: significant] revenue with the customer and our cost to serve is [removed: materially] lower.
We have identified over 15,000 [added: manufacturing and construction] customer locations [added: in the United States] with potential to implement the Onsite service model.
[removed: We experienced net increases of 220, 289, and 204 Onsite locations in] [added: 2020,] 2019, [removed: 2018,] and [removed: 2017,] [added: 2018,] respectively, and signed [added: 223,] 362, [removed: 336,] and [removed: 270] [added: 336] new Onsite locations in [added: 2020,] 2019, [removed: 2018,] and [removed: 2017,] [added: 2018,] respectively.
Since then, we have continued to expand our global footprint and at the end of [removed: 2019,] [added: 2020,] we operated in [removed: 24] [added: 23] countries outside of the United [removed: States.][added: States and Canada.]
[removed: Canada and] Mexico [removed: are] [added: is] the largest of these, [removed: representing approximately 11% of total sales collectively,] and we also operate in Europe, Asia, and Central and South America.
Our go-to-market strategy in countries outside of [removed: North America] [added: the United States and Canada] focuses primarily on servicing large, national account [removed: customers.][added: customers disproportionately concentrated in manufacturing.]
From a product perspective, these customers are more heavily oriented toward planned fastener [removed: spend.][added: spend, though non-fastener MRO spend is becoming more common in these markets.]
[removed: Though] [added: Despite strong growth] in [removed: recent years the] [added: our] international business [removed: has been growing faster than the U.S. business,] [added: in recent years,] we are not as well recognized in many of our [removed: foreign] locations [added: outside of the U.S. and Canada] as we are in the U.S. [removed: and, to a lesser extent,] [added: and] Canada.
However, our ability to provide a consistent service model, including vending, bin stocks, and Onsites, on a global basis is attractive to our foreign customer base, much of which are the foreign operations of [removed: U.S.-based] [added: North American-based] companies.
| | [added: | |] North America | | | | | | | | | | | [added: | | | |] Outside North America | | | | | | | | | | | | [added: | | |]
| | [added: | |] United States | | [added: |] Canada | | [removed: Mexico] | [added: Mexico & Caribbean (1)] | [removed: Puerto Rico and Dominican Republic] | | Subtotal | | | [added: | | |] Central & South America [removed: (1) | | Asia] (2) | | [removed: Europe] [added: | Asia] (3) | | [removed: Africa] [added: | Europe] (4) | | [added: |] Subtotal | | [added: |] Total | | [added: |]
| Opened Branches | [removed: 2] | | 1 | | [removed: —] | [added: 1] | [removed: —] | | [removed: 3] [added: 5] | | | [removed: —] [added: 7] | | [removed: —] | | [removed: 8] | | — | | [removed: 8] | [added: 1] | [removed: 11] | | [added: 4 | | | 5 | | | 12 | | |]
| [removed: Ending] [added: Starting] Branches [removed: - 2018] | [added: | |] 1,924 | | [added: |] 186 | | [removed: 52] | [added: 60] | [removed: 8] | | 2,170 | | | [added: | | |] 6 | | [added: |] 14 | | [removed: 37] | [added: 37] | [removed: —] | | 57 | | [added: |] 2,227 | | [added: |]
| Closed/Converted Onsites (5) | [removed: (26] | [removed: )] | [removed: (3] [added: (78)] | [removed: )] | [removed: 1] | [added: (7)] | [removed: —] | | [removed: (28] [added: (7)] | [removed: )] | | [removed: —] [added: (92)] | | [removed: (1] | [removed: )] | [added: | | (1) | | | 1 | | |] — | | [added: |] — | | [removed: (1] | [removed: )] [added: (92)] | [removed: (29] | [removed: )] |
| [removed: Ending] [added: Starting] Onsites [removed: - 2018] | [added: | |] 732 | | [added: |] 60 | | [removed: 66] | [added: 73] | [removed: 7] | | 865 | | | [added: | | |] 8 | | [added: |] 9 | | [removed: 12] | [added: 12] | [removed: —] | | 29 | | [added: |] 894 | | [added: |]
| In-Market Locations - [removed: 2018] [added: 12/31/18] | [added: | |] 2,656 | | [added: |] 246 | | [removed: 118] | [added: 133] | [removed: 15] | | 3,035 | | | [added: | | |] 14 | | [added: |] 23 | | [removed: 49] | [added: 49] | [removed: —] | | 86 | | [added: |] 3,121 | | [added: |]
| Opened Branches | [removed: 1] | | [removed: 1 |] [added: —] | [removed: 5] | | — | | [removed: 7] | [added: 3] | | [removed: —] | [added: 3] | [removed: 1] | | [removed: 4] | | [added: |] — | | [added: |] 5 | | [added: | 4 | | | 9 | | |] 12 | | [added: |]
Our Channels to Market
We engage our customers primarily through branch and Onsite locations.
Branches and Onsites exist very close to our customers, usually within miles in the case of the former and most often within our customers' physical locations in the case of the latter, and together constitute our ‘in-market’ network.
Many of our customers engage with us through e-commerce, but most of our sales through this channel are with customers that use e-commerce to supplement our service through our other channels.
| | | | | | | | | | | | | | | | | | | | | | | | | | | | | | | | | |
| --- | --- | --- | --- | --- | --- | --- | --- | --- | --- | --- | --- | --- | --- | --- | --- | --- | --- | --- | --- | --- | --- | --- | --- | --- | --- | --- | --- | --- | --- | --- | --- | --- |
| Branch revenue(1) | | | $ | 3,587.1 | | 3,660.1 | | | 3,625.8 | | | 3,399.6 | | | 3,198.1 | | | 3,281.8 | | | 3,225.3 | | | | | | | | | | | |
| Average sales per branch location(2) | | | $ | 145.2 | | 140.5 | | | 131.1 | | | 116.0 | | | 104.0 | | | 104.0 | | | 101.0 | | | | | | | | | | | |
| Onsite revenue(1) | | | $ | 1,485.6 | | 1,391.7 | | | 1,081.7 | | | 770.2 | | | 569.2 | | | 454.3 | | | 387.7 | | | | | | | | | | | |
| Average sales per Onsite location(2) | | | $ | 104.1 | | 115.5 | | | 120.3 | | | 127.6 | | | 142.7 | | | 158.4 | | | 157.6 | | | | | | | | | | | |
| Other revenue(4) | | | $ | 574.6 | | 281.9 | | | 257.6 | | | 220.7 | | | 194.7 | | | 133.1 | | | 120.5 | | | | | | | | | | | |
(1) Revenues attributable to our traditional and international branch locations, and our Onsite locations, respectively.
(2) Average sales per month considers the average active base of branches and Onsites, respectively, in the given year, factoring in the beginning and ending location count, divided by total revenues attributable to our branch and Onsite locations, further divided by twelve months, respectively.
This information is presented in thousands.
(4) This portion of revenue is generated outside of our traditional in-market location presence, examples of which include our custom in-house manufacturing, revenues arising from our leased locker arrangements, and other non-traditional sources of revenue.
In 2020, roughly 54% of our sales and 52% of our in-market locations were in major Metropolitan Statistical
We have two primary versions of our branch locations:
1.) A 'traditional branch' typically services a wide variety of customers, including our larger national and regional accounts as well as retail customers.
Traditional branches were entirely U.S.-based until 1994, when we opened our first location in Canada.
At the end of 2020, we had 1,868 traditional branches in the United States and Canada, and they represented 58.6% of total sales.
Traditional branches are also differentiated by their operating styles.
Certain locations are Customer Service Branches (CSBs), which tend to feature a showroom, regular hours during which it is open to the public, and our standard stocking model of products designed for contractors.
CSBs are similar in function to a hardware store and they often conduct some business with non-account or retail-like customers.
However, this customer set typically represents less than 10% of sales at this type of location.
Other locations operate as Customer Fulfillment Centers (CFCs), which tend to feature a limited showroom, reduced hours of access to the public, greater usage of will-call, and stock customer-specific inventory.
These tend to appear and function more like an industrial supply house and stocking location and tend not to have transactions with non-account or retail-like customers unless it is a will call arrangement related to an online transaction.
The choice of operating style is made by local leadership and is based on local market considerations.
2.) An 'international branch' is the format we typically deploy outside the United States and Canada.
We first expanded outside of the United States and Canada when we opened a branch in Mexico in 2001.
At the end of 2020, we had 135 international branches operating outside the U.S. and Canada, and they represented 4.9% of total sales.
Traditional and international branches sell to multiple customers.
Our total decline since 2013 is 684 branches.
However, it was largely a local option that grew slowly before we identified it as a growth driver in 2014.
However, as awareness of our capabilities has grown, we have identified additional Onsite potential with certain agencies of state, provincial and local government customers and academia.
We also believe as we follow our existing national account customers outside the United States our market potential for Onsite solutions will continue to expand.
The international opportunity is substantial, but our speed is limited by the relatively underdeveloped infrastructure in comparison to the United States.
We experienced net increases of 151, 220, and 289 Onsite locations in
We had 1,265 Onsite locations as of December 31, 2020, and they represented 26.3% of total sales.
We believe the marketplace can support 375 to 400 new Onsite signings annually, and our goal in 2021 is to sign that many locations.
However, we recognize that achieving the goal will be challenging, as the continued prevalence of COVID-19 infections has made gaining access to customer facilities and decision-makers difficult.
| | | | | | | | | | | | | | | | | | | | | | |
| --- | --- | --- | --- | --- | --- | --- | --- | --- | --- | --- | --- | --- | --- | --- | --- | --- | --- | --- | --- | --- | --- |
However, we are constantly evaluating the efficacy of our branch network and, in recent years, we have developed additional models that get us still closer to the customer, including vending, bin stocks, and Onsite locations.
We currently have several versions of selling locations: (1) a 'traditional (or public) branch' typically services a wide variety of customers and stocks a wide selection of products we offer, both as part of our standard stocking model and tailored to specific customer needs, (2) an 'overseas branch' focuses on manufacturing customers and our fastener product line (though non-fasteners are becoming more common in these markets) and is the format we typically deploy outside the United States and Canada, and (3) an 'Onsite location' provides dedicated sales and service from within, or in close proximity to, the customer's facility.
Traditional and overseas branches sell to multiple customers, and together comprise the majority of our total selling locations.
Onsite locations, which serve a single customer, are not included in our total branch counts.
However, outside of the fact that they serve a single customer, we believe the function and operation of an Onsite location is similar to that of a branch.
This model also represents a meaningful portion of the company's total revenue, and we expect that share to grow materially over time.
As a result, we refer to our network in terms of in-market locations, which includes our total branches and Onsite locations.
We stock all branches with inventory drawn
We have long maintained that marketplace demographics could support a North American network of 3,500 traditional branches.
It is now unlikely that we will operate the total traditional branch locations we previously believed would be the potential of North America.
We had 1,114 Onsite locations as of December 31, 2019, and anticipate signing 375 to 400 new Onsite locations in 2020.
We first went international when we opened a branch in Canada in 1994.
This remaining international business is approximately 3% of total sales.
Our international subsidiaries now have 479 in-market locations, including 179 Onsite locations, have over 11,800 vending devices installed, and employ over 3,600 people from around the world.
| | | | | | | | | | | | | | | | | | | | | | | | |
| --- | --- | --- | --- | --- | --- | --- | --- | --- | --- | --- | --- | --- | --- | --- | --- | --- | --- | --- | --- | --- | --- | --- | --- |
| In-Market Locations - 2017 | 2,561 | | 238 | | 104 | | 13 | | 2,916 | | | 13 | | 23 | | 34 | | 2 | | 72 | | 2,988 | |
| Starting Branches - 2017 | 2,076 | | 195 | | 53 | | 8 | | 2,332 | | | 6 | | 14 | | 29 | | 2 | | 51 | | 2,383 | |
| Closed/Converted Branches (5) | (154 | ) | (10 | ) | (1 | ) | — | | (165 | ) | | — | | — | | — | | (2 | ) | (2 | ) | (167 | ) |
| Starting Onsites - 2017 | 485 | | 43 | | 51 | | 5 | | 584 | | | 7 | | 9 | | 5 | | — | | 21 | | 605 | |
| Opened Onsites | 273 | | 20 | | 14 | | 2 | | 309 | | | 1 | | 1 | | 7 | | — | | 9 | | 318 | |
| Starting Branches - 2018 | 1,924 | | 186 | | 52 | | 8 | | 2,170 | | | 6 | | 14 | | 37 | | — | | 57 | | 2,227 | |
| Starting Onsites - 2018 | 732 | | 60 | | 66 | | 7 | | 865 | | | 8 | | 9 | | 12 | | — | | 29 | | 894 | |
(4) South Africa
We introduced industrial vending in 2008.
streamline the supply chain where it has been utilized.
We anticipate signing 22,000 to 24,000 new devices in 2020.
The following two tables provide two views of our data: (1) actual device count regardless of the type of device and (2) 'machine equivalent' count based on the weighted target monthly revenue of each device (compared to the FAST 5000 device, which has a $2,000 monthly revenue target).
The industrial vending (product revenue devices) information related to contracts signed during each period was as follows:
| | | | | | | | | | | | | | | | | |
| --- | --- | --- | --- | --- | --- | --- | --- | --- | --- | --- | --- | --- | --- | --- | --- | --- |
| | 2017 | | 5,437 | | | 4,881 | | | 4,771 | | | 4,266 | | | 19,355 | |
| | 2017 | | 4,476 | | | 4,032 | | | 4,010 | | | 3,640 | | | 16,158 | |
The industrial vending (product revenue devices) information related to installed devices at the end of each period was as follows:
| | | | | | | | | | | | | | | | |
| --- | --- | --- | --- | --- | --- | --- | --- | --- | --- | --- | --- | --- | --- | --- | --- |
| | | | Q1 | | | Q2 | | | Q3 | | | Q4 | | | |
| | 2017 | | 64,430 | | | 66,577 | | | 69,058 | | | 71,421 | | | |
An excerpt. Shown here: 40 of 131 rewritten, 40 of 217 added and 40 of 68 removed. The counts are complete. For every sentence, read Item 1. BUSINESS in the FY2020 filing and the FY2019 filing.
Item 3. LEGAL PROCEEDINGS
1 rewritten, 0 added, 2 removed, 0 unchanged
A description of our legal proceedings, if any, is contained in [removed: Note 10] [added: [Note](#ife810274569f4b179a477e3c078b570c_139) [1](#ife810274569f4b179a477e3c078b570c_139)[1](#ife810274569f4b179a477e3c078b570c_139)] of the Notes to Consolidated Financial Statements.
| | |
| --- | --- |
Cover and table of contents
46 rewritten, 21 added, 14 removed, 42 unchanged
[removed: FORM 10-K][added: FORM 10-K]
| ☒ | [added: | |] Annual report pursuant to Section 13 or 15(d) of the Securities Exchange Act of 1934 | [added: | |]
For the fiscal year [removed: ended December] [added: ended December] 31, [removed: 2019][added: 2020]
| ☐ | [added: | |] Transition report pursuant to Section 13 or 15(d) of the Securities Exchange Act of 1934 | [added: | |]
| | [added: | |] For the transition period from to | [added: | |]
Commission file [removed: number 0-16125][added: number 0-16125]
| Minnesota | | [added: | | | |] 41-0948415 | [added: | |]
| [removed: (State] [added: (State] or other jurisdiction of incorporation or [removed: organization)] [added: organization)] | | [removed: (I.R.S.] [added: | | | | (I.R.S.] Employer Identification [removed: No.)] [added: No.)] | [added: | |]
[added: | | | |] 2001 Theurer [removed: Boulevard, Winona, Minnesota] [added: Boulevard, Winona, Minnesota | | | | | |] 55987-1500 [added: | | | | | |]
[removed: (Address] [added: | | | | (Address] of principal executive offices) [added: | | | | | |] (Zip [removed: Code)][added: Code) | | | | | |]
[removed: (507) 454-5374][added: (507) 454-5374]
[removed: (Registrant's] [added: (Registrant's] telephone number, including area [removed: code)][added: code)]
| Title of each class | [added: | |] Trading Symbol(s) | [added: | |] Name of each exchange on which registered | [added: | |]
| Common stock, par value $.01 per share | [added: | |] FAST | [added: | |] The Nasdaq Stock Market LLC | [added: | |]
| Large Accelerated Filer | | [added: | | | |] x | | [added: | | | |] Accelerated Filer | | [added: | | | |] ☐ | [added: | |]
| Non-accelerated Filer | | [added: | | | |] ☐ | | [added: | | | |] Smaller Reporting Company | | [added: | | | |] ☐ | [added: | |]
| | | | | [added: | | | | | | | |] Emerging Growth Company | | [added: | | | |] ☐ | [added: | |]
The aggregate market value of the Common Stock held by non-affiliates of the registrant as of June [removed: 28, 2019,] [added: 30, 2020,] the last business day of the registrant's most recently completed second fiscal quarter, was [removed: $18,623,405,521,] [added: $24,488,427,338,] based on the closing price of the registrant's Common Stock on that date.
For purposes of determining this number, all executive officers and directors of the registrant as of June [removed: 28, 2019] [added: 30, 2020] are considered to be affiliates of the registrant.
As of January 22, [removed: 2020,] [added: 2021,] the registrant had [removed: 574,226,297] [added: 574,317,276] shares of Common Stock issued and outstanding.
| | | | [added: | | | | | |] Page | [added: | |]
| Item 1. | | [removed: [Business](#s9BF7D381B1C657F9B19D62AEE62D85CD)] | [removed: [3](#s9BF7D381B1C657F9B19D62AEE62D85CD)] | [added: | | [Business](#ife810274569f4b179a477e3c078b570c_22) | | | [3](#ife810274569f4b179a477e3c078b570c_22) | | |]
| Item 1A. | | [added: | | | |] [Risk [removed: Factors](#s400248D7101156ACB0BA3E036DA44854)] [added: Factors](#ife810274569f4b179a477e3c078b570c_25)] | [removed: [12](#s400248D7101156ACB0BA3E036DA44854)] | [added: | [15](#ife810274569f4b179a477e3c078b570c_25) | | |]
| Item 1B. | | [added: | | | |] [Unresolved Staff [removed: Comments](#sD5430118A3295F729D56FE30AC701A6C)] [added: Comments](#ife810274569f4b179a477e3c078b570c_28)] | [removed: [17](#sD5430118A3295F729D56FE30AC701A6C)] | [added: | [21](#ife810274569f4b179a477e3c078b570c_28) | | |]
| Item 2. | | [removed: [Properties](#s29D8E6ABDE2056CCB589C974890FD1A2)] | [removed: [18](#s29D8E6ABDE2056CCB589C974890FD1A2)] | [added: | | [Properties](#ife810274569f4b179a477e3c078b570c_31) | | | [22](#ife810274569f4b179a477e3c078b570c_31) | | |]
| Item 3. | | [added: | | | |] [Legal [removed: Proceedings](#s4CB514CFAE185C53AF5EDE86D730D994)] [added: Proceedings](#ife810274569f4b179a477e3c078b570c_34)] | [removed: [19](#s4CB514CFAE185C53AF5EDE86D730D994)] | [added: | [23](#ife810274569f4b179a477e3c078b570c_34) | | |]
| Item 4. | | [added: | | | |] [Mine Safety [removed: Disclosures](#s861273FAA4805B0988D03982A99F71B6)] [added: Disclosures](#ife810274569f4b179a477e3c078b570c_37)] | [removed: [19](#s861273FAA4805B0988D03982A99F71B6)] | [added: | [23](#ife810274569f4b179a477e3c078b570c_37) | | |]
| Item 5. | | [added: | | | |] [Market for Registrant's Common Equity, Related Stockholder Matters, and Issuer Purchases of Equity [removed: Securities](#sCF5B52A151A959FA85B400F6A19A3242)] [added: Securities](#ife810274569f4b179a477e3c078b570c_43)] | [removed: [20](#sCF5B52A151A959FA85B400F6A19A3242)] | [added: | [24](#ife810274569f4b179a477e3c078b570c_43) | | |]
| Item 6. | | [added: | | | |] [Selected Financial [removed: Data](#s6C48289F4A7953DE8665586EBE7FDAAD)] [added: Data](#ife810274569f4b179a477e3c078b570c_46)] | [removed: [21](#s6C48289F4A7953DE8665586EBE7FDAAD)] | [added: | [25](#ife810274569f4b179a477e3c078b570c_46) | | |]
| Item 7. | | [added: | | | |] [Management's Discussion and Analysis of Financial Condition and Results of [removed: Operations](#s489014B0BCE85C5E8379B454995AD09F)] [added: Operations](#ife810274569f4b179a477e3c078b570c_49)] | [removed: [22](#s489014B0BCE85C5E8379B454995AD09F)] | [added: | [26](#ife810274569f4b179a477e3c078b570c_49) | | |]
| Item 7A. | | [added: | | | |] [Quantitative and Qualitative Disclosures About Market [removed: Risks](#s95FF50AD01B250D6BF92AF726A081ADC)] [added: Risks](#ife810274569f4b179a477e3c078b570c_73)] | [removed: [36](#s95FF50AD01B250D6BF92AF726A081ADC)] | [added: | [41](#ife810274569f4b179a477e3c078b570c_73) | | |]
| Item 8. | | [added: | | | |] [Financial Statements and Supplementary [removed: Data](#sFFD11A85CAAD5DC0B3585DF3DEE75DA9)] [added: Data](#ife810274569f4b179a477e3c078b570c_76)] | [removed: [37](#sFFD11A85CAAD5DC0B3585DF3DEE75DA9)] | [added: | [42](#ife810274569f4b179a477e3c078b570c_76) | | |]
| Item 9. | | [added: | | | |] [Changes in and Disagreements with Accountants on Accounting and Financial [removed: Disclosure](#s9028A471C0AC5DE399AFC75F24F70114)] [added: Disclosure](#ife810274569f4b179a477e3c078b570c_148)] | [removed: [57](#s9028A471C0AC5DE399AFC75F24F70114)] | [added: | [64](#ife810274569f4b179a477e3c078b570c_148) | | |]
| Item 9A. | | [added: | | | |] [Controls and [removed: Procedures](#s8543DFC10C175853A3C7CB568E740C7C)] [added: Procedures](#ife810274569f4b179a477e3c078b570c_151)] | [removed: [57](#s8543DFC10C175853A3C7CB568E740C7C)] | [added: | [64](#ife810274569f4b179a477e3c078b570c_151) | | |]
| Item 9B. | | [added: | | | |] [Other [removed: Information](#sF2E9C7FBF4015E25A741A3F49A45037C)] [added: Information](#ife810274569f4b179a477e3c078b570c_154)] | [removed: [58](#sF2E9C7FBF4015E25A741A3F49A45037C)] | [added: | [65](#ife810274569f4b179a477e3c078b570c_154) | | |]
| | | [added: | | | |] [PART [removed: III](#sE7E4259123C85F99A88747FF4C615DA7)] [added: III](#ife810274569f4b179a477e3c078b570c_157)] | | [added: | | | |]
| Item 10. | | [added: | | | |] [Directors, Executive Officers, and Corporate [removed: Governance](#s2FDC920D4D285E859706CB58335218EE)] [added: Governance](#ife810274569f4b179a477e3c078b570c_160)] | [removed: [58](#s2FDC920D4D285E859706CB58335218EE)] | [added: | [65](#ife810274569f4b179a477e3c078b570c_160) | | |]
| Item 11. | | [added: | | | |] [Executive [removed: Compensation](#sEC068CEB13FC5476A10DF7E2463644D4)] [added: Compensation](#ife810274569f4b179a477e3c078b570c_163)] | [removed: [60](#sEC068CEB13FC5476A10DF7E2463644D4)] | [added: | [67](#ife810274569f4b179a477e3c078b570c_163) | | |]
| Item 12. | | [added: | | | |] [Security Ownership of Certain Beneficial Owners and Management and Related Stockholder [removed: Matters](#s5F2BAA0CC7F650D9A7845976BE63BD5E)] [added: Matters](#ife810274569f4b179a477e3c078b570c_166)] | [removed: [60](#s5F2BAA0CC7F650D9A7845976BE63BD5E)] | [added: | [67](#ife810274569f4b179a477e3c078b570c_166) | | |]
| Item 13. | | [added: | | | |] [Certain Relationships and Related Transactions, and Director [removed: Independence](#s4C459ED4F75B53499609DB2D6BFAA6E8)] [added: Independence](#ife810274569f4b179a477e3c078b570c_169)] | [removed: [60](#s4C459ED4F75B53499609DB2D6BFAA6E8)] | [added: | [67](#ife810274569f4b179a477e3c078b570c_169) | | |]
| | | | | | |
| --- | --- | --- | --- | --- | --- |
| | | | | | |
| --- | --- | --- | --- | --- | --- |
| | | | | | | | | |
| --- | --- | --- | --- | --- | --- | --- | --- | --- |
| | | | | | | | | | | | | | | |
| --- | --- | --- | --- | --- | --- | --- | --- | --- | --- | --- | --- | --- | --- | --- |
| | | | | | | | | |
| --- | --- | --- | --- | --- | --- | --- | --- | --- |
| | | | | | | | | | | | | | | | | | | | | |
| --- | --- | --- | --- | --- | --- | --- | --- | --- | --- | --- | --- | --- | --- | --- | --- | --- | --- | --- | --- | --- |
Indicate by check mark whether the registrant has filed a report on and attestation to its management’s assessment of the effectiveness of its internal control over financial reporting under Section 404(b) of the Sarbanes-Oxley Act (15 U.S.C. 7262(b)) by the registered public accounting firm that prepared or issued its audit report.
FASTENAL COMPANY
| | | | | | | | | | | | |
| --- | --- | --- | --- | --- | --- | --- | --- | --- | --- | --- | --- |
| | | | | | | [PART I](#ife810274569f4b179a477e3c078b570c_19) | | | | | |
| | | | | | | [PART II](#ife810274569f4b179a477e3c078b570c_40) | | | | | |
| | | | | | | [PART IV](#ife810274569f4b179a477e3c078b570c_175) | | | | | |
| | | | | | | [Signatures](#ife810274569f4b179a477e3c078b570c_187) | | | [71](#ife810274569f4b179a477e3c078b570c_187) | | |
Our forward-looking statements generally relate to our expectations regarding the business environment in which we operate, our projections of future performance, our perceived marketplace opportunities, our strategies, goals, mission and vision, and our expectations about capital expenditures, tax rates, inventory levels, in-market locations and signings of Onsite locations and new machine equivalent units (including industrial vending and FAST Bin technologies), digital and other product offerings, national accounts as a percentage of overall sales, the advantages of our integrated physical and virtual model, and the sustainability of our growth in the safety product market that we experienced during the COVID-19 pandemic.
| | |
| --- | --- |
FASTENAL COMPANY
| | | |
| --- | --- | --- |
| | | | | | | |
| --- | --- | --- | --- | --- | --- | --- |
| | | | |
| --- | --- | --- | --- |
| | | [PART I](#s6DFC17D873A85739952A49808788A897) | |
| | | [PART II](#s9D1A9169D8A65F839FDE390DF2440B2A) | |
| | | [PART IV](#s8C6F16A7D49154ACB790427D4F322E73) | |
| | | [Signatures](#s3ECEAD8359295BB3978309E84C4BCB1A) | [64](#s3ECEAD8359295BB3978309E84C4BCB1A) |
Our forward-looking statements generally relate to our expectations regarding the business environment in which we operate, our projections of future performance, our perceived marketplace opportunities, and our strategies, goals, mission and vision.
An excerpt. Shown here: 40 of 46 rewritten, all 21 added and all 14 removed. The counts are complete. For every sentence, read Cover and table of contents in the FY2020 filing and the FY2019 filing.
Item 1B. UNRESOLVED STAFF COMMENTS
0 rewritten, 0 added, 2 removed, 1 unchanged
| | |
| --- | --- |
Item 2. PROPERTIES
33 rewritten, 11 added, 22 removed, 7 unchanged
Note – Information in this section is as of December 31, [removed: 2019,] [added: 2020,] unless otherwise noted.
| [added: Location | | |] Purpose | | [added: | Leased | | |] Tote Locations (ASRS)(1) | | | [added: | | |] Approximate Square Feet | | [added: |]
| [added: Winona, Minnesota | | |] Distribution center and home office (2) | | [added: | | | |] 246,000 | | | [added: | | |] 259,000 | | [added: |]
| [added: Winona, Minnesota | | |] Manufacturing facility | | | | | [added: |] 100,000 | | [added: |]
(2) During 2018, we acquired land for future expansion of our home [removed: office.][added: office, and, as of December 2020, we have additional office space under construction.]
We [removed: own] [added: own, and in some cases, lease,] the following facilities, excluding selling [removed: locations, outside of Winona, Minnesota:][added: locations:]
| [added: Location | | |] Purpose | [removed: Location] | [removed: Tote Locations (ASRS)(1)] | [added: Leased] | | [added: |] Approximate Square Feet | | [added: |]
| [added: Indianapolis, Indiana | | |] Distribution center | [removed: Indianapolis, Indiana] | [added: | | | |] 547,000 | | [removed: (2)] | [added: (3) | | |] 1,039,000 | | [added: |]
| [added: Indianapolis, Indiana | | |] Manufacturing facility | [removed: Indianapolis, Indiana] | | | | [added: |] 220,000 | | [added: |]
| [added: Akron, Ohio | | |] Distribution center | [removed: Akron, Ohio] | [added: | | | |] 103,000 | | | [added: | | |] 182,000 | | [added: |]
| [added: Scranton, Pennsylvania | | |] Distribution center | [removed: Scranton, Pennsylvania] | [added: | | | |] 104,000 | | | [added: | | |] 189,000 | | [added: |]
| [added: Denton, Texas | | |] Distribution center | [removed: Denton, Texas] | [added: | | | |] 41,000 | | [removed: (3)] | [added: (4) | | |] 176,000 | | [added: |]
| [added: Houston, Texas | | |] Manufacturing facility [removed: (built in 2019)] | [removed: Houston, Texas] | | | | [added: |] 120,000 | | [added: |]
| [added: Atlanta, Georgia | | |] Distribution center | [removed: Atlanta, Georgia] | [added: | | | |] 77,000 | | | [added: | | |] 198,000 | | [added: |]
| [added: Seattle, Washington | | |] Distribution center [removed: (built in 2019)] | [removed: Seattle, Washington] | [added: | | | |] 140,000 | | | [added: | | |] 246,000 | | [added: |]
| [added: Modesto, California | | |] Distribution center and manufacturing facility | [removed: Modesto, California] | [added: | | | |] 69,000 | | | [added: | | |] 328,000 | | [added: |]
| [removed: Distribution center |] High Point, North Carolina | [added: | | Distribution center (two buildings) (5) | | | | | |] 132,000 | | | [removed: 301,000] | | [added: | 680,000 | | |]
| [removed: Distribution center |] Kansas City, Kansas | [added: | | Distribution center | | | | | |] 170,000 | | | [added: | | |] 468,000 | | [added: |]
| [removed: Distribution center (5) |] Kitchener, Ontario, Canada | [added: | | Distribution center | | | | | |] 128,000 | | | [removed: 142,000] | | [added: | 242,000 | | |]
| [added: Jackson, Mississippi | | |] Distribution center [removed: (built in 2019)] | [removed: Jackson, Mississippi] | [added: | | | |] — | | | [added: | | |] 269,000 | | [added: |]
| [added: Wallingford, Connecticut | | |] Manufacturing facility | [removed: Wallingford, Connecticut] | | | | [added: |] 187,000 | | [added: |]
| [added: Rockford, Illinois | | |] Manufacturing facility | [removed: Rockford, Illinois] | | | | [added: |] 100,000 | | [added: |]
| [removed: Local re-distribution center and manufacturing facility |] Johor, Malaysia | | | [added: Manufacturing facility] | [removed: 27,000] | | [added: | | | 30,000 | | |]
[removed: (2)] [added: (3)] This property contains an ASRS with capacity of 52,000 pallet locations, in addition to the 547,000 tote locations for small parts.
[removed: (3)] [added: (4)] This facility contains an ASRS with capacity of 14,000 pallet locations, in addition to the 41,000 tote locations for small parts.
[removed: (4)] [added: (5)] In late December 2018, we purchased an additional distribution center in High Point, North Carolina with approximately 750,000 total square feet.
Approximately [removed: 400,000] [added: 371,000] square feet will [removed: continue to] be leased by the [added: building's] previous owner [removed: for three years.][added: until December 2022.]
In addition, we own [removed: 173] [added: 167] buildings that house our in-market locations in various cities throughout North America.
Leased branches range from approximately 3,000 to [removed: 10,000] [added: 15,000] square feet, with lease terms of up to 60 months (most initial lease terms are for 36 to [removed: 48] [added: 60] months).
| [removed: Distribution center |] Salt Lake City, Utah | | [removed: 74,000] | [added: Distribution center and packaging facility (three buildings)] | | [removed: July 2022] | [added: X] | [removed: One] | [added: | — | | | | | | 156,000 | | |]
| [removed: Distribution center and manufacturing facility |] Edmonton, Alberta, Canada | | [removed: 45,000] | [added: Distribution center] | | [removed: July 2020] | [added: X] | [removed: None] | [added: | — | | | | | | 38,000 | | |]
| [removed: Distribution center |] Apodaca, Nuevo Leon, Mexico | | [removed: 46,000] | [added: Distribution center] | | [removed: March 2020] | [added: X] | [removed: Three] | [added: | — | | | | | | 46,000 | | |]
| [removed: Local re-distribution center and manufacturing facility |] Modrice, Czech Republic | | [removed: 17,000] | [added: Manufacturing facility] | | [removed: April 2022] | [added: X] | [removed: None] | [added: | 17,000 | | |]
| | | | | | | | | | | | | | | | | | |
| --- | --- | --- | --- | --- | --- | --- | --- | --- | --- | --- | --- | --- | --- | --- | --- | --- | --- |
| Dordrecht, Netherlands | | | Distribution center | | | X | | | — | | | | | | 35,000 | | |
| Shanghai, China | | | Local re-distribution center | | | X | | | — | | | | | | 16,000 | | |
We currently utilize approximately 379,000 square feet for distribution activities.
We also own, and in some cases, lease, the following support facilities, excluding selling locations:
| | | | | | | | | | | | |
| --- | --- | --- | --- | --- | --- | --- | --- | --- | --- | --- | --- |
| Leeds, United Kingdom | | | Manufacturing facility | | | X | | | 28,000 | | |
| Winona, Minnesota | | | Multiple facilities for office space, storage, and packaging operations | | | | | | 240,000 | | |
| Bangalore, India | | | International information technology office | | | X | | | 15,000 | | |
We own the following facilities in Winona, Minnesota:
| | | | | | | |
| --- | --- | --- | --- | --- | --- | --- |
| Computer support center | | | | | 13,000 | |
| Winona branch | | | | | 15,000 | |
| Winona product support facility | | | | | 55,000 | |
| Rack and shelving storage | | | | | 42,000 | |
| Multi-building complex which houses certain operations of the distribution group, the support services group, and the home office support group | | | | | 30,000 | |
| Customer Experience Center | | | | | 100,000 | |
(1) Total number of tote locations for small parts storage included in facilities with an ASRS.
| Distribution center (4) | High Point, North Carolina | — | | | 350,000 | |
We began utilizing approximately 350,000 square feet for distribution activities in early 2019.
(5) In late 2019, we began an expansion project at our Kitchener, Ontario, Canada distribution center.
This project will add approximately 80,000 square feet of distribution capacity and is scheduled for completion in 2020.
In addition to our leased branch locations, we also lease the following facilities:
| | | | | | | | | |
| --- | --- | --- | --- | --- | --- | --- | --- | --- |
| Purpose | Location | | Approximate Square Feet | | | Lease Expiration Date | | Remaining Lease Renewal Options |
| Distribution center | Salt Lake City, Utah | | 56,000 | | | July 2022 | | One |
| Distribution center and packaging facility | Salt Lake City, Utah | | 26,000 | | | July 2022 | | One |
| | |
| --- | --- |
Item 4. MINE SAFETY DISCLOSURES
0 rewritten, 0 added, 2 removed, 2 unchanged
| | |
| --- | --- |
Item 5. MARKET FOR REGISTRANT'S COMMON EQUITY, RELATED STOCKHOLDER MATTERS, AND ISSUER PURCHASES OF EQUITY SECURITIES
11 rewritten, 11 added, 13 removed, 9 unchanged
As of January 22, [removed: 2020,] [added: 2021,] there were approximately 1,000 record holders of our common stock, which includes nominees or broker dealers holding stock on behalf of an estimated [removed: 275,000] [added: 348,000] beneficial owners.
The table below sets forth information regarding purchases of our common stock during each of the last three months of [removed: 2019:][added: 2020:]
| Period | [added: | |] Total Number of Shares Purchased | | [added: | | | |] Average Price Paid per Share | | | | [added: | | | | |] Total Number of Shares Purchased as Part of Publicly Announced Plans or Programs (1) | | [added: | | | |] Maximum Number (or Approximate Dollar Value) of Shares that May Yet Be Purchased Under the Plans or Programs (1) | [added: | |]
| Total | [added: | |] 0 | | [added: | | | |] — | | | | [added: | | | | |] 0 | | [removed: 4,800,000] | [added: | | | 3,200,000 | | |]
As of December 31, [removed: 2019,] [added: 2020,] we had remaining authority to repurchase [removed: 4,800,000] [added: 3,200,000] shares under this authorization.
Purchases of shares of our common stock throughout [removed: 2019] [added: 2020] are described later in this Form 10-K under the heading 'Item 7.
Set forth below is a graph comparing, for the five years ended December 31, [removed: 2019,] [added: 2020,] the yearly cumulative total shareholder return on our common stock with the yearly cumulative total shareholder return of the S&P 500 Index and the Dow Jones US Industrial Suppliers Index.
The comparison of total shareholder returns in the performance graph assumes that $100 was invested on December 31, [removed: 2014] [added: 2015] in Fastenal Company, the S&P 500 Index, and the Dow Jones US Industrial Suppliers Index, and that dividends were reinvested when and as paid.
[removed: 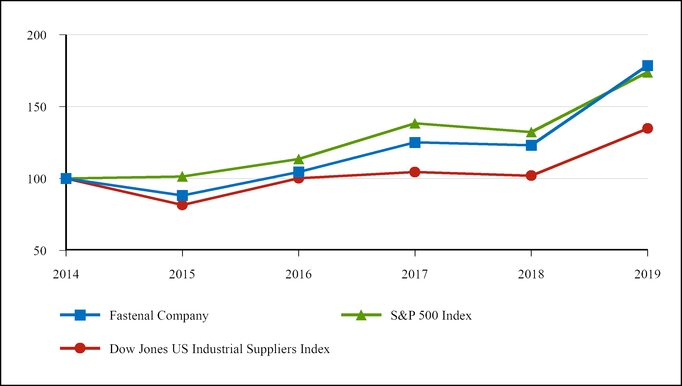][added: 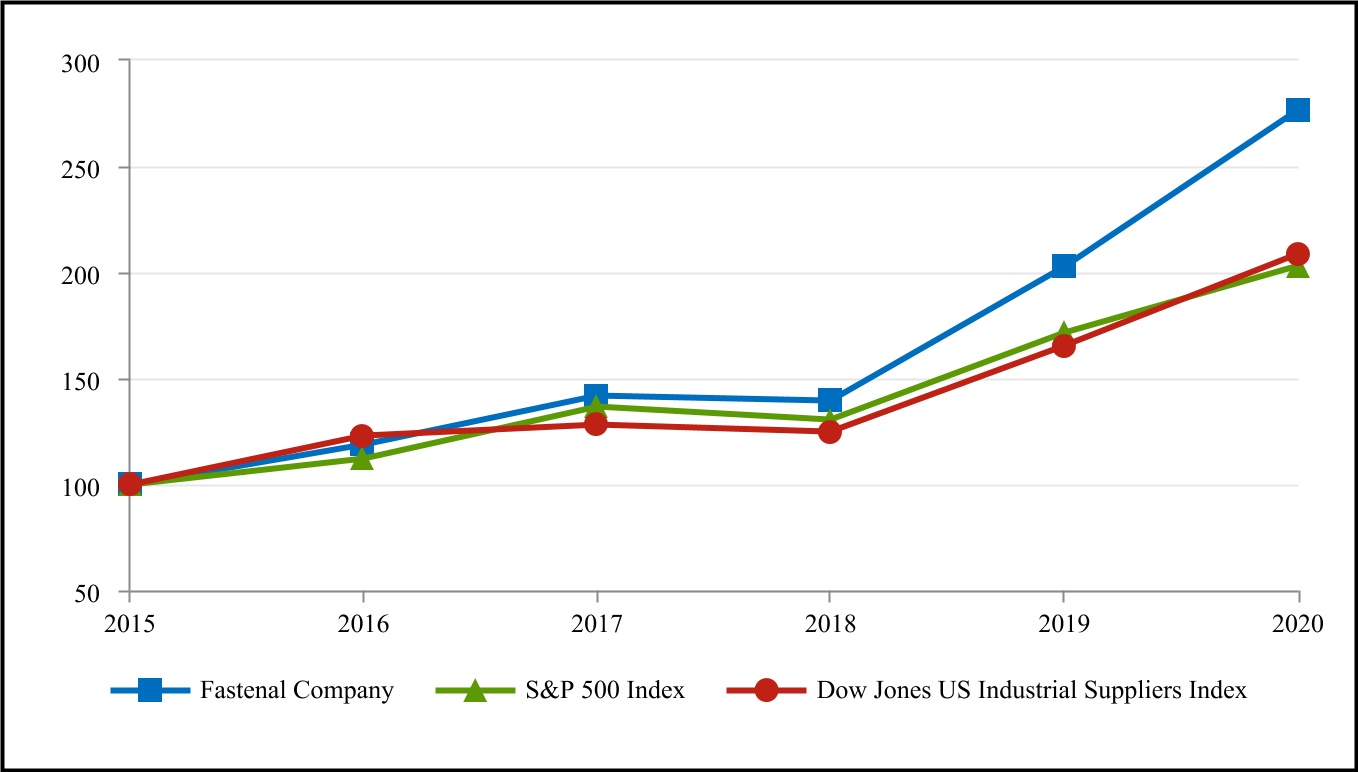]
| | | [removed: 2014] | | [added: | |] 2015 | | [added: | | | |] 2016 | | [added: | | | |] 2017 | | [added: | | | |] 2018 | | [added: | | | |] 2019 | [added: | | | | | 2020 | | |]
Note - The graph and index table above were obtained from [removed: Zachs] [added: Zacks] SEC Compliance Services Group.
| | | | | | | | | | | | | | | | | | | | | | | | | | | |
| --- | --- | --- | --- | --- | --- | --- | --- | --- | --- | --- | --- | --- | --- | --- | --- | --- | --- | --- | --- | --- | --- | --- | --- | --- | --- | --- |
| | | | (a) | | | | | | (b) | | | | | | | | | (c) | | | | | | (d) | | |
| October 1-31, 2020 | | | 0 | | | | | | — | | | | | | | | | 0 | | | | | | 3,200,000 | | |
| November 1-30, 2020 | | | 0 | | | | | | — | | | | | | | | | 0 | | | | | | 3,200,000 | | |
| December 1-31, 2020 | | | 0 | | | | | | — | | | | | | | | | 0 | | | | | | 3,200,000 | | |
| | | | | | | | | | | | | | | | | | | | | | | | | | | | | | | | | | | | | | | |
| --- | --- | --- | --- | --- | --- | --- | --- | --- | --- | --- | --- | --- | --- | --- | --- | --- | --- | --- | --- | --- | --- | --- | --- | --- | --- | --- | --- | --- | --- | --- | --- | --- | --- | --- | --- | --- | --- | --- |
| Fastenal Company | | | $ | | | 100.00 | | | | | | 118.51 | | | | | | 141.82 | | | | | | 139.60 | | | | | | 202.47 | | | | | | 276.51 | | |
| S&P 500 Index | | | | | | 100.00 | | | | | | 111.96 | | | | | | 136.40 | | | | | | 130.42 | | | | | | 171.49 | | | | | | 203.04 | | |
| Dow Jones US Industrial Suppliers Index | | | | | | 100.00 | | | | | | 122.84 | | | | | | 128.08 | | | | | | 124.99 | | | | | | 165.27 | | | | | | 208.95 | | |
| | | | | | | | | | |
| --- | --- | --- | --- | --- | --- | --- | --- | --- | --- |
| | (a) | | (b) | | | | (c) | | (d) |
| October 1-31, 2019 | 0 | | — | | | | 0 | | 4,800,000 |
| November 1-30, 2019 | 0 | | — | | | | 0 | | 4,800,000 |
| December 1-31, 2019 | 0 | | — | | | | 0 | | 4,800,000 |
| | | | | | | | | | | | | |
| --- | --- | --- | --- | --- | --- | --- | --- | --- | --- | --- | --- | --- |
| Fastenal Company | $ | 100.00 | | 88.19 | | 104.51 | | 125.07 | | 123.11 | | 178.55 |
| S&P 500 Index | | 100.00 | | 101.38 | | 113.51 | | 138.29 | | 132.23 | | 173.86 |
| Dow Jones US Industrial Suppliers Index | | 100.00 | | 81.52 | | 100.14 | | 104.41 | | 101.89 | | 134.72 |
| | |
| --- | --- |
Item 6. SELECTED FINANCIAL DATA
1 rewritten, 0 added, 2 removed, 1 unchanged
Incorporated herein by reference is Ten-Year Selected Financial Data on pages 4 and 5 of Fastenal's [removed: 2019] [added: 2020] Annual Report to Shareholders of which this Form 10-K forms a part, a portion of which is filed as Exhibit 13 to this annual report on
| | |
| --- | --- |
Item 8. FINANCIAL STATEMENTS AND SUPPLEMENTARY DATA
326 rewritten, 181 added, 98 removed, 253 unchanged
To the Stockholders and Board of Directors [removed: of]
*Opinions on [removed: the*] [added: the] Consolidated [removed: *Financial] [added: Financial] Statements and Internal Control Over Financial Reporting*
We have audited the accompanying consolidated balance sheets of Fastenal Company and subsidiaries (the Company) as of December 31, [removed: 2019] [added: 2020] and [removed: 2018,] [added: 2019,] the related consolidated statements of earnings, comprehensive income, [removed: stockholders’] [added: stockholders'] equity, and cash flows for each of the years in the three-year period ended December 31, [removed: 2019] [added: 2020] and the related notes and financial statement schedule listed in the table of contents at Item 15 (collectively, the consolidated financial statements).
We also have audited the [removed: Company’s] [added: Company's] internal control over financial reporting as of December 31, [removed: 2019,] [added: 2020,] based on criteria established in *Internal Control - Integrated Framework* *(2013)* issued by the Committee of Sponsoring Organizations of the Treadway Commission.
In our opinion, the consolidated financial statements referred to above present fairly, in all material respects, the financial position of the Company as of December 31, [removed: 2019] [added: 2020] and [removed: 2018,] [added: 2019,] and the results of its operations and its cash flows for each of the years in the three-year period ended December 31, [removed: 2019,] [added: 2020,] in conformity with U.S. generally accepted accounting principles.
Also in our opinion, the Company maintained, in all material respects, effective internal control over financial reporting as of December 31, [removed: 2019] [added: 2020] based on criteria established in [removed: Internal] [added: *Internal] Control - Integrated Framework [removed: (2013)] [added: (2013)*] issued by the Committee of Sponsoring Organizations of the Treadway Commission.
A [removed: company’s] [added: company's] internal control over financial reporting includes those policies and procedures that (1) pertain to the maintenance of records that, in reasonable detail, accurately and fairly reflect the transactions and dispositions of the assets of the company; (2) provide reasonable assurance that transactions are recorded as necessary to permit [added: preparation of financial statements in accordance with generally accepted accounting principles, and that receipts and expenditures of the company are being made only in accordance with authorizations of management and directors of the company; and (3) provide reasonable assurance regarding prevention or timely detection of unauthorized acquisition, use, or disposition of the company’s assets that could have a material effect on the financial statements.]
The critical audit matter communicated below is a matter arising from the current period audit of the consolidated financial statements that was communicated or required to be communicated to the audit committee and that: (1) relates to [removed: an account] [added: accounts] or [removed: disclosure] [added: disclosures] that [removed: is] [added: are] material to the consolidated financial statements and (2) involved our especially challenging, subjective, or complex [removed: judgment.][added: judgments.]
The communication of a critical audit matter does not alter in any way our opinion on the consolidated financial statements, taken as a whole, and we are not, by communicating the critical audit matter below, providing a separate opinion on the critical audit matter or on the [removed: account] [added: accounts] or [removed: disclosure] [added: disclosures] to which it relates.
[removed: *Evaluation of the sufficiency] [added: *Sufficiency] of audit evidence over [removed: inventory*][added: inventory quantities*]
As disclosed in the consolidated balance [removed: sheets,] [added: sheet,] the Company [removed: holds $1,366.4] [added: held $1,337.5] million of inventory, the majority of which was held at [removed: 3,228] [added: 3,268] in-market locations, as of December 31, [removed: 2019.][added: 2020.]
Evaluating the sufficiency of audit evidence over quantities of inventory required challenging auditor judgment to assess the number of in-market locations visited, and included the involvement of IT professionals with specialized skills and knowledge due to the interaction of multiple IT systems [removed: to] [added: that] track physical inventory quantities by [removed: locations.][added: location.]
[removed: The inventory controls] [added: This] included [removed: the testing of] IT application controls, as well as [added: certain] controls related to access to [removed: program] [added: programs] and data, program [removed: change,] [added: changes,] program development, and computer operations.
It also included [added: certain] controls [removed: over] [added: related to] the [added: Company's] physical inventory cycle counts.
We involved IT professionals with specialized skills and knowledge, who assisted in testing [added: certain] IT [removed: controls] [added: controls,] inclusive of the interface of multiple IT [removed: systems] [added: systems,] which support the Company’s perpetual inventory system.
[removed: | • |] [added: -] Historical inventory locations [removed: visited; |][added: we have visited and results of prior physical counts;]
[removed: | • |] [added: -] Inventory dollars by location; and [removed: |]
[removed: | • | Inventory] [added: - The Company's inventory] cycle count [removed: results of the Company,] [added: results,] including the results of monitoring and compliance with cycle count program by in-market location. [removed: |]
[removed: On a sample basis, we] [added: We] tested the [added: existence and completeness of] inventory by counting inventory quantities [added: on a sample basis] through location visits during the year to evaluate the Company’s perpetual inventory records.
| | [added: | |] December 31 | | | | | | [added: | | |]
| | [removed: 2019] | | [added: 2020] | | [added: | | | | 2019 | | | | | |] 2018 | | [added: |]
| Assets | | | | | | | [added: | | | | |]
| Current assets: | | | | | | | [added: | | | | |]
| Cash and cash equivalents | [added: | |] $ | [removed: 174.9] [added: 245.7] | | | [removed: 167.2] | | [added: 174.9 | | |]
| Trade accounts receivable, net of allowance for [removed: doubtful accounts] [added: credit losses] of [removed: $10.9] [added: $12.3] and [removed: $12.8,] [added: $10.9,] respectively | [removed: 741.8] | | [added: 769.4] | | [removed: 714.3] | | [added: | | 741.8 | | |]
| Inventories | [removed: 1,366.4] | | [added: 1,337.5] | | [removed: 1,278.7] | | [added: | | 1,366.4 | | |]
| Prepaid income taxes | [removed: 16.7] | | [added: 6.7] | | [removed: 9.0] | | [added: | | 16.7 | | |]
| Other current assets | [removed: 157.4] | | [added: 140.3] | | [removed: 147.0] | | [added: | | 157.4 | | |]
| Total current assets | [removed: 2,457.2] | | [added: 2,499.6] | | [removed: 2,316.2] | | [added: | | 2,457.2 | | |]
| Property and equipment, net | [removed: 1,023.2] | | [added: 1,030.7] | | [removed: 924.8] | | [added: | | 1,023.2 | | |]
| Operating lease right-of-use assets | [removed: 243.2] | | [added: 243.0] | | [removed: —] | | [added: | | 243.2 | | |]
| Other assets | [removed: 76.3] | | [added: 191.4] | | [removed: 80.5] | | [added: | | 76.3 | | |]
| Total assets | [added: | |] $ | [removed: 3,799.9] [added: 3,964.7] | | | [removed: 3,321.5] | | [added: 3,799.9 | | |]
| Liabilities and Stockholders' Equity | | | | | | | [added: | | | | |]
| Current liabilities: | | | | | | | [added: | | | | |]
| Current portion of debt | [added: | |] $ | [removed: 3.0] [added: 40.0] | | | [added: | |] 3.0 | | [added: |]
| Accounts payable | [removed: 192.8] | | [added: 207.0] | | [removed: 193.6] | | [added: | | 192.8 | | |]
| Accrued expenses | [removed: 251.5] | | [added: 272.1] | | [removed: 240.8] | | [added: | | 251.5 | | |]
| Current portion of operating lease liabilities | [removed: 97.4] | | [added: 93.6] | | [removed: —] | | [added: | | 97.4 | | |]
| Total current liabilities | [removed: 544.7] | | [added: 612.7] | | [removed: 437.4] | | [added: | | 544.7 | | |]
The following are the primary procedures we performed to address this critical audit matter: We evaluated the design and tested the operating effectiveness of certain internal controls related to the critical audit matter.
We applied auditor judgment in the determination of the locations to test the Company’s inventory quantities by evaluating:
February 8, 2021
| | | | | | | | | | | | |
| --- | --- | --- | --- | --- | --- | --- | --- | --- | --- | --- | --- |
| | | | 2020 | | | | | | 2019 | | |
| | | | | | | | | | | | | | | | | | |
| --- | --- | --- | --- | --- | --- | --- | --- | --- | --- | --- | --- | --- | --- | --- | --- | --- | --- |
| | | | | | | | | | | | | | | | | | |
| --- | --- | --- | --- | --- | --- | --- | --- | --- | --- | --- | --- | --- | --- | --- | --- | --- | --- |
| | | | | | | | | | | | | | | | | | |
| --- | --- | --- | --- | --- | --- | --- | --- | --- | --- | --- | --- | --- | --- | --- | --- | --- | --- |
| Net earnings | | | 859.1 | | | | | | 790.9 | | | | | | 751.9 | | |
| | | | | | | | | | | | | | | | | | |
| | | | | | | | | | | | | | | | | | |
| --- | --- | --- | --- | --- | --- | --- | --- | --- | --- | --- | --- | --- | --- | --- | --- | --- | --- |
| | | | 2020 | | | | | | 2019 | | | | | | 2018 | | |
| Net earnings | | | $ | 859.1 | | | | | 790.9 | | | | | | 751.9 | | |
| Gain on sale of property and equipment | | | (1.4) | | | | | | (1.2) | | | | | | (0.5) | | |
| Stock-based compensation | | | 5.7 | | | | | | 5.7 | | | | | | 5.1 | | |
| | | | | | | | | | | | | | | | | | |
Using probability assessments, which are based on known inputs at year-end, we estimate sales incentives expected to be paid over the term of the contract.
The allowance for credit losses is based on an income statement approach which adjusts the ending balance sheet to take into consideration expected losses over the contractual lives of the receivables, considering factors such as historical data as a basis for future expected losses.
If
Impact of COVID-19
The COVID-19 pandemic has impacted and could further impact our operations and the operations of our suppliers and customers as a result of quarantines, facility closures, and travel and logistics restrictions.
We recently experienced an increase in sales volume of safety related products.
However, we may realize lower product margins as well as inventory write-downs as a result of the improved supply and the potential inability to sell excess safety related products ordered from suppliers.
The extent to which the COVID-19 pandemic impacts our business, results of operations and financial condition will depend on future developments, which are highly uncertain and cannot be predicted, including, but not limited to the duration, spread, severity, and impact of the COVID-19 pandemic, the effects of the COVID-19 pandemic on our customers and suppliers, and the remedial actions and stimulus measures adopted by local and federal governments, and to what extent normal economic and operating conditions can resume.
Therefore, we cannot reasonably estimate the impact at this time.
recognition of estimated credit losses in the financial statements, reflecting the net amount expected to be collected.
In January 2017, the FASB issued ASU 2017-01, *Business Combinations (Topic 805): Clarifying the Definition of a Business*, which provides guidance to assist entities in evaluating whether transactions should be accounted for as acquisitions (or disposals) of assets or businesses.
ASU 2017-01 requires that, to be a business, an acquired set of assets and activities must include, at a minimum, an input and a substantive process that together significantly contributes to the ability to create outputs.
The company adopted this guidance during the first quarter of 2020 when evaluating the transaction discussed further in Note 2, '*Asset Acquisition'*.
In March 2020, the FASB issued ASU 2020-04, *Reference Rate Reform (Topic 848): Facilitation of the Effects of Reference Rate Reform on Financial Reporting*, which provides temporary optional expedients and exceptions to U.S. GAAP on contract modifications, hedging relationships, and other transactions affected by reference rate reform to ease entities financial reporting burdens as the market transitions from the London Interbank Offered Rate ('LIBOR') and other interbank offered rates to alternative reference rates.
The guidance was effective upon issuance and may be applied prospectively to contract modifications made, hedging relationships entered into, and other transactions affected by reference rate reform, evaluated on or before December 31, 2022, beginning during the reporting period in which the guidance has been elected.
We are currently evaluating the impact of the new guidance on our consolidated financial statements.
Asset Acquisition
On March 30, 2020, we purchased certain assets of Apex Industrial Technologies LLC ('Apex') that have contributed to the development, design, and scalability of the vending delivery platform utilized since 2008 within our industrial vending business to dispense product and lease devices to our customers.
In connection with this transaction, we purchased a perpetual and unfettered use of key patents, designs, software and licenses, as well as direct access to the vending equipment supply chain.
*Change in Accounting Principle*
As discussed in Note 1 to the consolidated financial statements, the Company has changed its method of accounting for operating leases as of January 1, 2019 due to the adoption of ASU 2016-02, *Leases* (Topic 842).
preparation of financial statements in accordance with generally accepted accounting principles, and that receipts and expenditures of the company are being made only in accordance with authorizations of management and directors of the company; and (3) provide reasonable assurance regarding prevention or timely detection of unauthorized acquisition, use, or disposition of the company’s assets that could have a material effect on the financial statements.
The primary procedures we performed to address this critical audit matter included the following.
We tested certain internal controls over the Company’s perpetual inventory process.
We evaluated the following information regarding the Company’s inventory quantities:
| | |
| --- | --- |
February 6, 2020
| | | | | | | |
| --- | --- | --- | --- | --- | --- | --- |
| | | | | | | | | | |
| --- | --- | --- | --- | --- | --- | --- | --- | --- | --- |
incentives.
All
We recognize revenue by transferring
of the products.
by the customer.
Using probability assessments, we estimate sales
incentives expected to be paid over the term of the contract.
and are short term in nature.
remitted to governmental authorities are accounted for on a net basis and therefore are excluded from net sales.
estimated net realizable value.
The allowance for doubtful accounts is based on an analysis of customer accounts and our
historical experience with accounts receivable write-offs.
If the carrying value of the long-lived asset or
Effective January 1, 2019, we adopted the Financial Accounting Standards Board ('FASB') Accounting Standards Update ('ASU') 2016-02, *Leases (Topic 842)*, which requires the recognition of lease assets and lease liabilities by lessees for those leases classified as operating leases under previous guidance.
The original guidance required application on a modified retrospective basis with the earliest period presented.
In August 2018, the FASB issued ASU 2018-11, *Targeted Improvements to ASC 842*, which included an option to not restate comparative periods in transition and elect to use the effective date of ASC 842, *Leases*, as the date of initial application of transition, which we elected.
As a result of the adoption of ASC 842 on January 1, 2019, we recorded both operating lease ROU assets of $227.5 and lease liabilities of $228.3.
The adoption of ASC 842 had an immaterial impact on our Consolidated Statement of Earnings and Consolidated Statement of Cash Flows for the year ended December 31, 2019.
In addition, we elected the package of practical expedients permitted under the transition guidance within the new standard which allowed us to carry forward the historical lease classification.
This update is effective for periods beginning after December 15, 2019.
| | | | | | | | | |
| --- | --- | --- | --- | --- | --- | --- | --- | --- |
| | | | | | | | | | | |
| --- | --- | --- | --- | --- | --- | --- | --- | --- | --- | --- |
(1) In 2018, we reclassified certain product category designations and have conformed the prior period percentages to the current year presentation.
| | | | | 1,966.9 | | | | 1,746.2 | |
| | | | | | | | | | | | | | | | | |
An excerpt. Shown here: 40 of 326 rewritten, 40 of 181 added and 40 of 98 removed. The counts are complete. For every sentence, read Item 8. FINANCIAL STATEMENTS AND SUPPLEMENTARY DATA in the FY2020 filing and the FY2019 filing.
Item 9. CHANGES IN AND DISAGREEMENTS WITH ACCOUNTANTS ON ACCOUNTING AND FINANCIAL DISCLOSURE
0 rewritten, 0 added, 2 removed, 1 unchanged
| | |
| --- | --- |
Item 9A. CONTROLS AND PROCEDURES
8 rewritten, 4 added, 5 removed, 13 unchanged
[removed: | (i) | pertain] [added: (i)pertain] to the maintenance of records that, in reasonable detail, accurately and fairly reflect the transactions and dispositions of the assets of the company; [removed: |]
[removed: | (ii) | provide] [added: (ii)provide] reasonable assurance that the transactions are recorded as necessary to permit preparation of financial statements in accordance with U.S. generally accepted accounting principles, and that receipts and expenditures of the company are being made only in accordance with authorizations of management and directors of the company; and [removed: |]
[removed: | (iii) | provide] [added: (iii)provide] reasonable assurance regarding prevention or timely detection of unauthorized acquisition, use or disposition of the company's assets that could have a material effect on the financial statements. [removed: |]
Based on our assessment and those criteria, management believes that the company maintained effective internal control over financial reporting as of December 31, [removed: 2019.][added: 2020.]
| /s/ Daniel L. Florness | | [added: | | | |] /s/ Holden Lewis | [added: | |]
| Daniel L. Florness | | [added: | | | |] Holden Lewis | [added: | |]
| President and Chief Executive Officer | | [added: | | | |] Executive Vice President and Chief Financial Officer | [added: | |]
| Winona, Minnesota | | | [added: | | | | | |]
| | | | | | | | | |
| --- | --- | --- | --- | --- | --- | --- | --- | --- |
| | | | | | | | | |
| February 8, 2021 | | | | | | | | |
| | |
| --- | --- |
| | | |
| --- | --- | --- |
| February 6, 2020 | | |
Item 9B. OTHER INFORMATION
0 rewritten, 0 added, 2 removed, 2 unchanged
| | |
| --- | --- |
Item 10. DIRECTORS, EXECUTIVE OFFICERS, AND CORPORATE GOVERNANCE
18 rewritten, 4 added, 10 removed, 53 unchanged
In January 2004, our board of directors adopted a supplement to our existing standards of conduct designed to qualify the standards of conduct as a code of ethics within the meaning of Item 406(b) of Regulation S-K promulgated by the SEC [removed: ('Code] [added: (Code] of [removed: Ethics').][added: Ethics).]
The standards of conduct, as supplemented, apply to all of our directors, officers, and employees, including without limitation our chief executive officer, chief financial officer, principal accounting officer, and controller (if any), and persons performing similar functions [removed: ('Senior] [added: (Senior] Financial [removed: Officers').][added: Officers).]
| Name | [added: | |] Employee of Fastenal Since | | [added: | | | |] Age | | [added: | | | |] Position | [added: | |]
| Daniel L. Florness | [added: | |] 1996 | | [removed: 56] | | [added: | | 57 | | | | | |] President, Chief Executive Officer, and Director | [added: | |]
| William J. Drazkowski | [added: | |] 1995 | | [removed: 48] | | [added: | | 49 | | | | | |] Executive Vice President – Sales | [added: | |]
| [removed: Leland J. Hein] [added: Charles S. Miller] | [removed: 1985] | | [removed: 59] [added: 1999] | | [added: | | | | 46 | | | | | |] Senior Executive Vice President – Sales | [added: | |]
| James C. Jansen | [added: | |] 1992 | | [removed: 49] | | [added: | | 50 | | | | | |] Executive Vice President – Manufacturing | [added: | |]
| Holden Lewis | [added: | |] 2016 | | [removed: 50] | | [added: | | 51 | | | | | |] Executive Vice President and Chief Financial Officer | [added: | |]
| Sheryl A. Lisowski | [added: | |] 1994 | | [removed: 52] | | [removed: Controller,] [added: | | 53 | | | | | | Executive Vice President –] Chief Accounting [removed: Officer,] [added: Officer] and Treasurer | [added: | |]
| [removed: Charles S. Miller] [added: Terry M. Owen] | [added: | |] 1999 | | [removed: 45] | | [added: | | 52 | | | | | |] Senior Executive Vice President – Sales [added: Operations] | [added: | |]
| John L. Soderberg | [added: | |] 1993 | | [removed: 48] | | [added: | | 49 | | | | | | Senior] Executive Vice President – Information Technology | [added: | |]
| Jeffery M. Watts | [added: | |] 1996 | | [removed: 48] | | [added: | | 49 | | | | | |] Executive Vice President – International Sales | [added: | |]
| Reyne K. Wisecup | [added: | |] 1988 | | [removed: 56] | | [added: | | 57 | | | | | |] Senior Executive Vice President – Human Resources and Director | [added: | |]
Mr. [removed: Hein] [added: Soderberg] has been our senior executive vice president – [removed: sales] [added: information technology] since [removed: January 2016.][added: December 2020.]
[removed: From November 2007 to] December 2010, Mr. Jansen was our executive vice president – internal operations.
Ms. Lisowski has been our [removed: controller,] [added: executive vice president -] chief accounting [removed: officer,] [added: officer] and treasurer since [removed: August 2016.][added: December 2020.]
Mr. Owen's responsibilities include oversight of our e-commerce, marketing, national accounts sales, government sales, FAST [removed: Solutions®, Onsite] [added: Solutions® (Onsite] and [removed: vending,] [added: FMI),] our Mansco division, manufacturing, distribution, transportation, product development, supplier development, procurement, and supply chain.
[added: From May 2016 to November 2020,] Mr. Soderberg [removed: has been] [added: was] our executive vice president – information [removed: technology since May 2016.][added: technology.]
| | | | | | | | | | | | | | | | | | |
| --- | --- | --- | --- | --- | --- | --- | --- | --- | --- | --- | --- | --- | --- | --- | --- | --- | --- |
From November 2007 to
From August 2016 to November 2020, Ms. Lisowski was our controller, chief accounting officer, and treasurer.
| | | | | | |
| --- | --- | --- | --- | --- | --- |
| Terry M. Owen | 1999 | | 51 | | Senior Executive Vice President – Sales Operations |
From July 2015 to December 2015, Mr. Hein was our chief operating officer.
Mr. Hein was our president and chief executive officer from January 2015 to July 2015, and our
president from July 2012 to December 2014.
From November 2007 to July 2012, Mr. Hein was one of our executive vice presidents – sales.
Prior to November 2007, Mr. Hein served in various sales leadership roles at our company.
| | |
| --- | --- |
Item 11. EXECUTIVE COMPENSATION
0 rewritten, 0 added, 2 removed, 1 unchanged
| | |
| --- | --- |
Item 12. SECURITY OWNERSHIP OF CERTAIN BENEFICIAL OWNERS AND MANAGEMENT AND RELATED STOCKHOLDER MATTERS
4 rewritten, 4 added, 6 removed, 2 unchanged
| Plan Category | [added: | |] Number of Securities to be Issued Upon Exercise of Outstanding Options, Warrants, and Rights | | | [added: | | |] Weighted-Average Exercise Price of Outstanding Options, Warrants, and Rights | | | | [added: | |] Number of Securities Remaining Available for Future Issuance Under Equity Compensation Plans (Excluding Securities Reflected in Column (a)) | | [added: |]
| Equity compensation plans [added: not] approved by security holders [removed: (1)] | [removed: 6,807,217] | | [added: —] | [removed: $] | [removed: 24.89] | | | [removed: 13,495,100] | [added: —] | [added: | | | | | — | | |]
| Equity compensation plans [removed: not] approved by security holders [added: (1)] | [removed: —] | | [added: 5,914,757] | [removed: —] | | | | [removed: —] | [added: $] | [added: 26.73 | | | | | 12,756,896 | | |]
[removed: |] (1) [removed: |] Reflects stock option awards issued and issuable in the future under our Fastenal Company Stock Option Plan and our Fastenal Company Non-Employee Director Stock Option Plan. [removed: |]
| | | | | | | | | | | | | | | | | | |
| --- | --- | --- | --- | --- | --- | --- | --- | --- | --- | --- | --- | --- | --- | --- | --- | --- | --- |
| | | | (a) | | | | | | (b) | | | | | | (c) | | |
| Total | | | 5,914,757 | | | | | | | | | | | | 12,756,896 | | |
| | | | | | | | | | |
| --- | --- | --- | --- | --- | --- | --- | --- | --- | --- |
| | (a) | | | (b) | | | | (c) | |
| Total | 6,807,217 | | | | | | | 13,495,100 | |
| | |
| --- | --- |
Item 13. CERTAIN RELATIONSHIPS AND RELATED TRANSACTIONS, AND DIRECTOR INDEPENDENCE
0 rewritten, 0 added, 2 removed, 1 unchanged
| | |
| --- | --- |
Item 14. PRINCIPAL ACCOUNTANT FEES AND SERVICES
0 rewritten, 0 added, 2 removed, 2 unchanged
| | |
| --- | --- |
Item 15. EXHIBITS AND FINANCIAL STATEMENT SCHEDULES
30 rewritten, 13 added, 2 removed, 9 unchanged
| a) | [added: | |] 1. Financial Statements: | [added: | |]
Consolidated Balance Sheets as of December 31, [removed: 2019] [added: 2020] and [removed: 2018][added: 2019]
Consolidated Statements of Earnings for the years ended December 31, [added: 2020,] 2019, [removed: 2018,] and [removed: 2017][added: 2018]
Consolidated Statements of Comprehensive Income for the years ended December 31, [added: 2020,] 2019, [removed: 2018,] and [removed: 2017][added: 2018]
Consolidated Statements of Stockholders' Equity for the years ended December 31, [added: 2020,] 2019, [removed: 2018,] and [removed: 2017][added: 2018]
Consolidated Statements of Cash Flows for the years ended December 31, [added: 2020,] 2019, [removed: 2018,] and [removed: 2017][added: 2018]
| Exhibit Number | [added: | |] Description of Document | [added: | | | | |]
| 3.1 | [added: | |] [Restated Articles of Incorporation of Fastenal Company, as amended (incorporated by reference to Exhibit 3.1 to Fastenal Company's Form 8-K dated as of April 23, [removed: 2019 (file no. 000-016125))](https://www.sec.gov/Archives/edgar/data/815556/000081555619000032/ex_314232019amendedarticle.htm)] [added: 2019](https://www.sec.gov/Archives/edgar/data/815556/000081555619000032/ex_314232019amendedarticle.htm)[)](https://www.sec.gov/Archives/edgar/data/815556/000081555619000032/ex_314232019amendedarticle.htm)] | [added: | | | | |]
| 3.2 | [added: | |] [Restated By-Laws of Fastenal Company (incorporated by reference to Exhibit 3.2 to Fastenal Company's Form 8-K dated as of January 17, [removed: 2019 (file no. 000-16125))](http://www.sec.gov/Archives/edgar/data/815556/000081555619000007/exhibit32restatedbylaws.htm)] [added: 2019](http://www.sec.gov/Archives/edgar/data/815556/000081555619000007/exhibit32restatedbylaws.htm)[)](http://www.sec.gov/Archives/edgar/data/815556/000081555619000007/exhibit32restatedbylaws.htm)] | [added: | | | | |]
| 4.1 | [added: | |] [Form of Senior Notes due July 20, 2021 (incorporated by reference to Exhibit 4.1 to Fastenal Company’s Form 8‑K dated as of July 20, [removed: 2016 (file no. 000-16125))](http://www.sec.gov/Archives/edgar/data/815556/000081555616000115/exhibit41.htm)] [added: 2016](http://www.sec.gov/Archives/edgar/data/815556/000081555616000115/exhibit41.htm)[)](http://www.sec.gov/Archives/edgar/data/815556/000081555616000115/exhibit41.htm)] | [added: | | | | |]
| 4.2 | [added: | |] [Form of Senior Notes due July 20, 2022 (incorporated by reference to Exhibit 4.2 to Fastenal Company’s Form 8‑K dated as of July 20, [removed: 2016 (file no. 000-16125))](http://www.sec.gov/Archives/edgar/data/815556/000081555616000115/exhibit42.htm)] [added: 2016](http://www.sec.gov/Archives/edgar/data/815556/000081555616000115/exhibit42.htm)[)](http://www.sec.gov/Archives/edgar/data/815556/000081555616000115/exhibit42.htm)] | [added: | | | | |]
| 4.3 | [added: | |] [Form of Senior Notes due March 1, 2024 (incorporated by reference to Exhibit 4.1 to Fastenal Company's Form 10-Q for the quarter ended March 31, [removed: 2017 (file no. 000-016125))](http://www.sec.gov/Archives/edgar/data/815556/000081555617000021/fast33117ex_41.htm)] [added: 2017](http://www.sec.gov/Archives/edgar/data/815556/000081555617000021/fast33117ex_41.htm)[)](http://www.sec.gov/Archives/edgar/data/815556/000081555617000021/fast33117ex_41.htm)] | [added: | | | | |]
| 4.4 | [added: | |] [Description of Capital [removed: Stock](https://www.sec.gov/Archives/edgar/data/815556/000081555620000011/fast1231201910kexhibit44.htm)] [added: Stock](https://www.sec.gov/Archives/edgar/data/815556/000081555621000008/fast1231202010-kexhibit44.htm)] | [added: | | | | |]
| 10.1 | [added: | |] [Bonus Program for Executive [removed: Officers*](https://www.sec.gov/Archives/edgar/data/815556/000081555620000011/fast1231201910-kexhibit101.htm)] [added: Officers*](https://www.sec.gov/Archives/edgar/data/815556/000081555621000008/fast1231202010-kexhibit101.htm)] | [added: | | | | |]
| 10.2 | [added: | |] [Fastenal Company Stock Option Plan as amended and restated effective as of December 12, 2014 (incorporated by reference to Exhibit 10.1 to Fastenal Company's Form 8-K dated December 17, [removed: 2014 (file no. 000-16125))*](http://www.sec.gov/Archives/edgar/data/815556/000081555614000073/exhibit101stockoptionplana.htm)] [added: 2014](http://www.sec.gov/Archives/edgar/data/815556/000081555614000073/exhibit101stockoptionplana.htm)[)*](http://www.sec.gov/Archives/edgar/data/815556/000081555614000073/exhibit101stockoptionplana.htm)] | [added: | | | | |]
| 10.3 | [added: | |] [Fastenal Company Incentive Plan (incorporated by reference to Appendix A to Fastenal Company's Proxy Statement dated February 23, [removed: 2012 (file no. 000-16125))*](http://www.sec.gov/Archives/edgar/data/815556/000119312512074269/d296107ddef14a.htm)] [added: 2012](http://www.sec.gov/Archives/edgar/data/815556/000119312512074269/d296107ddef14a.htm)[)*](http://www.sec.gov/Archives/edgar/data/815556/000119312512074269/d296107ddef14a.htm)] | [added: | | | | |]
| 10.4 | [added: | |] [Fastenal Company Non-Employee Director Stock Option Plan (incorporated by reference to Exhibit 99 to Fastenal Company's Registration Statement on Form S-8 filed on April 25, [removed: 2018 (file no. 333‑224441)).*](http://www.sec.gov/Archives/edgar/data/815556/000081555618000026/exhibit99-nonxemployeedire.htm)] [added: 2018](http://www.sec.gov/Archives/edgar/data/815556/000081555618000026/exhibit99-nonxemployeedire.htm)[).*](http://www.sec.gov/Archives/edgar/data/815556/000081555618000026/exhibit99-nonxemployeedire.htm)] | [added: | | | | |]
| 10.5 | [added: | |] [Credit Agreement, dated as of May 1, 2015, among Fastenal Company, the Lenders from time to time party thereto, and Wells Fargo Bank, National Association, as Administrative Agent, Swingline Lender and Issuing Lender (incorporated by reference to Exhibit 10.1 to Fastenal Company's Form 8-K dated May 5, [removed: 2015 (file no. 001‑16125)).](http://www.sec.gov/Archives/edgar/data/815556/000081555615000036/exhibit10105012015creditag.htm)] [added: 2015](http://www.sec.gov/Archives/edgar/data/815556/000081555615000036/exhibit10105012015creditag.htm)[).](http://www.sec.gov/Archives/edgar/data/815556/000081555615000036/exhibit10105012015creditag.htm)] | [added: | | | | |]
| 10.6 | [added: | |] [First Amendment to Credit Agreement, dated as of November 23, 2015, among Fastenal Company, the Lenders from time to time party thereto, and Wells Fargo Bank, National Association, as Administrative Agent (incorporated by reference to Exhibit 10.1 to Fastenal Company's Form 8-K dated November 25, [removed: 2015 (file no. 001‑16125)).](http://www.sec.gov/Archives/edgar/data/815556/000081555615000074/exhibit101amendment11232015.htm)] [added: 2015](http://www.sec.gov/Archives/edgar/data/815556/000081555615000074/exhibit101amendment11232015.htm)[).](http://www.sec.gov/Archives/edgar/data/815556/000081555615000074/exhibit101amendment11232015.htm)] | [added: | | | | |]
| 10.7 | [added: | |] [Second Amendment to Credit Agreement, dated as of March 10, 2017, by and among Fastenal Company, the Lenders party thereto, and Wells Fargo Bank, National Association, as Administrative Agent (incorporated by reference to Exhibit 10.1 to Fastenal Company's Form 8-K dated as of March 14, [removed: 2017 (file no. 001‑16125)).](http://www.sec.gov/Archives/edgar/data/815556/000081555617000015/exhibit101creditfacilityse.htm)] [added: 2017](http://www.sec.gov/Archives/edgar/data/815556/000081555617000015/exhibit101creditfacilityse.htm)[).](http://www.sec.gov/Archives/edgar/data/815556/000081555617000015/exhibit101creditfacilityse.htm)] | [added: | | | | |]
| 10.8 | [added: | |] [Third Amendment to Credit Agreement dated as of November 30, 2018 among Fastenal Company, the Lenders party thereto, and Wells Fargo Bank, National Association, as Administrative Agent (incorporated by reference to Exhibit 10.1 to Fastenal Company's Form 8‑K dated December 3, [removed: 2018 (file no. 001-16125)).](http://www.sec.gov/Archives/edgar/data/815556/000081555618000052/exhibit101-thirdamendmentt.htm)] [added: 2018](http://www.sec.gov/Archives/edgar/data/815556/000081555618000052/exhibit101-thirdamendmentt.htm)[).](http://www.sec.gov/Archives/edgar/data/815556/000081555618000052/exhibit101-thirdamendmentt.htm)] | [added: | | | | |]
| 10.9 | [added: | |] [Master Note Agreement dated as of July 20, 2016 by and among (i) Fastenal Company, (ii) Metropolitan Life Insurance Company, NYL Investors LLC and PGIM, Inc. (formerly known as Prudential Investment Management, Inc.), as investor group representatives (each, an 'Investor Group Representative'), and (iii) Metropolitan Life Insurance Company (in its capacity as a purchaser of notes under such Master Note Agreement) and/or affiliates of any Investor Group Representative who become purchasers of notes under such Master Note Agreement (incorporated by reference to Exhibit 10.1 to Fastenal Company’s Form 8-K dated as of July 20, [removed: 2016 (file no. 001-16125)).](http://www.sec.gov/Archives/edgar/data/815556/000081555616000115/exhibit101agreement07202016.htm)] [added: 2016](http://www.sec.gov/Archives/edgar/data/815556/000081555616000115/exhibit101agreement07202016.htm)[).](http://www.sec.gov/Archives/edgar/data/815556/000081555616000115/exhibit101agreement07202016.htm)] | [added: | | | | |]
| 10.10 | [added: | |] [Omnibus First Amendment to Master Note Agreement and Subsidiary Guaranty Agreement dated as of November 30, 2018 by and among Fastenal Company, Fastenal Company Purchasing, and Fastenal IP Company, on one hand, and Metropolitan Life Insurance Company, NYL Investors LLC, PGIM, Inc., and each holder of Notes that are signatory thereto, on the other hand (incorporated by reference to Exhibit 10.2 to Fastenal Company's Form 8-K dated December 3, [removed: 2018 (file no. 001-16125)).](http://www.sec.gov/Archives/edgar/data/815556/000081555618000052/exhibit102-firstamendmentt.htm)] [added: 2018](http://www.sec.gov/Archives/edgar/data/815556/000081555618000052/exhibit102-firstamendmentt.htm)[).](http://www.sec.gov/Archives/edgar/data/815556/000081555618000052/exhibit102-firstamendmentt.htm)] | [added: | | | | |]
| 13 | [added: | |] [Portions of [removed: 2019] [added: 2020] Annual Report to Shareholders not included in this Form 10-K (only those sections specifically incorporated by reference in this Form 10-K shall be deemed filed with the [removed: SEC)](https://www.sec.gov/Archives/edgar/data/815556/000081555620000011/a2019finalannualreportwr.htm)] [added: SEC)](https://www.sec.gov/Archives/edgar/data/815556/000081555621000008/a2020_annualreportxfinal.htm)] | [added: | | | | |]
| 21 | [added: | |] [List of [removed: Subsidiaries](https://www.sec.gov/Archives/edgar/data/815556/000081555620000011/fast1231201910-kexhibit21.htm)] [added: Subsidiaries](https://www.sec.gov/Archives/edgar/data/815556/000081555621000008/fast1231202010-kexhibit21.htm)] | [added: | | | | |]
| 23 | [added: | |] [Consent of Independent Registered Public Accounting [removed: Firm](https://www.sec.gov/Archives/edgar/data/815556/000081555620000011/fast1231201910-kexhibit23.htm)] [added: Firm](https://www.sec.gov/Archives/edgar/data/815556/000081555621000008/fast1231202010-kexhibit23.htm)] | [added: | | | | |]
| 31 | [added: | |] [Certifications [removed: under Section] [added: under](https://www.sec.gov/Archives/edgar/data/815556/000081555621000008/fast1231202010-kexhibit31.htm) [Section] 302 of the Sarbanes-Oxley Act of [removed: 2002](https://www.sec.gov/Archives/edgar/data/815556/000081555620000011/fast1231201910-kexhibit31.htm)] [added: 2002](https://www.sec.gov/Archives/edgar/data/815556/000081555621000008/fast1231202010-kexhibit31.htm)] | [added: | | | | |]
| 32 | [added: | |] [Certification under Section 906 of the Sarbanes-Oxley Act of [removed: 2002](https://www.sec.gov/Archives/edgar/data/815556/000081555620000011/fast1231201910-kexhibit32.htm)] [added: 2002](https://www.sec.gov/Archives/edgar/data/815556/000081555621000008/fast1231202010-kexhibit32.htm)] | [added: | | | | |]
| 101 | [added: | |] The following financial statements from the Annual Report on Form 10-K for the year ended December 31, [removed: 2019,] [added: 2020,] formatted in Inline XBRL: (i) Consolidated Balance Sheets, (ii) Consolidated Statements of Earnings, (iii) Consolidated Statements of Comprehensive Income, (iv) Consolidated Statements of Stockholders’ Equity, (v) Consolidated Statements of Cash Flows, and (vi) Notes to Consolidated Financial Statements. | [added: | | | | |]
| 104 | [added: | |] The cover page from the Annual Report on Form 10-K for the year ended December 31, [removed: 2019,] [added: 2020,] formatted in Inline XBRL. | [added: | | | | |]
| | | | | | |
| --- | --- | --- | --- | --- | --- |
| | | | | | | | | |
| --- | --- | --- | --- | --- | --- | --- | --- | --- |
| 4.5 | | | [Form of Senior Notes due May 15, 2025 (incorporated by reference to Exhibit 4.1 to Fastenal Company's Form 10-Q for the quarter ended June 30, 2020)](https://www.sec.gov/Archives/edgar/data/815556/000081555620000056/fast6302020ex41.htm) | | | | | |
| 4.6 | | | [Form of Senior Notes due May 15, 2027 (incorporated by reference to Exhibit 4.2 to Fastenal Company's Form 10-Q for the quarter ended June 30, 2020)](https://www.sec.gov/Archives/edgar/data/815556/000081555620000056/fast6302020ex42.htm) | | | | | |
| 4.7 | | | [Form of Senior Notes due June 24, 2023 (incorporated by reference to Exhibit 4.3 to Fastenal Company's Form 10-Q for the quarter ended June 30, 2020)](https://www.sec.gov/Archives/edgar/data/815556/000081555620000056/fast6302020ex43.htm) | | | | | |
| 4.8 | | | [Form of Senior Notes due June 24, 2026 (incorporated by reference to Exhibit 4.4 to Fastenal Company's Form 10-Q for the quarter ended June 30, 2020)](https://www.sec.gov/Archives/edgar/data/815556/000081555620000056/fast6302020ex44.htm) | | | | | |
| 4.9 | | | [Form of Senior Notes due June 24, 2030 (incorporated by reference to Exhibit 4.5 to Fastenal Company's Form 10-Q for the quarter ended June 30, 2020)](https://www.sec.gov/Archives/edgar/data/815556/000081555620000056/fast6302020ex45.htm) | | | | | |
| | | | | | | | | |
| --- | --- | --- | --- | --- | --- | --- | --- | --- |
| Exhibit Number | | | Description of Document | | | | | |
| 10.11 | | | [Consent, Waiver and Agreement to Master Note Agreement dated as of June 10, 2020 by and among Fastenal Company, Fastenal Company Purchasing, and Fastenal IP Company, on the one hand, and Metropolitan Life Insurance Company, MetLife Investment Management, LLC, NYL Investors LLC, PGIM, Inc. and each holder of Notes that are signatory thereto, on the other hand](https://www.sec.gov/Archives/edgar/data/815556/000081555620000056/fast6302020ex101.htm) [(incorporated by reference to Exhibit 10.1 to Fastenal Company's Form 10-Q for the quarter ended June 30, 2020)](https://www.sec.gov/Archives/edgar/data/815556/000081555620000056/fast6302020ex101.htm)[.](https://www.sec.gov/Archives/edgar/data/815556/000081555620000056/fast6302020ex101.htm) | | | | | |
| | |
| --- | --- |
Item 16. FORM 10-K SUMMARY
26 rewritten, 22 added, 9 removed, 10 unchanged
Years ended December 31, [added: 2020,] 2019, [removed: 2018,] and [removed: 2017][added: 2018]
| Description | [added: | |] Balance at Beginning of Year | | | | [added: | |] "Additions" Charged to Costs and Expenses | | | [added: | | |] "Other" Additions (Deductions) | | | [added: | | |] "Less" Deductions | | | [added: | | |] Balance at End of Year | | [added: |]
| Year ended December 31, 2019 | | | | | | | | | | | | | | | | [added: | | | | | | | | | | | | | |]
| Allowance for [removed: doubtful accounts] [added: credit losses] | [removed: $] | [removed: 12.8] | [added: $] | [added: 12.8] | [removed: 5.5] | | | [removed: —] | [added: 5.5] | | [removed: 7.4] | | | [removed: 10.9] | [added: —] | [added: | | | | | 7.4 | | | | | | 10.9 | | |]
| Insurance reserves | [removed: $] | [removed: 37.6] | [added: $] | [added: 37.6] | [removed: 69.7] | | [removed: (1)] | [removed: —] | [added: 69.7] | | [removed: 66.2] | [added: (1)] | [removed: (2)] | [removed: 41.1] | [added: —] | [added: | | | | | 66.2 | | | (2) | | | 41.1 | | |]
| Year ended December 31, 2018 | | | | | | | | | | | | | | | | [added: | | | | | | | | | | | | | |]
| Allowance for [removed: doubtful accounts] [added: credit losses] | [added: | |] $ | 11.9 | | | [added: | |] 8.1 | | | [added: | | |] — | | | [added: | | |] 7.2 | | | [added: | | |] 12.8 | | [added: |]
| Insurance reserves | [added: | |] $ | 39.0 | | | [added: | |] 66.9 | | [added: |] (1) | [added: | |] — | | | [added: | | |] 68.3 | | [added: |] (2) | [added: | |] 37.6 | | [added: |]
| Year ended December 31, [removed: 2017] [added: 2020] | | | | | | | | | | | | | | | | [added: | | | | | | | | | | | | | |]
| Date: | | [added: | | | |] February [removed: 6, 2020] [added: 8, 2021] | [added: | |]
| FASTENAL COMPANY | | | [added: | | | | | |]
| By | | [added: | | | |] /s/ Daniel L. Florness | [added: | |]
| | | [added: | | | |] Daniel L. Florness, President and Chief Executive Officer | [added: | |]
| /s/ Daniel L. Florness | | | [added: | | | | | |] /s/ Holden Lewis | [added: | |]
| Daniel L. Florness, President and Chief Executive Officer (Principal Executive Officer), and Director | | | [added: | | | | | |] Holden Lewis, Executive Vice President and Chief Financial Officer (Principal Financial Officer) | [added: | |]
| /s/ Sheryl A. Lisowski | | | | [added: | | | | | | | |]
| Sheryl A. Lisowski, [removed: Controller,] [added: Executive Vice President -] Chief Accounting [removed: Officer,] [added: Officer] and Treasurer (Principal Accounting Officer) | | | | [added: | | | | | | | |]
| Willard D. Oberton, Director (Chairman) | | | [removed: Darren R. Jackson,] [added: | | | | | | Hsenghung Sam Hsu,] Director | [added: | |]
| /s/ Michael J. Ancius | | | [added: | | | | | |] /s/ Daniel L. Johnson | [added: | |]
| Michael J. Ancius, Director | | | [added: | | | | | |] Daniel L. Johnson, Director | [added: | |]
| /s/ Michael J. Dolan | | | [added: | | | | | |] /s/ Nicholas J. Lundquist | [added: | |]
| Michael J. Dolan, Director | | | [added: | | | | | |] Nicholas J. Lundquist, Director | [added: | |]
| /s/ Stephen L. Eastman | | | [added: | | | | | |] /s/ Scott A. Satterlee | [added: | |]
| Stephen L. Eastman, Director | | | [added: | | | | | |] Scott A. Satterlee, Director | [added: | |]
| /s/ Rita J. Heise | | | [added: | | | | | |] /s/ Reyne K. Wisecup | [added: | |]
| Rita J. Heise, Director | | | [added: | | | | | |] Reyne K. Wisecup, Director | [added: | |]
| | | | | | | | | | | | | | | | | | | | | | | | | | | | | | |
| --- | --- | --- | --- | --- | --- | --- | --- | --- | --- | --- | --- | --- | --- | --- | --- | --- | --- | --- | --- | --- | --- | --- | --- | --- | --- | --- | --- | --- | --- |
| Allowance for credit losses | | | $ | 10.9 | | | | | 7.5 | | | | | | — | | | | | | 6.1 | | | | | | 12.3 | | |
| Insurance reserves | | | $ | 41.1 | | | | | 72.1 | | | (1) | | | — | | | | | | 72.2 | | | (2) | | | 41.0 | | |
| | | | | | | | | |
| --- | --- | --- | --- | --- | --- | --- | --- | --- |
| | | | | | | | | |
| | | | | | | | | |
| | | | | | | | | |
| --- | --- | --- | --- | --- | --- | --- | --- | --- |
| Date: | | | | | | February 8, 2021 | | |
| | | | | | | | | | | | |
| --- | --- | --- | --- | --- | --- | --- | --- | --- | --- | --- | --- |
| | | | | | | | | | | | |
| | | | | | | | | | | | |
| | | | | | | | | | | | |
| /s/ Willard D. Oberton | | | | | | | | | /s/ Hsenghung Sam Hsu | | |
| | | | | | | | | | | | |
| | | | | | | | | | | | |
| | | | | | | | | | | | |
| | | | | | | | | | | | |
| | | | | | | | | | | | |
| | | | | | | | | | | | | | | | |
| --- | --- | --- | --- | --- | --- | --- | --- | --- | --- | --- | --- | --- | --- | --- | --- |
| Allowance for doubtful accounts | $ | 11.2 | | | 8.2 | | | — | | | 7.5 | | | 11.9 | |
| Insurance reserves | $ | 34.6 | | | 68.2 | | (1) | — | | | 63.8 | | (2) | 39.0 | |
| | | |
| --- | --- | --- |
| | | | |
| --- | --- | --- | --- |
| /s/ Willard D. Oberton | | | /s/ Darren R. Jackson |