 filings.tools
Fastenal (FAST) 10-K risk factor changes: FY2019 vs FY2018
The 2019-12-31 10-K against the 2018-12-31 one, compared heading by heading and sentence by sentence. One of these filings carries no fiscal year tag, so its year is the calendar year of the period end.
Item 1A45 rewritten10 added39 removed157 unchanged
All filing items795 rewritten401 added307 removed1,219 unchanged
Summary
counted, not written
- Item 1A headings could not be compared: only 0 carried over between the two years, which usually means one filing was read wrongly, so none is reported as new or removed.
- Sentence by sentence, 401 added, 307 removed, 795 rewritten and 1,219 unchanged across 17 items that differ.
Sentences by item
22 items, with every count and a link to each item that changed
Underlined words on a shaded ground are new in FY2019; struck-through words were in FY2018. Sentences that are wholly new or wholly gone are labelled rather than marked.
Item 1A. RISK FACTORS
45 rewritten, 10 added, 39 removed, 157 unchanged
[removed: Company Risks][added: Company Risks]
[removed: Products] [added: Products] that we sell may expose us to potential material liability for property damage, environmental damage, personal injury, or death linked to the use of those products by our [removed: customers.][added: customers. Some of our customers operate in challenging industries where there is a material risk of catastrophic events.]
[removed: Interruptions] [added: Interruptions] in the proper functioning of information systems or the inability to maintain or upgrade our information systems, or convert to alternate systems in a timely and efficient manner, could disrupt operations, cause unanticipated increases in costs and/or decreases in revenues, and result in less efficient [removed: operations.][added: operations. The proper functioning of our information systems is critical to many aspects of our business and we could be adversely affected if we experience a disruption or data loss relating to our information systems and are unable to recover in a timely manner.]
[removed: In] [added: In] the event of a cyber security incident, we could experience certain operational interruptions, incur substantial additional costs, become subject to legal or regulatory proceedings, or suffer damage to our reputation in the [removed: marketplace.][added: marketplace. The nature of our business requires us to receive, retain, and transmit certain personally identifying information that our customers provide to purchase products or services, register on our websites, or otherwise communicate and interact with us.]
[removed: We have not encountered any meaningful incidents but there] [added: There] can be no assurance that we will not experience a cyber security incident that may materially impact our consolidated financial statements.
[removed: We] [added: We] may be unable to meet our goals regarding the growth drivers of our [removed: business.][added: business. Our sales growth is dependent primarily on our ability to attract new customers and increase our activity with existing customers.]
[added: Failure to achieve any of our goals regarding industrial vending, FMI,] Onsite locations, national accounts signings, digital solutions, international operations, or other growth drivers could negatively impact our long-term sales growth.
[removed: Further, failure to identify appropriate targets for our Onsite and industrial vending] businesses or failure to find suitable locations for them once appropriate targets are identified may adversely impact our goals regarding the number of new Onsite locations we are able to open or the number of industrial vending devices we are able to deploy.
[removed: Changes] [added: Changes] in customer or product mix, downward pressure on sales prices, and changes in volume of orders could cause our gross profit percentage to fluctuate or decline in the [removed: future.][added: future. Changes in our customer or product mix could cause our gross profit percentage to fluctuate or decline.]
This factor has become more significant as revenues from Onsite locations [removed: has] [added: have] grown in the mix.
Downward pressure on sales [removed: prices and] [added: prices,] changes in the volume of our [removed: orders] [added: orders, and an inability to pass higher product costs on to customers] could also cause our gross profit percentage to fluctuate or decline.
Customer and product mix have contributed to the decline in our gross profit percentage over time, including in [removed: 2018] [added: 2019] and [removed: 2017,] [added: 2018,] and will likely continue to affect our gross profit percentage in [removed: 2019] [added: 2020] and beyond.
[removed: Our] [added: Our] operating and administrative expenses could grow more rapidly than net sales which could result in failure to achieve our goals related to leveraging revenue growth into higher net [removed: earnings.][added: earnings. Over time, we have generally experienced an increase in our operating and administrative expenses, including costs related to payroll, occupancy, freight, and information technology, among others, as our net sales have grown.]
[removed: Our] [added: Our] competitive advantage in our industrial vending business could be eliminated and the loss of key suppliers of equipment and services for that business could be disruptive and could result in failure to deploy [removed: devices.][added: devices. We believe we have a competitive advantage in industrial vending due to our vending hardware and software, our local branch presence (allowing us to service devices more rapidly), our 'vendible' product depth, and, in North America, our distribution strength.]
[removed: The] [added: The] ability to identify new products and product lines, and integrate them into our selling locations and distribution network, may impact our ability to compete, our ability to generate additional sales, and our profit [removed: margins.][added: margins. Our success depends in part on our ability to develop product expertise at the selling location level and identify future products and product lines that complement existing products and product lines and that respond to our customers' needs.]
[removed: Our] [added: Our] ability to successfully attract and retain qualified personnel to staff our selling locations could impact labor costs, sales at existing selling locations, and the successful execution of our growth [removed: drivers.][added: drivers. Our success depends in part on our ability to attract, motivate, and retain a sufficient number of qualified employees, including inside and outside branch associates, Onsite managers, national account sales representatives, and support personnel, who understand and appreciate our culture and are able to adequately represent this culture to our customers.]
Qualified individuals of the requisite caliber and number needed to fill these positions may be in short supply in some areas, and the turnover rate in the industry is [removed: high.][added: high, particularly for less tenured employees.]
[removed: and retain personnel capable of consistently providing a high level of customer] service, as demonstrated by their enthusiasm for our culture and product knowledge, our sales could be materially adversely affected.
[removed: Our] [added: Our] inability to attract or transition key executive officers may divert the attention of other members of our senior leadership and adversely impact our existing [removed: operations.][added: operations. Our success depends on the efforts and abilities of our key executive officers and senior leadership.]
[removed: We] [added: We] may not be able to compete effectively against traditional or non-traditional competitors, which could cause us to lose market share or erode our [added: gross and/or] operating income profit and/or [removed: percentage.][added: percentage. The industrial, construction, and maintenance supply industry, although slowly consolidating, still remains a large, fragmented, and highly competitive industry.]
These pressures could have the effect of eroding our [added: gross and/or] operating income profit and/or percentage over time.
[removed: Our] [added: Our] business is subject to a wide array of operating laws and regulations in every jurisdiction where we operate.
[added: Compliance with these laws and regulations increases the cost of doing business and failure to comply could result in the imposition of fines or penalties and the termination of contracts.] We are subject to a variety of laws and regulations including without limitation; import and export requirements, anti-bribery and corruption laws, product compliance laws, environmental laws, foreign exchange controls and cash repatriation restrictions, advertising regulations, data privacy and cyber security requirements, regulations on suppliers regarding the sources of supplies or products, labor and employment laws, and anti-competition regulations.
[removed: Tax] [added: Tax] laws and regulations require compliance efforts that can increase our cost of doing business and changes to these laws and regulations could impact financial [removed: results.][added: results. We are subject to a variety of tax laws and regulations in the jurisdictions in which we operate.]
[removed: We] [added: We] may not be successful in integrating acquisitions and achieving intended benefits and [removed: synergies.][added: synergies. We have completed several acquisitions of businesses in recent years.]
[removed: Industry] [added: Industry] and General Economic [removed: Risks][added: Risks]
[removed: A] [added: A] downturn in the economy or in the principal markets served by us and other factors may affect customer spending, which could harm our operating [removed: results.][added: results. In general, our sales represent spending on discretionary items or consumption needs by our customers.]
This risk was most recently demonstrated in [removed: 2015 and 2016.][added: 2019.]
[removed: New trade] [added: Trade] policies could make sourcing product from overseas more difficult and/or more costly, and could adversely impact our [added: gross and/or] operating profit [removed: percentage.][added: percentage. We source a significant amount of the products we sell from outside of the United States, primarily Asia.]
In particular, the tariffs levied on [removed: certain] [added: most of our] products originating in [removed: China, including many that we source and sell, that went into effect on September 24, 2018,] [added: China] have caused us to review and implement potential solutions to the increase in our product costs with our customers.
[removed: New trade] [added: Trade] policies could have an adverse impact on industries we sell into, negatively affecting our net sales and [removed: profits.][added: profits. Considerable political uncertainty in the United States may result in changes to trade policies that could create disruption in geographic demand trends.]
[removed: Products] [added: Products] manufactured in foreign countries may cease to be available for reasons unrelated to trade policy, which could adversely affect our inventory levels and operating [removed: results.][added: results. We obtain certain of our products, and our suppliers obtain certain of their products, from China, Taiwan, South Korea, Mexico, and other foreign countries.]
[removed: Changes] [added: Changes] in energy costs and the cost of raw materials used in our products could impact our net sales, cost of sales, gross profit percentage, distribution expenses, and occupancy expenses, which may result in lower operating [removed: income.][added: income. Costs of raw materials used in our products (e.g., steel) and energy costs can fluctuate significantly over time.]
While increases in the cost of fuel or raw materials could be damaging to us, decreases in those costs, particularly if severe, could also adversely impact us by creating deflation in selling prices, which could cause our gross profit to [removed: deteriorate,] [added: decline,] or by negatively impacting customers in certain industries, which could cause our sales to those customers to decline.
[removed: The] [added: The] industrial, construction, and maintenance supply industry is consolidating, which could cause it to become more competitive and could negatively impact our market share, gross profit, and operating [removed: income.][added: income. The industrial, construction, and maintenance supply industry in North America is consolidating.]
[removed: Inclement] [added: Inclement] weather and other disruptions to the transportation network could adversely impact our distribution system and demand for our [removed: products.][added: products. Our ability to provide efficient distribution of core business products to our branch network is an integral component of our overall business strategy.]
[removed: Our] [added: Our] current estimates of total market potential as well as the market potential of our business strategies could be [removed: incorrect.][added: incorrect. We believe we have a significant opportunity for growth based on our belief that North American market demand for the products we sell is estimated to exceed $140 billion.]
In addition, the market potential of a particular business strategy may vary from expectations due to a change in the [removed: marketplace (such as changes in customer concentration or needs), a change in the nature of that business strategy, or weaker]
[removed: We] [added: We] are exposed to foreign currency exchange rate risk, and changes in foreign exchange rates could increase the cost of purchasing products and impact our foreign [removed: sales.][added: sales. Because the functional currency related to most of our foreign operations is the applicable local currency, we are exposed to foreign currency exchange rate risk arising from transactions in the normal course of business.]
[removed: Tight] [added: Tight] credit markets could impact our ability to obtain financing on reasonable terms or increase the cost of existing or future financing and interest rate fluctuations could adversely impact our [removed: results.][added: results. As of December 31, 2019, we had $345.0 of outstanding debt obligations, including loans outstanding under our revolving credit facility (the 'Credit Facility') of $210.0 and senior unsecured promissory notes issued under our master note agreement (the 'Master Note Agreement') in the aggregate principal amount of $135.0.]
Further, failure to identify appropriate targets for our Onsite and industrial vending
We may not be able to pass rising product costs to customers if those customers have ready product or supplier alternatives in the marketplace.
If we are unable to hire and retain personnel capable of consistently providing a high level of customer
After experiencing strong demand in 2017 and 2018 that produced double-digit sales growth for Fastenal, our growth slowed into the mid-single digits beginning in the second quarter of 2019.
During that period, many of our customers involved in the manufacture of components, capital goods, and heavy equipment were impacted by higher costs and reduced confidence stemming from global trade uncertainty.
The first of these actions occurred on September 24, 2018, but since that date there have been additional actions to both increase the number of products covered by tariffs and to raise the tariff rates themselves.
We have taken actions, including increasing product prices, re-sourcing product, and seeking exemptions for certain products, that have been mostly effective at offsetting the impacts of tariffs on our financial results.
The effectiveness of these strategies in response to any future tariffs is unknown.
In September 2018, hurricane Florence had a similar impact in our Carolinas region, and in the first quarter of 2019, severe winter weather had a similar impact across the northern part of the United States.
marketplace (such as changes in customer concentration or needs), a change in the nature of that business strategy, or weaker than anticipated acceptance by customers of that business strategy.
Some of our customers operate in challenging industries where there is a material risk of catastrophic events.
The proper functioning of our information systems is critical to many aspects of our business and we could be adversely affected if we experience a disruption or data loss relating to our information systems and are unable to recover in a timely manner.
The nature of our business requires us to receive, retain, and transmit certain personally identifying information that our customers provide to purchase products or services, register on our websites, or otherwise communicate and interact with us.
Our sales growth is dependent primarily on our ability to attract new customers and increase our activity with existing customers.
Failure to achieve any of our goals regarding industrial vending, FMI,
Changes in our customer or product mix could cause our gross profit percentage to fluctuate or decline.
If our customer or product mix continues to change, our gross profit percentage may decline further.
Over time, we have generally experienced an increase in our operating and administrative expenses, including costs related to payroll, occupancy, freight, and information technology, among others, as our net sales have grown.
We believe we have a competitive advantage in industrial vending due to our vending hardware and software, our local branch presence (allowing us to service devices more rapidly), our 'vendible' product depth, and in North America, our distribution strength.
Our success depends in part on our ability to develop product expertise at the selling location level and identify future products and product lines that complement existing products and product lines and that respond to our customers' needs.
Our success depends in part on our ability to attract, motivate, and retain a sufficient number of qualified employees, including inside and outside branch associates, Onsite managers, national account sales representatives, and support personnel, who understand and appreciate our culture and are able to adequately represent this culture to our customers.
If we are unable to hire
Our success depends on the efforts and abilities of our key executive officers and senior leadership.
The industrial, construction, and maintenance supply industry, although slowly consolidating, still remains a large, fragmented, and highly competitive industry.
Compliance with these laws and regulations increases the cost of doing business and failure to comply could result in the imposition of fines or penalties and the termination of contracts.
We are subject to a variety of tax laws and regulations in the jurisdictions in which we operate.
We have completed several acquisitions of businesses in recent years.
In general, our sales represent spending on discretionary items or consumption needs by our customers.
We have significant exposure to companies involved in the manufacture of capital goods and heavy equipment.
In 2015, our business was impacted by lower commodity prices, including oil, lower corporate capital spending, and a strong U.S. dollar.
These variables resulted in some of our customers exhibiting a reduced level of business activity and confidence.
These same dynamics carried into 2016.
In 2017, these conditions mostly reversed.
Certain commodity prices recovered and corporate investment improved, leading to better capital spending trends among our customers.
This improvement in customer spending helped to improve our net sales and sales growth in 2017 and throughout 2018.
We source a significant amount of the products we sell from outside of the United States, primarily Asia.
However, it is too early to determine the ultimate impact and effectiveness of these discussions.
Considerable political uncertainty in the United States may result in changes to trade policies that could create disruption in geographic demand trends.
We obtain certain of our products, and our suppliers obtain certain of their products, from China, Taiwan, South Korea, Mexico, and other foreign countries.
Costs of raw materials used in our products (e.g., steel) and energy costs can fluctuate significantly over time.
The industrial, construction, and maintenance supply industry in North America is consolidating.
Our ability to provide efficient distribution of core business products to our branch network is an integral component of our overall business strategy.
In September 2018, hurricane Florence had a similar impact in our Carolinas region.
We believe we have a significant opportunity for growth based on our belief that North American market demand for the products we sell is estimated to exceed $140 billion.
than anticipated acceptance by customers of that business strategy.
Because the functional currency related to most of our foreign operations is the applicable local currency, we are exposed to foreign currency exchange rate risk arising from transactions in the normal course of business.
As of December 31, 2018, we had $500.0 of outstanding debt obligations, including loans outstanding under our revolving credit facility (the 'Credit Facility') of $365.0 and senior unsecured promissory notes issued under our master note agreement (the 'Master Note Agreement') in the aggregate principal amount of $135.0.
Stock prices, including ours, are commonly thought to be a function of earnings multiplied by a multiple.
Although our board of directors has historically authorized the payment of quarterly cash dividends on our common stock and indicated an intention to do so in the future, there are no assurances that we will continue to pay dividends in the future or continue to increase dividends at historic rates.
An excerpt. Shown here: 40 of 45 rewritten, all 10 added and all 39 removed. The counts are complete. For every sentence, read Item 1A. RISK FACTORS in the FY2019 filing and the FY2018 filing.
Item 7. MANAGEMENT'S DISCUSSION AND ANALYSIS OF FINANCIAL CONDITION AND RESULTS OF OPERATIONS
198 rewritten, 98 added, 72 removed, 266 unchanged
[removed: Business] [added: Business] and Operational [removed: Overview][added: Overview]
We distribute these supplies through a network of [removed: approximately 3,100] [added: over 3,200] in-market locations.
Other users of our products include farmers, truckers, railroads, oil [removed: exploration,] [added: exploration companies, oil] production and refinement companies, mining companies, federal, state, and local governmental entities, schools, and certain retail trades.
Geographically, our [removed: branches] [added: branches, Onsite locations,] and customers are primarily located in North America.
Our approach to addressing these aspects of our marketplace is captured in our motto [removed: Growth] [added: Growth] through Customer [removed: Service.][added: Service.]
[removed: Executive Overview][added: Executive Overview]
Our gross profit as a percentage of net sales declined to [removed: 48.3%] [added: 47.2%] in [removed: 2018] [added: 2019] from [removed: 49.3%] [added: 48.3%] in [removed: 2017.][added: 2018.]
Our net earnings in [removed: 2018] [added: 2019] were [removed: $751.9,] [added: $790.9,] an increase of [removed: 29.9%] [added: 5.2%] when compared to [removed: 2017.][added: 2018.]
Our diluted net earnings per share were [removed: $2.62] [added: $1.38] in [removed: 2018] [added: 2019] compared to [removed: $2.01] [added: $1.31] in [removed: 2017,] [added: 2018,] an increase of [removed: 30.5%.][added: 5.2%.]
We continued to focus on our growth drivers in [removed: 2018.][added: 2019.]
[removed: We signed 152 new] [added: Daily sales to our] national account [removed: contracts] [added: customers] (defined as [removed: new] customer accounts with a multi-site contract) [removed: and our national accounts revenues] grew [removed: 18.1%] [added: 11.9%] in the period.
Additionally, we signed [removed: 336] [added: 362] new Onsite customer locations (defined as dedicated sales and service provided from within, or in close proximity to, the customer's facility) and [removed: 22,073] [added: 21,857] new industrial vending devices.
[removed: Sales] [added: We experienced sales] growth in [removed: 2018 exceeded 20%] [added: the mid-teens] through both our vending devices and our Onsite locations (excluding sales transferred from a branch).
| | [removed: Q4 2018] [added: Q4 2019] | | | Q4 [removed: 2017] [added: 2018] | | | Twelve-month % Change | |
| In-market locations - absolute employee headcount | [removed: 14,015] [added: 13,977] | | | [removed: 13,424] [added: 14,015] | | | [removed: 4.4] [added: \-0.3] | % |
| Total absolute employee headcount | [removed: 21,644] [added: 21,948] | | | [removed: 20,565] [added: 21,644] | | | [removed: 5.2] [added: 1.4] | % |
| Number of public branch locations | [removed: 2,227] [added: 2,114] | | | [removed: 2,383] [added: 2,227] | | | [removed: \-6.5] [added: \-5.1] | % |
| Number of active Onsite locations | [removed: 894] [added: 1,114] | | | [removed: 605] [added: 894] | | | [removed: 47.8] [added: 24.6] | % |
| Number of in-market locations | [removed: 3,121] [added: 3,228] | | | [removed: 2,988] [added: 3,121] | | | [removed: 4.5] [added: 3.4] | % |
| Industrial vending devices (installed count) (1) | [removed: 81,137] [added: 89,937] | | | [removed: 71,421] [added: 81,137] | | | [removed: 13.6] [added: 10.8] | % |
| [removed: Ratio] [added: *Ratio] of industrial vending devices to in-market [removed: locations] [added: locations*] | [removed: 26:1] [added: 28:1] | | | [removed: 24:1] [added: *26:1*] | | | | |
During the last twelve months, we [removed: increased] [added: reduced] our absolute employee headcount by [removed: 591] [added: 38] people in our in-market locations and [removed: 1,079] [added: increased by 304] people in total.
Our in-market network forms the foundation of our business strategy, and we will continue to open or close locations as is deemed necessary to sustain and improve our [removed: network and] [added: network,] support our growth [removed: drivers.][added: drivers, and manage our operating expenses.]
[removed: Results] [added: Results] of [removed: Operations][added: Operations]
| | | [removed: 2018] [added: 2019] | | | [removed: 2017] [added: 2018] | | | [removed: 2016] [added: 2017] | |
| Net sales | | [removed: 100.0] [added: 100.0] | [removed: %] [added: %] | | 100.0 | % | | 100.0 | % |
| Gross profit | | [removed: 48.3] [added: 47.2] | [removed: %] [added: %] | | [removed: 49.3] [added: 48.3] | % | | [removed: 49.6] [added: 49.3] | % |
| Operating and administrative expenses | | [removed: 28.2] [added: 27.4] | [removed: %] [added: %] | | [removed: 29.2] [added: 28.2] | % | | [removed: 29.5] [added: 29.2] | % |
| Gain on sale of property and equipment | | [removed: 0.0] [added: 0.0] | [removed: %] [added: %] | | 0.0 | % | | 0.0 | % |
| Operating income | | [removed: 20.1] [added: 19.8] | [removed: %] [added: %] | | 20.1 | % | | 20.1 | % |
| Net interest expense | | [removed: \-0.3] [added: \-0.3] | [removed: %] [added: %] | | [removed: \-0.2] [added: \-0.3] | % | | \-0.2 | % |
| Earnings before income taxes | | [removed: 19.9] [added: 19.6] | [removed: %] [added: %] | | 19.9 | % | | 19.9 | % |
[removed: Net Sales][added: Net Sales]
| | [removed: 2018] [added: 2019] | | | | [removed: 2017] [added: 2018] | | | [removed: 2016] [added: 2017] | |
| Net sales | [removed: $] [added: $] | [removed: 4,965.1] [added: 5,333.7] | | | [removed: 4,390.5] [added: 4,965.1] | | | [removed: 3,962.0] [added: 4,390.5] | |
| Percentage change | [removed: 13.1] [added: 7.4] | | [removed: %] [added: %] | | [removed: 10.8] [added: 13.1] | % | | [removed: 2.4] [added: 10.8] | % |
| Business days | [removed: 254] [added: 254] | | | | 254 | | | [removed: 255] [added: 254] | |
| Daily sales | [removed: $] [added: $] | [removed: 19.5] [added: 21.0] | | | [removed: 17.3] [added: 19.5] | | | [removed: 15.5] [added: 17.3] | |
| Percentage change | [removed: 13.1] [added: 7.4] | | [removed: %] [added: %] | | [removed: 11.3] [added: 13.1] | % | | [removed: 2.0] [added: 11.3] | % |
| Daily sales impact of currency fluctuations | [removed: 0.1] [added: \-0.3] | | [removed: %] [added: %] | | 0.1 | % | | [removed: \-0.4] [added: 0.1] | % |
Net sales increased $368.6, or 7.4%, in 2019 relative to 2018.
Our operating income as a percentage of net sales declined to 19.8% in 2019 from 20.1% in 2018.
Discrete tax items benefited net earnings by $7.1 in 2018.
The reduction in our absolute employee headcount in our in-market locations reflects actions taken by leadership in our public branches over the past couple of quarters to control expenses in response to weaker demand, which was only partly offset by increases to support growth in our number of Onsite locations.
The increase in our total absolute employee headcount is mostly from additions we have made to support customer acquisition, implementation, and growth in the field, particularly as it relates to our growth drivers and to support general corporate and hub functions.
We opened twelve branches and closed 125 branches, net of conversions, in 2019.
We activated 312 Onsite locations and closed 92, net of conversions, in 2019.
The number of closings reflects both normal churn in our business, whether due to exiting customer relationships, the shutting or relocation of a customer facility, or a customer decision, as well as a review of certain underperforming locations.
The first is higher underlying market demand, which we believe is reflected in a number of metrics.
In addition, U.S. Industrial Production, which is published by the Federal Reserve, increased 0.8% in 2019 and increased 3.9% in 2018.
We believe U.S. Industrial Production is a good proxy for the state of our marketplace and that the growth in this metric is consistent with the sales growth rates we experienced in the respective periods.
Another explanation for our results is that while underlying demand throughout 2018 was stable at high levels, underlying demand in 2019 began strong but weakened throughout the year.
For instance, the U.S. Purchasing Managers Index averaged 55.4 in the first quarter of 2019 but averaged 47.9 in the fourth quarter of 2019.
In addition, U.S. Industrial Production increased 2.9% in the first quarter of 2019 but decreased 0.9% in the fourth quarter of 2019.
The slowing in these metrics from the start to the end of 2019 mirrors the slowing growth we experienced in our unit sales over the same period.
A relatively greater contributor to our growth in 2019 was the success of our growth initiatives.
We signed 21,857 industrial vending devices during 2019.
While this represented a slight decrease in signings of 1.0% from 2018, it also contributed to growth in our installed base to 89,937 vending devices at the end of 2019, an increase of 10.8% over 2018.
Growth in our installed base was primarily responsible for sales growth through our vending devices in the mid-teens during 2019.
We signed 362 new Onsite locations in 2019, an increase of 7.7% over 2018, and had 1,114 active sites on December 31, 2019, an increase of 24.6% over December 31, 2018.
Growth in our number of active sites was primarily responsible for sales growth through our Onsites in the mid-teens during 2019.
In addition to an increase in our
a decrease in our device removals of 3.8%.
with growth in the high teens.
sites on December 31, 2017, an increase of 50.9% over December 31, 2016.
2017.
The contribution of these new contracts and strong penetration of existing national account customers resulted in daily
sales from our national account customers growing 14.5% in 2017 compared to 2016.
| Fasteners | 34.2% | | 34.9% | | 35.6% |
| Safety supplies | 17.9% | | 17.2% | | 16.3% |
| Other product lines | 47.9% | | 47.9% | | 48.1% |
| 2019 | 13.3 | % | | 10.5 | % | | 12.7 | % | | 7.4 | % | | 9.5 | % | | 7.0 | % | | 6.1 | % | | 6.3 | % | | 5.8 | % | | 4.3 | % | | 5.7 | % | | 1.0 | % |
| Benchmark | \-1.2 | % | | 1.5 | % | | 3.7 | % | | 0.1 | % | | 2.0 | % | | 2.0 | % | | \-3.3 | % | | 3.7 | % | | 1.8 | % | | \-1.9 | % | | 9.8 | % |
| 2019 | \-0.5 | % | | 1.4 | % | | 4.2 | % | | \-2.4 | % | | 2.5 | % | | 1.4 | % | | \-4.4 | % | | 3.9 | % | | 3.1 | % | | \-4.4 | % | | 4.9 | % |
| 19Delta | 0.6 | % | | \-0.1 | % | | 0.5 | % | | \-2.5 | % | | 0.5 | % | | \-0.6 | % | | \-1.1 | % | | 0.3 | % | | 1.3 | % | | \-2.5 | % | | \-4.9 | % |
| 18Delta | \-0.2 | % | | 2.5 | % | | \-1.6 | % | | 2.4 | % | | \-1.5 | % | | 1.8 | % | | \-0.3 | % | | 0.1 | % | | 1.7 | % | | \-1.1 | % | | 4.2 | % |
| 17Delta | 1.4 | % | | 0.0 | % | | \-0.1 | % | | 2.1 | % | | \-0.6 | % | | 0.9 | % | | 0.9 | % | | \-1.4 | % | | 2.0 | % | | \-0.2 | % | | 3.8 | % |
| 2019 | 13.4 | % | | 9.1 | % | | 7.7 | % | | 5.1 | % | | 8.8 | % |
| 2019 | 11.8 | % | | 5.5 | % | | 3.0 | % | | 1.8 | % | | 5.5 | % |
| 2019 | 12.7 | % | | 9.5 | % | | 8.0 | % | | 5.1 | % | | 8.8 | % |
Net sales increased $574.6, or 13.1%, in 2018 relative to 2017.
Our operating income as a percentage of net sales in 2018 was comparable to 2017 at 20.1% in both years.
Both periods included discrete tax items, primarily related to the Tax Act.
Excluding these discrete items (a benefit of $7.1 in 2018 and a benefit of $24.4 in 2017), our net earnings in 2018 would have been $744.8, an increase of 34.4% when compared to 2017.
Further, our diluted net earnings per share would have been $2.59 in 2018 compared to $1.92 in 2017, an increase of 34.9%.
A portion of this increase relates to a lower tax rate in 2018 that is a feature of the Tax Act.
This increase is mostly a function of additions we have made to support customer growth in the field as well as investments in our growth drivers.
We opened 11 branches and closed 157 branches in 2018.
Additionally, ten branches were converted from public branches to non-public locations.
| | | | | | | | | | |
| --- | --- | --- | --- | --- | --- | --- | --- | --- | --- |
The first is improvement in underlying market demand.
We believe the improvement in general business activity is reflected in a number of metrics.
The second source is success within our growth initiatives.
In 2016, we saw relative weakness from non-residential construction and heavy manufacturing customers and in demand for our fastener products, speaking to the sustained softness in heavy and general industrial markets.
Business with our largest customers was also relatively weak, with sales to our top 100 customers rising modestly in the first half of 2016 and falling modestly in the second half of 2016.
While these trends were representative of conditions in the United States and Canada, total sales outside of these geographic areas were relatively strong and improved over the course of 2016.
Net sales in 2016 were also impacted by slight inflationary price changes in our non-fastener products and some price deflation in our fastener products, with the net impact being a slight drag on growth.
We experienced success with our growth initiatives in 2016, similar to 2017 and 2018; however, their impact to our net sales growth in 2016 was largely offset by a weaker economic environment.
| Fastener product line | 34.9% | | 35.6% | | 36.6% |
| Other product lines | 65.1% | | 64.4% | | 63.4% |
| 2016 | 3.3 | % | | 2.6 | % | | 0.0 | % | | 3.8 | % | | 1.1 | % | | 0.0 | % | | 2.1 | % | | 0.3 | % | | 2.8 | % | | 3.9 | % | | 1.2 | % | | 3.2 | % |
| Benchmark | \-1.0 | % | | 1.1 | % | | 3.9 | % | | \-0.6 | % | | 2.1 | % | | 1.9 | % | | \-3.7 | % | | 4.0 | % | | 1.7 | % | | \-1.9 | % | | 8.6 | % |
| 18Delta | \-0.4 | % | | 2.9 | % | | \-1.9 | % | | 3.1 | % | | \-1.5 | % | | 1.9 | % | | 0.0 | % | | \-0.2 | % | | 1.9 | % | | \-1.2 | % | | 5.3 | % |
| 17Delta | 1.2 | % | | 0.4 | % | | \-0.4 | % | | 2.8 | % | | \-0.7 | % | | 1.0 | % | | 1.3 | % | | \-1.8 | % | | 2.1 | % | | \-0.3 | % | | 4.9 | % |
| 2016 | 0.4 | % | | \-0.8 | % | | 1.5 | % | | 1.7 | % | | 0.6 | % | | \-0.2 | % | | \-2.3 | % | | 2.4 | % | | 1.5 | % | | \-0.9 | % | | 3.6 | % |
| 16Delta | 1.3 | % | | \-1.9 | % | | \-2.5 | % | | 2.3 | % | | \-1.5 | % | | \-2.0 | % | | 1.4 | % | | \-1.7 | % | | \-0.1 | % | | 1.0 | % | | \-5.1 | % |
| 2016 | 1.3 | % | | 1.4 | % | | 1.1 | % | | 2.8 | % | | 1.6 | % |
| 2016 | \-1.7 | % | | \-2.4 | % | | \-2.9 | % | | \-2.4 | % | | \-2.3 | % |
| 2016 | 4.7 | % | | 4.7 | % | | 4.9 | % | | 5.9 | % | | 5.0 | % |
| 2016 | 1.6 | % | | 0.5 | % | | 2.8 | % | | 2.6 | % | | 1.8 | % |
In 2016, volatility and weakness in commodity markets, particularly energy, and lower industrial capital spending contributed to slower growth.
| 2016 | 49.8 | % | | 49.5 | % | | 49.3 | % | | 49.8 | % | | 49.6 | % |
(2) Rising costs related to transporting products, particularly shipping fees, driver wages, and fuel, caused our freight expense to rise faster than sales, hurting our gross profit margin.
(3) We have experienced inflation that has caused the cost of many of the products we purchase to rise.
We have instituted price increases aimed at mitigating the effects of these cost increases, but we believe these actions have lagged in their ability to offset rising costs for our products, particularly fasteners, in 2018.
The increase in 2016, when compared to 2015, was caused by increases in average annual FTE headcount and an increase in health care costs, which were partially offset by a contraction in our performance bonuses and commissions and in our profit sharing contribution, primarily due to lower sales growth, gross profit, and operating income (both on a dollar basis and on a relative basis).
All other operating and administrative expenses increased in 2016 when compared to 2015.
This was driven by primarily by higher IT spending, while selling-related transportation expenses rose modestly and general corporate expenses were relatively flat.
Income taxes, as a percentage of earnings before income taxes, were approximately 36.8% for 2016.
An excerpt. Shown here: 40 of 198 rewritten, 40 of 98 added and 40 of 72 removed. The counts are complete. For every sentence, read Item 7. MANAGEMENT'S DISCUSSION AND ANALYSIS OF FINANCIAL CONDITION AND RESULTS OF OPERATIONS in the FY2019 filing and the FY2018 filing.
Item 7A. QUANTITATIVE AND QUALITATIVE DISCLOSURES ABOUT MARKET RISKS
7 rewritten, 5 added, 2 removed, 16 unchanged
[removed: Foreign] [added: Foreign] currency exchange [removed: rates] [added: rates] – Foreign currency fluctuations can affect our net investments, our operations in countries other than the U.S., and earnings denominated in foreign currencies.
[removed: Commodity] [added: Commodity] steel [removed: pricing] [added: pricing] – We buy and sell various types of steel products; these products consist primarily of different types of threaded [removed: fasteners.][added: fasteners and related hardware.]
[removed: Commodity] [added: Commodity] energy [removed: prices] [added: prices] – We have market risk for changes in prices of [added: oil,] gasoline, diesel fuel, natural gas, and electricity.
[removed: Prices for these commodities began to ease late in the year, but for] [added: However, through] most of [removed: 2018, we saw rising costs for] [added: 2018 the prices of] these [removed: commodities, and that resulted in increases] [added: commodities increased, resulting] in [added: higher] fuel costs for our hub and field-based vehicles and utility costs for our in-market locations, distribution centers, and manufacturing [removed: facilities.][added: facilities in the period.]
As a result, rising costs for these commodities [removed: in recent months are resulting] [added: resulted] in higher costs for many of these products.
[removed: Interest rates] [added: Interest rates] - Loans under our Credit Facility bear interest at floating rates tied to LIBOR (or, if LIBOR is no longer available, at a replacement rate to be determined by the administrative agent for the Credit Facility and consented to by us).
A one percentage point increase in LIBOR in [removed: 2018] [added: 2019] would have resulted in approximately [removed: $3.0] [added: $3.2] of additional interest expense.
In 2019, changes in foreign currency exchange rates reduced our reported net sales by $14.8 with the estimated effect on our net earnings being immaterial.
During 2019, the price of commodity steel as reflected in many market indexes has declined.
Prices for gasoline and diesel were mostly stable over the course of 2019, resulting in our fuel costs being similarly stable during the period.
This carried over from the latter part of 2018 when the costs of these commodities began to ease.
In 2019, our estimated net earnings exposure for commodity energy prices was immaterial.
During the first half of 2016, we experienced some deflation in the cost of steel products.
This deflation was largely offset by some inflation in the latter half of the year.
Item 1. BUSINESS
122 rewritten, 47 added, 42 removed, 168 unchanged
The year end is December 31, [removed: 2018] [added: 2019] unless additional years are included or noted.
[removed: Overview][added: Overview]
At the end of [removed: 2018,] [added: 2019,] we had [removed: 3,121] [added: 3,228] in-market locations (defined in the table below) in [removed: 26] [added: 25] countries supported by [removed: 14] [added: 15] distribution centers in North America [removed: (11] [added: (12] in the United States, two in Canada, and one in Mexico), and we employed [removed: 21,644] [added: 21,948] people.
| | [removed: 2018] [added: 2019] | | | [added: 2018 | |] 2017 | | 2016 | | 2015 | | 2014 | | 2013 | | 2012 | | 2011 | | 2010 | | [removed: 2009 | |]
| Net sales | [removed: $] [added: $] | [added: 5,333.7 | |] 4,965.1 | | 4,390.5 | | 3,962.0 | | 3,869.2 | | 3,733.5 | | 3,326.1 | | 3,133.6 | | 2,766.9 | | 2,269.5 | | [removed: 1,930.3 | |]
| Public branches | [removed: 2,227] [added: 2,114] | | | [added: 2,227 | |] 2,383 | | 2,503 | | 2,622 | | 2,637 | | 2,687 | | 2,652 | | 2,585 | | 2,490 | | [removed: 2,369 | |]
| Onsite locations(1) | [removed: 894] [added: 1,114] | | | [added: 894 | |] 605 | | 401 | | 264 | | 214 | | | | | | | | | | [removed: | |]
| Total in-market locations(2) | [removed: 3,121] [added: 3,228] | | | [added: 3,121 | |] 2,988 | | 2,904 | | 2,886 | | 2,851 | | 2,687 | | 2,652 | | 2,585 | | 2,490 | | [removed: 2,369 | |]
[removed: Through much of our history, this was achieved by opening branches, and today] [added: Today] we believe there are few companies that offer our North American [removed: branch] [added: in-market location] coverage.
In [removed: 2018,] [added: 2019,] roughly [removed: 54%] [added: 53%] of our sales and [removed: 52%] [added: 53%] of our [removed: branches] [added: in-market locations] were in major Metropolitan Statistical Areas ('MSAs'; populations [added: in the United States and Canada] greater than 500,000 people), while 19% of our sales and [removed: 16%] [added: 17%] of our [removed: branches] [added: in-market locations] were in small MSAs (populations under 500,000 people), and [removed: 27%] [added: 28%] of our sales and [removed: 32%] [added: 30%] of our [removed: branches] [added: in-market locations] were not in [removed: a] [added: an] MSA.
In our view, this has [removed: proved] [added: proven] to be an efficient means of providing customers with a broad range of products and services on a timely basis.
[removed: These branches] [added: Branches] have represented, and continue to represent, the foundation of our service approach.
However, we are constantly evaluating the efficacy of our branch [removed: network, and] [added: network and,] in recent years, we have developed additional models that get us still closer to the customer, including vending, bin stocks, and Onsite locations.
We currently have several versions of selling locations: (1) a 'traditional (or public) branch' [added: typically] services a wide variety of customers and stocks a wide selection of products we offer, [added: both as part of our standard stocking model and tailored to specific customer needs,] (2) an 'overseas branch' focuses on manufacturing customers and our fastener product line [added: (though non-fasteners are becoming more common in these markets)] and is the format we typically deploy outside the United States and Canada, [removed: (3) a 'strategic account branch' is a unique location that sells to multiple large accounts in a market, (4) a 'strategic account site' is similar to a strategic account branch, but typically operates out of an existing branch rather than from a unique location,] and [removed: (5)] [added: (3)] an 'Onsite location' provides dedicated sales and service from within, or in close proximity to, the customer's facility.
[removed: Traditional, overseas,] [added: Traditional] and [removed: strategic account] [added: overseas] branches sell to multiple customers, and together comprise [added: the majority of] our total [removed: branch count.][added: selling locations.]
Onsite locations, which serve a single customer, are [removed: similarly] not included in our total branch counts.
As a result, we refer to our network in terms of in-market locations, which includes our total branches and Onsite [removed: locations, and we refer to strategic account sites as non-in-market] locations.
[removed: Branch locations] [added: Branch locations] are selected primarily based on their proximity to our distribution network, population statistics, and employment data for manufacturing and non-residential construction companies.
[removed: We stock all branches with inventory drawn] from all of our product lines, and over time, where appropriate, our district and branch personnel may tailor the inventory [added: offering to the needs of the local customer base.]
However, in each year since 2013, the company has experienced a net decline in its total branch count including net declines of [removed: 156] [added: 113] branches in [removed: 2018, 120] [added: 2019, 156] branches in [removed: 2017,] [added: 2018,] and [removed: 119] [added: 120] branches in [removed: 2016.][added: 2017.]
We first went [removed: international] [added: international] when we opened a branch in Canada in 1994.
Since then, we have continued to expand our global footprint and at the end of [removed: 2018,] [added: 2019,] we operated in [removed: 25] [added: 24] countries outside of the United States.
Canada and Mexico are the largest of these, representing approximately 11% of total sales collectively, and we also operate in Europe, Asia, [removed: Southeast Asia,] and Central and South America.
Our go-to-market strategy in countries outside of North [removed: America,] [added: America] focuses primarily on servicing large, national account customers.
Our international subsidiaries now have [removed: over 450] [added: 479] in-market locations, including [removed: over 150] [added: 179] Onsite locations, have over [removed: 9,600] [added: 11,800] vending devices installed, and employ over [removed: 3,300] [added: 3,600] people from around the world.
The following table provides a summary of the [removed: traditional, overseas,] [added: public branches] and [removed: strategic account branch] [added: Onsite] locations we operated at the end of each year, as well as the openings, closings, and conversions during each year:
| | United States | | Canada | | Mexico | | Puerto Rico and Dominican Republic | | Subtotal | | | Central & South America (1) | | Asia (2) | | [removed: Southeast Asia] [added: Europe] (3) | | [removed: Europe] [added: Africa] (4) | | [removed: Africa (5)] [added: Subtotal] | | Total | |
| Opened [removed: branches | 5 |] [added: Branches] | [removed: 3] [added: 2] | | [removed: 2] [added: 1] | | — | | [removed: 10] [added: —] | | [added: 3] | [removed: 1] | | — | | — | | [removed: 7] [added: 8] | | — | | [removed: 18] [added: 8] | | [added: 11 | |]
| [removed: Total as of December 31,] [added: Starting Branches -] 2017 | 2,076 | | 195 | | 53 | | 8 | | 2,332 | | | 6 | | [removed: 7 | | 7] [added: 14] | | 29 | | 2 | | [added: 51 | |] 2,383 | |
| [removed: Opened branches] [added: Opened Branches] | [removed: 2] [added: 1] | | [removed: 1] [added: 1] | | [removed: —] [added: 5] | | [removed: —] [added: —] | | [removed: 3] [added: 7] | | | [removed: —] [added: —] | | [removed: —] [added: 1] | | [removed: —] [added: 4] | | [removed: 8] [added: —] | | [removed: —] [added: 5] | | [removed: 11] [added: 12] | |
| [removed: Total as of December 31,] [added: Ending Branches -] 2018 | 1,924 | | 186 | | 52 | | 8 | | 2,170 | | | 6 | | [removed: 7 | | 7] [added: 14] | | 37 | | — | | [added: 57 | |] 2,227 | |
[removed: (3)] [added: (2)] Singapore, [added: China,] Malaysia, and Thailand
[removed: (4)] [added: (3)] The Netherlands, Hungary, United Kingdom, Germany, Czech Republic, Italy, Romania, Sweden, Poland, Austria, [added: Switzerland,] Ireland, Spain, and France
[removed: (5)] [added: (4)] South Africa
[removed: (6) Converted] [added: (5) The net impact of non-in-market] locations [removed: are sites] [added: or Onsite locations] converted [removed: from traditional] [added: to branches,] branches [added: converted] to Onsite locations or non-in-market locations, [removed: net] [added: and closures] of [removed: sites converted from non-in-market locations] [added: branches] or Onsite [removed: locations to traditional branches.][added: locations.]
[removed: Onsite locations] [added: Onsite locations] may influence the trend in total branch count over [removed: time.][added: time, but are not the primary reason for our branch closings.]
In many cases, we are shifting revenue with the customer from an existing [removed: branch.][added: branch, though we are beginning to see more new customer opportunities arise as a result of our Onsite capabilities.]
[added: These include customers with which we have] an existing national account relationship today, as well as potential customers we are aware of due to our local market presence.
We experienced net increases of [added: 220,] 289, [removed: 204,] and [removed: 137] [added: 204] Onsite locations in [added: 2019,] 2018, [added: and] 2017, [added: respectively,] and [removed: 2016,] [added: signed 362, 336, and 270 new Onsite locations in 2019, 2018, and 2017,] respectively.
We had [removed: 894] [added: 1,114] Onsite locations as of December 31, [removed: 2018,] [added: 2019,] and anticipate signing 375 to 400 new Onsite locations in [removed: 2019.][added: 2020.]
Through much of our history, this was achieved by opening branches, and more recently through new Onsite locations.
We utilize additional types of selling locations within our network, but these tend to be more specialized in nature and relatively few in number, comprising less than five percent of our total selling locations.
We stock all branches with inventory drawn
| In-Market Locations - 2017 | 2,561 | | 238 | | 104 | | 13 | | 2,916 | | | 13 | | 23 | | 34 | | 2 | | 72 | | 2,988 | |
| Closed/Converted Branches (5) | (154 | ) | (10 | ) | (1 | ) | — | | (165 | ) | | — | | — | | — | | (2 | ) | (2 | ) | (167 | ) |
| | | | | | | | | | | | | | | | | | | | | | | | |
| Starting Onsites - 2017 | 485 | | 43 | | 51 | | 5 | | 584 | | | 7 | | 9 | | 5 | | — | | 21 | | 605 | |
| Opened Onsites | 273 | | 20 | | 14 | | 2 | | 309 | | | 1 | | 1 | | 7 | | — | | 9 | | 318 | |
| Closed/Converted Onsites (5) | (26 | ) | (3 | ) | 1 | | — | | (28 | ) | | — | | (1 | ) | — | | — | | (1 | ) | (29 | ) |
| Ending Onsites - 2018 | 732 | | 60 | | 66 | | 7 | | 865 | | | 8 | | 9 | | 12 | | — | | 29 | | 894 | |
| | | | | | | | | | | | | | | | | | | | | | | | |
| In-Market Locations - 2018 | 2,656 | | 246 | | 118 | | 15 | | 3,035 | | | 14 | | 23 | | 49 | | — | | 86 | | 3,121 | |
| Starting Branches - 2018 | 1,924 | | 186 | | 52 | | 8 | | 2,170 | | | 6 | | 14 | | 37 | | — | | 57 | | 2,227 | |
| Closed/Converted Branches (5) | (119 | ) | (4 | ) | (1 | ) | — | | (124 | ) | | — | | (1 | ) | — | | — | | (1 | ) | (125 | ) |
| Ending Branches - 2019 | 1,806 | | 183 | | 56 | | 8 | | 2,053 | | | 6 | | 14 | | 41 | | — | | 61 | | 2,114 | |
| | | | | | | | | | | | | | | | | | | | | | | | |
| Starting Onsites - 2018 | 732 | | 60 | | 66 | | 7 | | 865 | | | 8 | | 9 | | 12 | | — | | 29 | | 894 | |
| Opened Onsites | 271 | | 18 | | 13 | | 3 | | 305 | | | 2 | | 1 | | 4 | | — | | 7 | | 312 | |
| Closed/Converted Onsites (5) | (78 | ) | (7 | ) | (7 | ) | — | | (92 | ) | | (1 | ) | 1 | | — | | — | | — | | (92 | ) |
| Ending Onsites - 2019 | 925 | | 71 | | 72 | | 10 | | 1,078 | | | 9 | | 11 | | 16 | | — | | 36 | | 1,114 | |
| | | | | | | | | | | | | | | | | | | | | | | | |
| In-Market Locations - 2019 | 2,731 | | 254 | | 128 | | 18 | | 3,131 | | | 15 | | 25 | | 57 | | — | | 97 | | 3,228 | |
We believe sales to national accounts customers will continue to increase as a percent of our total sales over time.
streamline the supply chain where it has been utilized.
| Device count signed during the period | 2019 | | 5,603 | | | 5,439 | | | 5,671 | | | 5,144 | | | 21,857 | |
| 'Machine equivalent' count signed during the period | 2019 | | 5,213 | | | 5,058 | | | 5,354 | | | 4,938 | | | 20,563 | |
| Device count installed at the end of the period | 2019 | | 83,410 | | | 85,871 | | | 88,327 | | | 89,937 | | | |
| 'Machine equivalent' count installed at the end of the | 2019 | | 69,258 | | | 71,942 | | | 74,686 | | | 76,792 | | | |
In 2019, Fastenal introduced additional technology utilizing Remote Frequency Identification ('RFID') and Infrared ('IR') systems to bring additional value to the supply chain.
RFID automates a standard Kanban program and IR automates the replenishment of individualized work stations.
manage their OEM and MRO products.
The paths to higher operating profit margins are slightly different in a traditional branch versus an Onsite location, as the former will tend to have more fixed costs to leverage while the latter will tend to have a smaller fixed cost burden but have greater leverage of its employee-related expenses.
We have registered, or applied for the registration of, various trademarks and service marks.
Our registered trademarks and service marks are presumed valid in the United States as long as they are in use, their registrations are properly maintained, and they have not been found to have become generic.
Registrations of trademarks and service marks can also generally be renewed indefinitely as long as the trademarks and service marks are in use.
In the last several decades we have added 'private label' brands (often referred to as 'Exclusive Brands', or brands sold exclusively through Fastenal) to our non-fastener offering.
We believe it is also appropriate to think about our private label sales as a percentage of our non-fastener sales for two reasons: (1) branded vs. private label dynamics of fasteners differ from those of non-fasteners; and (2) non-fastener data is more comparable to information reported by our peers, who do not generally have our significant mix of fastener business.
Private label brands represented approximately 19%, 19%, and 20% of our total non-fastener sales in 2019, 2018, and 2017, respectively.
Over the last few years, we have seen increases in sales of private label products as a percentage of total non-fastener sales when looking at specific sales channels such as Onsite locations, branches, and vending.
However, these increases were masked by the relative sales growth we are experiencing with Onsite locations, which typically have a lower percentage of total sales being private label than is the case in branches or sales through vending devices.
Our strategic account sites are considered an extension of the branch from which it operates, and are not included separately in our total branch counts.
offering to the needs of the local customer base.
| Total as of December 31, 2016 | 2,194 | | 198 | | 52 | | 8 | | 2,452 | | | 8 | | 10 | | 7 | | 24 | | 2 | | 2,503 | |
| Closed branches | (118 | ) | (6 | ) | (1 | ) | — | | (125 | ) | | (2 | ) | (2 | ) | — | | (1 | ) | — | | (130 | ) |
| Converted branches(6) | (5 | ) | — | | — | | — | | (5 | ) | | (1 | ) | (1 | ) | — | | (1 | ) | — | | (8 | ) |
| Closed branches | (145 | ) | (10 | ) | — | | — | | (155 | ) | | — | | — | | — | | — | | (2 | ) | (157 | ) |
| Converted branches(6) | (9 | ) | — | | (1 | ) | — | | (10 | ) | | — | | — | | — | | — | | — | | (10 | ) |
(2) China
These include customers with which we have
The following table provides a summary of the new Onsite customer locations signed and the total Onsite locations we operated at the end of each year, as well as the Onsite openings and closings during each year:
| | | | | |
| --- | --- | --- | --- | --- |
| | New Onsite Customer Locations Signed | | Total Active Onsite Locations | |
| Total as of December 31, 2016 | 176 | | 401 | |
| Opened Onsite locations | | | 218 | |
| Closed Onsite locations | | | (14 | ) |
| Total as of December 31, 2017 | 270 | | 605 | |
| Opened Onsite locations | | | 318 | |
| Closed Onsite locations | | | (29 | ) |
| Total as of December 31, 2018 | 336 | | 894 | |
We believe we will continue to perform well with these customers.
| | 2016 | | 4,647 | | | 4,869 | | | 4,783 | | | 3,760 | | | 18,059 | |
| | 2016 | | 3,696 | | | 3,941 | | | 3,520 | | | 2,951 | | | 14,108 | |
| | 2016 | | 56,889 | | | 58,346 | | | 60,400 | | | 62,822 | | | |
| | 2016 | | 43,329 | | | 44,707 | | | 46,399 | | | 48,399 | | | |
Combined with ongoing strategic investments in end market initiatives (such as our Customer Service Project ('CSP') initiatives which expand inventory placement at our branches to enhance same-day capabilities) as well
The Indiana facility also contains our centralized replenishment facility for a portion of our industrial vending business.
This operation is also highly automated.
Construction of a new distribution center in Washington, which will include ASRS technology, began in 2018, and we expect this project to be completed in the fourth quarter of 2019.
Construction of a new distribution center in Mississippi also began in 2018, and we expect this project to be completed in the third quarter of 2019.
Although we do not believe our operations are substantially dependent upon any of our trademarks or service marks, we consider the 'Fastenal' name and our other trademarks and service marks to be valuable to our business.
as from our distribution centers to our branch, Onsite, and customer locations.
Also, in the last several years we added 'private label' brands (often referred to as 'Fastenal brands') to our offering, and these represented approximately 13%, 12%, and 12% of our consolidated net sales in 2018, 2017, and 2016, respectively.
In 2018, we changed our definitions of active customer accounts and 'core accounts' and the figures below are the comparable figures in 2017, which reflects those changes.
In 2017, an active account was defined as having spend in the preceding 90 days of $1 (versus the new $100) while 'core accounts' was defined as the average number of accounts with spend in the preceding 90 days of $250 (versus the new $500).
Applying the same definitions to 2017 as we now apply to 2018, our active customer accounts would have been 263,000 and our 'core accounts' would have been 77,000 during the fourth quarter of 2017.
In addition to providing information externally about the size of our customer base, the concepts of active customer accounts and core accounts are used internally to understand customer size and potential.
As our business generally has gotten larger and national accounts have grown in the mix, our historical definitions of these customers has become less informative.
The changes in definition were intended to realign our customer base into size categories that more closely align with the profile of our company today.
diverse.
An excerpt. Shown here: 40 of 122 rewritten, 40 of 47 added and 40 of 42 removed. The counts are complete. For every sentence, read Item 1. BUSINESS in the FY2019 filing and the FY2018 filing.
Cover and table of contents
64 rewritten, 14 added, 11 removed, 36 unchanged
[removed: UNITED STATES][added: UNITED STATES]
[removed: SECURITIES] [added: SECURITIES] AND EXCHANGE [removed: COMMISSION][added: COMMISSION]
[removed: WASHINGTON,] [added: WASHINGTON,] D.C. [removed: 20549][added: 20549]
[removed: FORM 10-K][added: FORM 10-K]
| [removed: x] [added: ☒] | [removed: Annual] [added: Annual] report pursuant to Section 13 or 15(d) of the Securities Exchange Act of [removed: 1934] [added: 1934] |
[removed: | | For] [added: For] the fiscal year [removed: ended December] [added: ended December] 31, [removed: 2018 |][added: 2019]
| [removed: o] [added: ☐] | [removed: Transition] [added: Transition] report pursuant to Section 13 or 15(d) of the Securities Exchange Act of [removed: 1934] [added: 1934] |
| | [removed: For] [added: For] the transition period [removed: from to] [added: from to] |
[removed: Commission] [added: Commission] file [removed: number 0-16125][added: number 0-16125]
[removed: FASTENAL COMPANY][added: FASTENAL COMPANY]
[removed: (Exact] [added: (Exact] name of registrant as specified in its [removed: charter)][added: charter)]
| [removed: Minnesota] [added: Minnesota] | [removed: 41-0948415] | [added: 41-0948415 |]
| [removed: (State] [added: (State] or other jurisdiction of incorporation or [removed: organization)] [added: organization)] | [removed: (I.R.S.] [added: | (I.R.S.] Employer Identification [removed: No.)] [added: No.)] |
[removed: | 2001] [added: 2001] Theurer [removed: Boulevard Winona, Minnesota | 55987-0978 |][added: Boulevard, Winona, Minnesota 55987-1500]
[removed: | (Address] [added: (Address] of principal executive offices) [removed: |] (Zip [removed: Code) |][added: Code)]
[removed: (507) 454-5374][added: (507) 454-5374]
[removed: (Registrant's] [added: (Registrant's] telephone number, including area [removed: code)][added: code)]
[removed: Securities] [added: Securities] registered pursuant to Section 12(b) of the [removed: Act:][added: Act:]
| Title of [removed: Each Class] [added: each class] | [added: Trading Symbol(s) |] Name of [removed: Each Exchange] [added: each exchange] on [removed: Which Registered] [added: which registered] |
| Common [removed: Stock,] [added: stock,] par value $.01 per share | [added: FAST |] The Nasdaq Stock Market [added: LLC] |
[removed: Securities] [added: Securities] registered pursuant to Section 12(g) of the [removed: Act:][added: Act:]
See [removed: definition] [added: the definitions] of "large accelerated filer", "accelerated filer", "smaller reporting company", and "emerging growth company" in Rule 12b-2 of the Exchange Act.
| Large Accelerated Filer | [added: |] x | [added: |] Accelerated Filer | [removed: o] | [added: ☐ |]
| Non-accelerated Filer | [removed: o] | [added: ☐ | |] Smaller Reporting Company | [removed: o] | [added: ☐ |]
| | | [added: | |] Emerging Growth Company | [removed: o] | [added: ☐ |]
Yes [removed: o] [added: ☐] No x
The aggregate market value of the Common Stock held by non-affiliates of the registrant as of June [removed: 30, 2018,] [added: 28, 2019,] the last business day of the registrant's most recently completed second fiscal quarter, was [removed: $13,762,835,828,] [added: $18,623,405,521,] based on the closing [removed: sale] price of the [added: registrant's] Common Stock on that date.
For purposes of determining this number, all executive officers and directors of the registrant as of June [removed: 30, 2018] [added: 28, 2019] are considered to be affiliates of the registrant.
As of January [removed: 18, 2019,] [added: 22, 2020,] the registrant had [removed: 285,931,529] [added: 574,226,297] shares of Common Stock issued and outstanding.
[removed: ANNUAL] [added: ANNUAL] REPORT ON FORM [removed: 10-K][added: 10-K]
[removed: TABLE] [added: TABLE] OF [removed: CONTENTS][added: CONTENTS]
| | | | [removed: Page] [added: Page] |
[removed: | | | [PART I](#sF84F0C863B1B502191FB02D1307A66E9) | |][added: PART I]
| Item 1. | | [removed: [Business](#s2669C0BFB01456518CE7633D8CE70BAA)] [added: [Business](#s9BF7D381B1C657F9B19D62AEE62D85CD)] | [removed: [3](#s2669C0BFB01456518CE7633D8CE70BAA)] [added: [3](#s9BF7D381B1C657F9B19D62AEE62D85CD)] |
| Item 1A. | | [Risk [removed: Factors](#s0DFEFB2C1C42516A8C64F89B50D9E1AC)] [added: Factors](#s400248D7101156ACB0BA3E036DA44854)] | [removed: [12](#s0DFEFB2C1C42516A8C64F89B50D9E1AC)] [added: [12](#s400248D7101156ACB0BA3E036DA44854)] |
| Item 1B. | | [Unresolved Staff [removed: Comments](#s40BE532A4C145378BB94788DD28F3D10)] [added: Comments](#sD5430118A3295F729D56FE30AC701A6C)] | [removed: [17](#s40BE532A4C145378BB94788DD28F3D10)] [added: [17](#sD5430118A3295F729D56FE30AC701A6C)] |
| Item 2. | | [removed: [Properties](#s171344A15F77532DA0BD1A90035C214B)] [added: [Properties](#s29D8E6ABDE2056CCB589C974890FD1A2)] | [removed: [18](#s171344A15F77532DA0BD1A90035C214B)] [added: [18](#s29D8E6ABDE2056CCB589C974890FD1A2)] |
| Item 3. | | [Legal [removed: Proceedings](#s628EB9E89C6C5CCE8FB5E0CE7AF5B9B1)] [added: Proceedings](#s4CB514CFAE185C53AF5EDE86D730D994)] | [removed: [19](#s628EB9E89C6C5CCE8FB5E0CE7AF5B9B1)] [added: [19](#s4CB514CFAE185C53AF5EDE86D730D994)] |
| Item 4. | | [Mine Safety [removed: Disclosures](#s8AD0A7312D8F5A74A6A5341C9B9AFA0F)] [added: Disclosures](#s861273FAA4805B0988D03982A99F71B6)] | [removed: [19](#s8AD0A7312D8F5A74A6A5341C9B9AFA0F)] [added: [19](#s861273FAA4805B0988D03982A99F71B6)] |
| Item 5. | | [Market for Registrant's Common Equity, Related Stockholder Matters, and Issuer Purchases of Equity [removed: Securities](#s70CBBE0ACB075FF78B5FEB1514215552)] [added: Securities](#sCF5B52A151A959FA85B400F6A19A3242)] | [removed: [20](#s70CBBE0ACB075FF78B5FEB1514215552)] [added: [20](#sCF5B52A151A959FA85B400F6A19A3242)] |
or
FASTENAL COMPANY
| | | |
| --- | --- | --- |
| | | |
| | | |
| --- | --- | --- |
| | | |
| | | | | | | |
| --- | --- | --- | --- | --- | --- | --- |
| | | | | | | |
| | | [PART II](#s9D1A9169D8A65F839FDE390DF2440B2A) | |
| | | [PART IV](#s8C6F16A7D49154ACB790427D4F322E73) | |
| | | [Signatures](#s3ECEAD8359295BB3978309E84C4BCB1A) | [64](#s3ECEAD8359295BB3978309E84C4BCB1A) |
10-K 1 fast1231201810-k.htm 10-K
____________________________________________________________
| | |
| --- | --- |
or
Indicate by check mark if disclosure of delinquent filers pursuant to Item 405 of Regulation S-K is not contained herein, and will not be contained, to the best of the registrant's knowledge, in definitive proxy or information statements incorporated by reference in Part III of this Form 10-K or any amendment to this Form 10-K. x
| | | | |
| --- | --- | --- | --- |
| | | [PART II](#s391E78E2C0DE5ED3AE194B8C2543E64B) | |
| | | [PART IV](#s6668F7DF923953A1B321B3857B0A9000) | |
| | | [Signatures](#sE744A69B28F6585E98E341DA36B54F0A) | [63](#sE744A69B28F6585E98E341DA36B54F0A) |
An excerpt. Shown here: 40 of 64 rewritten, all 14 added and all 11 removed. The counts are complete. For every sentence, read Cover and table of contents in the FY2019 filing and the FY2018 filing.
Item 2. PROPERTIES
15 rewritten, 3 added, 4 removed, 49 unchanged
Note – Information in this section is as of December 31, [removed: 2018,] [added: 2019,] unless otherwise noted.
| Customer [removed: support center] [added: Experience Center] | | | | | 100,000 | |
| Distribution center | Indianapolis, Indiana | [removed: 561,000] [added: 547,000] | | (2) | 1,039,000 | |
| Distribution center [removed: (4)] [added: (built in 2019)] | Seattle, Washington | [removed: —] [added: 140,000] | | | [removed: —] [added: 246,000] | |
| Distribution center [removed: (5)] [added: (4)] | High Point, North Carolina | — | | | 350,000 | |
| Distribution center | Kansas City, Kansas | 170,000 | | | [removed: 300,000] [added: 468,000] | |
| Distribution center [added: (5)] | Kitchener, Ontario, Canada | 128,000 | | | 142,000 | |
| Distribution center [removed: (6)] [added: (built in 2019)] | Jackson, Mississippi | — | | | [removed: —] [added: 269,000] | |
(2) This property contains an ASRS with capacity of 52,000 pallet locations, in addition to the [removed: 561,000] [added: 547,000] tote locations for small [removed: parts; 105,000 of these small part tote locations are located in the industrial vending automated replenishment facility, which is also located on this property.][added: parts.]
[removed: (5)] [added: (4)] In late December 2018, we purchased an additional distribution center in High Point, North Carolina with approximately 750,000 total square feet.
In addition, we own [removed: 172] [added: 173] buildings that house our in-market locations in various cities throughout North America.
| Distribution center | Salt Lake City, Utah | | 74,000 | | | July [removed: 2019] [added: 2022] | | One |
| Distribution center and packaging facility | Salt Lake City, Utah | | 26,000 | | | July [removed: 2019] [added: 2022] | | One |
| Manufacturing facility [added: (built in 2019)] | Houston, Texas | | [removed: 21,000] | | [removed: | July 2019 |] [added: 120,000] | [removed: None] |
| Local re-distribution center and manufacturing facility | Modrice, Czech Republic | | [removed: 15,000] [added: 17,000] | | | April 2022 | | None |
(5) In late 2019, we began an expansion project at our Kitchener, Ontario, Canada distribution center.
This project will add approximately 80,000 square feet of distribution capacity and is scheduled for completion in 2020.
| Distribution center | Salt Lake City, Utah | | 56,000 | | | July 2022 | | One |
(4) Construction of a new distribution center in Washington, which will include ASRS technology, began in 2018 and we expect this to be completed in the fourth quarter of 2019.
(6) Construction of a new distribution center in Mississippi began in 2018, and we expect this project to be complete in the third quarter of 2019.
| Distribution center | Seattle, Washington (1) | | 100,000 | | | April 2022 | | None |
(1) We currently own land in the Seattle, Washington area for the construction of a new distribution center, which began in 2018, and when completed, will replace the current leased facility.
Item 4. MINE SAFETY DISCLOSURES
1 rewritten, 0 added, 0 removed, 3 unchanged
[removed: PART II][added: PART II]
Item 5. MARKET FOR REGISTRANT'S COMMON EQUITY, RELATED STOCKHOLDER MATTERS, AND ISSUER PURCHASES OF EQUITY SECURITIES
13 rewritten, 8 added, 7 removed, 14 unchanged
[removed: Common] [added: Common] Stock [removed: Data][added: Data]
As of January [removed: 18, 2019,] [added: 22, 2020,] there were approximately [removed: 1,100] [added: 1,000] record holders of our common stock, which includes nominees or broker dealers holding stock on behalf of an estimated [removed: 283,000] [added: 275,000] beneficial owners.
[removed: Issuer] [added: Issuer] Purchases of Equity [removed: Securities][added: Securities]
The table below sets forth information regarding purchases of our common stock during each of the last three months of [removed: 2018:][added: 2019:]
(1) On July 11, 2017, our board of directors established a new authorization for us to repurchase up to [removed: 5,000,000] [added: 10,000,000] shares of our common stock.
As of December 31, [removed: 2018,] [added: 2019,] we had remaining authority to repurchase [removed: 2,400,000] [added: 4,800,000] shares under this authorization.
Purchases of shares of our common stock throughout [removed: 2018] [added: 2019] are described later in this Form 10-K under the heading 'Item 7.
[removed: Fastenal] [added: Fastenal] Company Common Stock Comparative Performance [removed: Graph][added: Graph]
Set forth below is a graph comparing, for the five years ended December 31, [removed: 2018,] [added: 2019,] the yearly cumulative total shareholder return on our common stock with the yearly cumulative total shareholder return of the S&P 500 Index and the Dow Jones US Industrial Suppliers Index.
The comparison of total shareholder returns in the performance graph assumes that $100 was invested on December 31, [removed: 2013] [added: 2014] in Fastenal Company, the S&P 500 Index, and the Dow Jones US Industrial Suppliers Index, and that dividends were reinvested when and as paid.
[removed: Comparison] [added: Comparison] of Five-Year Cumulative Total Return Among Fastenal Company, the S&P 500 Index, and the Dow Jones US Industrial Suppliers [removed: Index][added: Index]
[removed: 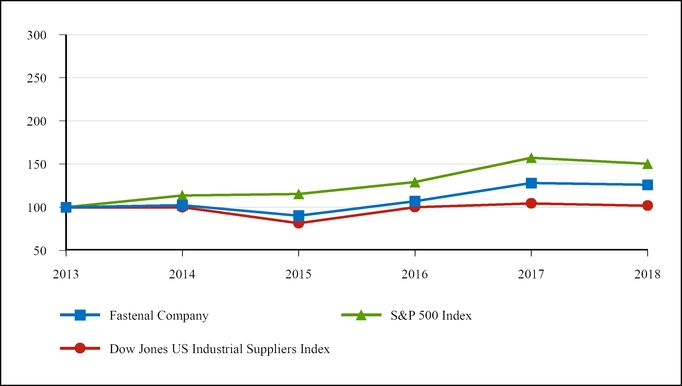][added: 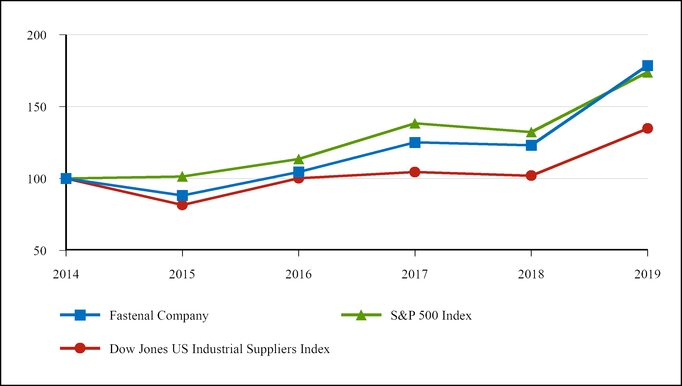]
| | | [removed: 2013 | |] 2014 | | 2015 | | 2016 | | 2017 | | 2018 | [added: | 2019 |]
| October 1-31, 2019 | 0 | | — | | | | 0 | | 4,800,000 |
| November 1-30, 2019 | 0 | | — | | | | 0 | | 4,800,000 |
| December 1-31, 2019 | 0 | | — | | | | 0 | | 4,800,000 |
| Total | 0 | | — | | | | 0 | | 4,800,000 |
The repurchase program has no expiration date.
| Fastenal Company | $ | 100.00 | | 88.19 | | 104.51 | | 125.07 | | 123.11 | | 178.55 |
| S&P 500 Index | | 100.00 | | 101.38 | | 113.51 | | 138.29 | | 132.23 | | 173.86 |
| Dow Jones US Industrial Suppliers Index | | 100.00 | | 81.52 | | 100.14 | | 104.41 | | 101.89 | | 134.72 |
| October 1-31, 2018 | 1,200,000 | | $52.16 | | | | 0 | | 2,400,000 |
| November 1-30, 2018 | 0 | | — | | | | 0 | | 2,400,000 |
| December 1-31, 2018 | 0 | | — | | | | 0 | | 2,400,000 |
| Total | 1,200,000 | | $52.16 | | | | 0 | | 2,400,000 |
| Fastenal Company | $ | 100.00 | | 102.36 | | 90.26 | | 106.97 | | 128.01 | | 126.01 |
| S&P 500 Index | | 100.00 | | 113.69 | | 115.26 | | 129.05 | | 157.22 | | 150.33 |
| Dow Jones US Industrial Suppliers Index | | 100.00 | | 99.94 | | 81.47 | | 100.08 | | 104.35 | | 101.83 |
Item 6. SELECTED FINANCIAL DATA
1 rewritten, 0 added, 0 removed, 3 unchanged
Incorporated herein by reference is Ten-Year Selected Financial Data on pages 4 and 5 of Fastenal's [removed: 2018] [added: 2019] Annual Report to Shareholders of which this Form 10-K forms a part, a portion of which is filed as Exhibit 13 to this annual report on
Item 8. FINANCIAL STATEMENTS AND SUPPLEMENTARY DATA
276 rewritten, 201 added, 110 removed, 308 unchanged
[removed: REPORT] [added: REPORT] OF INDEPENDENT REGISTERED PUBLIC ACCOUNTING [removed: FIRM][added: FIRM]
To the [removed: shareholders] [added: Stockholders] and [removed: board] [added: Board] of [removed: directors] [added: Directors] of
[removed: Opinions] [added: *Opinions] on [removed: the] [added: the*] Consolidated [removed: Financial] [added: *Financial] Statements and Internal Control Over Financial [removed: Reporting][added: Reporting*]
We have audited the accompanying consolidated balance sheets of Fastenal Company and subsidiaries (the [removed: 'Company')] [added: Company)] as of December 31, [removed: 2018] [added: 2019] and [removed: 2017,] [added: 2018,] the related consolidated statements of earnings, comprehensive income, stockholders’ equity, and cash flows for each of the years in the three-year period ended December 31, [removed: 2018,] [added: 2019] and the related notes and financial statement schedule listed in the table of contents at Item 15 (collectively, the [removed: 'consolidated] [added: consolidated] financial [removed: statements').][added: statements).]
We also have audited the [removed: Company's] [added: Company’s] internal control over financial reporting as of December 31, [removed: 2018,] [added: 2019,] based on criteria established in [removed: Internal] [added: *Internal] Control - Integrated [removed: Framework (2013)] [added: Framework* *(2013)*] issued by the Committee of Sponsoring Organizations of the Treadway Commission.
In our opinion, the consolidated financial statements referred to above present fairly, in all material respects, the financial position of the Company as of December 31, [removed: 2018] [added: 2019] and [removed: 2017,] [added: 2018,] and the results of its operations and its cash flows for each of the years in the three-year period ended December 31, [removed: 2018,] [added: 2019,] in conformity with U.S. generally accepted accounting principles.
Also in our opinion, the Company maintained, in all material respects, effective internal control over financial reporting as of December 31, [removed: 2018,] [added: 2019] based on criteria established in Internal Control - Integrated Framework (2013) issued by the Committee of Sponsoring Organizations of the Treadway Commission.
[removed: Basis] [added: *Basis] for [removed: Opinions][added: Opinions*]
The [removed: Company's] [added: Company’s] management is responsible for these consolidated financial statements, for maintaining effective internal control over financial reporting, and for its assessment of the effectiveness of internal control over financial reporting, included in the accompanying [removed: Management's] [added: Management’s Annual] Report on Internal Control Over Financial Reporting.
We are a public accounting firm registered with the Public Company Accounting Oversight Board (United States) [removed: ('PCAOB')] [added: (PCAOB)] and are required to be independent with respect to the Company in accordance with the U.S. federal securities laws and the applicable rules and regulations of the Securities and Exchange Commission and the PCAOB.
[removed: Definition] [added: *Definition] and Limitations of Internal Control Over Financial [removed: Reporting][added: Reporting*]
[removed: A company's internal control over financial reporting includes those policies and procedures that (1) pertain to the maintenance of records that, in reasonable detail, accurately and fairly reflect the transactions and dispositions of the assets of the company; (2) provide reasonable assurance that transactions are recorded as necessary to permit] preparation of financial statements in accordance with generally accepted accounting principles, and that receipts and expenditures of the company are being made only in accordance with authorizations of management and directors of the company; and (3) provide reasonable assurance regarding prevention or timely detection of unauthorized acquisition, use, or disposition of the company’s assets that could have a material effect on the financial statements.
[removed: FASTENAL] [added: FASTENAL] COMPANY AND [removed: SUBSIDIARIES][added: SUBSIDIARIES]
| | [removed: 2018] [added: 2019] | | | | [added: 2018 | | |] 2017 | |
| Cash and cash equivalents | [removed: $] [added: $] | [removed: 167.2] [added: 174.9] | | | [removed: 116.9] [added: 167.2] | |
| Trade accounts receivable, net of allowance for doubtful accounts of [removed: $12.8] [added: $10.9] and [removed: $11.9,] [added: $12.8,] respectively | [removed: 714.3] [added: 741.8] | | | | [removed: 607.8] [added: 714.3] | |
| Inventories | [removed: 1,278.7] [added: 1,366.4] | | | | [removed: 1,092.9] [added: 1,278.7] | |
| Prepaid income taxes | [removed: 9.0] [added: 16.7] | | | | [removed: —] [added: 9.0] | |
| Other current assets | [removed: 147.0] [added: 157.4] | | | | [removed: 118.1] [added: 147.0] | |
| Total current assets | [removed: 2,316.2] [added: 2,457.2] | | | | [removed: 1,935.7] [added: 2,316.2] | |
| Property and equipment, net | [removed: 924.8] [added: 1,023.2] | | | | [removed: 893.6] [added: 924.8] | |
| Other assets | [removed: 80.5] [added: 76.3] | | | | [removed: 81.2] [added: 80.5] | |
| Total assets | [removed: $] [added: $] | [removed: 3,321.5] [added: 3,799.9] | | | [removed: 2,910.5] [added: 3,321.5] | |
| Current portion of debt | [removed: $] [added: $] | [removed: 3.0] [added: 3.0] | | | 3.0 | |
| Accounts payable | [removed: 193.6] [added: 192.8] | | | | [removed: 147.5] [added: 193.6] | |
| Accrued expenses | [removed: 240.8] [added: 251.5] | | | | [removed: 194.0] [added: 240.8] | |
[removed: | Income taxes payable | — | | | | 6.5 | |][added: Income Taxes]
| Total current liabilities | [removed: 437.4] [added: 544.7] | | | | [removed: 351.0] [added: 437.4] | |
| Long-term debt | [removed: 497.0] [added: 342.0] | | | | [removed: 412.0] [added: 497.0] | |
| Deferred income taxes | [removed: 84.4] [added: 99.4] | | | | [removed: 50.6] [added: 84.4] | |
| Preferred stock: $0.01 par value, 5,000,000 shares authorized, no shares issued or outstanding | [removed: —] [added: —] | | | | — | |
| Common stock: $0.01 par value, [removed: 400,000,000] [added: 800,000,000] shares authorized, [removed: 285,901,919] [added: 574,128,911] and [removed: 287,591,536] [added: 571,803,838] shares issued and outstanding, respectively | [removed: 2.9] [added: 2.9] | | | | 2.9 | |
| Additional paid-in capital | [removed: 3.0] [added: 67.2] | | | | [removed: 8.5] [added: 3.0] | |
| Retained earnings | [removed: 2,341.6] [added: 2,633.9] | | | | [removed: 2,110.6] [added: 2,341.6] | |
| Accumulated other comprehensive loss | [removed: (44.8] [added: (38.4] | | [removed: )] [added: )] | | [removed: (25.1] [added: (44.8] | ) |
| Total [removed: stockholders’] [added: stockholders'] equity | [removed: 2,302.7] [added: $] | [added: 2,665.6] | | | [added: 2,302.7 | | |] 2,096.9 | |
| Total liabilities and stockholders’ equity | [removed: $] [added: $] | [removed: 3,321.5] [added: 3,799.9] | | | [removed: 2,910.5] [added: 3,321.5] | |
| | [removed: 2018] [added: 2019] | | | | [removed: 2017] [added: 2018] | | | [removed: 2016] [added: 2017] | |
| Net sales | [removed: $] [added: $] | [removed: 4,965.1] [added: 5,333.7] | | | [removed: 4,390.5] [added: 4,965.1] | | | [removed: 3,962.0] [added: 4,390.5] | |
| Cost of sales | [removed: 2,566.2] [added: 2,818.3] | | | | [removed: 2,226.9] [added: 2,566.2] | | | [removed: 1,997.2] [added: 2,226.9] | |
*Change in Accounting Principle*
As discussed in Note 1 to the consolidated financial statements, the Company has changed its method of accounting for operating leases as of January 1, 2019 due to the adoption of ASU 2016-02, *Leases* (Topic 842).
A company’s internal control over financial reporting includes those policies and procedures that (1) pertain to the maintenance of records that, in reasonable detail, accurately and fairly reflect the transactions and dispositions of the assets of the company; (2) provide reasonable assurance that transactions are recorded as necessary to permit
*Critical Audit Matter*
The critical audit matter communicated below is a matter arising from the current period audit of the consolidated financial statements that was communicated or required to be communicated to the audit committee and that: (1) relates to an account or disclosure that is material to the consolidated financial statements and (2) involved our especially challenging, subjective, or complex judgment.
The communication of a critical audit matter does not alter in any way our opinion on the consolidated financial statements, taken as a whole, and we are not, by communicating the critical audit matter below, providing a separate opinion on the critical audit matter or on the account or disclosure to which it relates.
*Evaluation of the sufficiency of audit evidence over inventory*
As disclosed in the consolidated balance sheets, the Company holds $1,366.4 million of inventory, the majority of which was held at 3,228 in-market locations, as of December 31, 2019.
The Company’s processes to track and determine consolidated inventory relies on a perpetual inventory system which involves the interaction of multiple information technology (IT) systems.
We identified the evaluation of the sufficiency of audit evidence obtained related to the quantities of inventory as a critical audit matter.
Evaluating the sufficiency of audit evidence over quantities of inventory required challenging auditor judgment to assess the number of in-market locations visited, and included the involvement of IT professionals with specialized skills and knowledge due to the interaction of multiple IT systems to track physical inventory quantities by locations.
The primary procedures we performed to address this critical audit matter included the following.
We tested certain internal controls over the Company’s perpetual inventory process.
The inventory controls included the testing of IT application controls, as well as controls related to access to program and data, program change, program development, and computer operations.
It also included controls over the physical inventory cycle counts.
We involved IT professionals with specialized skills and knowledge, who assisted in testing IT controls inclusive of the interface of multiple IT systems which support the Company’s perpetual inventory system.
We evaluated the following information regarding the Company’s inventory quantities:
| • | Historical inventory locations visited; |
| | |
| --- | --- |
| • | Inventory dollars by location; and |
| | |
| --- | --- |
| • | Inventory cycle count results of the Company, including the results of monitoring and compliance with cycle count program by in-market location. |
On a sample basis, we tested the inventory by counting inventory quantities through location visits during the year to evaluate the Company’s perpetual inventory records.
In addition, we evaluated the overall sufficiency of audit evidence obtained over the quantities of inventory.
February 6, 2020
| | 2019 | | | | 2018 | |
| Operating lease right-of-use assets | 243.2 | | | | — | |
| Current portion of operating lease liabilities | 97.4 | | | | — | |
| Operating lease liabilities | 148.2 | | | | — | |
| Total stockholders’ equity | 2,665.6 | | | | 2,302.7 | |
FASTENAL COMPANY AND SUBSIDIARIES
FASTENAL COMPANY AND SUBSIDIARIES
FASTENAL COMPANY AND SUBSIDIARIES
| Balance at beginning of year | $ | 2.9 | | | 2.9 | | | 2.9 | |
| Balance at end of year | 2.9 | | | | 2.9 | | | 2.9 | |
| Additional paid-in capital | | | | | | | | | |
| Balance at beginning of year | 3.0 | | | | 8.5 | | | 37.4 | |
| Balance at end of year | 67.2 | | | | 3.0 | | | 8.5 | |
February 6, 2019
| | | | | | | | | | | | | | | | | | | |
| --- | --- | --- | --- | --- | --- | --- | --- | --- | --- | --- | --- | --- | --- | --- | --- | --- | --- | --- |
| | Shares | | | Amount | | | | Additional Paid-in Capital | | | Retained Earnings | | | Accumulated Other Comprehensive Income (Loss) | | | Total Stockholders' Equity | |
| Balance as of December 31, 2015 | 289.6 | | | $ | 2.9 | | | 2.0 | | | 1,842.9 | | | (46.4 | ) | | 1,801.4 | |
| Purchases of common stock | (1.6 | ) | | — | | | | (3.9 | ) | | (55.6 | ) | | — | | | (59.5 | ) |
| Excess tax benefits from stock-based compensation | — | | | — | | | | 5.9 | | | — | | | — | | | 5.9 | |
| Net earnings | — | | | — | | | | — | | | 499.4 | | | — | | | 499.4 | |
| Balance as of December 31, 2016 | 289.2 | | | $ | 2.9 | | | 37.4 | | | 1,940.1 | | | (47.3 | ) | | 1,933.1 | |
| Dividends paid in cash | — | | | — | | | | — | | | (369.1 | ) | | — | | | (369.1 | ) |
| Balance as of December 31, 2017 | 287.6 | | | $ | 2.9 | | | 8.5 | | | 2,110.6 | | | (25.1 | ) | | 2,096.9 | |
| Dividends paid in cash | — | | | — | | | | — | | | (441.9 | ) | | — | | | (441.9 | ) |
| Stock options exercised | 0.3 | | | — | | | | 13.4 | | | — | | | — | | | 13.4 | |
| Other comprehensive income (loss) | — | | | — | | | | — | | | — | | | (19.7 | ) | | (19.7 | ) |
| Balance as of December 31, 2018 | 285.9 | | | $ | 2.9 | | | 3.0 | | | 2,341.6 | | | (44.8 | ) | | 2,302.7 | |
| Stock-based compensation | 5.1 | | | | 5.2 | | | 4.1 | |
We lease space under operating leases for certain distribution centers, branches, and manufacturing locations.
These leases do not have significant rent escalation holidays, concessions, leasehold improvement incentives, or other build-out clauses.
Any such terms are recognized as rent expense over the term of the lease.
Further, the leases do not contain contingent rent provisions.
Leasehold improvements on operating leases are amortized over their estimated service lives on a straight-line basis, or the remaining lease term, whichever is shorter.
Effective January 1, 2018, we adopted the Financial Accounting Standards Board ('FASB') Accounting Standards Update
('ASU') 2014-09, Revenue from Contracts with Customers (Topic 606), and ASU 2015-14, Revenue from Contracts with
Customers (Topic 606): Deferral of Effective Date, which deferred the effective date of ASU 2014-09 by one year.
ASU
2014-09 supersedes the revenue recognition requirements in ASC 605, Revenue Recognition, and is based on the principle that
revenue is recognized to depict the transfer of goods or services to customers in an amount that reflects the consideration to
which the entity expects to be entitled in exchange for those goods or services.
It also requires additional disclosure about the
nature, amount, timing, and uncertainty of revenue, cash flows arising from customer contracts, including significant judgments
and changes in judgments, and assets recognized from costs incurred to obtain or fulfill a contract.
The adoption of ASU
2014-09, using the modified retrospective approach, had no significant impact on our results of operations, cash flows, or
financial position.
Revenue continues to be recognized at a point in time for our product sales when products are delivered to or
picked up by the customer and revenue for shipping and handling charges continues to be recognized when products are
delivered to or picked up by the customer.
We continue to reduce revenue for estimates of sales incentives based on probability
estimates and for product returns based on historical return rates.
Additional information and disclosures required by this new
An excerpt. Shown here: 40 of 276 rewritten, 40 of 201 added and 40 of 110 removed. The counts are complete. For every sentence, read Item 8. FINANCIAL STATEMENTS AND SUPPLEMENTARY DATA in the FY2019 filing and the FY2018 filing.
Item 9A. CONTROLS AND PROCEDURES
5 rewritten, 1 added, 1 removed, 28 unchanged
[removed: Disclosure] [added: Disclosure] Controls and [removed: Procedures][added: Procedures]
[removed: Attestation] [added: Attestation] Report of Independent Registered Public Accounting [removed: Firm][added: Firm]
[removed: Management's] [added: Management's] Annual Report on Internal Control Over Financial [removed: Reporting][added: Reporting]
Under the supervision of our principal executive officer and our principal financial officer, we conducted an evaluation of the effectiveness of our internal control over financial reporting based on the framework in [removed: Internal] [added: *Internal] Control – Integrated Framework [removed: (2013)] [added: (2013)*] issued by the Committee of Sponsoring Organizations of the Treadway Commission.
Based on our assessment and those criteria, management believes that the company maintained effective internal control over financial reporting as of December 31, [removed: 2018.][added: 2019.]
| February 6, 2020 | | |
| February 6, 2019 | | |
Item 9B. OTHER INFORMATION
1 rewritten, 0 added, 0 removed, 3 unchanged
[removed: PART III][added: PART III]
Item 10. DIRECTORS, EXECUTIVE OFFICERS, AND CORPORATE GOVERNANCE
22 rewritten, 4 added, 7 removed, 56 unchanged
Incorporated herein by reference is the information appearing under the headings 'Proposal #1—Election of Directors', 'Corporate Governance and Director Compensation—Board Leadership Structure and Committee Membership', 'Corporate Governance and Director Compensation—Audit Committee', and 'Corporate Governance and Director [removed: Compensation—Section] [added: Compensation—Delinquent Section] 16(a) [removed: Beneficial Ownership Reporting Compliance'] [added: Reports'] in the Proxy Statement.
| Daniel L. Florness | 1996 | | [removed: 55] [added: 56] | | President, Chief Executive Officer, and Director |
| William J. Drazkowski | 1995 | | [removed: 47] [added: 48] | | Executive Vice President – [removed: National Accounts] Sales |
| Leland J. Hein | 1985 | | [removed: 58] [added: 59] | | Senior Executive Vice President – Sales |
| James C. Jansen | 1992 | | [removed: 48] [added: 49] | | Executive Vice President – Manufacturing |
| Holden Lewis | 2016 | | [removed: 49] [added: 50] | | Executive Vice President and Chief Financial Officer |
| Sheryl A. Lisowski | 1994 | | [removed: 51] [added: 52] | | Controller, Chief Accounting Officer, and Treasurer |
| [removed: Nicholas J. Lundquist] [added: Terry M. Owen] | [removed: 1979] [added: 1999] | | [removed: 61] [added: 51] | | Senior Executive Vice President – [added: Sales] Operations |
| Charles S. Miller | 1999 | | [removed: 44] [added: 45] | | [added: Senior] Executive Vice President – Sales |
| John L. Soderberg | 1993 | | [removed: 47] [added: 48] | | Executive Vice President – Information Technology |
| Jeffery M. Watts | 1996 | | [removed: 47] [added: 48] | | Executive Vice President – International Sales |
| Reyne K. Wisecup | 1988 | | [removed: 55] [added: 56] | | Senior Executive Vice President – Human Resources and Director |
Mr. Drazkowski has been our executive vice president [removed: – national accounts] [added: -] sales since [removed: December 2016.][added: October 2019.]
From [removed: October 2014 to] December [removed: 2016,] [added: 2016 to September 2019,] Mr. Drazkowski was [removed: our] [added: executive] vice president – national accounts sales.
From [added: October 2014 to December 2016, Mr. Drazkowski was our vice president – national accounts sales, from] September 2013 to September 2014, he served as regional vice president of our Minnesota based region, and from November 2007 to August 2013, he served as one of our district managers.
Mr. [removed: Hein's] [added: Drazkowski's] responsibilities include sales and operational oversight of our Western United States [removed: business, which spans from Ohio to the West Coast.][added: business.]
Mr. Hein was our president and chief executive officer from January 2015 to July 2015, and our [removed: president from July 2012 to December 2014.]
From November 2007 to July 2012, Mr. Hein was one [added: of our executive vice presidents – sales.]
Mr. Jansen's responsibilities include oversight of our industrial services, quality assurance, aerospace, [removed: and] manufacturing [removed: operations.][added: operations, and EHS management.]
Mr. [removed: Lundquist] [added: Miller] has been our senior executive vice president – [removed: operations] [added: sales] since [removed: December 2016.][added: January 2020.]
Mr. Miller's responsibilities include sales and operational oversight of our [removed: business which spans the East Coast of, and Southern and Southwestern areas of, the] [added: Eastern] United [removed: States.][added: States business.]
Mr. Owen's responsibilities include oversight of our [removed: information technology,] e-commerce, marketing, [removed: international sales,] national [removed: accounts,] [added: accounts sales,] government sales, FAST Solutions®, [added: Onsite and vending,] our Mansco division, [added: manufacturing, distribution, transportation, product development, supplier development, procurement,] and [removed: manufacturing operations.][added: supply chain.]
Information about our Executive Officers
As of the date of filing this Form 10-K, the following individuals were executive officers of the Company:
president from July 2012 to December 2014.
From November 2015 to December 2019, Mr. Miller was one of our executive vice presidents – sales.
The executive officers of Fastenal Company are:
| Terry M. Owen | 1999 | | 50 | | Senior Executive Vice President – Sales Operations |
of our executive vice presidents – sales.
Mr. Lundquist's responsibilities include distribution development, product development, supplier development, and supply chain.
From July 2012 to December 2016, Mr. Lundquist was our executive vice president – operations.
From November 2007 to July 2012, he was one of our executive vice presidents – sales, and from December 2002 to November 2007, he was our executive vice president and chief operating officer.
Mr. Miller has been our executive vice president – sales since November 2015.
Item 12. SECURITY OWNERSHIP OF CERTAIN BENEFICIAL OWNERS AND MANAGEMENT AND RELATED STOCKHOLDER MATTERS
1 rewritten, 2 added, 2 removed, 12 unchanged
[removed: Equity] [added: Equity] Compensation Plan [removed: Information][added: Information]
| Equity compensation plans approved by security holders (1) | 6,807,217 | | | $ | 24.89 | | | 13,495,100 | |
| Total | 6,807,217 | | | | | | | 13,495,100 | |
| Equity compensation plans approved by security holders (1) | 3,999,632 | | | $ | 49.53 | | | 7,314,063 | |
| Total | 3,999,632 | | | | | | | 7,314,063 | |
Item 14. PRINCIPAL ACCOUNTANT FEES AND SERVICES
1 rewritten, 0 added, 0 removed, 3 unchanged
[removed: PART IV][added: PART IV]
Item 15. EXHIBITS AND FINANCIAL STATEMENT SCHEDULES
12 rewritten, 3 added, 6 removed, 36 unchanged
Consolidated Balance Sheets as of December 31, [removed: 2018] [added: 2019] and [removed: 2017][added: 2018]
Consolidated Statements of Earnings for the years ended December 31, [added: 2019,] 2018, [removed: 2017,] and [removed: 2016][added: 2017]
Consolidated Statements of Comprehensive Income for the years ended December 31, [added: 2019,] 2018, [removed: 2017,] and [removed: 2016][added: 2017]
Consolidated Statements of Stockholders' Equity for the years ended December 31, [added: 2019,] 2018, [removed: 2017,] and [removed: 2016][added: 2017]
Consolidated Statements of Cash Flows for the years ended December 31, [added: 2019,] 2018, [removed: 2017,] and [removed: 2016][added: 2017]
| 3.1 | [Restated Articles of Incorporation of Fastenal Company, as amended (incorporated by reference to Exhibit 3.1 to Fastenal Company's Form [removed: 10-Q for the quarter ended March 31, 2012] [added: 8-K dated as of April 23, 2019] (file no. [removed: 000-016125))](http://www.sec.gov/Archives/edgar/data/815556/000119312512172121/d310097dex31.htm)] [added: 000-016125))](https://www.sec.gov/Archives/edgar/data/815556/000081555619000032/ex_314232019amendedarticle.htm)] |
| 10.1 | [Bonus Program for Executive [removed: Officers*](https://www.sec.gov/Archives/edgar/data/815556/000081555619000015/fast1231201810-kexhibit101.htm)] [added: Officers*](https://www.sec.gov/Archives/edgar/data/815556/000081555620000011/fast1231201910-kexhibit101.htm)] |
| 13 | [Portions of [removed: 2018] [added: 2019] Annual Report to Shareholders not included in this Form 10-K (only those sections specifically incorporated by reference in this Form 10-K shall be deemed filed with the [removed: SEC)](https://www.sec.gov/Archives/edgar/data/815556/000081555619000015/a2018finalannualreport.htm)] [added: SEC)](https://www.sec.gov/Archives/edgar/data/815556/000081555620000011/a2019finalannualreportwr.htm)] |
| 21 | [List of [removed: Subsidiaries](https://www.sec.gov/Archives/edgar/data/815556/000081555619000015/fast1231201810-kexhibit21.htm)] [added: Subsidiaries](https://www.sec.gov/Archives/edgar/data/815556/000081555620000011/fast1231201910-kexhibit21.htm)] |
| 23 | [Consent of Independent Registered Public Accounting [removed: Firm](https://www.sec.gov/Archives/edgar/data/815556/000081555619000015/fast1231201810-kexhibit23.htm)] [added: Firm](https://www.sec.gov/Archives/edgar/data/815556/000081555620000011/fast1231201910-kexhibit23.htm)] |
| 31 | [Certifications under Section 302 of the Sarbanes-Oxley Act of [removed: 2002](https://www.sec.gov/Archives/edgar/data/815556/000081555619000015/fast1231201810-kexhibit31.htm)] [added: 2002](https://www.sec.gov/Archives/edgar/data/815556/000081555620000011/fast1231201910-kexhibit31.htm)] |
| 32 | [Certification under Section 906 of the Sarbanes-Oxley Act of [removed: 2002](https://www.sec.gov/Archives/edgar/data/815556/000081555619000015/fast1231201810-kexhibit32.htm)] [added: 2002](https://www.sec.gov/Archives/edgar/data/815556/000081555620000011/fast1231201910-kexhibit32.htm)] |
| 4.4 | [Description of Capital Stock](https://www.sec.gov/Archives/edgar/data/815556/000081555620000011/fast1231201910kexhibit44.htm) |
| 101 | The following financial statements from the Annual Report on Form 10-K for the year ended December 31, 2019, formatted in Inline XBRL: (i) Consolidated Balance Sheets, (ii) Consolidated Statements of Earnings, (iii) Consolidated Statements of Comprehensive Income, (iv) Consolidated Statements of Stockholders’ Equity, (v) Consolidated Statements of Cash Flows, and (vi) Notes to Consolidated Financial Statements. |
| 104 | The cover page from the Annual Report on Form 10-K for the year ended December 31, 2019, formatted in Inline XBRL. |
| 101.INS | XBRL Instance Document |
| 101.SCH | XBRL Taxonomy Extension Schema Document |
| 101.CAL | XBRL Taxonomy Calculation Linkbase Document |
| 101.DEF | XBRL Taxonomy Definition Linkbase Document |
| 101.LAB | XBRL Taxonomy Label Linkbase Document |
| 101.PRE | XBRL Taxonomy Presentation Linkbase Document |
Item 16. FORM 10-K SUMMARY
11 rewritten, 5 added, 4 removed, 46 unchanged
[removed: FASTENAL COMPANY][added: FASTENAL COMPANY]
Years ended December 31, [added: 2019,] 2018, [removed: 2017,] and [removed: 2016][added: 2017]
| [removed: Year] [added: Year] ended December 31, [removed: 2018] [added: 2018] | | | | | | | | | | | | | | | |
| [removed: Year] [added: Year] ended December 31, [removed: 2017] [added: 2017] | | | | | | | | | | | | | | | |
| [removed: Year] [added: Year] ended December 31, [removed: 2016] [added: 2019] | | | | | | | | | | | | | | | |
[removed: SIGNATURES][added: SIGNATURES]
| Date: | | February 6, [removed: 2019] [added: 2020] |
| Michael J. Dolan, Director | | | [removed: Scott A. Satterlee,] [added: Nicholas J. Lundquist,] Director |
| Stephen L. Eastman, Director | | | [removed: Reyne K. Wisecup,] [added: Scott A. Satterlee,] Director |
| /s/ Rita J. Heise | | | [added: /s/ Reyne K. Wisecup] |
| Rita J. Heise, Director | | | [added: Reyne K. Wisecup, Director] |
| Allowance for doubtful accounts | $ | 12.8 | | | 5.5 | | | — | | | 7.4 | | | 10.9 | |
| Insurance reserves | $ | 37.6 | | | 69.7 | | (1) | — | | | 66.2 | | (2) | 41.1 | |
| Date: | | February 6, 2020 |
| /s/ Michael J. Dolan | | | /s/ Nicholas J. Lundquist |
| /s/ Stephen L. Eastman | | | /s/ Scott A. Satterlee |
| Allowance for doubtful accounts | $ | 11.7 | | | 8.5 | | | — | | | 9.0 | | | 11.2 | |
| Insurance reserves | $ | 31.8 | | | 62.3 | | (1) | — | | | 59.5 | | (2) | 34.6 | |
| /s/ Michael J. Dolan | | | /s/ Scott A. Satterlee |
| /s/ Stephen L. Eastman | | | /s/ Reyne K. Wisecup |