 filings.tools
Comfort Systems USA (FIX) 10-K risk factor changes: FY2018 vs FY2017
The 2018-12-31 10-K against the 2017-12-31 one, compared heading by heading and sentence by sentence. One of these filings carries no fiscal year tag, so its year is the calendar year of the period end.
Item 1A18 rewritten29 added5 removed258 unchanged
All filing items659 rewritten441 added268 removed1,582 unchanged
Summary
counted, not written
- Item 1A headings could not be compared: only 0 carried over between the two years, which usually means one filing was read wrongly, so none is reported as new or removed.
- Sentence by sentence, 441 added, 268 removed, 659 rewritten and 1,582 unchanged across 13 items that differ.
Sentences by item
19 items, with every count and a link to each item that changed
Underlined words on a shaded ground are new in FY2018; struck-through words were in FY2017. Sentences that are wholly new or wholly gone are labelled rather than marked.
Item 1A. Risk Factors
18 rewritten, 29 added, 5 removed, 258 unchanged
[removed: Many of] [added: Economic downturns in] the markets [removed: we do work] in [removed: are currently experiencing an economic downturn or might in the future experience an economic downturn that] [added: which we operate] may materially and adversely affect our business because our business is dependent on levels of construction activity.
For instance, unanticipated technical problems may arise, we could have difficulty obtaining permits or approvals, local laws, labor costs or labor conditions could change, bad weather could delay construction, raw materials prices could increase, our suppliers or subcontractors may fail to perform as expected or site conditions may be different [removed: than we expected.]
Failure to meet schedule or performance requirements typically results in additional costs to us, and in some [removed: cases] [added: cases,] we may also create liability for consequential and liquidated damages.
We cannot assure that we will be able to locate acquisitions or that we will be able to consummate transactions on terms and conditions acceptable to us, or that [added: acquired businesses will be profitable.]
Our use of the [removed: percentage‑of‑completion] [added: percentage-of-completion] method of accounting could result in a reduction or reversal of previously recorded revenue or profits.
A material portion of our revenue is recognized using the [removed: percentage‑of‑completion] [added: percentage-of-completion] method of accounting, which results in our recognizing contract revenue and earnings ratably over the contract term in the proportion that our actual costs bear to our estimated contract costs.
As such, we may not be able to maintain commercially reasonable levels of insurance coverage in the future, which could preclude our ability to work on many [removed: projects.][added: projects and increase our overall risk exposure.]
Our [removed: 115] [added: 128] locations are located in [removed: 27] [added: 28] states, which exposes us to a variety of different state and local laws and regulations, particularly those pertaining to contractor licensing requirements.
[added: Changes in any of these laws, or any of our subsidiaries’ material failure to comply with them,] can adversely impact our operations by, among other things, increasing costs, distracting management’s time and attention from other items, and harming our reputation.
[removed: And additional] [added: Additional] laws, regulations and standards apply to contractors who perform work that is being funded by public money, particularly federal public funding.
[removed: Our] [added: Moreover, our] business may be adversely affected by severe weather in areas where we have significant operations.
[removed: If we are not] able to react quickly to force majeure events, our operations may be affected significantly, which would have a negative impact on our financial position, results of operations, cash flows and liquidity.
[added: Future] legislation could also have an impact on our business.
Because of the continued uncertainty about the implementation of the Affordable Care Act, including the potential for further legal challenges or repeal of that legislation, it is unclear what the impact of the Affordable Care [removed: Act] [added: Act, its amendment thereof,] or its potential repeal [added: or replacement] will have on our financial position or results of operations.
Tax matters, including changes in corporate tax [removed: rates] [added: laws] and disagreements with taxing authorities, could impact our results of operations and financial condition.
While certain portions of the [removed: law may] [added: Tax Cuts and Jobs Act seem to] have [added: had] a positive impact on the Company’s results of operations, the overall impact of the [removed: new federal tax law] [added: Tax Cuts and Jobs Act] is uncertain and our business and financial condition could be adversely affected.
It is also unknown if and to what extent various states will conform to the [removed: newly] [added: changes] enacted [removed: federal tax law.][added: by the Tax Cuts and Jobs Act.]
Additionally, certain provisions of the Delaware General Corporation Law [added: or even certain provisions of our credit agreement] may also discourage takeover attempts that have not been approved by the Board of Directors.
Our business is subject to a variety of risks and uncertainties, including, but not limited to, the risks and uncertainties described below.
than we expected.
Future growth could also impose significant additional responsibilities on members of our senior management, including the need to recruit and integrate new senior level managers and executives.
To the extent that we are unable to manage our growth effectively, or are unable to attract and retain additional qualified management, we may not be able to expand our operations or execute our business plan.
Our business may be affected by the work environment.
We may need to perform our work under a variety of conditions, including but not limited to, difficult terrain, difficult site conditions and busy urban centers where delivery of materials and availability of labor may be impacted, clean-room environments where strict procedures must be followed, and sites which may have been exposed to harsh and hazardous conditions.
If we are unable to manage the conditions required for certain of our jobs, including the availability of sufficient labor, adherence to environmental or other standards, and adequately addressing harsh or hazardous conditions, our business and financial condition could be adversely affected.
Additionally, industries in which our customers or potential customers operate may be affected by new or changing environmental, safety, health or other regulatory requirements, leading to decreased demand for our services and potentially impacting our business, financial condition, results of operations, cash flows and our ability to grow.
Our business can be highly cyclical and subject to seasonal and other variations that can result in significant differences in operating results from quarter to quarter.
If we are not
Continuing worldwide political and economic uncertainties may adversely affect our revenue and profitability.
The last several years have been periodically marked by political and economic concerns, including decreased consumer confidence, the lingering effects of international conflicts, tariffs, energy costs and inflation.
This instability can make it extremely difficult for our customers, our vendors and us to accurately forecast and plan future business activities, and could cause constrained spending on our services, delays and a lengthening of our business development efforts, the demand for more favorable pricing or other terms, and/or difficulty in collection of our accounts receivable.
Our government clients may face budget deficits that prohibit them from funding proposed and existing projects.
Further, ongoing economic instability in the global markets could limit our ability to access the capital markets at a time when we would like, or need, to raise capital, which could have an impact on our ability to react to changing business conditions or new opportunities.
If economic conditions remain uncertain or weaken, or government spending is reduced, our revenue and profitability could be adversely affected.
Changes in United States trade policy, including the imposition of tariffs and the resulting consequences, may have a material adverse impact on our business and results of operations.
The United States government has indicated its intent to adopt a new approach to trade policy, including potentially renegotiating or terminating certain existing bilateral or multi-lateral trade agreements.
It has also initiated tariffs on certain foreign goods and has raised the possibility of imposing significant, additional tariff increases or expanding the tariffs to capture other types of goods.
The adoption and expansion of trade restrictions, the occurrence of a trade war, or other governmental action related to tariffs or trade agreements or policies has the potential to adversely impact demand for our products, our costs, our customers, our suppliers, and the United States economy, which in turn could have an adverse effect on our business, financial condition and results of operations.
The status of the Affordable Care Act, any amendment, repeal or replacement thereof, is currently uncertain.
For example, in 2019, the Affordable Care Act individual mandate will no longer be in effect, but how such a change will affect the market and health care costs remains uncertain.
Changes in accounting rules and regulations could adversely affect our financial results.
Accounting rules and regulations are subject to review and interpretation by the Financial Accounting Standards Board (the “FASB”), the SEC and various other governing bodies.
A change in U.S. GAAP could have a significant effect on our reported financial results.
Additionally, the adoption of new or revised accounting principles could require that we make significant changes to our systems, processes and controls.
We cannot predict the effect of future changes to accounting principles, which could have a significant effect on our reported financial results and/or our results of operations, cash flows and liquidity.
Furthermore, to the extent that certain of our customers are negatively affected by the Tax Cuts and Jobs Act and/or any uncertainty around its implementation or enforcement, they may reduce spending and defer, delay or cancel projects or contracts.
Reduced government revenue resulting from changes to tax law may also lead to reduced government spending, which may negatively impact our government contracting business.
Our business is subject to a variety of risks.
acquired businesses will be profitable.
Changes in any of these laws, or any of our subsidiaries’ material failure to comply with them,
Future
For example, Government officials have made statements that suggest the current White House administration supports the repeal of all or portions of the Affordable Care Act, and Congress has introduced, and may introduce and pass in the future, new legislation to repeal or replace portions of the Affordable Care Act.
Item 7. Management’s Discussion and Analysis of Financial Condition and Results of Operations
140 rewritten, 71 added, 64 removed, 313 unchanged
Approximately [removed: 81%] [added: 84.0%] of our revenue is earned on a project basis for installation of mechanical systems in newly constructed facilities or for replacement of systems in existing facilities.
[removed: Amounts withheld] under this practice are known as retention or retainage.
As of December 31, [removed: 2017,] [added: 2018,] we had [removed: 4,690] [added: 5,208] projects in process.
Our average project takes six to nine months to complete, with an average contract price of approximately [removed: $504,000.][added: $597,000.]
Our projects generally require working capital [added: funding of equipment and labor costs.]
Taken together, projects with contract prices of $1 million or more totaled [removed: $1.83] [added: $2.51] billion of aggregate contract value as of December 31, [removed: 2017,] [added: 2018,] or approximately 80%, out of a total contract value for all projects in progress of [removed: $2.36] [added: $3.11] billion.
A stratification of projects in progress as of December 31, [removed: 2017,] [added: 2018,] by contract price, is as follows:
| $5 million - $10 million | | [removed: 70] [added: 77] | | | [removed: 464.7] [added: 533.3] | |
| $10 million - $15 million | | [removed: 18] [added: 23] | | | [removed: 221.3] [added: 279.0] | |
| Greater than $15 million | | [removed: 13] [added: 23] | | | [removed: 319.6] [added: 592.2] | |
In addition to project work, approximately [removed: 19%] [added: 16.0%] of our revenue represents maintenance and repair service on already installed HVAC and controls systems.
As a result, we monitor the views of major construction sector forecasters along with macroeconomic factors they believe drive the sector, including trends in gross domestic product, interest rates, business investment, employment, demographics, and the [removed: general] fiscal condition of federal, state and local governments.
During the [removed: three-year] [added: four-year] period from 2015 to [removed: 2017,] [added: 2018,] there was an increase in overall activity levels and we currently expect that activity will continue at these improved levels during [removed: 2018.][added: 2019.]
As a result of our continued strong emphasis on cash flow, at December 31, [removed: 2017] [added: 2018] we had modest indebtedness under our revolving credit facility, with positive uncommitted cash balances, as discussed further in “Liquidity and [removed: Capital Resources” below.]
We have strong surety relationships to support our bonding needs, and we believe our relationships with the surety markets are strong and benefit from our [removed: solid current results] [added: operating history] and financial position.
We have generated positive free cash flow in each of the last [removed: nineteen] [added: twenty] calendar years and will continue our emphasis in this area.
We believe that the relative size and strength of our balance sheet and surety [removed: support] [added: relationships] as compared to most companies in our industry represent competitive advantages for us.
Our primary emphasis for [removed: 2018] [added: 2019] will be on execution and cost control, but we are seeking growth based on our belief that industry conditions will continue to be strong in the near term, and we believe that activity levels will permit us to continue to earn solid profits while preserving and developing our workforce.
Approximately [removed: 81%] [added: 84.0%] of our revenue was earned on a project basis and recognized through the percentage of completion method of accounting during [removed: 2017.][added: 2018.]
More specifically, as part of the negotiation and bidding process [removed: in connection with obtaining] [added: to obtain] installation contracts, we estimate our contract costs, which include all direct [removed: materials (exclusive of rebates),] [added: materials,] labor and subcontract costs and indirect costs related to contract performance, such as indirect labor, supplies, tools, repairs and depreciation costs.
Purchased equipment on our projects is substantially produced to job specifications and is a [removed: value added] [added: value-added] element to our work.
The costs are considered to be incurred when title is transferred to us, which typically is upon delivery to the [removed: worksite.][added: work site.]
Other materials costs are not significant and are generally recorded when delivered to the [removed: worksite.][added: work site.]
This measurement and comparison process requires updates to the estimate of total costs to complete the contract, and these updates may include subjective [removed: assessments.][added: assessments and judgments.]
[removed: Deferred] [added: Capitalized] costs associated with unsuccessful contract bids are written off in the period that we are informed that we will not be awarded the contract.
Amounts by which cumulative contract revenue recognized on a contract as of a given date exceed cumulative billings [added: and unbilled receivables] to the customer under the contract are reflected as a current asset in our balance sheet under the caption “Costs and estimated earnings in excess of [removed: billings.”] [added: billings” and “Unbilled accounts receivable.”] Amounts by which cumulative billings to the customer under a contract as of a given date exceed cumulative contract revenue recognized on the contract are reflected as a current liability in our balance sheet under the caption “Billings in excess of costs and estimated earnings.”
The amount of revenue associated with unapproved change orders and claims was immaterial for the year ended December 31, [removed: 2017.][added: 2018.]
Loss estimates associated with the larger and longer‑developing risks—workers’ compensation, auto liability and general liability—are reviewed by a [removed: third party] [added: third-party] actuary quarterly.
| | | [removed: 2017] [added: 2018] | | | | | [removed: 2016] [added: 2017] | | | | | [removed: 2015] [added: 2016] | | | | |
| Revenue | | $ | [removed: 1,787,922] [added: 2,182,879] | | 100.0 | % | $ | [removed: 1,634,340] [added: 1,787,922] | | 100.0 | % | $ | [removed: 1,580,519] [added: 1,634,340] | | 100.0 | % |
| Cost of services | | | [removed: 1,421,641] [added: 1,736,600] | | [removed: 79.5] [added: 79.6] | % | | [removed: 1,290,331] [added: 1,421,641] | | [removed: 79.0] [added: 79.5] | % | | [removed: 1,262,390] [added: 1,290,331] | | [removed: 79.9] [added: 79.0] | % |
| Gross profit | | | [removed: 366,281] [added: 446,279] | | [removed: 20.5] [added: 20.4] | % | | [removed: 344,009] [added: 366,281] | | [removed: 21.0] [added: 20.5] | % | | [removed: 318,129] [added: 344,009] | | [removed: 20.1] [added: 21.0] | % |
| Selling, general and administrative expenses | | | [removed: 266,586] [added: 296,986] | | [removed: 14.9] [added: 13.6] | % | | [removed: 243,201] [added: 266,586] | | 14.9 | % | | [removed: 228,965] [added: 243,201] | | [removed: 14.5] [added: 14.9] | % |
| Goodwill impairment | | | [removed: 1,105] [added: —] | | [removed: 0.1] [added: —] | [removed: %] | | [removed: —] [added: 1,105] | | [removed: —] [added: 0.1] | [added: %] | | — | | — | |
| Gain on sale of assets | | | [removed: (670)] [added: (945)] | | — | | | [removed: (761)] [added: (670)] | | — | | | [removed: (880)] [added: (761)] | | [removed: (0.1)] [added: —] | [removed: %] |
| Operating income | | | [removed: 99,260] [added: 150,238] | | [removed: 5.6] [added: 6.9] | % | | [removed: 101,569] [added: 99,260] | | [removed: 6.2] [added: 5.5] | % | | [removed: 90,044] [added: 101,569] | | [removed: 5.7] [added: 6.2] | % |
| Interest income | | | [removed: 70] [added: 73] | | — | | | [removed: 9] [added: 70] | | — | | | [removed: 72] [added: 9] | | — | |
| Interest expense | | | [removed: (3,156)] [added: (3,710)] | | (0.2) | % | | [removed: (2,345)] [added: (3,156)] | | [removed: (0.1)] [added: (0.2)] | % | | [removed: (1,753)] [added: (2,345)] | | (0.1) | % |
| Changes in the fair value of contingent earn-out obligations | | | [removed: 3,715] [added: (2,066)] | | [removed: 0.2] [added: (0.1)] | % | | [removed: 731] [added: 3,715] | | [removed: —] [added: 0.2] | [added: %] | | [removed: 225] [added: 731] | | — | |
| Other income (expense) | | | [removed: 1,049] [added: 4,141] | | [removed: 0.1] [added: 0.2] | % | | [removed: 1,097] [added: 1,049] | | 0.1 | % | | [removed: 76] [added: 1,097] | | [removed: —] [added: 0.1] | [added: %] |
| Under $1 million | | 4,586 | | $ | 602.1 | |
| $1 million - $5 million | | 499 | | | 1,102.1 | |
| Total | | 5,208 | | $ | 3,108.7 | |
Capital Resources” below.
We have a credit facility in place with terms we believe are favorable that does not expire until April 2023.
Effective January 1, 2018, we adopted the requirements of Accounting Standards Update (ASU) 2014-09, Revenue from Contracts with Customers (Topic 606).
For additional information on the new standard and the impact to our results of operations, refer to our Summary of Significant Accounting Policies in Note 2 to the Consolidated Financial Statements.
We recognize revenue over time for all of our services as we perform them because (i) control continuously transfers to that customer as work progresses, and (ii) we have the right to bill the customer as costs are incurred.
The customer typically controls the work in process, as evidenced either by contractual termination clauses or by our rights to payment for work performed to date plus a reasonable profit to deliver products or services that do not have an alternative use to the Company.
For the reasons listed above, revenue is recognized based on the extent of progress towards completion of the performance obligation.
The selection of the method to measure progress towards completion requires judgment and is based on the nature of the products or services to be provided.
We generally use the cost to cost measure of progress for our contracts as it best depicts the transfer of assets to the customer that occurs as we incur costs on our contracts.
Under the cost to cost measure of progress, the extent of progress towards completion is measured based on the ratio of costs incurred to date to the total estimated costs at completion of the performance obligation.
Revenue, including estimated fees or profits, is recorded proportionally as costs are incurred.
Costs to fulfill include labor, materials and subcontractors’ costs, other direct costs and an allocation of indirect costs.
For a small portion of our business in which our services are delivered in the form of service maintenance agreements for existing systems to be repaired and maintained, as opposed to constructed, our performance obligation is to maintain the customer’s mechanical system for a specific period of time.
Similar to jobs, we recognize revenue over time; however, for service maintenance agreements in which the full cost to provide services may not be known, we generally use an input method to recognize revenue, which is based on the amount of time we have provided our services out of the total time we have been contracted to perform those services.
Subcontractor labor is recognized as the work is performed.
We generally do not incur significant incremental costs related to obtaining or fulfilling a contract prior to the start of a project.
On rare occasions, when significant pre‑contract costs are incurred, they are capitalized and amortized on a percentage of completion basis over the life of the contract.
Project contracts typically provide for a schedule of billings or invoices to the customer based on our job to date percentage of completion of specific tasks inherent in the fulfillment of our performance obligation(s).
| Net income | | $ | 112,903 | | | | $ | 55,272 | | | | $ | 64,896 | | | |
2018 Compared to 2017
Furthermore, in the fourth quarter of 2018, we combined two operating locations into one.
Revenue—Revenue increased $395.0 million, or 22.1% to $2.18 billion in 2018 compared to 2017.
The increase included a 5.1% increase related to the Indiana and BCH acquisitions and a 17.0% increase in revenue related to same‑store activity.
The same‑store revenue increase was broad-based, including an increase in activity at our North Carolina operation ($123.6 million), one of our Virginia operations ($25.4 million) and our Wisconsin operation ($23.0 million).
Backlog as of December 31, 2018 was $1.17 billion, a 7.1% decrease from September 30, 2018 backlog of $1.25 billion and a 23.0% increase from December 31, 2017 backlog of $948.4 million.
Sequential backlog decreased primarily due to completion of project work at our Wisconsin operation ($25.5 million), our North Carolina operation ($25.1 million) and one of our Virginia operations ($17.0 million).
Gross Profit—Gross profit increased $80.0 million, or 21.8%, to $446.3 million in 2018 as compared to 2017.
As a percentage of revenue, gross profit remained relatively consistent at 20.4% in 2018 as compared to 20.5% in 2017 due to the improvement in project execution at our North Carolina operation, offset by job underperformance at our California operation ($3.7 million).
This increase is primarily due to the increase in revenue and increased compensation costs related to higher earnings compared to the prior year.
Additionally, we had an increase in bad debt expense in 2018 of $3.4 million due to three recent bankruptcy filings of retail customers ($1.2 million) and due to bad debt charges at our California operating location.
As a percentage of revenue, SG&A decreased from 14.9% in 2017 to 13.6% in 2018.
| | | 2018 | | | 2017 | | |
| SG&A | | $ | 296,986 | | $ | 266,586 | |
| Same-store SG&A, excluding amortization expense | | $ | 271,819 | | $ | 254,827 | |
The increase reflects the increase in the variable interest rate on our revolving credit facility as well as an increase in notes to former owners as a result of our recent acquisitions.
Income
The loss from changes in the fair value of contingent earn out obligations in 2018 was primarily driven by higher than previously projected earnings from BCH, which increased the value of the earn-out.
funding of equipment and labor costs.
| Under $1 million | | 4,221 | | $ | 529.8 | |
| $1 million - $5 million | | 368 | | | 828.6 | |
| Total | | 4,690 | | $ | 2,364.0 | |
We have a credit facility in place with considerably less restrictive terms than those of our previous facilities; this facility does not expire until February 2021.
Subcontractor labor is recognized as the work is performed, but is generally subjected to approval as to milestones or other evidence of completion.
We generally do not incur significant costs prior to receiving a contract, and therefore, these costs are expensed as incurred.
In limited circumstances, when significant pre‑contract costs are incurred, they are deferred if the costs can be directly associated with a specific contract and if their recoverability from the contract is probable.
Upon receiving the contract, these costs are included in contract costs.
Project contracts typically provide for a schedule of billings or invoices to the customer based on reaching agreed upon milestones or as we incur costs.
| Net income including noncontrolling interests | | | 55,272 | | 3.1 | % | | 64,896 | | 4.0 | % | | 57,440 | | 3.6 | % |
| Less: Net income attributable to noncontrolling interests | | | — | | | | | — | | | | | 8,076 | | | |
| Net income attributable to Comfort Systems USA, Inc. | | $ | 55,272 | | | | $ | 64,896 | | | | $ | 49,364 | | | |
The
However, same‑store SG&A, excluding amortization, is not considered under
While we still have other subsidiaries with outstanding claims against BP related to this matter, we cannot predict when or if we will receive any further settlement compensation as a result of these outstanding claims.
While we believe we were able to make reasonable estimates of the impact of the Tax Cuts and Jobs Act in these financial statements, the amounts recorded are provisional and the final impact may differ from these estimates due to, among other things, changes in our interpretations and assumptions and additional guidance that may be issued by regulatory authorities.
filing of a federal income tax automatic accounting method change application.
Approximately $3.0 million of the decrease is expected to impact our effective tax rate.
Starting in 2019, we currently estimate our effective tax rate will be between 25% and 30%.
We expect our future tax rates to be lower than 2017 primarily due to the corporate tax rate reduction to 21% effective January 1, 2018.
These estimates also reflect the repeal of the domestic production activities deduction and other items of the Tax Cuts and Jobs Act that partially offset the benefit from the reduction in the corporate tax rate.
2016 Compared to 2015
In addition, we merged four operating locations into two operating locations during the first quarter, and created two operating locations out of one existing operating location.
An operating location is excluded from the same‑store comparison in the current year and comparable prior years when it is properly characterized as a discontinued operation under applicable accounting standards.
Revenue—Revenue increased $53.8 million, or 3.4% to $1,634.3 million in 2016 compared to 2015.
The increase included a 4.6% increase related to the acquisition of Shoffner, which was partially offset by a 1.1% decrease in revenue related to same‑store activity.
The same‑store revenue decrease was primarily due to our Environmental Air Systems, LLC (“EAS”) operation ($48.0 million), which experienced decreased large project work compared to the prior year, specifically in the manufacturing sector.
This decrease was partially offset by increased activity at our Michigan operation ($16.8 million) and our Northern Texas operation ($13.1 million).
Backlog as of December 31, 2016 was $763.4 million, a 6.1% increase from September 30, 2016 backlog of $719.3 million and a 7.3% increase from December 31, 2015 backlog of $711.6 million.
Same-store backlog increased 2.3% primarily due to increased project bookings at our New Hampshire operation ($28.1 million).
This was partially offset by the completion of project work at our EAS operation ($21.0 million).
Gross Profit—Gross profit increased $25.9 million, or 8.1%, to $344.0 million in 2016 as compared to 2015.
Additionally, gross profit was higher due to increased volumes at our Michigan operation ($3.9 million) and one of our Alabama operations ($3.3 million).
This was partially offset by a decrease at our EAS operation ($8.6 million), which has experienced a decrease in large project work when compared to the same period in 2015.
As a percentage of revenue, gross profit increased from 20.1% in 2015 to 21.0% in 2016 primarily due to the factors discussed above.
This increase was primarily due to increased compensation costs ($4.8 million), which are primarily related to an increase in operating results and expanded service activities at multiple locations.
This was offset by a decrease in bad debt expense ($1.6 million) primarily due to collections of aged receivables.
decreased $0.7 million during 2016 compared to the prior year.
As a percentage of revenue, SG&A increased from 14.5% in 2015 to 14.9% in 2016, primarily due to the factors discussed above.
An excerpt. Shown here: 40 of 140 rewritten, 40 of 71 added and 40 of 64 removed. The counts are complete. For every sentence, read Item 7. Management’s Discussion and Analysis of Financial Condition and Results of Operations in the FY2018 filing and the FY2017 filing.
Item 7A. Quantitative and Qualitative Disclosures about Market Risk
7 rewritten, 1 added, 2 removed, 14 unchanged
The following table presents principal amounts (stated in thousands) and related average interest rates by year of maturity for our debt obligations and their indicated fair market value at December 31, [removed: 2017:][added: 2018:]
| | | [removed: 2018 | | |] 2019 | | | 2020 | | | 2021 | | | 2022 | | | [added: 2023 | | |] Thereafter | | | Total | | |
| Average Interest Rate | | | [removed: 3.0%] [added: 3.1%] | | | [removed: 3.0%] [added: 3.1%] | | | [removed: 3.0%] [added: 3.1%] | | | [removed: 3.0%] [added: —] | | | — | | | — | | | [removed: 3.0%] [added: 3.1%] | |
| Variable Rate Debt | | $ | 100 | | $ | [removed: 114] [added: 5] | | $ | — | | $ | [removed: 45,000] [added: —] | | $ | [removed: —] [added: 50,000] | | $ | — | | $ | [removed: 45,214] [added: 50,105] | |
The interest rate applicable to [removed: the] [added: other] variable rate debt was approximately [removed: 3.8%] [added: 4.8%] as of December 31, [removed: 2017.][added: 2018.]
The weighted average interest rate applicable to the borrowings under the Facility was approximately [removed: 2.8%] [added: 3.7%] as of December 31, [removed: 2017.][added: 2018.]
We did not recognize any [removed: other] impairments, in the current year, on those assets required to be measured at fair value on a nonrecurring basis.
| Fixed Rate Debt | | $ | 3,179 | | $ | 13,817 | | $ | 9,817 | | $ | — | | $ | — | | $ | — | | $ | 26,813 | |
| Fixed Rate Debt | | $ | 513 | | $ | 512 | | $ | 7,150 | | $ | 7,150 | | $ | — | | $ | — | | $ | 15,325 | |
During the year ended December 31, 2017, we recorded a goodwill impairment charge of $1.1 million based on Level 3 measurements.
Item 1. Business
55 rewritten, 8 added, 12 removed, 147 unchanged
We install, maintain, repair and replace products and systems throughout our 36 operating units with [removed: 115] [added: 128] locations in [removed: 102] [added: 114] cities throughout the United States.
Approximately 99% of our consolidated [removed: 2017] [added: 2018] revenue was derived from commercial, industrial and institutional customers and multi‑family residential projects.
Approximately [removed: 38%] [added: 38.0%] of our revenue was attributable to installation services in newly constructed facilities and [removed: 62%] [added: 62.0%] was attributable to renovation, expansion, maintenance, repair and replacement services in existing buildings.
Our consolidated [removed: 2017] [added: 2018] revenue was derived from the following service activities, substantially all of which are in the mechanical services industry, the single industry segment we serve:
| HVAC and Plumbing | | [removed: 90] [added: 90.5] | % |
| Building Automation Control Systems | | [removed: 5] [added: 4.4] | % |
| Other | | [removed: 5] [added: 5.1] | % |
Many factors [removed: positively] affect mechanical services industry growth, [removed: particularly] [added: including but, not limited to,] (i) population growth, which increases the need for commercial, industrial and institutional space, (ii) an aging installed base of buildings and equipment, (iii) increasing sophistication, complexity and efficiency of mechanical systems, and (iv) growing emphasis on environmental and energy efficiency.
| | · | | construction of and installation in new buildings, which provided approximately [removed: 38%] [added: 38.0%] of our revenue in [removed: 2017,] [added: 2018,] and |
| | · | | renovation, expansion, maintenance, repair and replacement in existing buildings, which provided the remaining [removed: 62%] [added: 62.0%] of our [removed: 2017] [added: 2018] revenue. |
The key objectives of our strategy are to [added: improve profitability and] generate growth in our operations, [added: to] improve the productivity of our [removed: workforce] [added: workforce,] and to acquire complementary businesses.
In order to accomplish our [removed: objectives] [added: objectives,] we are currently focused on the following elements:
The six core competencies are: (i) [removed: customer cultivation and rapport,] [added: safety,] (ii) [added: customer service, (iii)] design and build expertise, [removed: (iii)] [added: (iv)] effective pre-construction processes, [removed: (iv)] [added: (v)] job and cost tracking, [removed: (v) safety,] and (vi) service excellence.
Achieve Operating Efficiencies—We think we can achieve operating efficiencies and cost savings through purchasing economies, adopting [added: operational] “best [removed: practices” operating programs,] [added: practices,”] and focusing on job management to deliver services in a cost‑effective and efficient manner.
We emphasize improving the “job loop” at our locations—qualifying, estimating, pricing and executing projects effectively and [removed: efficiently, then promptly assessing project experience for applicability to current and future projects.][added: efficiently.]
Attract, Retain and Invest in our Employees—We seek to attract and retain quality employees by providing them an enhanced career path from working for a larger [removed: company, the opportunity to realize] [added: company that offers] a more stable income and attractive benefits packages.
We believe that these complex markets are attractive because of their growth opportunities, large and diverse customer base, attractive margins and potential for long‑term relationships with building [removed: owners, property managers, general contractors and architects.][added: owners.]
Approximately 99% of our consolidated [removed: 2017] [added: 2018] revenue was derived from commercial, industrial and institutional customers and large multi‑family residential projects.
Our distribution of revenue in [removed: 2017] [added: 2018] by end‑use sector was as follows:
| Industrial | | [removed: 22] [added: 27.3] | % |
| Education | | [removed: 20] [added: 18.0] | % |
| Office Buildings | | [removed: 14] [added: 13.2] | % |
| Healthcare | | [removed: 13] [added: 14.7] | % |
| Government | | [removed: 8] [added: 6.6] | % |
| [removed: Retail and] [added: Retail,] Restaurants [added: and Entertainment] | | [removed: 8] [added: 10.3] | % |
| Multi-Family [added: and Residential] | | [removed: 6] [added: 6.2] | % |
| Other | | [removed: 1] [added: 3.7] | % |
Approximately [removed: 81%] [added: 84.0%] of our revenue is earned on a project basis for installation of systems in newly constructed or existing facilities.
As of December 31, [removed: 2017,] [added: 2018,] we had [removed: 4,690] [added: 5,208] projects in process with an aggregate contract value of approximately [removed: $2.36] [added: $3.11] billion.
Our average project takes six to nine months to complete, with an average contract price of approximately [removed: $504,000.][added: $597,000.]
This average project size, when taken together with the approximately [removed: 19%] [added: 16.0%] of our revenue derived from maintenance and service, provides us with a broad base of work in the construction services sector.
A stratification of projects in progress as of December 31, [removed: 2017,] [added: 2018,] by contract price, is as follows:
| $5 million - $10 million | | [removed: 70] [added: 77] | | | [removed: 464.7] [added: 533.3] | |
| $10 million - $15 million | | [removed: 18] [added: 23] | | | [removed: 221.3] [added: 279.0] | |
| Greater than $15 million | | [removed: 13] [added: 23] | | | [removed: 319.6] [added: 592.2] | |
[removed: Over] [added: Strategic Service Initiative—Over] the last several years we have made substantial [removed: incremental] investments to expand our service and maintenance revenue by increasing the value we can offer to service and maintenance customers.
We are actively concentrating [removed: existing and new] managerial and sales resources on training and hiring experienced employees to sell and profitably perform service work.
In many locations we have added or upgraded our capability, and we believe our investments and efforts have provided [removed: a compelling] customer value [removed: offering that stimulates] [added: and stimulated] growth in all aspects of our businesses.
We have dedicated a significant portion of our cash flow on an ongoing basis to seeking opportunities to acquire businesses that have strong assembled workforces, attractive market positions and [removed: capabilities and other attractive operational, management, growth and geographic characteristics.][added: desirable locations.]
We have centralized certain administrative functions such as insurance, employee benefits, training, safety programs, marketing and cash management to enable our [added: local operating management to focus on pursuing new business opportunities and improving operating efficiencies.]
| Total | | 100.0 | % |
| Total | | 100.0 | % |
| Under $1 million | | 4,586 | | $ | 602.1 | |
| $1 million - $5 million | | 499 | | | 1,102.1 | |
| Total | | 5,208 | | $ | 3,108.7 | |
We provide “design and build” and
Our average project takes six to nine months to complete, with an average contract price of approximately $597,000.
conditioning during the warmer months.
| Total | | 100 | % |
| Lodging and Entertainment | | 5 | % |
| Religious and Not for Profit | | 2 | % |
| Residential | | 1 | % |
| Under $1 million | | 4,221 | | $ | 529.8 | |
| $1 million - $5 million | | 368 | | | 828.6 | |
| Total | | 4,690 | | $ | 2,364.0 | |
Strategic Service Initiative.
local operating management to focus on pursuing new business opportunities and improving operating efficiencies.
We also combine certain back office and administrative functions at various locations.
Approximately 43% of our consolidated 2017 revenue was derived from renovation, expansion, replacement and reconfiguration of existing systems for commercial, industrial and institutional customers.
repair of equipment containing these refrigerants and also regulate the containment and recycling of these refrigerants.
An excerpt. Shown here: 40 of 55 rewritten, all 8 added and all 12 removed. The counts are complete. For every sentence, read Item 1. Business in the FY2018 filing and the FY2017 filing.
Cover and table of contents
27 rewritten, 1 added, 1 removed, 62 unchanged
| For the Fiscal Year Ended December 31, [removed: 2017] [added: 2018] | |
Indicate by check mark whether the registrant has submitted electronically [removed: and posted on its corporate Website, if any,] every Interactive Data File required to be submitted [removed: and posted] pursuant to Rule 405 of Regulation S‑T (§ 232.405 of this chapter) during the preceding 12 months (or for such shorter period that the registrant was required to submit [removed: and post] such files).
| Large accelerated filer ☒ | Accelerated filer ☐ | Non‑accelerated filer ☐ [removed: (Do not check if a smaller reporting company)] | Smaller reporting company ☐ | Emerging growth company ☐ |
Indicate by check mark whether the registrant is a shell company (as defined in [removed: Exchange Act] Rule [removed: 12b‑2).][added: 12b‑2 of the Act).]
The aggregate market value of the voting stock held by non‑affiliates of the registrant at June [removed: 30, 2017] [added: 29, 2018] was approximately [removed: $1.35] [added: $1.67] billion, based on the [removed: $37.10] [added: $45.80] last sale price of the registrant’s common stock on the New York Stock Exchange on June [removed: 30, 2017.][added: 29, 2018.]
As of February 15, [removed: 2018, 37,175,074] [added: 2019, 36,869,712] shares of the registrant’s common stock were outstanding (excluding treasury shares of [removed: 3,948,291).][added: 4,253,653).]
The information required by Part III (other than the required information regarding executive officers) is incorporated by reference from the registrant’s definitive proxy statement, which will be filed with the Commission not later than 120 days following December 31, [removed: 2017.][added: 2018.]
| [Item 1B.](#ITEM1BUnresolvedStaffComments_139610) | [Unresolved Staff Comments](#ITEM1BUnresolvedStaffComments_139610) | [removed: 18] [added: 19] |
| [Item 2.](#ITEM2Properties_592424) | [Properties](#ITEM2Properties_592424) | [removed: 18] [added: 19] |
| [Item 3.](#ITEM3LegalProceedings_395131) | [Legal Proceedings](#ITEM3LegalProceedings_395131) | [removed: 19] [added: 20] |
| [Item 4.](#ITEM4MineSafetyDisclosures_231930) | [Mine Safety Disclosures](#ITEM4MineSafetyDisclosures_231930) | [removed: 19] [added: 20] |
| [Item 4A.](#ITEM4AExecutiveOfficersoftheRegistrant_3) | [Executive Officers of the Registrant](#ITEM4AExecutiveOfficersoftheRegistrant_3) | [removed: 19] [added: 20] |
| [Item 5.](#ITEM5MarketforRegistrantsCommonEquityRel) | [Market for Registrant’s Common Equity, Related Stockholder Matters and Issuer Purchases of Equity Securities](#ITEM5MarketforRegistrantsCommonEquityRel) | [removed: 20] [added: 21] |
| [Item 6.](#ITEM6SelectedFinancialData_853719) | [Selected Financial Data](#ITEM6SelectedFinancialData_853719) | [removed: 22] [added: 24] |
| [Item 7.](#ITEM7ManagementsDiscussionandAnalysisofF) | [Management’s Discussion and Analysis of Financial Condition and Results of Operations](#ITEM7ManagementsDiscussionandAnalysisofF) | [removed: 23] [added: 24] |
| [Item 7A.](#ITEM7AQuantitativeandQualitativeDisclosu) | [Quantitative and Qualitative Disclosures about Market Risk](#ITEM7AQuantitativeandQualitativeDisclosu) | [removed: 38] [added: 40] |
| [Item 8.](#ITEM8FinancialStatementsandSupplementary) | [Financial Statements and Supplementary Data](#ITEM8FinancialStatementsandSupplementary) | [removed: 39] [added: 41] |
| [Item 9.](#ITEM9ChangesinandDisagreementswithAccoun) | [Changes in and Disagreements with Accountants on Accounting and Financial Disclosure](#ITEM9ChangesinandDisagreementswithAccoun) | [removed: 70] [added: 75] |
| [Item 9A.](#ITEM9AControlsandProcedures_403685) | [Controls and Procedures](#ITEM9AControlsandProcedures_403685) | [removed: 70] [added: 75] |
| [Item 9B.](#ITEM9BOtherInformation_701400) | [Other Information](#ITEM9BOtherInformation_701400) | [removed: 71] [added: 76] |
| [Item 10.](#ITEM10DirectorsExecutiveOfficersandCorpo) | [Directors, Executive Officers and Corporate Governance](#ITEM10DirectorsExecutiveOfficersandCorpo) | [removed: 71] [added: 76] |
| [Item 11.](#ITEMS111213AND14_316091) | [Executive Compensation](#ITEMS111213AND14_316091) | [removed: 71] [added: 76] |
| [Item 12.](#ITEMS111213AND14_316091) | [Security Ownership of Certain Beneficial Owners and Management and Related Stockholder Matters](#ITEMS111213AND14_316091) | [removed: 71] [added: 76] |
| [Item 13.](#ITEMS111213AND14_316091) | [Certain Relationships and Related Transactions, and Director Independence](#ITEMS111213AND14_316091) | [removed: 71] [added: 76] |
| [Item 14.](#ITEMS111213AND14_316091) | [Principal Accounting Fees and Services](#ITEMS111213AND14_316091) | [removed: 71] [added: 76] |
| [Item 15.](#ITEM15ExhibitsandFinancialStatementSched) | [Exhibits and Financial Statement Schedules](#ITEM15ExhibitsandFinancialStatementSched) | [removed: 71] [added: 76] |
| [Item 16.](#ITEM16Form10KSummary) | [Form 10-K Summary](#ITEM16Form10KSummary) | [removed: 72] [added: 76] |
10-K 1 fix-20181231x10k.htm 10-K
10-K 1 fix-20171231x10k.htm 10-K
Item 2. Properties
5 rewritten, 1 added, 1 removed, 6 unchanged
As of December 31, [removed: 2017,] [added: 2018,] we owned [removed: five] [added: ten] properties.
Our facilities are located in [removed: 27] [added: 28] states and consist of offices, shops and fabrication, maintenance and warehouse facilities.
In certain [removed: instances] [added: instances,] these leases are with current or former employees.
To the extent we renew, enter into leases or otherwise change leases with current or former employees, we enter into such [added: agreements on terms that reflect a fair market valuation for the properties.]
[removed: To maximize available capital, we generally intend] to [removed: continue to] lease our properties, but may consider further purchases of property where we believe ownership would be more economical.
To maximize available capital, we generally intend to continue
agreements on terms that reflect a fair market valuation for the properties.
Item 4A. Executive Officers of the Registrant
3 rewritten, 18 added, 4 removed, 15 unchanged
Brian Lane, age [removed: 60,] [added: 61,] has served as our Chief Executive Officer and President since December 2011 and as a director since November 2010.
William George, age [removed: 53,] [added: 54,] has served as our Executive Vice President and Chief Financial Officer since May 2005, was our Senior Vice President, General Counsel and Secretary from May 1998 to May 2005, and was our Vice President, General Counsel and Secretary from March 1997 to April 1998.
Shaeff, age [removed: 52,] [added: 53,] has served as our Senior Vice President and Chief Accounting Officer since May 2005, was our Vice President and Corporate Controller from March 2002 to May 2005, and was our Assistant Corporate Controller from September 1999 to February 2002.
Mr. Lane holds a Bachelor of Science in Chemistry from the University of Notre Dame and a Master of Business Administration from Boston College.
Since October 2011, Mr. George has also served as Regional Vice President for Region 5.
Mr. George was a member of our founding management team in connection with our formation in 1997.
Mr. George holds a Bachelor of Science in Economics from Brigham Young University and a Juris Doctorate from Harvard Law School.
Ms. Shaeff is a Certified Public Accountant and holds a Bachelor of Business Administration in Accounting from Texas A&M University.
Laura F.
Howell, age 31, has served as Vice President and General Counsel for the Company since January 2019.
Prior to her current position, Ms. Howell served as the Associate General Counsel from January 2018 to December 2018 and as Senior Counsel, Corporate from November 2014 to December 2017.
Prior to joining the Company, she was an associate in the corporate department of the Houston office of Latham & Watkins, LLP from November 2013 to October 2014.
From September 2012 to October 2013, Ms. Howell was an associate in the corporate department of the
Silicon Valley office of Fenwick & West, LLP.
Ms. Howell holds a Bachelor of Arts in Economics from Wake Forest University and a Juris Doctorate from Stanford Law School.
Terry A.
Young, age 56, has served as Senior Vice President of Service for the Company since January 2019.
Prior to his current position, Mr. Young served as a Regional Vice President of Service for the Company from June 2013 to December 2018 and as Director of Business Development from May 2011 to June 2013.
Mr. Young joined the Company after working in various Executive GM and VP positions in Asia Pacific and North American organizations, including Triple M Mechanical, Daikin (formerly McQuay International) and the Trane Company.
He has spent more than 35 years in the commercial HVAC construction and services industry in various roles including technical, engineering, business development, project and strategic activities.
Mr. Young has 6Sigma & PMI certifications and is a graduate of the TAFE College of New South Wales, Australia where he completed studies in F&M Engineering.
Ms. Shaeff is a Certified Public Accountant.
Trent T.
McKenna, age 45, has served as our Senior Vice President, General Counsel and Secretary since August 2013, was our Vice President, General Counsel and Secretary from May 2005 to August 2013, and was our Associate General Counsel from August 2004 to May 2005.
From February 1999 to August 2004, Mr. McKenna was a practicing attorney in the area of complex commercial litigation in the Houston, Texas office of Akin Gump Strauss Hauer & Feld LLP, an international law firm.
Item 5. Market for Registrant’s Common Equity, Related Stockholder Matters and Issuer Purchases of Equity Securities
8 rewritten, 18 added, 16 removed, 29 unchanged
As of February 15, [removed: 2018] [added: 2019,] there were approximately [removed: 364] [added: 342] stockholders of record of our Common Stock, and the last reported sale price on that date was [removed: $41.45] [added: $50.66] per share.
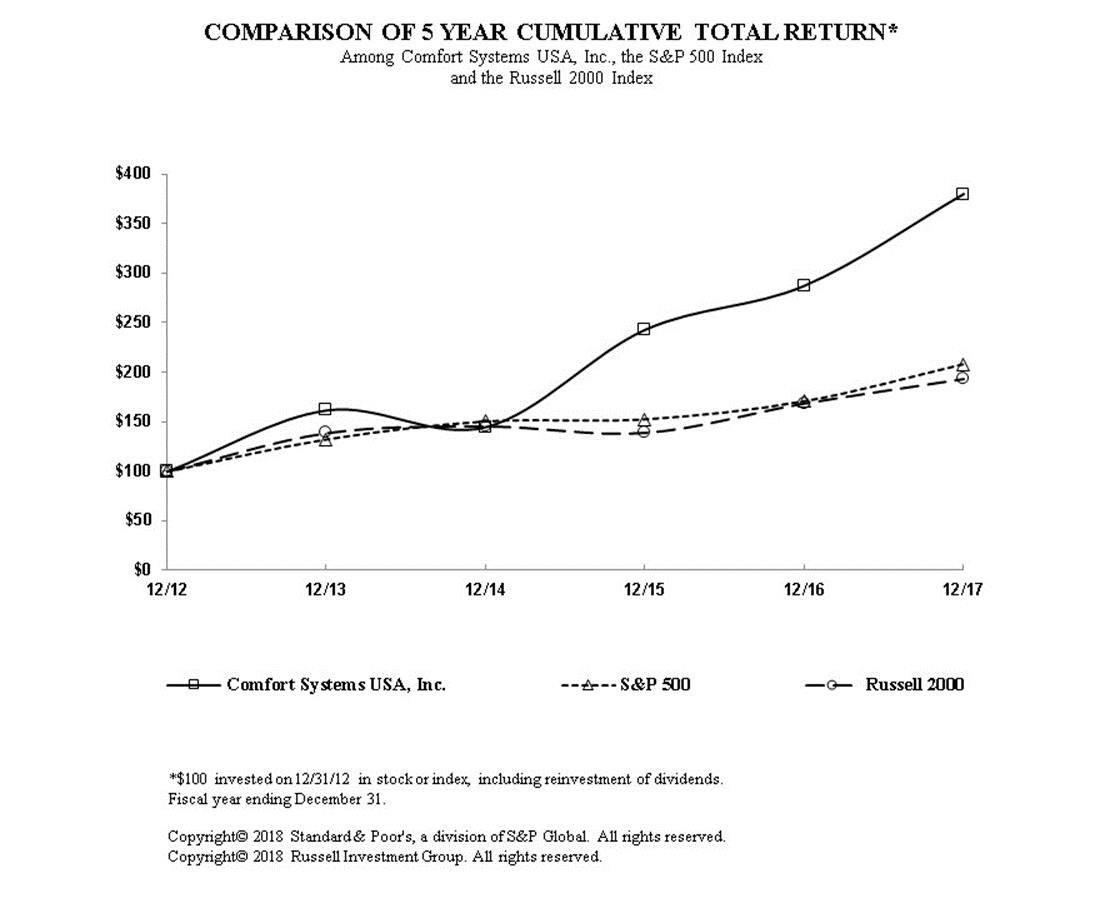][added: 2](https://www.sec.gov/Archives/edgar/data/1035983/000155837019000857/fix20181231x10k001.jpg)]
Since the inception of the repurchase program, the Board has approved [removed: 8.1] [added: 8.8] million shares to be repurchased.
As of December 31, [removed: 2017,] [added: 2018,] we have repurchased a cumulative total of [removed: 7.6] [added: 8.2] million shares at an average price of [removed: $13.75] [added: $16.24] per share under the repurchase program.
months ended December 31, [removed: 2017,] [added: 2018,] we repurchased [removed: 0.3] [added: 0.6] million shares for approximately [removed: $9.0] [added: $28.5] million at an average price of [removed: $34.23] [added: $48.13] per share.
During the year ended December 31, [removed: 2017,] [added: 2018,] we purchased our common shares in the following amounts at the following [removed: weighted‑average] [added: average] prices:
| [removed: November] [added: January] 1 - [removed: November 30] [added: January 31] | | [removed: 2,400] [added: —] | | $ | [removed: 40.58] [added: —] | | 7,605,588 | | 506,905 | |
| | (1) | | Purchased as part of a program announced on March 29, 2007 under which, since the inception of this program, [removed: 8.1] [added: 8.8] million shares have been approved for repurchase. |
| Fourth Quarter, 2018 | | $ | 59.20 | | $ | 41.30 | | $ | 0.090 | |
| Third Quarter, 2018 | | $ | 58.35 | | $ | 46.25 | | $ | 0.085 | |
| Second Quarter, 2018 | | $ | 48.60 | | $ | 40.15 | | $ | 0.080 | |
| First Quarter, 2018 | | $ | 44.45 | | $ | 39.85 | | $ | 0.075 | |
| February 1 - February 28 | | 26,150 | | $ | 40.64 | | 7,631,738 | | 480,755 | |
| March 1 - March 31 | | 124,331 | | $ | 41.12 | | 7,756,069 | | 356,424 | |
| April 1 - April 30 | | 7,485 | | $ | 40.38 | | 7,763,554 | | 348,939 | |
| May 1 - May 31 | | 6,841 | | $ | 44.68 | | 7,770,395 | | 342,098 | |
| June 1 - June 30 | | 1,000 | | $ | 46.31 | | 7,771,395 | | 341,098 | |
| July 1 - July 31 | | 500 | | $ | 46.00 | | 7,771,895 | | 340,598 | |
| August 1 - August 31 | | 25,429 | | $ | 55.60 | | 7,797,324 | | 986,085 | |
| September 1 - September 30 | | 59,293 | | $ | 55.78 | | 7,856,617 | | 926,792 | |
| October 1 - October 31 | | 117,616 | | $ | 53.01 | | 7,974,233 | | 809,176 | |
| November 1 - November 30 | | 72,194 | | $ | 53.14 | | 8,046,427 | | 736,982 | |
| December 1 - December 31 | | 152,000 | | $ | 45.32 | | 8,198,427 | | 584,982 | |
| | | 592,839 | | $ | 48.13 | | 8,198,427 | | 584,982 | |
Under our 2012 Equity Incentive Plan and 2017 Omnibus Incentive Plan, employees may elect to have us withhold common shares to satisfy statutory federal, state and local tax withholding obligations arising on the vesting of restricted stock awards and exercise of options.
When we withhold these shares, we are required to remit to the appropriate taxing authorities the market price of the shares withheld, which could be deemed a purchase of the common shares by us on the date of withholding.
| Fourth Quarter, 2016 | | $ | 34.70 | | $ | 27.21 | | $ | 0.070 | |
| Third Quarter, 2016 | | $ | 33.48 | | $ | 26.26 | | $ | 0.070 | |
| Second Quarter, 2016 | | $ | 33.59 | | $ | 29.49 | | $ | 0.070 | |
| First Quarter, 2016 | | $ | 32.27 | | $ | 24.67 | | $ | 0.065 | |
| January 1 - January 31 | | — | | $ | — | | 7,342,491 | | 770,002 | |
| February 1 - February 28 | | — | | $ | — | | 7,342,491 | | 770,002 | |
| March 1 - March 31 | | 61,412 | | $ | 35.78 | | 7,403,903 | | 708,590 | |
| April 1 - April 30 | | 500 | | $ | 34.73 | | 7,404,403 | | 708,090 | |
| May 1 - May 31 | | 45,381 | | $ | 35.28 | | 7,449,784 | | 662,709 | |
| June 1 - June 30 | | — | | $ | — | | 7,449,784 | | 662,709 | |
| July 1 - July 31 | | — | | $ | — | | 7,449,784 | | 662,709 | |
| August 1 - August 31 | | 143,667 | | $ | 33.18 | | 7,593,451 | | 519,042 | |
| September 1 - September 30 | | 9,737 | | $ | 33.56 | | 7,603,188 | | 509,305 | |
| October 1 - October 31 | | — | | $ | — | | 7,603,188 | | 509,305 | |
| December 1 - December 31 | | — | | $ | — | | 7,605,588 | | 506,905 | |
| | | 263,097 | | $ | 34.23 | | 7,605,588 | | 506,905 | |
Item 6. Selected Financial Data
18 rewritten, 0 added, 0 removed, 13 unchanged
| | | [added: 2018 | | |] 2017 | | | 2016 | | | 2015 | | | 2014 | | | [removed: 2013 | | |]
| Revenue | | $ | [removed: 1,787,922] [added: 2,182,879] | | $ | [removed: 1,634,340] [added: 1,787,922] | | $ | [removed: 1,580,519] [added: 1,634,340] | | $ | [removed: 1,410,795] [added: 1,580,519] | | $ | [removed: 1,357,272] [added: 1,410,795] | |
| Operating income (1) | | $ | [removed: 99,260] [added: 150,238] | | $ | [removed: 101,569] [added: 99,260] | | $ | [removed: 90,044] [added: 101,569] | | $ | [removed: 42,222] [added: 90,044] | | $ | [removed: 46,258] [added: 42,222] | |
| Income from continuing operations | | $ | [removed: 55,272] [added: 112,903] | | $ | [removed: 64,896] [added: 55,272] | | $ | [removed: 57,440] [added: 64,896] | | $ | [removed: 28,614] [added: 57,440] | | $ | [removed: 28,632] [added: 28,614] | |
| Income (loss) from discontinued operations, net of tax | | $ | — | | $ | — | | $ | — | | $ | [removed: (15)] [added: —] | | $ | [removed: (76)] [added: (15)] | |
| Net income including noncontrolling interests | | $ | [removed: 55,272] [added: 112,903] | | $ | [removed: 64,896] [added: 55,272] | | $ | [removed: 57,440] [added: 64,896] | | $ | [removed: 28,599] [added: 57,440] | | $ | [removed: 28,556] [added: 28,599] | |
| Net income attributable to Comfort Systems USA, Inc. | | $ | [removed: 55,272] [added: 112,903] | | $ | [removed: 64,896] [added: 55,272] | | $ | [removed: 49,364] [added: 64,896] | | $ | [removed: 23,063] [added: 49,364] | | $ | [removed: 27,269] [added: 23,063] | |
| Income from continuing operations | | $ | [removed: 1.48] [added: 3.03] | | $ | [removed: 1.74] [added: 1.48] | | $ | [removed: 1.32] [added: 1.74] | | $ | [removed: 0.61] [added: 1.32] | | $ | [removed: 0.73] [added: 0.61] | |
| [removed: Net income] | | $ | [removed: 1.48] [added: 3.03] | | $ | [removed: 1.74] [added: 1.48] | | $ | [removed: 1.32] [added: 1.74] | | $ | [removed: 0.61] [added: 1.32] | | $ | [removed: 0.73] [added: 0.61] | |
| Income from continuing operations | | $ | [removed: 1.47] [added: 3.00] | | $ | [removed: 1.72] [added: 1.47] | | $ | [removed: 1.30] [added: 1.72] | | $ | [removed: 0.61] [added: 1.30] | | $ | [removed: 0.73] [added: 0.61] | |
| [removed: Net income] | | $ | [removed: 1.47] [added: 3.00] | | $ | [removed: 1.72] [added: 1.47] | | $ | [removed: 1.30] [added: 1.72] | | $ | [removed: 0.61] [added: 1.30] | | $ | [removed: 0.73] [added: 0.61] | |
| Cash dividends per share | | $ | [removed: 0.295] [added: 0.330] | | $ | [removed: 0.275] [added: 0.295] | | $ | [removed: 0.250] [added: 0.275] | | $ | [removed: 0.225] [added: 0.250] | | $ | [removed: 0.210] [added: 0.225] | |
| Working capital | | $ | [removed: 115,629] [added: 142,642] | | $ | [removed: 98,276] [added: 115,629] | | $ | [removed: 118,882] [added: 98,276] | | $ | [removed: 111,433] [added: 118,882] | | $ | [removed: 109,618] [added: 111,433] | |
| Total assets | | $ | [removed: 881,120] [added: 1,062,564] | | $ | [removed: 708,903] [added: 881,120] | | $ | [removed: 691,594] [added: 708,903] | | $ | [removed: 655,942] [added: 691,594] | | $ | [removed: 592,789] [added: 655,942] | |
| Total debt | | $ | [removed: 60,539] [added: 76,918] | | $ | [removed: 2,811] [added: 60,539] | | $ | [removed: 11,507] [added: 2,811] | | $ | [removed: 40,346] [added: 11,507] | | $ | [removed: 2,000] [added: 40,346] | |
| Total stockholders’ equity | | $ | [removed: 417,945] [added: 498,047] | | $ | [removed: 376,633] [added: 417,945] | | $ | [removed: 365,005] [added: 376,633] | | $ | [removed: 321,393] [added: 365,005] | | $ | [removed: 314,022] [added: 321,393] | |
| Total Comfort Systems USA, Inc. stockholders’ equity | | $ | [removed: 417,945] [added: 498,047] | | $ | [removed: 376,633] [added: 417,945] | | $ | [removed: 346,721] [added: 376,633] | | $ | [removed: 306,281] [added: 346,721] | | $ | [removed: 295,834] [added: 306,281] | |
| | (1) | | Included in operating income is a goodwill impairment charge of $1.1 million for 2017 and $0.7 million for 2014. There were no goodwill impairment charges for [removed: 2016, 2015] [added: 2018, 2016] or [removed: 2013.] [added: 2015.] |
Item 8. Financial Statements and Supplementary Data
357 rewritten, 281 added, 160 removed, 580 unchanged
| [Management’s Report on Internal Control over Financial Reporting](#ManagementsReportonInternalControloverFi) | | [removed: 40] [added: 42] |
| [Report of Independent Registered Public Accounting Firm](#ReportofIndependentRegisteredPublicAccou) | | [removed: 41] [added: 43] |
| [Report of Independent Registered Public Accounting Firm](#RegisteredPublicAccountingFirm_299282) | | [removed: 42] [added: 44] |
| [Consolidated Balance Sheets](#CONSOLIDATEDBALANCESHEETS_522126) | | [removed: 43] [added: 45] |
| [Consolidated Statements of Operations](#CONSOLIDATEDSTATEMENTSOFOPERATIONS_39514) | | [removed: 44] [added: 46] |
| [Consolidated Statements of Stockholders’ Equity](#STATEMENTSOFSTOCKHOLDERSEQUITY_511143) | | [removed: 45] [added: 47] |
| [Consolidated Statements of Cash Flows](#STATEMENTSOFCASHFLOWS_915327) | | [removed: 46] [added: 48] |
| [Notes to Consolidated Financial Statements](#NOTESTOCONSOLIDATEDFINANCIALSTATEMENTS_6) | | [removed: 47] [added: 49] |
Under the supervision and with the participation of our management, including our Chief Executive Officer and Chief Financial Officer, we conducted an evaluation of the effectiveness of our internal control over financial reporting as of December 31, [removed: 2017] [added: 2018] based on the framework in Internal Control—Integrated Framework issued by the Committee of Sponsoring Organizations of the Treadway Commission (COSO 2013 framework).
Based on that evaluation, our management concluded that our internal control over financial reporting was effective as of December 31, [removed: 2017.][added: 2018.]
Ernst & Young LLP, an independent registered public accounting firm, as stated in their report which is included elsewhere herein, has issued an attestation report auditing the effectiveness of our internal control over financial reporting as of December 31, [removed: 2017.][added: 2018.]
We have audited the accompanying consolidated balance sheets of Comfort Systems USA, Inc. (the Company) as of December 31, [removed: 2017] [added: 2018] and [removed: 2016,] [added: 2017,] the related consolidated statements of operations, stockholders’ equity and cash flows for each of the three years in the period ended December 31, [removed: 2017,] [added: 2018,] and the related notes (collectively referred to as the “consolidated financial statements”).
In our opinion, the consolidated financial statements present fairly, in all material respects, the financial position of the Company at December 31, [removed: 2017] [added: 2018] and [removed: 2016,] [added: 2017,] and the results of its operations and its cash flows for each of the three years in the period ended December 31, [removed: 2017,] [added: 2018,] in conformity with U.S. generally accepted accounting principles.
We also have audited, in accordance with the standards of the Public Company Accounting Oversight Board (United States) (PCAOB), the Company's internal control over financial reporting as of December 31, [removed: 2017,] [added: 2018,] based on criteria established in Internal Control-Integrated Framework issued by the Committee of Sponsoring Organizations of the Treadway Commission (2013 framework), and our report dated February [removed: 22, 2018] [added: 21, 2019] expressed an unqualified opinion thereon.
We have audited Comfort Systems USA, Inc.’s internal control over financial reporting as of December 31, [removed: 2017,] [added: 2018,] based on criteria established in Internal Control—Integrated Framework issued by the Committee of Sponsoring Organizations of the Treadway Commission (2013 [removed: framework)] [added: framework),] (the COSO criteria).
In our opinion, Comfort Systems USA, Inc. (the Company) maintained, in all material respects, effective internal control over financial reporting as of December 31, [removed: 2017,] [added: 2018,] based on the COSO criteria.
We also have audited, in accordance with the standards of the Public Company Accounting Oversight Board (United States) (PCAOB), the consolidated balance sheets of the Company as of December 31, [removed: 2017] [added: 2018] and [removed: 2016,] [added: 2017,] the related consolidated statements of operations, stockholders’ equity and cash flows for each of the three years in the period ended December 31, [removed: 2017,] [added: 2018,] and the related notes and our report dated February [removed: 22, 2018] [added: 21, 2019] expressed an unqualified opinion thereon.
| | | [added: | 2018 | | |] 2017 | | | 2016 | | |
| Cash and cash equivalents | | $ | 36,542 | | $ | [removed: 32,074] [added: —] | | [added: $ | — | | $ | 36,542 |]
| [removed: Accounts] [added: Billed accounts] receivable, less allowance for doubtful accounts of [removed: $3,400] [added: $5,898] and [removed: $4,288,] [added: $3,400,] respectively | | | [removed: 382,867] [added: 481,366] | | | [removed: 318,837] [added: 382,867] | |
| Other receivables | | | [removed: 21,235] [added: 16,361] | | | [removed: 20,363] [added: 21,235] | |
| Inventories | | | [removed: 10,303] [added: 12,416] | | | [removed: 9,208] [added: 10,303] | |
| Prepaid expenses and other | | | [removed: 8,294] [added: 6,544] | | | [removed: 6,106] [added: 8,294] | |
| Costs and estimated earnings in excess of billings | | | [removed: 30,116] [added: 10,213] | | | [removed: 29,369] [added: 30,116] | |
| Total current assets | | | [removed: 489,357] [added: 609,700] | | | [removed: 415,957] [added: 489,357] | |
| PROPERTY AND EQUIPMENT, NET | | | [removed: 87,591] [added: 99,618] | | | [removed: 68,195] [added: 87,591] | |
| [removed: GOODWILL] [added: Balance at beginning of year] | | [added: $] | 200,584 | | [added: $] | 149,208 | |
| IDENTIFIABLE INTANGIBLE ASSETS, NET | | | [removed: 76,044] [added: 95,275] | | | [removed: 42,435] [added: 76,044] | |
| DEFERRED TAX ASSETS | | | [removed: 22,966] [added: 17,634] | | | [removed: 27,170] [added: 22,966] | |
| OTHER NONCURRENT ASSETS | | | [removed: 4,578] [added: 5,155] | | | [removed: 5,938] [added: 4,578] | |
| Total assets | | $ | [removed: 881,120] [added: 1,062,564] | | $ | [removed: 708,903] [added: 881,120] | |
| Current maturities of long-term debt | | $ | [removed: 613] [added: 3,279] | | $ | [removed: 600] [added: 613] | |
| Accounts payable | | | [removed: 132,011] [added: 176,167] | | | [removed: 103,440] [added: 132,011] | |
| Accrued compensation and benefits | | | [removed: 69,217] [added: 87,388] | | | [removed: 61,712] [added: 69,217] | |
| Billings in excess of costs and estimated earnings | | | [removed: 106,005] [added: 130,986] | | | [removed: 83,985] [added: 106,005] | |
| Accrued self-insurance | | | [removed: 32,228] [added: 36,386] | | | [removed: 33,520] [added: 32,228] | |
| Other current liabilities | | | [removed: 33,654] [added: 32,852] | | | [removed: 34,261] [added: 33,654] | |
| Total current liabilities | | | [removed: 373,728] [added: 467,058] | | | [removed: 317,681] [added: 373,728] | |
| LONG-TERM DEBT | | | [removed: 59,926] [added: 73,639] | | | [removed: 1,955] [added: 59,926] | |
| DEFERRED TAX LIABILITIES | | | [removed: 2,263] [added: 1,387] | | | [removed: 2,289] [added: 2,263] | |
February 21, 2019
February 21, 2019
| Unbilled accounts receivable | | | 37,180 | | | — | |
| GOODWILL | | | 235,182 | | | 200,584 | |
| INCOME PER SHARE: | | | | | | | | | | | |
| Net income | | — | | | — | | — | | | — | | | — | | | 112,903 | | | — | | | 112,903 | |
| Issuance of shares for options exercised | | — | | | — | | 206,875 | | | 3,618 | | | (513) | | | — | | | — | | | 3,105 | |
| Issuance of restricted stock & performance stock | | — | | | — | | 129,569 | | | 2,227 | | | (4) | | | — | | | — | | | 2,223 | |
| Dividends | | — | | | — | | — | | | — | | | — | | | (12,268) | | | — | | | (12,268) | |
| Share repurchase | | — | | | — | | (592,839) | | | (28,533) | | | — | | | — | | | — | | | (28,533) | |
| BALANCE AT DECEMBER 31, 2018 | | 41,123,365 | | $ | 411 | | (4,229,653) | | $ | (87,747) | | $ | 316,479 | | $ | 268,904 | | $ | — | | $ | 498,047 | |
The terms “Comfort Systems,” “we,” “us,” or “the Company,” refer to Comfort Systems USA, Inc. or Comfort Systems USA, Inc. and its consolidated subsidiaries, as appropriate in the context.
In May 2014, the FASB issued Accounting Standards Update (“ASU”) No. 2014-09, “Revenue from Contracts with Customers (Topic 606).” Topic 606 supersedes the revenue recognition requirements in “Revenue Recognition (Topic 605)” and requires entities to recognize revenue when control of the promised goods or services is transferred to customers at an amount that reflects the consideration to which the entity expects to be entitled in exchange for those goods or services.
We adopted Topic 606 as of January 1, 2018.
In accordance with Topic 606, we applied the modified retrospective method to those contracts which were not completed as of January 1, 2018.
Under the modified retrospective method, the cumulative effect of applying the standard is recognized at the date of initial application.
Results for reporting periods beginning after January 1, 2018 are presented under Topic 606, while prior period amounts are not adjusted and continue to be reported in accordance with our historic accounting under Topic 605.
In implementing Topic 606, we were required to recalculate the revenue earned on any work in process at the implementation date and to restate the revenue and cost of services as if Topic 606 had been followed from the inception of the contract.
In recalculating costs and revenue under Topic 606 guidelines, we identified no material difference in the account balances.
Since a material difference was not found, no retrospective analysis of account balance changes was required.
The standard requires substantially all leases (with the exception of leases with a term of one year or less) to be recorded on the balance sheet using a method referred to as the right-of-use asset approach.
We plan to use a transition method allowed by ASU No. 2018-11, “Leases (Topic 842) Targeted Improvements” in which lessees apply the new lease standard on the adoption date and recognize a cumulative-effect adjustment to the opening balance of retained earnings in the period of adoption.
We do not expect the adoption of ASU 2016-02 to have a significant impact to our Statement of Operations or Cash Flows.
Our Balance Sheet will be impacted from this standard by recording right-of-use assets and lease liabilities, which we currently expect to be less than $75 million.
In August 2018, the FASB issued ASU No. 2018-13, “Fair Value Measurement (Topic 820): Disclosure Framework — Changes to the Disclosure Requirements for Fair Value Measurement”.
This standard removes certain disclosure requirements including the valuation processes for Level 3 fair value measurements, the policy for timing of transfers between levels and the amount of and reasons for transfers between Level 1 and Level 2 of the fair value hierarchy.
The standard requires certain additional disclosures for public entities, including disclosure of the changes in unrealized gains and losses included in Other Comprehensive Income for Level 3 fair value measurements and the range and weighted average of significant unobservable inputs used to develop Level 3 fair value measurements.
Certain amendments, including the amendment on changes in unrealized gains and losses and the range and weighted average of significant unobservable inputs, should be applied prospectively while other amendments should be applied retrospectively to all periods presented upon their effective date.
Revenue is recognized when control of the promised goods or services is transferred to our customers in an amount that reflects the consideration to which we expect to be entitled in exchange for those goods or services.
Sales-based taxes are excluded from revenue.
We provide comprehensive mechanical contracting services, which principally includes HVAC, plumbing, piping and controls, as well as off‑site construction, electrical, monitoring and fire protection.
We install, maintain, repair and replace products and systems throughout the United States.
All of our revenue is recognized over time as we deliver goods and services to our customers.
Revenue can be earned based on an agreed upon fixed price or based on actual costs incurred, marked up at an agreed upon percentage.
For fixed price agreements, we use the percentage of completion method of accounting under which contract revenue recognizable at any time during the life of a contract is determined by multiplying expected total contract
Subcontractor labor is recognized as the work is performed.
We account for a contract when: (i) it has approval and commitment from both parties, (ii) the rights of the parties are identified, (iii) payment terms are identified, (iv) the contract has commercial substance, and (v) collectability of consideration is probable.
We consider the start of a project to be when the above criteria have been met and we either have written authorization from the customer to proceed or an executed contract.
Selling, marketing and estimation costs incurred in relation to selling contracts are expensed as incurred.
On rare occasions, we may incur significant expenses related to selling a contract that we only incurred because we sold that contract.
February 22, 2018
| --- | --- | --- | --- | --- | --- | --- | --- |
| Current maturities of long-term capital lease obligations | | | — | | | 163 | |
| LONG-TERM CAPITAL LEASE OBLIGATIONS | | | — | | | 93 | |
| Less: Net income attributable to noncontrolling interests | | | | — | | | — | | | 8,076 | |
| NET INCOME ATTRIBUTABLE TO COMFORT SYSTEMS USA, INC. | | | $ | 55,272 | | $ | 64,896 | | $ | 49,364 | |
| INCOME PER SHARE ATTRIBUTABLE TO COMFORT SYSTEMS USA, INC.: | | | | | | | | | | | |
| BALANCE AT DECEMBER 31, 2014 | | 41,123,365 | | $ | 411 | | (3,853,586) | | $ | (43,598) | | $ | 320,084 | | $ | 29,384 | | $ | 15,112 | | $ | 321,393 | |
| Net income | | — | | | — | | — | | | — | | | — | | | 49,364 | | | 8,076 | | | 57,440 | |
| Issuance of shares for options exercised including tax benefit | | — | | | — | | 317,333 | | | 3,728 | | | 966 | | | — | | | — | | | 4,694 | |
| Issuance of restricted stock & performance stock | | — | | | — | | 200,015 | | | 2,292 | | | (626) | | | — | | | — | | | 1,666 | |
| Tax benefit from vesting of restricted stock | | — | | | — | | — | | | — | | | 284 | | | — | | | — | | | 284 | |
| Dividends | | — | | | — | | — | | | — | | | — | | | (9,358) | | | — | | | (9,358) | |
| Distribution to noncontrolling interest | | — | | | — | | — | | | — | | | — | | | — | | | (4,904) | | | (4,904) | |
| Share repurchase | | — | | | — | | (315,953) | | | (8,330) | | | — | | | — | | | — | | | (8,330) | |
| Excess tax benefit of stock-based compensation | | | — | | | — | | | 1,240 | |
| Distributions to noncontrolling interests | | | — | | | — | | | (4,904) | |
| | | | | | | |
| --- | --- | --- | --- | --- | --- | --- |
| Service Activity | | $ in thousands | | | % | |
| Other | | | 78,413 | | 5 | % |
| Total | | $ | 1,787,922 | | 100 | % |
In 2015, two operating locations came to an agreement with customers on multiple jobs and received approved change orders, which resulted in the recognition of additional revenue with minimal additional costs resulting in a project gain of $3.4 million, on a pre-tax basis.
In May 2014, the Financial Accounting Standards Board (“FASB”) issued Accounting Standards Update (“ASU”) No. 2014-09, “Revenue from Contracts with Customers (Topic 606).” ASU 2014-09 provides a framework that replaces the existing revenue recognition guidance.
The guidance can be applied on a full retrospective or modified retrospective basis whereby the entity records a cumulative effect of initially applying this update on the adoption date.
We plan to use the modified retrospective basis on the adoption date.
ASU 2014-09 is effective for annual periods beginning after December 15, 2017, including interim periods within that reporting period.
We believe the areas that may impact us the most include accounting for variable consideration, capitalization of incremental costs of obtaining a contract and the guidance on the number of performance obligations contained in a contract.
We currently expect the adoption of ASU 2014-09 to have an impact of less than $0.5 million on our consolidated financial statements.
The standard requires lessees to recognize assets and liabilities for most leases.
Early adoption is permitted.
ASU 2016-02’s transition provisions are applied using a modified retrospective approach at the beginning of the earliest comparative period presented in the financial statements.
In January 2017, the FASB issued ASU No. 2017-04, “Intangibles – Goodwill and other (Topic 350): Simplifying the Accounting for Goodwill Impairment”.
This standard removes Step 2 of the goodwill impairment test, which required a hypothetical purchase price allocation.
Additionally, entities will be required to disclose the amount of goodwill at reporting units with zero or negative carrying amounts.
Early adoption is permitted for interim and annual goodwill impairment tests performed on testing dates after January 1, 2017.
We early adopted ASU 2017-04 in the first quarter of 2017, which did not have a material impact on our consolidated financial statements.
Approximately 81% of our revenue was earned on a project basis and recognized through the percentage of completion method of accounting.
These contract costs are included in our results of operations under the caption
Subcontractor labor is recognized as the work is performed, but is generally subjected to approval as to milestones or other evidence of completion.
An excerpt. Shown here: 40 of 357 rewritten, 40 of 281 added and 40 of 160 removed. The counts are complete. For every sentence, read Item 8. Financial Statements and Supplementary Data in the FY2018 filing and the FY2017 filing.
Item 9A. Controls and Procedures
1 rewritten, 0 added, 0 removed, 8 unchanged
There have not been any changes in our internal control over financial reporting (as such term is defined in Rules 13a‑15(f) and 15d‑15(f) under the Securities Exchange Act of 1934) during the three months ended December 31, [removed: 2017] [added: 2018] that has materially affected, or [removed: is] [added: are] reasonably likely to materially affect, internal control over financial reporting.
Item 10. Directors, Executive Officers and Corporate Governance
2 rewritten, 0 added, 0 removed, 8 unchanged
The Company will file with the Commission a definitive proxy statement including the other information to be disclosed under this item in the 120 days following December 31, [removed: 2017] [added: 2018] and such information is hereby incorporated by reference.
The Company will file with the Commission a definitive proxy statement including the information to be disclosed under the items in the 120 days following December 31, [removed: 2017] [added: 2018] and such information is hereby incorporated by reference.
Item 16. Form 10-K Summary
18 rewritten, 13 added, 3 removed, 110 unchanged
| 3.5 | | [Amended and Restated Bylaws of Comfort Systems USA, Inc.](http://www.sec.gov/Archives/edgar/data/1035983/000110465916107645/a16-7178_1ex3d1.htm) | | 3.1 | | March [removed: 25 ,2016] [added: 25, 2016] Form 8-K |
| 21.1 | | [List of subsidiaries of Comfort Systems USA, [removed: Inc.](https://www.sec.gov/Archives/edgar/data/1035983/000155837018000936/fix-20171231ex2115095d1.htm)] [added: Inc.](https://www.sec.gov/Archives/edgar/data/1035983/000155837019000857/fix-20181231ex21148f217.htm)] | | | | Filed Herewith |
| 23.1 | | [Consent of Ernst & Young [removed: LLP](https://www.sec.gov/Archives/edgar/data/1035983/000155837018000936/fix-20171231ex231a06d65.htm)] [added: LLP](https://www.sec.gov/Archives/edgar/data/1035983/000155837019000857/fix-20181231ex231dd55f6.htm)] | | | | Filed Herewith |
| 31.1 | | [Certification of Chief Executive Officer pursuant to Section 302 of the Sarbanes‑Oxley Act of [removed: 2002](https://www.sec.gov/Archives/edgar/data/1035983/000155837018000936/fix-20171231ex311d1856a.htm)] [added: 2002](https://www.sec.gov/Archives/edgar/data/1035983/000155837019000857/fix-20181231ex3119d724a.htm)] | | | | Filed Herewith |
| 31.2 | | [Certification of Chief Financial Officer pursuant to Section 302 of the Sarbanes‑Oxley Act of [removed: 2002](https://www.sec.gov/Archives/edgar/data/1035983/000155837018000936/fix-20171231ex3121700d8.htm)] [added: 2002](https://www.sec.gov/Archives/edgar/data/1035983/000155837019000857/fix-20181231ex3126a46b5.htm)] | | | | Filed Herewith |
| 32.1 | | [Certification of Chief Executive Officer pursuant to Section 906 of the Sarbanes‑Oxley Act of [removed: 2002](https://www.sec.gov/Archives/edgar/data/1035983/000155837018000936/fix-20171231ex32131a616.htm)] [added: 2002](https://www.sec.gov/Archives/edgar/data/1035983/000155837019000857/fix-20181231ex3217efb4a.htm)] | | | | Furnished Herewith |
| 32.2 | | [Certification of Chief Financial Officer pursuant to Section 906 of the Sarbanes‑Oxley Act of [removed: 2002](https://www.sec.gov/Archives/edgar/data/1035983/000155837018000936/fix-20171231ex322fd6bac.htm)] [added: 2002](https://www.sec.gov/Archives/edgar/data/1035983/000155837019000857/fix-20181231ex3224de954.htm)] | | | | Furnished Herewith |
| Date: February [removed: 22, 2018] [added: 21, 2019] | | |
| /s/ Brian E. Lane | | President, Chief Executive Officer, and | | February [removed: 22, 2018] [added: 21, 2019] | |
| /s/ William George | | Executive Vice President and Chief Financial | | February [removed: 22, 2018] [added: 21, 2019] | |
| /s/ Julie S. Shaeff | | Senior Vice President and Chief Accounting | | February [removed: 22, 2018] [added: 21, 2019] | |
| /s/ Franklin Myers | | Chairman of the Board | | February [removed: 22, 2018] [added: 21, 2019] | |
| /s/ Darcy G. Anderson | | Director | | February [removed: 22, 2018] [added: 21, 2019] | |
| /s/ Herman E. Bulls | | Director | | February [removed: 22, 2018] [added: 21, 2019] | |
| /s/ Alan P. Krusi | | Director | | February [removed: 22, 2018] [added: 21, 2019] | |
| /s/ James H. Schultz | | Director | | February [removed: 22, 2018] [added: 21, 2019] | |
| /s/ Constance E. Skidmore | | Director | | February [removed: 22, 2018] [added: 21, 2019] | |
| /s/ Vance W. Tang | | Director | | February [removed: 22, 2018] [added: 21, 2019] | |
None.
| *10.52 | | [Form of Restricted Stock Unit Agreement under the Company’s 2017 Omnibus Incentive Plan](http://www.sec.gov/Archives/edgar/data/1035983/000155837018003336/fix-20180331ex101c8a191.htm) | | 10.1 | | First Quarter 2018 Form 10-Q |
| *10.53 | | [Form of Stock Option Notice under the Company’s 2017 Omnibus Incentive Plan](http://www.sec.gov/Archives/edgar/data/1035983/000155837018003336/fix-20180331ex102ce3cf4.htm) | | 10.2 | | First Quarter 2018 Form 10-Q |
| *10.54 | | [Form of Dollar-denominated Performance Restricted Stock Unit Agreement under the Company’s 2017 Omnibus Incentive Plan](http://www.sec.gov/Archives/edgar/data/1035983/000155837018003336/fix-20180331ex10323834b.htm) | | 10.3 | | First Quarter 2018 Form 10-Q |
| 10.55 | | [Amendment No. 5 to Second Amended and Restated Credit Agreement and Amendment to Other Loan Documents](http://www.sec.gov/Archives/edgar/data/1035983/000155837018005771/fix-20180630ex1010b4b06.htm) | | 10.1 | | Second Quarter 2018 Form 10-Q |
| | | | | Incorporated by Reference to the Exhibit Indicated Below and to the Filing with the Commission Indicated Below | | |
| --- | --- | --- | --- | --- | --- | --- |
| Exhibit Number | | Description of Exhibits | | Exhibit Number | | Filing or File Number |
| /s/ Pablo G. Mercado | | Director | | February 21, 2019 | |
| Pablo G. Mercado | | | | | |
| /s/ William J. Sandbrook | | Director | | February 21, 2019 | |
| William J. Sandbrook | | | | | |
| | | | | | |
The Company has determined not to include a summary of the information required by the Form 10-K under this Item 16 of the Form 10-K.
| /s/ Alfred J. Giardinelli, Jr. | | Director | | February 22, 2018 | |
| Alfred J. Giardinelli, Jr. | | | | | |