 filings.tools
Comfort Systems USA (FIX) 10-K risk factor changes: FY2017 vs FY2016
The 2017-12-31 10-K against the 2016-12-31 one, compared heading by heading and sentence by sentence. One of these filings carries no fiscal year tag, so its year is the calendar year of the period end.
Item 1A9 rewritten10 added3 removed262 unchanged
All filing items669 rewritten306 added278 removed1,563 unchanged
Summary
counted, not written
- Item 1A headings could not be compared: only 0 carried over between the two years, which usually means one filing was read wrongly, so none is reported as new or removed.
- Sentence by sentence, 306 added, 278 removed, 669 rewritten and 1,563 unchanged across 13 items that differ.
Sentences by item
19 items, with every count and a link to each item that changed
Underlined words on a shaded ground are new in FY2017; struck-through words were in FY2016. Sentences that are wholly new or wholly gone are labelled rather than marked.
Item 1A. Risk Factors
9 rewritten, 10 added, 3 removed, 262 unchanged
We cannot assure that we will be able to locate acquisitions or that we will be able to consummate transactions on terms and conditions acceptable to us, or that [removed: acquired businesses will be profitable.]
Our credit agreement and related restrictive and financial covenants are more fully described in Note [removed: 9] [added: 8] of “Notes to the Consolidated Financial Statements.” Our failure to comply with any of these covenants, or to pay principal, interest or other amounts when due thereunder, would constitute an event of default under the credit agreement.
Any system of controls, however well designed and operated, is based in part on certain assumptions and can provide only reasonable, and not absolute, assurances that the [added: objectives of the system are met.]
Our [removed: 91] [added: 115] locations are located in 27 states, which exposes us to a variety of different state and local laws and regulations, particularly those pertaining to contractor licensing requirements.
[removed: Changes in any of these laws, or any of our subsidiaries’ material failure to comply with them,] can adversely impact our operations by, among other things, increasing costs, distracting management’s time and attention from other items, and harming our reputation.
| | · | | [removed: weather related] [added: weather-related] damage to our facilities; |
Because of the continued uncertainty about the implementation of the Affordable Care Act, including the potential for further legal challenges or repeal of that legislation, [removed: we cannot quantify or predict with any certainty] [added: it is unclear what] the [removed: likely] impact of the Affordable Care Act or its [added: potential] repeal [added: will have] on our financial position or results of operations.
Our effective tax rates could be affected by many factors, some of which are outside of our control, including changes in tax laws and regulations in the various tax jurisdictions in which we file income [removed: taxes, issues relating to tax audits or examinations and any related interest or penalties, and uncertainty in obtaining deductions or credits claimed in various jurisdictions.][added: taxes.]
Our results of operations [removed: is] [added: are] reported based on our determination of the amount of taxes we owe in various tax jurisdictions.
acquired businesses will be profitable.
Changes in any of these laws, or any of our subsidiaries’ material failure to comply with them,
Future
legislation could also have an impact on our business.
For example, Government officials have made statements that suggest the current White House administration supports the repeal of all or portions of the Affordable Care Act, and Congress has introduced, and may introduce and pass in the future, new legislation to repeal or replace portions of the Affordable Care Act.
Tax matters, including changes in corporate tax rates and disagreements with taxing authorities, could impact our results of operations and financial condition.
For instance, the Tax Cuts and Jobs Act was enacted into law in December 2017.
While certain portions of the law may have a positive impact on the Company’s results of operations, the overall impact of the new federal tax law is uncertain and our business and financial condition could be adversely affected.
It is also unknown if and to what extent various states will conform to the newly enacted federal tax law.
Issues relating to tax audits or examinations and any related interest or penalties and uncertainty in obtaining deductions or credits claimed in various jurisdictions could also impact our effective tax rates.
objectives of the system are met.
It is possible that following the inauguration of President Trump on January 20, 2017, legislation will be introduced and passed by the Republican-controlled Congress repealing the Affordable Care Act in whole or in part and signed into law by President Trump, consistent with statements made by him during his presidential campaign indicating his intention to do so within a short time following his inauguration.
Our effective tax rate may increase.
Item 7. Management’s Discussion and Analysis of Financial Condition and Results of Operations
124 rewritten, 71 added, 73 removed, 327 unchanged
Approximately [removed: 82%] [added: 81%] of our revenue is earned on a project basis for installation of mechanical systems in newly constructed facilities or for replacement of systems in existing facilities.
As of December 31, [removed: 2016,] [added: 2017,] we had [removed: 3,830] [added: 4,690] projects in process.
Our average project takes six to nine months to complete, with an average contract price of approximately [removed: $516,000.][added: $504,000.]
Our projects generally require working capital [removed: funding of equipment and labor costs.]
Because of the integral nature of HVAC and related controls systems to most buildings, we have the legal right in almost all cases to attach liens to buildings or related funding sources when we have [added: not been fully paid for installing systems, except with respect to some government buildings.]
Taken together, projects with contract prices of $1 million or more totaled [removed: $1,552.1 million] [added: $1.83 billion] of aggregate contract value as of December 31, [removed: 2016,] [added: 2017,] or approximately 80%, out of a total contract value for all projects in progress of [removed: $1,975.0 million.][added: $2.36 billion.]
A stratification of projects in progress as of December 31, [removed: 2016,] [added: 2017,] by contract price, is as follows:
| $5 million - $10 million | | [removed: 59] [added: 70] | | | [removed: 397.4] [added: 464.7] | |
| $10 million - $15 million | | [removed: 19] [added: 18] | | | [removed: 235.9] [added: 221.3] | |
| Greater than $15 million | | [removed: 9] [added: 13] | | | [removed: 174.4] [added: 319.6] | |
In addition to project work, approximately [removed: 18%] [added: 19%] of our revenue represents maintenance and repair service on already installed HVAC and controls systems.
We manage our [removed: 35] [added: 36] operating units based on a variety of factors.
[added: While we do not have operations in all major cities of the] United States, we believe our national presence is sufficiently large that we experience trends in demand for and pricing of our services that are consistent with trends in the national nonresidential construction sector.
Nonresidential building construction and renovation activity, as reported by the federal government, declined steeply over the [removed: four year] [added: four-year] period from 2009 to 2012, and 2013 and 2014 activity levels were relatively stable at the low levels of the preceding years.
During [added: the three-year period from] 2015 [removed: and 2016,] [added: to 2017,] there was an increase in overall activity levels and we currently expect that activity will continue at these improved levels during [removed: 2017.][added: 2018.]
As a result of our continued strong emphasis on cash flow, at December 31, [removed: 2016] [added: 2017] we had [removed: no] [added: modest] indebtedness under our revolving credit facility, with positive uncommitted cash balances, as discussed further in “Liquidity and Capital Resources” below.
We have generated positive free cash flow in each of the last [removed: eighteen] [added: nineteen] calendar years and will continue our emphasis in this area.
We will continue [removed: our efforts] to invest in our service business, to pursue the more active sectors in our markets, and to emphasize our regional and national account business.
Our primary emphasis for [removed: 2017] [added: 2018] will be on execution and cost control, but we are seeking growth based on our belief that industry conditions will continue to be strong in [removed: 2017,] [added: the near term,] and we believe that activity levels will permit us to [added: continue to] earn [removed: improved] [added: solid] profits while preserving and developing our workforce.
Approximately [removed: 82%] [added: 81%] of our revenue was earned on a project basis and recognized through the percentage of completion method of accounting during [removed: 2016.][added: 2017.]
[removed: Under this method, contract revenue recognizable at any time during the] life of a contract is determined by multiplying expected total contract revenue by the percentage of contract costs incurred at any time to total estimated contract costs.
[added: These contract costs are included in our results of operations under] the caption “Cost of Services.” Then, as we perform under those contracts, we measure costs incurred, compare them to total estimated costs to complete the contract, and recognize a corresponding proportion of contract revenue.
The amount of revenue associated with unapproved change orders and claims was immaterial for the year ended December 31, [removed: 2016.][added: 2017.]
[added: Loss estimates associated with the larger and] longer‑developing risks—workers’ compensation, auto liability and general liability—are reviewed by a third party actuary quarterly.
In assessing the realizability of deferred tax assets, we must consider whether it is [removed: more likely than not that] [added: more-likely-than-not] some portion, or all, of the deferred tax assets will not be realized.
The market multiples from invested capital include revenue, book equity plus debt and earnings before interest, [added: provision for income] taxes, depreciation and amortization (“EBITDA”).
| | | [removed: 2016] [added: 2017] | | | | | [removed: 2015] [added: 2016] | | | | | [removed: 2014] [added: 2015] | | | | |
| Revenue | | $ | [removed: 1,634,340] [added: 1,787,922] | | 100.0 | % | $ | [removed: 1,580,519] [added: 1,634,340] | | 100.0 | % | $ | [removed: 1,410,795] [added: 1,580,519] | | 100.0 | % |
| Cost of services | | | [removed: 1,290,331] [added: 1,421,641] | | [removed: 79.0] [added: 79.5] | % | | [removed: 1,262,390] [added: 1,290,331] | | [removed: 79.9] [added: 79.0] | % | | [removed: 1,161,024] [added: 1,262,390] | | [removed: 82.3] [added: 79.9] | % |
| Gross profit | | | [removed: 344,009] [added: 366,281] | | [removed: 21.0] [added: 20.5] | % | | [removed: 318,129] [added: 344,009] | | [removed: 20.1] [added: 21.0] | % | | [removed: 249,771] [added: 318,129] | | [removed: 17.7] [added: 20.1] | % |
| Selling, general and administrative expenses | | | [removed: 243,201] [added: 266,586] | | 14.9 | % | | [removed: 228,965] [added: 243,201] | | [removed: 14.5] [added: 14.9] | % | | [removed: 207,652] [added: 228,965] | | [removed: 14.7] [added: 14.5] | % |
| Goodwill impairment | | | [removed: —] [added: 1,105] | | [removed: —] [added: 0.1] | [added: %] | | — | | — | | | [removed: 727] [added: —] | | [removed: 0.1] [added: —] | [removed: %] |
| Gain on sale of assets | | | [removed: (761)] [added: (670)] | | — | | | [removed: (880)] [added: (761)] | | [removed: (0.1)] [added: —] | [removed: %] | | [removed: (830)] [added: (880)] | | (0.1) | % |
| Operating income | | | [removed: 101,569] [added: 99,260] | | [removed: 6.2] [added: 5.6] | % | | [removed: 90,044] [added: 101,569] | | [removed: 5.7] [added: 6.2] | % | | [removed: 42,222] [added: 90,044] | | [removed: 3.0] [added: 5.7] | % |
| Interest income | | | [removed: 9] [added: 70] | | — | | | [removed: 72] [added: 9] | | — | | | [removed: 18] [added: 72] | | — | |
| Interest expense | | | [removed: (2,345)] [added: (3,156)] | | [removed: (0.1)] [added: (0.2)] | % | | [removed: (1,753)] [added: (2,345)] | | (0.1) | % | | [removed: (1,858)] [added: (1,753)] | | (0.1) | % |
| Changes in the fair value of contingent earn-out obligations | | | [removed: 731] [added: 3,715] | | [removed: —] [added: 0.2] | [added: %] | | [removed: 225] [added: 731] | | — | | | [removed: (245)] [added: 225] | | — | |
| Other [added: income (expense)] | | | [removed: 1,097] [added: 1,049] | | 0.1 | % | | [removed: 76] [added: 1,097] | | [removed: —] [added: 0.1] | [added: %] | | [removed: 91] [added: 76] | | — | |
| Income before income taxes | | | [removed: 101,061] [added: 100,938] | | [removed: 6.2] [added: 5.6] | % | | [removed: 88,664] [added: 101,061] | | [removed: 5.6] [added: 6.2] | % | | [removed: 40,228] [added: 88,664] | | [removed: 2.9] [added: 5.6] | % |
| Net income including noncontrolling interests | | | [removed: 64,896] [added: 55,272] | | [removed: 4.0] [added: 3.1] | % | | [removed: 57,440] [added: 64,896] | | [removed: 3.6] [added: 4.0] | % | | [removed: 28,599] [added: 57,440] | | [removed: 2.0] [added: 3.6] | % |
funding of equipment and labor costs.
| Under $1 million | | 4,221 | | $ | 529.8 | |
| $1 million - $5 million | | 368 | | | 828.6 | |
| Total | | 4,690 | | $ | 2,364.0 | |
Under this method, contract revenue recognizable at any time during the
| Provision for income taxes | | | 45,666 | | | | | 36,165 | | | | | 31,224 | | | |
2017 Compared to 2016
During 2017, we completed one acquisition in the second quarter of 2017, known as “BCH”, that reports as a separate operating location in the Tampa, Florida area.
Other than the addition of BCH, we did not make any changes to operating locations.
The
Revenue—Revenue increased $153.6 million, or 9.4% to $1.79 billion in 2017 compared to 2016.
The increase included a 6.4% increase related to the acquisitions of BCH and Shoffner and a 3.0% increase in revenue related to same‑store activity.
The same‑store revenue increase was primarily due to one of our Virginia operations ($24.1 million) and our Wisconsin operation ($22.9 million), which experienced increased large project work compared to the prior year, specifically in the industrial sector.
Backlog as of December 31, 2017 was $948.4 million, a 5.2% increase from September 30, 2017 backlog of $901.2 million and a 24.2% increase from December 31, 2016 backlog of $763.4 million.
The year‑over‑year backlog increase included the acquisition of BCH ($30.0 million or 3.9%).
Same-store backlog increased 20.3% primarily due to increased project bookings at our North Carolina operation ($63.3 million), one of our Virginia operations ($39.0 million) and our Colorado operation ($37.3 million).
Gross Profit—Gross profit increased $22.3 million, or 6.5%, to $366.3 million in 2017 as compared to 2016.
The increase included a $18.3 million, or 5.3%, increase related to the acquisitions of BCH and Shoffner and a $4.0 million, or 1.2%, increase on a same‑store basis.
The same‑store increase in gross profit was primarily due to increased volumes at our Wisconsin operation ($6.9 million) and our New Hampshire operation ($3.7 million).
This was partially offset by a decrease at our North Carolina operation ($6.4 million), which has experienced lower project activity when compared to the same period in 2016.
As a percentage of revenue, gross profit decreased from 21.0% in 2016 to 20.5% in 2017 primarily due to a $3.6 million increase in amortization expense, primarily related to the BCH acquisition, as well as the factors discussed above.
This increase is primarily due to $0.8 million in compensation costs related to leadership changes and the increase in same-store revenue.
Additionally, we incurred $0.4 million in expenses in the first quarter of 2017 related to the acquisition of BCH completed on April 1, 2017.
Amortization expense increased $5.6 million during the period primarily as a result of the BCH acquisition.
As a percentage of revenue, SG&A was 14.9% in both 2017 and 2016.
However, same‑store SG&A, excluding amortization, is not considered under
| | | 2017 | | | 2016 | | |
| SG&A | | $ | 266,586 | | $ | 243,201 | |
| Same-store SG&A, excluding amortization expense | | $ | 244,334 | | $ | 237,036 | |
Interest Expense—Interest expense increased $0.8 million, or 34.6%, in 2017.
The increase reflects the increased borrowings on the revolving credit facility as well as notes to former owners used to fund the BCH acquisition during the second quarter of 2017.
This increase was the result of reducing our obligation related to the BCH acquisition primarily due to results being below the initial estimate as a result of the impact of Hurricane Irma and less project activity than previously estimated.
Other Income—Other income remained relatively flat in 2017 compared to 2016.
In the fourth quarter of 2017, we entered into settlement agreements with British Petroleum (“BP”) related to two claims from one of our subsidiaries regarding the April 2010 BP Deepwater Horizon oil spill.
We recorded a $1.0 million gain in the fourth quarter of 2017 in “Other Income” as a result of these settlements.
Additionally, in the fourth quarter of 2016, we entered into a separate settlement agreement with BP related to a claim from another one of our subsidiaries and recorded a $0.6 million gain in the fourth quarter of 2016 in “Other Income”.
The effective rate for 2017 was higher than the 35% federal statutory rate primarily due to the remeasurement of net deferred tax assets for the corporate tax rate reduction to 21% (9.4%), net state income taxes (2.8%) partially offset by the domestic production activities deduction (2.1%) and deductions for stock-based compensation (1.3%).
The increase in the effective tax rate from 2016 to 2017 was primarily due to the impact from the remeasurement of net deferred tax assets for the corporate tax rate reduction to 21% pursuant to the recently enacted Tax Cuts and Jobs Act.
While we believe we were able to make reasonable estimates of the impact of the Tax Cuts and Jobs Act in these financial statements, the amounts recorded are provisional and the final impact may differ from these estimates due to, among other things, changes in our interpretations and assumptions and additional guidance that may be issued by regulatory authorities.
This includes the impact of a decrease in unrecognized tax benefits of up to $8.7 million that is expected within the next twelve months due to the
not been fully paid for installing systems, except with respect to some government buildings.
| Under $1 million | | 3,415 | | $ | 422.9 | |
| $1 million - $5 million | | 328 | | | 744.4 | |
| Total | | 3,830 | | $ | 1,975.0 | |
While we do not have operations in all major cities of the
These contract costs are included in our results of operations under
Loss estimates associated with the larger and
| Income tax expense | | | 36,165 | | | | | 31,224 | | | | | 11,614 | | | |
| Income from continuing operations | | | 64,896 | | 4.0 | % | | 57,440 | | 3.6 | % | | 28,614 | | 2.0 | % |
| Loss from discontinued operations, net of tax | | | — | | | | | — | | | | | (15) | | | |
An operating location is excluded from the same‑store comparison in the current year and comparable prior years when it is properly characterized as a discontinued operation under applicable accounting standards.
We generally expect our tax rate in 2017 to be higher than 2016 due to the benefits to the 2016 rate from deductions on stock compensation and the valuation allowance.
2015 Compared to 2014
During 2015, we completed two acquisitions in the first quarter, one in the third quarter and one in the fourth quarter.
These acquisitions were not material and were “tucked‑in” with existing operations.
In addition, we merged two operating locations during the first quarter and closed one operating location during the third quarter.
Revenue—Revenue increased $169.7 million, or 12.0% to $1,580.5 million in 2015 compared to 2014.
The increase included a 10.6% increase in revenue related to same‑store activity and a 1.4% increase related to the acquisition of our Northern Texas operation.
The same‑store revenue increase was primarily due to our Environmental Air Systems, LLC (“EAS”) operation ($61.3 million), our Arizona operation ($17.7 million), our large operation headquartered in Virginia ($12.2 million) and one of our Maryland operations ($12.1 million).
These operations, as well as many of our other operating locations, experienced increased project work compared to the prior year in multiple markets, but primarily the industrials sector due to improved market conditions.
Backlog as of December 31, 2015 was $711.6 million, a 6.8% increase from September 30, 2015 backlog of $666.3 million and a 6.1% decrease from December 31, 2014 backlog of $757.8 million.
The year‑over‑year backlog decrease was primarily due to our EAS operation ($22.2 million), which had unusually large jobs booked in the fourth quarter of 2014, and due to completion of project work during the year at our California operation ($19.7 million) and our Arkansas operation ($17.9 million).
This was partially offset by increased project bookings at our Michigan operation ($16.8 million).
Gross Profit—Gross profit increased $68.4 million, or 27.4%, to $318.1 million in 2015 as compared to 2014.
The increase included a $3.4 million, or 1.3%, increase related to the acquisition of our Northern Texas operation and a $65.0 million, or 26.1%, increase on a same‑store basis.
The same‑store increase in gross profit was due to overall increased margins at a majority of operating locations.
Specifically, increases were due to job underperformance at our Southern California operation in 2014 ($9.0 million), improved project execution at our large operation headquartered in Virginia ($7.0 million), and improved market conditions, which resulted in an increase in volumes at our EAS operation ($5.8 million).
In addition, in the fourth quarter of 2015, we came to an agreement with customers on multiple jobs and received approved change orders, which resulted in additional revenue with minimal additional costs.
The resulting impact to the current year was an increase to gross profit of approximately $3.4 million.
As a percentage of revenue, gross profit increased from 17.7% in 2014 to 20.1% in 2015 primarily due to the factors discussed above.
This increase was primarily due to increased compensation accruals based on operating results ($13.3 million) and expanded service activities at certain locations ($4.8 million).
As a percentage of revenue, SG&A decreased from 14.7% in 2014 to 14.5% in 2015, primarily due to the higher revenue base caused by the increase in market activity in 2015.
| | | 2015 | | | 2014 | | |
| SG&A | | $ | 228,965 | | $ | 207,652 | |
| Same-store SG&A, excluding amortization expense | | $ | 220,225 | | $ | 200,827 | |
Interest Expense—Interest expense decreased $0.1 million, or 5.7%, in 2015.
The decrease was due to lower net borrowings on the revolving credit facility in 2015.
Goodwill Impairment—No goodwill impairment was recorded in 2015.
We recorded a goodwill impairment charge of $0.7 million during the second quarter of 2014.
Based on market activity declines and write‑downs incurred on several jobs, we determined that the operating environment, conditions and performance at our operating unit based in Southern California could no longer support the related goodwill balance.
An excerpt. Shown here: 40 of 124 rewritten, 40 of 71 added and 40 of 73 removed. The counts are complete. For every sentence, read Item 7. Management’s Discussion and Analysis of Financial Condition and Results of Operations in the FY2017 filing and the FY2016 filing.
Item 7A. Quantitative and Qualitative Disclosures about Market Risk
7 rewritten, 2 added, 1 removed, 14 unchanged
The following table presents principal amounts (stated in thousands) and related average interest rates by year of maturity for our debt obligations and their indicated fair market value at December 31, [removed: 2016:][added: 2017:]
| | | [removed: 2017 | | |] 2018 | | | 2019 | | | 2020 | | | 2021 | | | [added: 2022 | | |] Thereafter | | | Total | | |
| Average Interest Rate | | | [removed: 2.5%] [added: 3.0%] | | | 3.0% | | | 3.0% | | | [removed: —] [added: 3.0%] | | | — | | | — | | | [removed: 2.9%] [added: 3.0%] | |
| Variable Rate Debt | | $ | 100 | | $ | [removed: 100] [added: 114] | | $ | [removed: 105] [added: —] | | $ | [removed: —] [added: 45,000] | | $ | — | | $ | — | | $ | [removed: 305] [added: 45,214] | |
The interest rate applicable to the variable rate debt was approximately [removed: 3.02%] [added: 3.8%] as of December 31, [removed: 2016.][added: 2017.]
[removed: We estimate that the] [added: The] weighted average interest rate applicable to the borrowings under the Facility [removed: would be] [added: was] approximately [removed: 1.8%] [added: 2.8%] as of December 31, [removed: 2016.][added: 2017.]
We did not recognize any [added: other] impairments, in the current year, on those assets required to be measured at fair value on a nonrecurring basis.
| Fixed Rate Debt | | $ | 513 | | $ | 512 | | $ | 7,150 | | $ | 7,150 | | $ | — | | $ | — | | $ | 15,325 | |
During the year ended December 31, 2017, we recorded a goodwill impairment charge of $1.1 million based on Level 3 measurements.
| Fixed Rate Debt | | $ | 500 | | $ | 875 | | $ | 875 | | $ | — | | $ | — | | $ | — | | $ | 2,250 | |
Item 1. Business
48 rewritten, 16 added, 13 removed, 152 unchanged
We install, maintain, repair and replace products and systems throughout our [removed: 35] [added: 36] operating units [added: with 115 locations] in [removed: 84] [added: 102] cities [removed: and 91 locations] throughout the United States.
Approximately 99% of our consolidated [removed: 2016] [added: 2017] revenue was derived from commercial, industrial and institutional customers and multi‑family residential projects.
Approximately [removed: 40%] [added: 38%] of our revenue was attributable to installation services in newly constructed facilities and [removed: 60%] [added: 62%] was attributable to renovation, expansion, maintenance, repair and replacement services in existing buildings.
Our consolidated [removed: 2016] [added: 2017] revenue was derived from the following service activities, substantially all of which are in the mechanical services industry, the single industry segment we serve:
| Building Automation Control Systems | | [removed: 6] [added: 5] | % |
| Other | | [removed: 4] [added: 5] | % |
Our Internet address is [removed: http://www.comfortsystemsusa.com.][added: www.comfortsystemsusa.com.]
| | · | | construction of and installation in new buildings, which provided approximately [removed: 40%] [added: 38%] of our revenue in [removed: 2016,] [added: 2017,] and |
| | · | | renovation, expansion, maintenance, repair and replacement in existing buildings, which provided the remaining [removed: 60%] [added: 62%] of our [removed: 2016] [added: 2017] revenue. |
[removed: These companies] [added: build” projects] use a consultative approach with customers and tend to develop long‑term relationships with building owners and developers, general contractors, architects, consulting engineers and property managers.
“Plan and spec” installation refers to projects in which a third‑party architect or consulting engineer designs the HVAC systems and the installation project is “put out for bid.” We believe that “plan and spec” projects usually take longer to complete than “design and build” projects because the system design and installation process [removed: generally] are not integrated, thus resulting in more frequent adjustments to [removed: the technical specifications of the] project [removed: and corresponding changes in] [added: specifications,] work requirements and schedules.
The key objectives of our strategy are to generate growth in our operations, improve the productivity of our workforce and to acquire [removed: complementing] [added: complementary] businesses.
[added: We continually invest in training, including programs for] project managers, field superintendents, service managers, service technicians, sales managers, estimators, and leadership and development of key managers and leaders.
Focus on Commercial, Industrial and Institutional Markets—We [removed: primarily] focus on the commercial, industrial and institutional [added: building] markets, including construction, maintenance, repair and replacement services.
Approximately 99% of our consolidated [removed: 2016] [added: 2017] revenue was derived from commercial, industrial and institutional customers and large multi‑family residential projects.
For example, we have shifted certain fabrication activities [removed: into] [added: to] centralized locations in order to increase asset utilization.
[removed: We also have] significant geographical diversification across all regions of the United States, again reducing our exposure to negative developments in any given region.
Our distribution of revenue in [removed: 2016] [added: 2017] by end‑use sector was as follows:
| Education | | [removed: 19] [added: 20] | % |
| Office Buildings | | [removed: 12] [added: 14] | % |
| Healthcare | | [removed: 12] [added: 13] | % |
| Government | | [removed: 10] [added: 8] | % |
| Retail and Restaurants | | [removed: 7] [added: 8] | % |
| Multi-Family | | [removed: 7] [added: 6] | % |
| Other | | [removed: 2] [added: 1] | % |
Approximately [removed: 82%] [added: 81%] of our revenue is earned on a project basis for installation of systems in newly constructed or existing facilities.
As of December 31, [removed: 2016,] [added: 2017,] we had [removed: 3,830] [added: 4,690] projects in process with an aggregate contract value of approximately [removed: $1,975.0 million.][added: $2.36 billion.]
Our average project takes six to nine months to complete, with an average contract price of approximately [removed: $516,000.][added: $504,000.]
This average project size, when taken together with the approximately [removed: 18%] [added: 19%] of our revenue derived from maintenance and service, provides us with a broad base of work in the construction services sector.
A stratification of projects in progress as of December 31, [removed: 2016,] [added: 2017,] by contract price, is as follows:
| $5 million - $10 million | | [removed: 59] [added: 70] | | | [removed: 397.4] [added: 464.7] | |
| $10 million - $15 million | | [removed: 19] [added: 18] | | | [removed: 235.9] [added: 221.3] | |
| Greater than $15 million | | [removed: 9] [added: 13] | | | [removed: 174.4] [added: 319.6] | |
[removed: Five] [added: Over the last several] years [removed: ago,] we [removed: began making] [added: have made] substantial incremental investments to expand our service and maintenance revenue by increasing the value we can offer to service and maintenance customers.
In many locations we have added or upgraded our capability, and we believe [added: our investments and efforts have provided a compelling customer value offering that stimulates growth in all aspects of our businesses.]
We have centralized certain administrative functions such as insurance, employee benefits, training, safety programs, marketing and cash management to enable our [removed: local operating management to focus on pursuing new business opportunities and improving operating efficiencies.]
Construction and Installation Services for New Buildings—Our installation business related to newly constructed facilities, which comprised approximately [removed: 40%] [added: 38%] of our consolidated [removed: 2016] [added: 2017] revenue, involves the design, engineering, integration, installation and start‑up of mechanical and related systems.
We also perform larger project work, with [removed: 415] [added: 469] contracts in progress at December 31, [removed: 2016] [added: 2017] with contract prices in excess of $1 million.
Our largest project in progress at December 31, [removed: 2016] [added: 2017] had a contract price of [removed: $26.2] [added: $46.4] million.
Renovation, Expansion, Maintenance, Repair and Replacement Services for Existing Buildings—Our renovation, expansion, maintenance, repair and replacement services in existing buildings comprised approximately [removed: 60%] [added: 62%] of our consolidated [removed: 2016] [added: 2017] revenue and include the maintenance, repair, replacement, renovation, expansion, reconfiguration and monitoring of mechanical systems including HVAC systems and industrial process piping.
| HVAC and Plumbing | | 90 | % |
Companies that specialize in “design and
We are also increasing our national and local focus on skills training for our hourly workers.
We also have
| Industrial | | 22 | % |
| Under $1 million | | 4,221 | | $ | 529.8 | |
| $1 million - $5 million | | 368 | | | 828.6 | |
| Total | | 4,690 | | $ | 2,364.0 | |
local operating management to focus on pursuing new business opportunities and improving operating efficiencies.
Our average project takes six to nine months to complete, with an average contract price of approximately $504,000.
repair of equipment containing these refrigerants and also regulate the containment and recycling of these refrigerants.
Additional Information
You may read and copy any materials filed with the Securities and Exchange Commission at the Securities and Exchange Commission’s Public Reference Room at 100 F Street, NE, Washington, DC 20549.
You may obtain information on the operation of the Public Reference Room by calling the Securities and Exchange Commission at 1-800-SEC-0330.
This information is also available at www.sec.gov.
The reference to these website addresses does not constitute incorporation by reference of the information contained on the websites and should not be considered part of this document.
| HVAC | | 75 | % |
| Plumbing | | 15 | % |
Companies that specialize in “design and build” projects generally have specially trained HVAC engineers, CAD/CAM design systems and in‑house prefabrication capabilities.
Furthermore, in “plan and spec” projects, the contracting company is not responsible for project design and other parties must also approve any changes, which increases overall project time and cost.
Increasingly, mechanical systems in commercial, industrial and institutional buildings are being remotely monitored to improve energy efficiency and expedite problem diagnosis and correction, which can allow us to provide maintenance and repair services at a lower cost.
We have increased our already substantial investments in training, including programs for
| Industrial and Distribution | | 23 | % |
| Under $1 million | | 3,415 | | $ | 422.9 | |
| $1 million - $5 million | | 328 | | | 744.4 | |
| Total | | 3,830 | | $ | 1,975.0 | |
our investments and efforts have provided a compelling customer value offering that stimulates growth in all aspects of our businesses.
Renovation, expansion, replacement and reconfiguration services are typically performed on a project basis and frequently use consultative expertise similar to that provided in the “design and build” installation market.
as on‑the‑job training, technical training, apprenticeship programs, attractive benefit packages and career advancement opportunities within our company.
An excerpt. Shown here: 40 of 48 rewritten, all 16 added and all 13 removed. The counts are complete. For every sentence, read Item 1. Business in the FY2017 filing and the FY2016 filing.
Cover and table of contents
16 rewritten, 4 added, 4 removed, 70 unchanged
| For the Fiscal Year Ended December 31, [removed: 2016] [added: 2017] | |
Indicate by check mark whether the registrant is a large accelerated filer, an accelerated filer, a [removed: non‑accelerated] [added: non-accelerated] filer, [removed: or] a smaller reporting [added: company, or an emerging growth] company.
See [added: the] definitions of “large accelerated filer,” “accelerated [removed: filer” and] [added: filer,”] “smaller reporting company,” [added: and “emerging growth company”] in Rule [removed: 12b‑2] [added: 12b-2] of the Exchange Act.
| Large accelerated filer ☒ | Accelerated filer ☐ | Non‑accelerated filer ☐ (Do not check if a smaller reporting company) | Smaller reporting company ☐ | [added: Emerging growth company ☐ |]
The aggregate market value of the voting stock held by non‑affiliates of the registrant at June 30, [removed: 2016] [added: 2017] was approximately [removed: $1.19] [added: $1.35] billion, based on the [removed: $32.57] [added: $37.10] last sale price of the registrant’s common stock on the New York Stock Exchange on June 30, [removed: 2016.][added: 2017.]
As of February [removed: 16, 2017, 37,209,114] [added: 15, 2018, 37,175,074] shares of the registrant’s common stock were outstanding (excluding treasury shares of [removed: 3,914,251).][added: 3,948,291).]
The information required by Part III (other than the required information regarding executive officers) is incorporated by reference from the registrant’s definitive proxy statement, which will be filed with the Commission not later than 120 days following December 31, [removed: 2016.][added: 2017.]
| [Item 2.](#ITEM2Properties_592424) | [Properties](#ITEM2Properties_592424) | [removed: 19] [added: 18] |
| [Item 7.](#ITEM7ManagementsDiscussionandAnalysisofF) | [Management’s Discussion and Analysis of Financial Condition and Results of Operations](#ITEM7ManagementsDiscussionandAnalysisofF) | [removed: 22] [added: 23] |
| [Item 9.](#ITEM9ChangesinandDisagreementswithAccoun) | [Changes in and Disagreements with Accountants on Accounting and Financial Disclosure](#ITEM9ChangesinandDisagreementswithAccoun) | [removed: 71] [added: 70] |
| [Item 9A.](#ITEM9AControlsandProcedures_403685) | [Controls and Procedures](#ITEM9AControlsandProcedures_403685) | [removed: 71] [added: 70] |
| [Item 11.](#ITEMS111213AND14_316091) | [Executive Compensation](#ITEMS111213AND14_316091) | [removed: 72] [added: 71] |
| [Item 12.](#ITEMS111213AND14_316091) | [Security Ownership of Certain Beneficial Owners and Management and Related Stockholder Matters](#ITEMS111213AND14_316091) | [removed: 72] [added: 71] |
| [Item 13.](#ITEMS111213AND14_316091) | [Certain Relationships and Related Transactions, and Director Independence](#ITEMS111213AND14_316091) | [removed: 72] [added: 71] |
| [Item 14.](#ITEMS111213AND14_316091) | [Principal Accounting Fees and Services](#ITEMS111213AND14_316091) | [removed: 72] [added: 71] |
| [Item 15.](#ITEM15ExhibitsandFinancialStatementSched) | [Exhibits and Financial Statement Schedules](#ITEM15ExhibitsandFinancialStatementSched) | [removed: 72] [added: 71] |
10-K 1 fix-20171231x10k.htm 10-K
| | | | | |
| --- | --- | --- | --- | --- |
If an emerging growth company, indicate by check mark if the registrant has elected not to use the extended transition period for complying with any new or revised financial accounting standards provided pursuant to Section 13(a) of the Exchange Act.
10-K 1 fix-20161231x10k.htm 10-K
| | | | |
| --- | --- | --- | --- |
(Check one):
Item 2. Properties
2 rewritten, 1 added, 0 removed, 9 unchanged
As of December 31, [removed: 2016,] [added: 2017,] we owned [removed: four] [added: five] properties.
To the extent we renew, enter into leases or otherwise change leases with current or former employees, we enter into such [removed: agreements on terms that reflect a fair market valuation for the properties.]
agreements on terms that reflect a fair market valuation for the properties.
Item 4A. Executive Officers of the Registrant
4 rewritten, 0 added, 0 removed, 18 unchanged
Brian Lane, age [removed: 59,] [added: 60,] has served as our Chief Executive Officer and President since December 2011 and as a director since November 2010.
William George, age [removed: 52,] [added: 53,] has served as our Executive Vice President and Chief Financial Officer since May 2005, was our Senior Vice President, General Counsel and Secretary from May 1998 to May 2005, and was our Vice President, General Counsel and Secretary from March 1997 to April 1998.
Shaeff, age [removed: 51,] [added: 52,] has served as our Senior Vice President and Chief Accounting Officer since May 2005, was our Vice President and Corporate Controller from March 2002 to May 2005, and was our Assistant Corporate Controller from September 1999 to February 2002.
McKenna, age [removed: 44,] [added: 45,] has served as our Senior Vice President, General Counsel and Secretary since August 2013, was our Vice President, General Counsel and Secretary from May 2005 to August 2013, and was our Associate General Counsel from August 2004 to May 2005.
Item 5. Market for Registrant’s Common Equity, Related Stockholder Matters and Issuer Purchases of Equity Securities
8 rewritten, 19 added, 24 removed, 26 unchanged
As of February [removed: 16, 2017] [added: 15, 2018] there were approximately [removed: 263] [added: 364] stockholders of record of our Common Stock, and the last reported sale price on that date was [removed: $34.05] [added: $41.45] per share.
Subsequently, the Board has from time to time [added: increased the number of shares that may be acquired under the program and] approved extensions of the [removed: program to acquire additional shares.][added: program.]
As of December 31, [removed: 2016,] [added: 2017,] we have repurchased a cumulative total of [removed: 7.3] [added: 7.6] million shares at an average price of [removed: $13.02] [added: $13.75] per share under the repurchase program.
[removed: During the twelve] months ended December 31, [removed: 2016,] [added: 2017,] we repurchased [removed: 0.5] [added: 0.3] million shares for approximately [removed: $13.1] [added: $9.0] million at an average price of [removed: $28.44] [added: $34.23] per share.
During the year ended December 31, [removed: 2016,] [added: 2017,] we purchased our common shares in the following amounts at the following weighted‑average prices:
| Period | | Shares Purchased | | Paid Per Share | | | or Programs [added: (1)] | | or Programs | |
| [removed: November] [added: January] 1 - [removed: November 30] [added: January 31] | | [removed: 20,006] [added: —] | | $ | [removed: 28.38] [added: —] | | 7,342,491 | | 770,002 | |
| [removed: December] [added: February] 1 - [removed: December 31] [added: February 28] | | — | | $ | — | | 7,342,491 | | 770,002 | |
| Fourth Quarter, 2017 | | $ | 44.65 | | $ | 35.70 | | $ | 0.075 | |
| Third Quarter, 2017 | | $ | 37.15 | | $ | 32.55 | | $ | 0.075 | |
| Second Quarter, 2017 | | $ | 37.10 | | $ | 34.30 | | $ | 0.075 | |
| First Quarter, 2017 | | $ | 38.65 | | $ | 32.30 | | $ | 0.070 | |
During the twelve
| March 1 - March 31 | | 61,412 | | $ | 35.78 | | 7,403,903 | | 708,590 | |
| April 1 - April 30 | | 500 | | $ | 34.73 | | 7,404,403 | | 708,090 | |
| May 1 - May 31 | | 45,381 | | $ | 35.28 | | 7,449,784 | | 662,709 | |
| June 1 - June 30 | | — | | $ | — | | 7,449,784 | | 662,709 | |
| July 1 - July 31 | | — | | $ | — | | 7,449,784 | | 662,709 | |
| August 1 - August 31 | | 143,667 | | $ | 33.18 | | 7,593,451 | | 519,042 | |
| September 1 - September 30 | | 9,737 | | $ | 33.56 | | 7,603,188 | | 509,305 | |
| October 1 - October 31 | | — | | $ | — | | 7,603,188 | | 509,305 | |
| November 1 - November 30 | | 2,400 | | $ | 40.58 | | 7,605,588 | | 506,905 | |
| December 1 - December 31 | | — | | $ | — | | 7,605,588 | | 506,905 | |
| | | 263,097 | | $ | 34.23 | | 7,605,588 | | 506,905 | |
| | (1) | | Purchased as part of a program announced on March 29, 2007 under which, since the inception of this program, 8.1 million shares have been approved for repurchase. |
| --- | --- | --- | --- |
| Fourth Quarter, 2015 | | $ | 33.71 | | $ | 27.47 | | $ | 0.065 | |
| Third Quarter, 2015 | | $ | 30.12 | | $ | 22.98 | | $ | 0.065 | |
| Second Quarter, 2015 | | $ | 23.90 | | $ | 20.11 | | $ | 0.060 | |
| First Quarter, 2015 | | $ | 21.18 | | $ | 15.87 | | $ | 0.060 | |
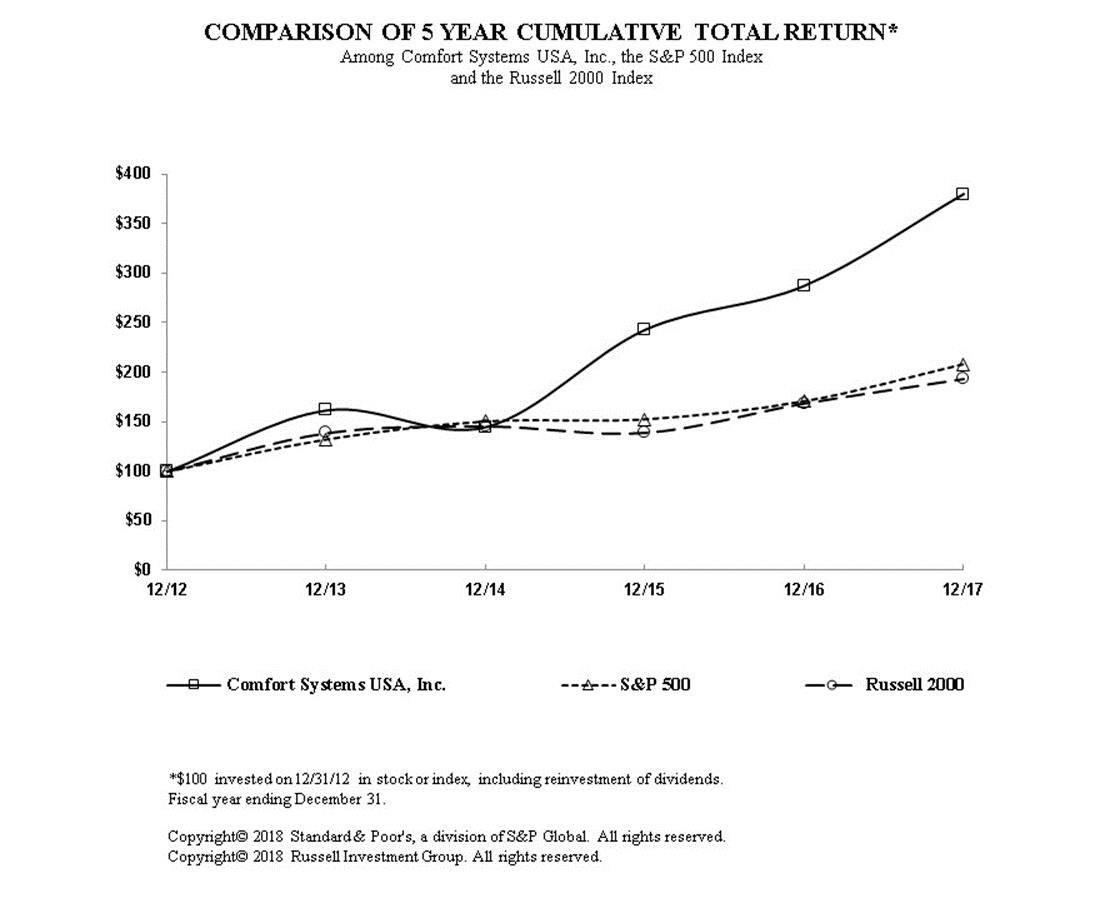
COMPARISON OF 5 YEAR CUMULATIVE TOTAL RETURN*
Among Comfort Systems USA, Inc., the S&P 500 Index, and the Russell 2000 Index

*$100 invested on 12/31/11 in stock or index, including reinvestment of dividends.
Fiscal year ending December 31.
Copyright© 2017 S&P, a division of McGraw Hill Financial.
All rights reserved.
Copyright© 2017 Russell Investment Group.
On August 11, 2016, the Board approved an extension to the program by increasing the shares authorized for repurchase by 0.6 million shares.
| January 1 - January 31 | | 102,029 | | $ | 27.84 | | 6,984,350 | | 576,833 | |
| February 1 - February 29 | | — | | $ | — | | 6,984,350 | | 576,833 | |
| March 1 - March 31 | | — | | $ | — | | 6,984,350 | | 576,833 | |
| April 1 - April 30 | | — | | $ | — | | 6,984,350 | | 576,833 | |
| May 1 - May 31 | | 66,185 | | $ | 30.51 | | 7,050,535 | | 510,648 | |
| June 1 - June 30 | | 2,094 | | $ | 30.85 | | 7,052,629 | | 508,554 | |
| July 1 - July 31 | | 3,000 | | $ | 30.92 | | 7,055,629 | | 505,554 | |
| August 1 - August 31 | | 133,364 | | $ | 29.03 | | 7,188,993 | | 923,500 | |
| September 1 - September 30 | | 77,614 | | $ | 26.92 | | 7,266,607 | | 845,886 | |
| October 1 - October 31 | | 55,878 | | $ | 27.62 | | 7,322,485 | | 790,008 | |
| | | 460,170 | | $ | 28.44 | | 7,342,491 | | 770,002 | |
Item 6. Selected Financial Data
19 rewritten, 1 added, 0 removed, 11 unchanged
| | | [added: 2017 | | |] 2016 | | | 2015 | | | 2014 | | | 2013 | | | [removed: 2012 | | |]
| Revenue | | $ | [removed: 1,634,340] [added: 1,787,922] | | $ | [removed: 1,580,519] [added: 1,634,340] | | $ | [removed: 1,410,795] [added: 1,580,519] | | $ | [removed: 1,357,272] [added: 1,410,795] | | $ | [removed: 1,331,185] [added: 1,357,272] | |
| Operating income [removed: (a)] [added: (1)] | | $ | [removed: 101,569] [added: 99,260] | | $ | [removed: 90,044] [added: 101,569] | | $ | [removed: 42,222] [added: 90,044] | | $ | [removed: 46,258] [added: 42,222] | | $ | [removed: 22,303] [added: 46,258] | |
| Income from continuing operations | | $ | [removed: 64,896] [added: 55,272] | | $ | [removed: 57,440] [added: 64,896] | | $ | [removed: 28,614] [added: 57,440] | | $ | [removed: 28,632] [added: 28,614] | | $ | [removed: 11,494] [added: 28,632] | |
| Income (loss) from discontinued operations, net of tax | | $ | — | | $ | — | | $ | [removed: (15)] [added: —] | | $ | [removed: (76)] [added: (15)] | | $ | [removed: 355] [added: (76)] | |
| Net income including noncontrolling interests | | $ | [removed: 64,896] [added: 55,272] | | $ | [removed: 57,440] [added: 64,896] | | $ | [removed: 28,599] [added: 57,440] | | $ | [removed: 28,556] [added: 28,599] | | $ | [removed: 11,849] [added: 28,556] | |
| Net income attributable to Comfort Systems USA, Inc. | | $ | [removed: 64,896] [added: 55,272] | | $ | [removed: 49,364] [added: 64,896] | | $ | [removed: 23,063] [added: 49,364] | | $ | [removed: 27,269] [added: 23,063] | | $ | [removed: 13,463] [added: 27,269] | |
| Income from continuing operations | | $ | [removed: 1.74] [added: 1.48] | | $ | [removed: 1.32] [added: 1.74] | | $ | [removed: 0.61] [added: 1.32] | | $ | [removed: 0.73] [added: 0.61] | | $ | [removed: 0.35] [added: 0.73] | |
| Income (loss) from discontinued operations | | | — | | | — | | | — | | | — | | | [removed: 0.01] [added: —] | |
| Net income | | $ | [removed: 1.74] [added: 1.48] | | $ | [removed: 1.32] [added: 1.74] | | $ | [removed: 0.61] [added: 1.32] | | $ | [removed: 0.73] [added: 0.61] | | $ | [removed: 0.36] [added: 0.73] | |
| Income from continuing operations | | $ | [removed: 1.72] [added: 1.47] | | $ | [removed: 1.30] [added: 1.72] | | $ | [removed: 0.61] [added: 1.30] | | $ | [removed: 0.73] [added: 0.61] | | $ | [removed: 0.35] [added: 0.73] | |
| Net income | | $ | [removed: 1.72] [added: 1.47] | | $ | [removed: 1.30] [added: 1.72] | | $ | [removed: 0.61] [added: 1.30] | | $ | [removed: 0.73] [added: 0.61] | | $ | [removed: 0.36] [added: 0.73] | |
| Cash dividends per share | | $ | [removed: 0.275] [added: 0.295] | | $ | [removed: 0.250] [added: 0.275] | | $ | [removed: 0.225] [added: 0.250] | | $ | [removed: 0.210] [added: 0.225] | | $ | [removed: 0.200] [added: 0.210] | |
| Working capital | | $ | [removed: 98,276] [added: 115,629] | | $ | [removed: 118,882] [added: 98,276] | | $ | [removed: 111,433] [added: 118,882] | | $ | [removed: 109,618] [added: 111,433] | | $ | [removed: 84,349] [added: 109,618] | |
| Total assets | | $ | [removed: 708,903] [added: 881,120] | | $ | [removed: 691,594] [added: 708,903] | | $ | [removed: 655,942] [added: 691,594] | | $ | [removed: 592,789] [added: 655,942] | | $ | [removed: 573,461] [added: 592,789] | |
| Total debt | | $ | [removed: 2,811] [added: 60,539] | | $ | [removed: 11,507] [added: 2,811] | | $ | [removed: 40,346] [added: 11,507] | | $ | [removed: 2,000] [added: 40,346] | | $ | [removed: 7,400] [added: 2,000] | |
| Total stockholders’ equity | | $ | [removed: 376,633] [added: 417,945] | | $ | [removed: 365,005] [added: 376,633] | | $ | [removed: 321,393] [added: 365,005] | | $ | [removed: 314,022] [added: 321,393] | | $ | [removed: 287,306] [added: 314,022] | |
| Total Comfort Systems USA, Inc. stockholders’ equity | | $ | [removed: 376,633] [added: 417,945] | | $ | [removed: 346,721] [added: 376,633] | | $ | [removed: 306,281] [added: 346,721] | | $ | [removed: 295,834] [added: 306,281] | | $ | [removed: 270,405] [added: 295,834] | |
| | [removed: (a)] [added: (1)] | | Included in operating income is a goodwill impairment charge of [added: $1.1 million for 2017 and] $0.7 million for 2014. There were no goodwill impairment charges for 2016, [removed: 2015, 2013] [added: 2015] or [removed: 2012.] [added: 2013.] |
| Income (loss) from discontinued operations | | | — | | | — | | | — | | | — | | | — | |
Item 8. Financial Statements and Supplementary Data
362 rewritten, 174 added, 159 removed, 583 unchanged
| [Report of Independent Registered Public Accounting [removed: Firm](#ACCOUNTINGFIRM_173307)] [added: Firm](#RegisteredPublicAccountingFirm_299282)] | | 42 |
Under the supervision and with the participation of our management, including our Chief Executive Officer and Chief Financial Officer, we conducted an evaluation of the effectiveness of our internal control over financial reporting as of December 31, [removed: 2016] [added: 2017] based on the framework in Internal Control—Integrated Framework issued by the Committee of Sponsoring Organizations of the Treadway Commission (COSO 2013 framework).
Based on that evaluation, our management concluded that our internal control over financial reporting was effective as of December 31, [removed: 2016.][added: 2017.]
Ernst & Young LLP, an independent registered public accounting firm, as stated in their report which is included elsewhere herein, has issued an attestation report auditing the effectiveness of our internal control over financial reporting as of December 31, [removed: 2016.][added: 2017.]
[added: To the Stockholders and the] Board of Directors [removed: and Stockholders] of Comfort Systems USA, Inc.
We have audited the accompanying consolidated balance sheets of Comfort Systems USA, Inc. [added: (the Company)] as of December 31, [removed: 2016 and 2015,] [added: 2017] and [added: 2016,] the related consolidated statements of operations, stockholders’ equity and cash flows for each of the three years in the period ended December 31, [removed: 2016.][added: 2017, and the related notes (collectively referred to as the “consolidated financial statements”).]
Our responsibility is to express an opinion on [removed: these] [added: the Company’s] financial statements based on our audits.
We conducted our audits in accordance with the standards of the [removed: Public Company Accounting Oversight Board (United States).][added: PCAOB.]
Those standards require that we plan and perform the audit to obtain reasonable assurance about whether the financial statements are free of material [removed: misstatement.][added: misstatement, whether due to error or fraud.]
[removed: An audit includes] [added: Such procedures included] examining, on a test basis, evidence [removed: supporting] [added: regarding] the amounts and disclosures in the financial statements.
[removed: An audit] [added: Our audits] also [removed: includes assessing] [added: included evaluating] the accounting principles used and significant estimates made by management, as well as evaluating the overall [added: presentation of the] financial [removed: statement presentation.][added: statements.]
In our opinion, the [added: consolidated] financial statements [removed: referred to above] present fairly, in all material respects, the [removed: consolidated] financial position of [removed: Comfort Systems USA, Inc.] [added: the Company] at December 31, [removed: 2016] [added: 2017] and [removed: 2015,] [added: 2016,] and the [removed: consolidated] results of its operations and its cash flows for each of the three years in the period ended December 31, [removed: 2016,] [added: 2017,] in conformity with U.S. generally accepted accounting principles.
We also have audited, in accordance with the standards of the Public Company Accounting Oversight Board (United [removed: States), Comfort Systems USA, Inc.’s] [added: States) (PCAOB), the Company's] internal control over financial reporting as of December 31, [removed: 2016,] [added: 2017,] based on criteria established in Internal [removed: Control—Integrated] [added: Control-Integrated] Framework issued by the Committee of Sponsoring Organizations of the Treadway Commission (2013 [removed: framework)] [added: framework),] and our report dated February [removed: 23, 2017] [added: 22, 2018] expressed an unqualified opinion thereon.
[removed: | |] /s/ [removed: ERNST] [added: Ernst] & [removed: YOUNG] [added: Young] LLP [removed: |]
[added: To the Stockholders and the] Board of Directors [removed: and Stockholders][added: of Comfort Systems USA, Inc.]
[removed: Comfort Systems] [added: | NET INCOME ATTRIBUTABLE TO COMFORT SYSTEMS] USA, [removed: Inc.][added: INC. | | | $ | 55,272 | | $ | 64,896 | | $ | 49,364 | |]
We have audited Comfort Systems USA, Inc.’s internal control over financial reporting as of December 31, [removed: 2016,] [added: 2017,] based on criteria established in Internal Control—Integrated Framework issued by the Committee of Sponsoring Organizations of the Treadway Commission (2013 framework) (the COSO criteria).
[removed: Comfort Systems USA, Inc.’s] [added: The Company’s] management is responsible for maintaining effective internal control over financial [removed: reporting,] [added: reporting] and for its assessment of the effectiveness of internal control over financial reporting included in the accompanying Management’s Report on Internal Control over Financial Reporting.
We conducted our audit in accordance with the standards of the [removed: Public Company Accounting Oversight Board (United States).][added: PCAOB.]
In our opinion, Comfort Systems USA, Inc. [added: (the Company)] maintained, in all material respects, effective internal control over financial reporting as of December 31, [removed: 2016,] [added: 2017,] based on the COSO criteria.
We also have audited, in accordance with the standards of the Public Company Accounting Oversight Board (United [removed: States),] [added: States) (PCAOB),] the consolidated balance sheets of [removed: Comfort Systems USA, Inc.] [added: the Company] as of December 31, [removed: 2016 and 2015,] [added: 2017] and [added: 2016,] the related consolidated statements of operations, stockholders’ equity and cash flows for each of the three years in the period ended December 31, [removed: 2016 of Comfort Systems USA, Inc.] [added: 2017,] and [added: the related notes and] our report dated February [removed: 23, 2017] [added: 22, 2018] expressed an unqualified opinion thereon.
| | | [added: | 2017 | | |] 2016 | | | 2015 | | |
| Cash and cash equivalents | | $ | 32,074 | | $ | [removed: 56,464] [added: 32,074] | | [added: $ | — | | $ | — |]
| Accounts receivable, less allowance for doubtful accounts of [removed: $4,288] [added: $3,400] and [removed: $5,158,] [added: $4,288,] respectively | | | [removed: 318,837] [added: 382,867] | | | [removed: 302,052] [added: 318,837] | |
| Other receivables | | | [removed: 20,363] [added: 21,235] | | | [removed: 20,642] [added: 20,363] | |
| Inventories | | | [removed: 9,208] [added: 10,303] | | | [removed: 7,941] [added: 9,208] | |
| Prepaid expenses and other | | | [removed: 6,106] [added: 8,294] | | | [removed: 5,836] [added: 6,106] | |
| Costs and estimated earnings in excess of billings | | | [removed: 29,369] [added: 30,116] | | | [removed: 31,338] [added: 29,369] | |
| Total current assets | | | [removed: 415,957] [added: 489,357] | | | [removed: 424,273] [added: 415,957] | |
| PROPERTY AND EQUIPMENT, NET | | | [removed: 68,195] [added: 87,591] | | | [removed: 60,813] [added: 68,195] | |
| [removed: GOODWILL] [added: Balance at beginning of year] | | [added: $] | 149,208 | | [added: $] | 143,874 | |
| IDENTIFIABLE INTANGIBLE ASSETS, NET | | | [removed: 42,435] [added: 76,044] | | | [removed: 41,079] [added: 42,435] | |
| DEFERRED [removed: INCOME] TAX ASSETS | | | [removed: 27,170] [added: 22,966] | | | [removed: 16,276] [added: 27,170] | |
| OTHER NONCURRENT ASSETS | | | [removed: 5,938] [added: 4,578] | | | [removed: 5,279] [added: 5,938] | |
| Total assets | | $ | [removed: 708,903] [added: 881,120] | | $ | [removed: 691,594] [added: 708,903] | |
| Current maturities of long-term debt | | $ | [removed: 600] [added: 613] | | $ | [removed: 500] [added: 600] | |
| Current maturities of long-term capital lease obligations | | | [removed: 163] [added: —] | | | [removed: 251] [added: 163] | |
| Accounts payable | | | [removed: 103,440] [added: 132,011] | | | [removed: 106,684] [added: 103,440] | |
| Accrued compensation and benefits | | | [removed: 61,712] [added: 69,217] | | | [removed: 54,079] [added: 61,712] | |
| Billings in excess of costs and estimated earnings | | | [removed: 83,985] [added: 106,005] | | | [removed: 85,397] [added: 83,985] | |
Opinion on the Financial Statements
Basis for Opinion
We are a public accounting firm registered with the PCAOB and are required to be independent with respect to the Company in accordance with the U.S. federal securities laws and the applicable rules and regulations of the Securities and Exchange Commission and the PCAOB.
Our audits included performing procedures to assess the risks of material misstatement of the financial statements, whether due to error or fraud, and performing procedures that respond to those risks.
We have served as the Company’s auditor since 2002.
February 22, 2018
Opinion on Internal Control over Financial Reporting
Basis for Opinion
We are a public accounting firm registered with the PCAOB and are required to be independent with respect to the Company in accordance with the U.S. federal securities laws and the applicable rules and regulations of the Securities and Exchange Commission and the PCAOB.
Definition and Limitations of Internal Control Over Financial Reporting
/s/ Ernst & Young LLP
February 22, 2018
| GOODWILL | | | 200,584 | | | 149,208 | |
| PROVISION FOR INCOME TAXES | | | | 45,666 | | | 36,165 | | | 31,224 | |
| Basic | | | $ | 1.48 | | $ | 1.74 | | $ | 1.32 | |
| Diluted | | | $ | 1.47 | | $ | 1.72 | | $ | 1.30 | |
| Net income | | — | | | — | | — | | | — | | | — | | | 55,272 | | | — | | | 55,272 | |
| Issuance of shares for options exercised | | — | | | — | | 145,746 | | | 2,257 | | | (205) | | | — | | | — | | | 2,052 | |
| Issuance of restricted stock & performance stock | | — | | | — | | 134,646 | | | 2,037 | | | (421) | | | — | | | — | | | 1,616 | |
| Dividends | | — | | | — | | — | | | — | | | — | | | (10,987) | | | — | | | (10,987) | |
| Share repurchase | | — | | | — | | (263,097) | | | (9,007) | | | — | | | — | | | — | | | (9,007) | |
| BALANCE AT DECEMBER 31, 2017 | | 41,123,365 | | $ | 411 | | (3,936,291) | | $ | (63,519) | | $ | 312,784 | | $ | 168,269 | | $ | — | | $ | 417,945 | |
December 31, 2017
| HVAC and Plumbing | | $ | 1,615,468 | | 90 | % |
| Other | | | 78,413 | | 5 | % |
| Total | | $ | 1,787,922 | | 100 | % |
We currently expect the adoption of ASU 2014-09 to have an impact of less than $0.5 million on our consolidated financial statements.
| | | 2017 | | | 2016 | | |
| | | $ | (75,889) | | $ | (54,616) | |
| | | $ | (75,889) | | $ | (54,616) | |
| | | | | | | | | | | | | |
| --- | --- | --- | --- | --- | --- | --- | --- | --- | --- | --- | --- | --- |
| | | 2017 | | | Level 1 | | | Level 2 | | | Level 3 | |
| Cash and cash equivalents | | $ | 36,542 | | $ | 36,542 | | $ | — | | $ | — |
| Life insurance—cash surrender value | | $ | 3,128 | | $ | — | | $ | 3,128 | | $ | — |
| Contingent earn-out obligations | | $ | 7,993 | | $ | — | | $ | — | | $ | 7,993 |
| | | | | | | | | | | | | |
| --- | --- | --- | --- | --- | --- | --- | --- | --- | --- | --- | --- | --- |
The carrying value of our borrowings associated with the Revolving Credit Facility approximate its fair value due to the variable rate on such debt.
| | | 2017 | | | 2016 | | |
| | |
| --- | --- |
February 23, 2017
| Comfort Systems USA, Inc. stockholders’ equity | | | 376,633 | | | 346,721 | |
| | | | | | | | | | | | |
| INCOME TAX EXPENSE | | | | 36,165 | | | 31,224 | | | 11,614 | |
| INCOME FROM CONTINUING OPERATIONS | | | | 64,896 | | | 57,440 | | | 28,614 | |
| Loss from discontinued operations, net of income tax benefit of $—, $— and $10 | | | | — | | | — | | | (15) | |
| Basic— | | | | | | | | | | | |
| Income from continuing operations | | | $ | 1.74 | | $ | 1.32 | | $ | 0.61 | |
| Income from discontinued operations | | | | — | | | — | | | — | |
| Net Income | | | $ | 1.74 | | $ | 1.32 | | $ | 0.61 | |
| Diluted— | | | | | | | | | | | |
| Income from continuing operations | | | $ | 1.72 | | $ | 1.30 | | $ | 0.61 | |
| Net Income | | | $ | 1.72 | | $ | 1.30 | | $ | 0.61 | |
| BALANCE AT DECEMBER 31, 2013 | | 41,123,365 | | $ | 411 | | (3,488,438) | | $ | (37,468) | | $ | 318,123 | | $ | 14,768 | | $ | 18,188 | | $ | 314,022 | |
| Net income | | — | | | — | | — | | | — | | | — | | | 23,063 | | | 5,536 | | | 28,599 | |
| Issuance of shares for options exercised including tax benefit | | — | | | — | | 103,619 | | | 1,132 | | | 79 | | | — | | | — | | | 1,211 | |
| Issuance of restricted stock | | — | | | — | | 115,044 | | | 1,243 | | | (1,243) | | | — | | | — | | | — | |
| Tax benefit from vesting of restricted stock | | — | | | — | | — | | | — | | | 133 | | | — | | | — | | | 133 | |
| Dividends | | — | | | — | | — | | | — | | | — | | | (8,447) | | | — | | | (8,447) | |
| Distribution to noncontrolling interest | | — | | | — | | — | | | — | | | — | | | — | | | (8,612) | | | (8,612) | |
| Share repurchase | | — | | | — | | (549,154) | | | (7,974) | | | — | | | — | | | — | | | (7,974) | |
| | | | | | | | | | | |
| --- | --- | --- | --- | --- | --- | --- | --- | --- | --- | --- |
| | | Year Ended December 31, | | | | | | | | |
| HVAC | | $ | 1,225,755 | | 75 | % |
| Plumbing | | | 245,151 | | 15 | % |
| Other | | | 65,374 | | 4 | % |
| Total | | $ | 1,634,340 | | 100 | % |
In the twelve months ended December 31, 2014, one of our operating locations recorded a revision in contract estimate on a project in a loss position resulting in a writedown to this individual project of $4.4 million, on a pre-tax basis.
In April 2015, the FASB issued ASU No. 2015-03, “Simplifying the Presentation of Debt Issue Costs.” Under ASU 2015-03, an entity presents debt issue costs related to a note in the balance sheet as a direct deduction from the related debt liability rather than as an asset.
Entities would apply the new guidance retrospectively to all prior periods.
In August 2015, the FASB issued ASU No. 2015-15, “Presentation and Subsequent Measurement of Debt Issuance Costs Associated with Line-of-Credit Arrangements.” The amendment clarifies ASU 2015-03 and provides that an entity may defer and present debt issuance costs for a line-of-credit or other revolving credit facility arrangement as an asset and subsequently amortize the deferred debt issuance costs ratably over the term of the arrangement, regardless of whether there are any outstanding borrowings on the arrangement.
As such, we will continue to include debt issuance costs for our revolving credit facility arrangements in other noncurrent assets.
These ASUs are effective for annual periods beginning after December 15, 2015, including interim periods within that reporting period.
In July 2015, the FASB issued ASU No. 2015-11, "Simplifying the Measurement of Inventory", which requires that inventory within the scope of the guidance be measured at the lower of cost and net realizable value.
Net realizable value is the estimated selling prices in the ordinary course of business, less reasonable predictable costs of completion, disposal and transportation.
Inventory measured using last-in, first-out (LIFO) and the retail inventory method (RIM) are not impacted by the new guidance.
Entities should apply the new guidance prospectively with earlier application permitted as of the beginning of an interim or annual reporting period.
An excerpt. Shown here: 40 of 362 rewritten, 40 of 174 added and 40 of 159 removed. The counts are complete. For every sentence, read Item 8. Financial Statements and Supplementary Data in the FY2017 filing and the FY2016 filing.
Item 9A. Controls and Procedures
1 rewritten, 0 added, 0 removed, 8 unchanged
There have not been any changes in our internal control over financial reporting (as such term is defined in Rules 13a‑15(f) and 15d‑15(f) under the Securities Exchange Act of 1934) during the three months ended December 31, [removed: 2016] [added: 2017] that has materially affected, or is reasonably likely to materially affect, internal control over financial reporting.
Item 10. Directors, Executive Officers and Corporate Governance
2 rewritten, 0 added, 0 removed, 8 unchanged
The Company will file with the Commission a definitive proxy statement including the other information to be disclosed under this item in the 120 days following December 31, [removed: 2016] [added: 2017] and such information is hereby incorporated by reference.
The Company will file with the Commission a definitive proxy statement including the information to be disclosed under the items in the 120 days following December 31, [removed: 2016] [added: 2017] and such information is hereby incorporated by reference.
Item 16. Form 10-K Summary
67 rewritten, 8 added, 1 removed, 56 unchanged
| Date: February [removed: 23, 2017] [added: 22, 2018] | | |
| /s/ Brian E. Lane | | President, Chief Executive Officer, and | | February [removed: 23, 2017] [added: 22, 2018] | |
| /s/ William George | | Executive Vice President and Chief Financial | | February [removed: 23, 2017] [added: 22, 2018] | |
| /s/ Julie S. Shaeff | | Senior Vice President and Chief Accounting | | February [removed: 23, 2017] [added: 22, 2018] | |
| /s/ Franklin Myers | | Chairman of the Board | | February [removed: 23, 2017] [added: 22, 2018] | |
| /s/ Darcy G. Anderson | | Director | | February [removed: 23, 2017] [added: 22, 2018] | |
| /s/ Herman E. Bulls | | Director | | February [removed: 23, 2017] [added: 22, 2018] | |
| /s/ Alfred J. Giardinelli, Jr. | | Director | | February [removed: 23, 2017] [added: 22, 2018] | |
| /s/ Alan P. Krusi | | Director | | February [removed: 23, 2017] [added: 22, 2018] | |
| /s/ James H. Schultz | | Director | | February [removed: 23, 2017] [added: 22, 2018] | |
| /s/ Constance E. Skidmore | | Director | | February [removed: 23, 2017] [added: 22, 2018] | |
| /s/ Vance W. Tang | | Director | | February [removed: 23, 2017] [added: 22, 2018] | |
| 3.1 | | [removed: Second] [added: [Second] Amended and Restated Certificate of Incorporation of the [removed: Registrant] [added: Registrant](http://www.sec.gov/Archives/edgar/data/1035983/0000890566-97-001319-index.html)] | | 3.1 | | 333‑24021 |
| 3.2 | | [removed: Certificate] [added: [Certificate] of Amendment dated May 21, [removed: 1998] [added: 1998](http://www.sec.gov/Archives/edgar/data/1035983/0000890566-99-000401-index.html)] | | 3.2 | | 1998 Form 10‑K |
| 3.3 | | [removed: Certificate] [added: [Certificate] of Amendment dated July 9, [removed: 2003] [added: 2003](http://www.sec.gov/Archives/edgar/data/1035983/000104746904005828/a2129426zex-3_3.htm)] | | 3.3 | | 2003 Form 10‑K |
| 3.4 | | [removed: Certificate] [added: [Certificate] of Amendment dated May 20, [removed: 2016] [added: 2016](http://www.sec.gov/Archives/edgar/data/1035983/000110465916122345/a16-10750_2ex3d1.htm)] | | 3.1 | | May 20, 2016 Form 8‑K |
| 3.5 | | [removed: Amended] [added: [Amended] and Restated Bylaws of Comfort Systems USA, [removed: Inc.] [added: Inc.](http://www.sec.gov/Archives/edgar/data/1035983/000110465916107645/a16-7178_1ex3d1.htm)] | | 3.1 | | March [removed: 26, 2012] [added: 25 ,2016] Form [removed: 8‑K] [added: 8-K] |
| 4.1 | | [removed: Form] [added: [Form] of certificate evidencing ownership of Common Stock of the [removed: Registrant] [added: Registrant](http://www.sec.gov/Archives/edgar/data/1035983/0000890566-97-001319-index.html)] | | 4.1 | | 333‑24021 |
| *10.1 | | [removed: Comfort] [added: [Comfort] Systems USA, Inc. 1997 Long‑Term Incentive [removed: Plan] [added: Plan](http://www.sec.gov/Archives/edgar/data/1035983/0000890566-97-000536-index.html)] | | 10.1 | | 333‑24021 |
| *10.2 | | [removed: Comfort] [added: [Comfort] Systems USA, Inc. 1997 Non‑Employee Directors’ Stock [removed: Plan] [added: Plan](http://www.sec.gov/Archives/edgar/data/1035983/0000890566-97-000536-index.html)] | | 10.2 | | 333‑24021 |
| *10.3 | | [removed: Amendment] [added: [Amendment] to the 1997 Non‑Employee Directors’ Stock Plan dated May 23, [removed: 2002] [added: 2002](http://www.sec.gov/Archives/edgar/data/1035983/000095012902004151/h98970aexv10w3.txt)] | | 10.3 | | Second Quarter 2002 Form 10‑Q/A |
| *10.4 | | [removed: Comfort] [added: [Comfort] Systems USA, Inc. 2006 Equity Incentive [removed: Plan] [added: Plan](http://www.sec.gov/Archives/edgar/data/1035983/000110465906070563/a06-18678_1ex4d5.htm)] | | 4.5 | | 333‑138377 |
| *10.5 | | [removed: Form] [added: [Form] of Option Award under the Comfort Systems USA, Inc. 2006 Equity Incentive [removed: Plan] [added: Plan](http://www.sec.gov/Archives/edgar/data/1035983/000110465907015093/a07-5471_1ex10d6.htm)] | | 10.6 | | 2006 Form 10‑K |
| *10.6 | | [removed: Form] [added: [Form] of Option Award under the Comfort Systems USA, Inc. 2006 Stock Options/SAR Plan for Non‑Employee [removed: Directors] [added: Directors](http://www.sec.gov/Archives/edgar/data/1035983/000110465907015093/a07-5471_1ex10d7.htm)] | | 10.7 | | 2006 Form 10‑K |
| *10.7 | | [removed: Employment] [added: [Employment] Agreement between the Company, Eastern Heating & Cooling, Inc. and Alfred J. Giardinelli, [removed: Jr.] [added: Jr.](http://www.sec.gov/Archives/edgar/data/1035983/000095012903003918/h07903exv10w1.txt)] | | 10.1 | | Second Quarter 2003 Form 10‑Q |
| *10.8 | | [removed: Amended] [added: [Amended] and Restated 2006 Equity Compensation Plan for Non‑Employee [removed: Directors] [added: Directors](http://www.sec.gov/Archives/edgar/data/1035983/000104746908004478/a2184426zdef14a.htm)] | | A | | Proxy Statement April 10, 2008 |
| *10.9 | | [removed: 2008] [added: [2008] Senior Management Annual Performance [removed: Plan] [added: Plan](http://www.sec.gov/Archives/edgar/data/1035983/000104746908004478/a2184426zdef14a.htm)] | | B | | Proxy Statement April 10, 2008 |
| *10.10 | | [removed: Form] [added: [Form] of Change in Control [removed: Agreement] [added: Agreement](http://www.sec.gov/Archives/edgar/data/1035983/000104746908005698/a2185250zex-10_2.htm)] | | 10.2 | | First Quarter 2008 Form 10‑Q |
| *10.11 | | [removed: Form] [added: [Form] of Comfort Systems USA, Inc. Executive Severance [removed: Policy] [added: Policy](http://www.sec.gov/Archives/edgar/data/1035983/000104746908005698/a2185250zex-10_3.htm)] | | 10.3 | | First Quarter 2008 Form 10‑Q |
| *10.12 | | [removed: Form] [added: [Form] of Directors and Officers Indemnification [removed: Agreement] [added: Agreement](http://www.sec.gov/Archives/edgar/data/1035983/000110465909033654/a09-12567_2ex10d1.htm)] | | 10.1 | | May 19, 2009 Form 8‑K |
| 10.13 | | [removed: Second] [added: [Second] Amended and Restated Credit Agreement by and among Comfort Systems USA, Inc., as Borrower and Wells Fargo Bank, National Association, as Administrative Agent/Wells Fargo Securities LLC, as Sole Lead Arranger and Sole Lead Book Runner/Bank of Texas, N.A., Capital One, N.A., and Regions Bank as Co‑Syndication Agent/and Certain Financial Institutions as [removed: Lenders] [added: Lenders](http://www.sec.gov/Archives/edgar/data/1035983/000110465910039133/a10-14233_1ex10d1.htm)] | | 10.1 | | July 22, 2010 Form 8‑K/A |
| 10.14 | | [removed: Stock] [added: [Stock] Purchase Agreement, dated July 28, [removed: 2010] [added: 2010](http://www.sec.gov/Archives/edgar/data/1035983/000110465910040867/a10-14873_1ex10d1.htm)] | | 10.1 | | July 30, 2010 Form 8‑K |
| *10.15 | | [removed: Summary] [added: [Summary] of 2011 Incentive Compensation [removed: Plan] [added: Plan](http://www.sec.gov/Archives/edgar/data/1035983/000104746911004482/a2203822zex-10_1.htm)] | | 10.1 | | First Quarter 2011 Form 10‑Q |
| *10.16 | | [removed: Form] [added: [Form] of Performance Restricted Stock Award Agreement dated March 24, [removed: 2011] [added: 2011](http://www.sec.gov/Archives/edgar/data/1035983/000110465911017163/a11-8794_1ex10d1.htm)] | | 10.1 | | March 28, 2011 Form 8‑K |
| *10.17 | | [removed: First] [added: [First] Amendment to Comfort Systems USA, Inc. Amended and Restated 2006 Equity Compensation Plan for Non‑Employee [removed: Directors] [added: Directors](http://www.sec.gov/Archives/edgar/data/1035983/000104746911006852/a2205014zex-10_1.htm)] | | 10.1 | | Second Quarter 2011 Form 10‑Q |
| 10.18 | | [removed: Amendment] [added: [Amendment] No. 1 to Second Amended and Restated Credit Agreement, Second Amended and Restated Security Agreement, and Second Amended and Restated Pledge [removed: Agreement] [added: Agreement](http://www.sec.gov/Archives/edgar/data/1035983/000104746911009144/a2206146zex-10_1.htm)] | | 10.1 | | Third Quarter 2011 Form 10‑Q |
| *10.19 | | [removed: Summary] [added: [Summary] of 2012 Incentive Compensation [removed: Plan] [added: Plan](http://www.sec.gov/Archives/edgar/data/1035983/000104746912005259/a2209092zex-10_1.htm)] | | 10.1 | | First Quarter 2012 Form 10‑Q |
| *10.20 | | [removed: Form] [added: [Form] of 2012 Restricted Stock Unit [removed: Agreement] [added: Agreement](http://www.sec.gov/Archives/edgar/data/1035983/000110465912022874/a12-8439_1ex10d1.htm)] | | 10.1 | | March 30, 2012 Form 8‑K |
| *10.21 | | [removed: Form] [added: [Form] of 2012 Dollar‑denominated Performance Vesting Restricted Stock Unit [removed: Agreement] [added: Agreement](http://www.sec.gov/Archives/edgar/data/1035983/000110465912022874/a12-8439_1ex10d2.htm)] | | 10.2 | | March 30, 2012 Form 8‑K |
| *10.22 | | [removed: 2012] [added: [2012] Equity Incentive [removed: Plan] [added: Plan](http://www.sec.gov/Archives/edgar/data/1035983/000104746912004050/a2208641zdef14a.htm)] | | A | | [removed: Proxy Statement] April 9, 2012 [added: Proxy Statement] |
| *10.44 | | [Resignation and General Release Agreement between the Company and James Mylett, dated as of January 10, 2017](http://www.sec.gov/Archives/edgar/data/1035983/000110465917001957/a17-1811_1ex10d1.htm) | | 10.1 | | January 11, 2017 Form 8-K |
| 10.45 | | [Stock Purchase Agreement, dated February 21, 2017, by and among the Company, BCH, the Selling Shareholders and Daryl Blume, in his capacity as representative of the Selling Shareholders](http://www.sec.gov/Archives/edgar/data/1035983/000110465917011244/a17-7023_1ex2d1.htm) | | 2.1 | | February 23, 2017 Form 8-K |
| 10.46 | | [Form of Promissory Note, dated April 1, 2017, issued by the Company in favor of each of the Selling Shareholders](http://www.sec.gov/Archives/edgar/data/1035983/000110465917020991/a17-10800_1ex10d1.htm) | | 10.1 | | April 3, 2017 Form 8-K |
| *10.47 | | [2017 Omnibus Incentive Plan](http://www.sec.gov/Archives/edgar/data/1035983/000155837017002563/fix-20170523xdef14a.htm) | | A | | April 10, 2017 Proxy Statement |
| *10.48 | | [2017 Senior Management Annual Performance Plan](http://www.sec.gov/Archives/edgar/data/1035983/000155837017002563/fix-20170523xdef14a.htm) | | B | | April 10, 2017 Proxy Statement |
| *10.49 | | [Form of Restricted Stock Unit Agreement under the Company’s 2012 Equity Incentive Plan](http://www.sec.gov/Archives/edgar/data/1035983/000155837017002931/fix-20170331ex102e9479d.htm) | | 10.2 | | First Quarter 2017 Form 10-Q |
| *10.50 | | [Form of Stock Option Notice under the Company’s 2012 Equity Incentive Plan](http://www.sec.gov/Archives/edgar/data/1035983/000155837017002931/fix-20170331ex103bc199c.htm) | | 10.3 | | First Quarter 2017 Form 10-Q |
| *10.51 | | [Form of Dollar-denominated Performance Restricted Stock Unit Agreement under the Company’s 2012 Equity Incentive Plan](http://www.sec.gov/Archives/edgar/data/1035983/000155837017002931/fix-20170331ex104628293.htm) | | 10.4 | | First Quarter 2017 Form 10-Q |
| 3.6 | | Amended and Restated Bylaws of Comfort Systems USA, Inc. | | 3.1 | | March 25 ,2016 Form 8-K |
An excerpt. Shown here: 40 of 67 rewritten, all 8 added and all 1 removed. The counts are complete. For every sentence, read Item 16. Form 10-K Summary in the FY2017 filing and the FY2016 filing.