 filings.tools
Comfort Systems USA 10-K 2022-12-31
Filed 2023-02-22. 20 sections, 353K characters. Original on sec.gov · Markdown · JSON
Cover and table of contents
UNITED STATES
SECURITIES AND EXCHANGE COMMISSION
Washington, D.C. 20549
Form 10-K
| | |
|---|---|
| | |
| (Mark One) | |
| ☒ | ANNUAL REPORT PURSUANT TO SECTION 13 OR 15(d) OF THE SECURITIES EXCHANGE ACT OF 1934 |
| For the fiscal year ended December 31**, 2022** | |
| OR | |
| ☐ | TRANSITION REPORT PURSUANT TO SECTION 13 OR 15(d) OF THE SECURITIES EXCHANGE ACT OF 1934 |
| For the transition period from to |
Commission file number: 1-13011
Comfort Systems USA, Inc.
(Exact name of registrant as specified in its charter)
| | |
|---|---|
| Delaware (State or Other Jurisdiction of Incorporation or Organization) | 76-0526487 (I.R.S. Employer Identification No.) |
675 Bering Drive
Suite 400
Houston**,** Texas 77057
(713) 830-9600
(Address and telephone number of Principal Executive Offices)
Securities registered pursuant to Section 12(b) of the Act:
| | | |
|---|---|---|
| Title of Each Class | Trading Symbol(s) | Name of Each Exchange on which Registered |
| Common Stock, $.01 par value | FIX | New York Stock Exchange |
Securities registered pursuant to Section 12(g) of the Act: None
Indicate by check mark if the registrant is a well-known seasoned issuer, as defined in Rule 405 of the Securities Act. Yes ⌧ No ◻
Indicate by check mark if the registrant is not required to file reports pursuant to Section 13 or 15(d) of the Act. Yes ◻ No ⌧
Indicate by check mark whether the registrant (1) has filed all reports required to be filed by Section 13 or 15(d) of the Securities Exchange Act of 1934 during the preceding 12 months (or for such shorter period that the registrant was required to file such reports), and (2) has been subject to such filing requirements for the past 90 days. Yes ⌧ No ◻
Indicate by check mark whether the registrant has submitted electronically every Interactive Data File required to be submitted pursuant to Rule 405 of Regulation S-T (§ 232.405 of this chapter) during the preceding 12 months (or for such shorter period that the registrant was required to submit such files). Yes ⌧ No ◻
Indicate by check mark whether the registrant is a large accelerated filer, an accelerated filer, a non-accelerated filer, a smaller reporting company, or an emerging growth company. See the definitions of “large accelerated filer,” “accelerated filer,” “smaller reporting company,” and “emerging growth company” in Rule 12b-2 of the Exchange Act.
| | | | | |
|---|---|---|---|---|
| Large accelerated filer ⌧ | Accelerated filer ◻ | Non-accelerated filer ◻ | Smaller reporting company ☐ | Emerging growth company ☐ |
If an emerging growth company, indicate by check mark if the registrant has elected not to use the extended transition period for complying with any new or revised financial accounting standards provided pursuant to Section 13(a) of the Exchange Act. ◻
Indicate by check mark whether the registrant has filed a report on and attestation to its management’s assessment of the effectiveness of its internal control over financial reporting under Section 404(b) of the Sarbanes-Oxley Act (15 U.S.C. 7262(b)) by the registered public accounting firm that prepared or issued its audit report. ☒
If securities are registered pursuant to Section 12(b) of the Act, indicate by check mark whether the financial statements of the registrant included in the filing reflect the correction of an error to previously issued financial statements. ☐
Indicate by check mark whether any of those error corrections are restatements that required a recover analysis of incentive-based compensation received by any of the registrant’s executive officers during the relevant recover period pursuant to §240.10D-1(b). ☐
Indicate by check mark whether the registrant is a shell company (as defined in Rule 12b-2 of the Act). Yes ☐ No ⌧
The aggregate market value of the voting stock held by non-affiliates of the registrant at June 30, 2022 was approximately $2.91 billion, based on the $83.15 last sale price of the registrant’s common stock on the New York Stock Exchange on June 30, 2022.
As of February 16, 2023, 35,738,041 shares of the registrant’s common stock were outstanding (excluding treasury shares of 5,385,324).
DOCUMENTS INCORPORATED BY REFERENCE
The information required by Part III (other than the required information regarding executive officers) is incorporated by reference from the registrant’s definitive proxy statement, which will be filed with the Commission not later than 120 days following December 31, 2022.
TABLE OF CONTENTS
FORWARD-LOOKING STATEMENTS
Certain statements and information in this Annual Report on Form 10-K may constitute forward looking statements within the meaning of applicable securities laws and regulations. The words “believe,” “expect,” “anticipate,” “plan,” “intend,” “foresee,” “should,” “would,” “could,” or other similar expressions are intended to identify forward looking statements, which are generally not historic in nature. These forward-looking statements are based on the current expectations and beliefs of Comfort Systems USA, Inc. and its subsidiaries (collectively, the “Company”) concerning future developments and their effect on the Company. While the Company’s management believes that these forward looking statements are reasonable as and when made, there can be no assurance that future developments affecting the Company will be those that it anticipates, and the Company’s actual results of operations, financial condition and liquidity, and the development of the industry in which the Company operates, may differ materially from those made in or suggested by the forward-looking statements contained in this Annual Report on Form 10-K. In addition, even if our results of operations, financial condition and liquidity, and the development of the industry in which we operate, are consistent with the forward-looking statements contained in this Annual Report on Form 10-K, those results or developments may not be indicative of our results or developments in subsequent periods. All comments concerning the Company’s expectations for future revenue and operating results are based on the Company’s forecasts for its existing operations and do not include the potential impact of any future acquisitions. The Company’s forward-looking statements involve significant risks and uncertainties (some of which are beyond the Company’s control) and assumptions that could cause actual future results to differ materially from the Company’s historical experience and its present expectations or projections. Known material factors that could cause the Company’s actual results to differ from those in the forward-looking statements are those described in Part I, “Item 1A. Risk Factors.”
Readers are cautioned not to place undue reliance on forward-looking statements, which speak only as of the date hereof. The Company undertakes no obligation to publicly update or revise any forward-looking statements after the date they are made, whether as a result of new information, future events, or otherwise.
PART I
The terms “Comfort Systems,” “we,” “us,” or “the Company” refer to Comfort Systems USA, Inc. or Comfort Systems USA, Inc. and its consolidated subsidiaries, as appropriate in the context.
Item 1. Business
Comfort Systems USA, Inc., a Delaware corporation, was established in 1997. We provide mechanical and electrical contracting services. Our mechanical segment principally includes heating, ventilation and air conditioning (“HVAC”), plumbing, piping and controls, as well as off-site construction, monitoring and fire protection. Our electrical segment includes installation and servicing of electrical systems. We build, install, maintain, repair and replace mechanical, electrical and plumbing (“MEP”) systems throughout our 42 operating units with 169 locations in 128 cities throughout the United States.
We operate primarily in the commercial, industrial and institutional MEP markets and perform most of our services in industrial, healthcare, education, office, technology, retail and government facilities. Substantially all of our consolidated 2022 revenue was derived from commercial, industrial and institutional customers and multi-family residential projects. Approximately 48.6% of our revenue was attributable to installation services in newly constructed facilities and 51.4% was attributable to renovation, expansion, maintenance, repair and replacement services in existing buildings. Our consolidated 2022 revenue was derived from the following service industries:
| | | | |
|---|---|---|---|
| | Percentage of | ||
| Service Activity | | Revenue | |
| Mechanical Services | 76.8 | % | |
| Electrical Services | | 23.2 | % |
| Total | 100.0 | % |
Industry Overview
We believe that commercial, industrial, and institutional mechanical and electrical contracting generate annual revenue in the United States of approximately $350 billion. Mechanical and electrical systems are necessary to virtually all commercial, industrial and institutional buildings. Because most buildings are sealed, HVAC systems provide the primary method of circulating fresh air in such buildings. Replacing an aging building’s existing systems with modern, energy-efficient systems significantly reduces a building’s energy consumption, carbon footprint, and operating costs while improving air quality and overall system effectiveness. Older commercial, industrial and institutional facilities frequently have poor air quality and provide less comfortable environments, and older HVAC systems result in significantly higher energy consumption than do modern systems. As electrical systems age, they require service and replacement, and changing building configurations and technological power load requirements lead to the need to reconfigure and improve electrical systems in buildings on a regular basis.
Many factors affect mechanical and electrical services industry growth, including but not limited to, (i) population growth, which increases the need for commercial, industrial and institutional space, (ii) an aging installed base of buildings and equipment, (iii) increasing sophistication, complexity and efficiency of mechanical and electrical systems, and (iv) growing emphasis on internal air quality, environmental sustainability and energy efficiency.
Our industry can be broadly divided into two categories:
| ● | construction of and installation in new buildings, which provided approximately 48.6% of our revenue in 2022, and |
|---|
| ● | renovation, expansion, maintenance, repair and replacement in existing buildings, which provided the remaining 51.4% of our 2022 revenue. |
|---|
Construction, Installation, Expansion and Renovation Services—Construction, installation, expansion and renovation services consist of “design and build” and “plan and spec” projects. In “design and build” projects, the commercial MEP company is responsible for designing, engineering and installing a cost-effective, energy-efficient system customized to the specific needs of the building owner. Costs and other project terms are normally negotiated
between the building owner or its representative and the contracting company. Companies that specialize in “design and build” projects use a consultative approach with customers and tend to develop long-term relationships with building owners and developers, general contractors, architects, consulting engineers and property managers. “Plan and spec” installation refers to projects in which a third-party architect or consulting engineer designs the MEP systems and the installation project is “put out for bid.” We believe that “plan and spec” projects usually take longer to complete and frequently result in less efficient outcomes than “design and build” projects because the system design and installation process are not integrated, thus resulting in more frequent adjustments to project specifications, work requirements and schedules. Our investments in design and building information modeling enable us to collaborate with our customers to achieve reliable and energy efficient construction outcomes and to eliminate unnecessary waste.
Maintenance, Repair and Replacement Services—The Company’s services further include maintaining, repairing, replacing, reconfiguring and monitoring previously installed systems and building automation controls. The growth and aging of the installed base of MEP and related systems, changing requirements due to increasing technology deployment and the demand for more efficient systems and more capable building automation controls have fueled growth in these services. The increasing complexity of these systems leads many commercial, industrial and institutional building owners and property managers to outsource maintenance and repair, often through service agreements with service providers. State-of-the-art control and monitoring systems feature electronic sensors and microprocessors that are crucial to energy efficient operations. These systems require specialized training to install, maintain and repair. We believe that the work we perform to optimize and upgrade systems and to enable wise controls helps Comfort Systems USA to optimize energy use and fundamentally reduce our nation’s carbon footprint.
Strategy
We focus on strengthening core operating competencies, on leading in sustainability, efficiency and technological improvement, and on increasing profit margins. The key objectives of our strategy are to improve profitability and generate growth in our operations, to enable sustainable and efficient building environments, to improve the productivity of our workforce, and to acquire complementary businesses. Specifically, we are currently focused on the following elements:
Achieve Excellence in Core Competencies—We have identified seven core competencies that we believe are critical to attracting and retaining customers, increasing operating income and cash flow, and maximizing the productivity of our skilled labor force. The seven core competencies are: (i) safety, (ii) customer service, (iii) design and build expertise, (iv) effective pre-construction processes, (v) job and cost tracking, (vi) leadership in energy efficient and sustainable design, and (vii) best-in-class servicing of existing building systems.
Achieve Operating Efficiencies—We think we can achieve operating efficiencies and cost savings through purchasing economies, adopting “best practices,” and focusing on efficient job management. We are continually improving the “job loop” at our locations—qualifying, estimating, pricing, and executing projects effectively and efficiently. We also use our combined spend to gain purchasing advantages on products and services such as MEP components, raw materials, services, vehicles, bonding, insurance, and employee benefits.
Attract, Retain and Invest in our Employees—We seek to attract and retain quality employees by providing them an enhanced career path that offers a stable income, attractive benefits packages, and excellent growth opportunities. We continually invest in training, including programs for project managers, field superintendents, service managers, service technicians, sales managers, estimators, and leadership and development of key managers and leaders. We believe that skilled labor forces in the building and services trades have become increasingly scarce and valuable, and we are increasingly focused on growing and improving our skilled labor force, including through recruitment, development, and skills training for our hourly workers.
Focus on Industrial, Commercial and Institutional Markets—We focus on the industrial, commercial, and institutional building markets, including construction, maintenance, repair, and replacement services. We believe that these complex markets are attractive because of their growth opportunities, large and diverse customer base, attractive margins, and potential for long-term relationships with building owners.
Leverage Resources and Capabilities—We believe significant operating efficiencies can be achieved by leveraging resources among our operating locations. We have shifted certain fabrication activities to centralized locations to increase asset utilization. We opportunistically allocate our engineering, field, and supervisory labor from
one operation to another to use our employee base more fully, meet our customers’ needs and share expertise. Our ability to share resources frequently allows us to pursue work that would otherwise not be available to us and allows us to provide a more diversified and steady deployment of our labor. We believe that we have realized scale benefits from coordinated purchasing, technical innovation, insurance, benefits, bonding, and financing activities across our operations.
Maintain a Diverse Customer, Geographic, and Project Base—We have a distribution of revenue across end-use sectors that we believe reduces our exposure to negative developments in any given sector. We also have significant geographical diversification across all regions of the United States, again reducing our exposure to negative developments in any given region. Our distribution of revenue in 2022 by end-use sector was as follows:
| | | | |
|---|---|---|---|
| Industrial | 47.7 | % | |
| Healthcare | 14.1 | % | |
| Education | 10.8 | % | |
| Office Buildings | 8.4 | % | |
| Retail, Restaurants and Entertainment | 7.5 | % | |
| Government | 6.2 | % | |
| Multi-Family and Residential | 3.0 | % | |
| Other | 2.3 | % | |
| Total | 100.0 | % |
Approximately 87.0% of our revenue is earned on a project basis for installation of systems in newly constructed or existing facilities. As of December 31, 2022, we had 10,636 projects in process with an aggregate contract value of approximately $9.3 billion. Our average project takes six to nine months to complete, with an average contract price of approximately $875,000. This average project size, when taken together with the approximately 13.0% of our revenue derived from maintenance and service, provides us with a broad base of work in the construction services sector. A stratification of projects in progress as of December 31, 2022, by contract price, is as follows:
| | | | | | | |
|---|---|---|---|---|---|---|
| | | Aggregate | ||||
| | | | | Contract | ||
| | | No. of | | Price Value | ||
| Contract Price of Project | | Projects | | (millions) | ||
| Under $2 million | 9,812 | | $ | 1,628.5 | | |
| $2 million - $10 million | 610 | | 2,698.6 | | ||
| $10 million - $20 million | 112 | | 1,645.6 | | ||
| $20 million - $40 million | 82 | | 2,345.3 | | ||
| Greater than $40 million | 20 | | 985.2 | | ||
| Total | 10,636 | | $ | 9,303.2 | |
Develop and Adopt Leading Technologies—We are improving productivity by increasing use of innovative techniques in prefabrication, project design and planning, as well as in coordination and production methods. We have invested in the refinement and adoption of prefabrication practices. We work to identify, develop, and implement new materials, products and methods that can achieve greater productivity and more efficient and sustainable outcomes. Above all, we have concluded that as technology develops in our industry the fundamental prerequisite for leadership is adopting such opportunities in the quality, accuracy, and buildability of our designs. Accordingly, we have invested in the experts, training, and internal and external knowledge transfer to ensure that we are properly scaling, achieving true buildability, and fundamentally and continuously improving our design capabilities to meet our customers’ evolving requirements. Our goal is to use our scale and strategic investments to maintain a leading position in design and modeling excellence, optimize productivity and quality, and ultimately position ourselves to capitalize from ongoing or future technological developments.
Excel at Modular and Off-Site Construction—We believe that modular and off-site construction – the ability to build superior quality plants and systems away from the construction site – will become increasingly important in complex construction projects. Accordingly, through our acquisitions, we have invested in that capability, and after acquisition we have further invested in improving and growing that service offering. This has led to meaningful growth in our ability to provide this expertise. Through recent and ongoing development and acquisitions, we plan to continue to improve on our unmatched capability in mechanical off-site or modular construction.
Service Growth Initiative—Over the last several years we have made substantial investments to expand our service and maintenance revenue by increasing the value we can offer to service and maintenance customers. We are actively concentrating managerial and sales resources on training and hiring experienced employees to sell and profitably perform service work. In many locations we have added or upgraded our capability, and we believe our investments and efforts have provided customer value and stimulated growth in all aspects of our businesses.
Seek Growth through Acquisitions—We believe that we can further increase our cash flow and operating income by continuing to opportunistically enter new markets or service lines through acquisition. We have dedicated a significant portion of our cash flow on an ongoing basis to seeking opportunities to acquire businesses that have strong assembled workforces, excellent historical safety performance, leading design and energy efficiency capabilities, attractive market positions, a record of consistent positive cash flow, and desirable market locations.
Operations and Services Provided
We provide a wide range of construction, renovation, expansion, maintenance, repair and replacement services for MEP and related systems in commercial, industrial and institutional properties. Our local management teams maintain responsibility for day-to-day operating decisions. Local management is augmented by regional leadership that focuses on core business competencies, regional financial performance, cooperation and coordination between locations, implementing best practices and corporate initiatives. In addition to senior management, local personnel generally include design engineers, energy efficiency and sustainability experts, sales personnel, customer service personnel, installation and service technicians, sheet metal and prefabrication technicians, estimators and administrative personnel. We have centralized certain administrative functions such as insurance, employee benefits, training, safety programs, marketing and cash management to enable our local operating management to focus on pursuing new business opportunities and improving operating efficiencies.
Construction and Installation Services for New Buildings—Our installation business related to newly constructed facilities, which comprised approximately 48.6% of our consolidated 2022 revenue, involves the design, engineering, integration, installation and start-up of MEP and related systems. We provide “design and build” and “plan and spec” installation services for office buildings, retail centers, manufacturing plants, healthcare, education and government facilities and other commercial, industrial and institutional facilities. In a “design and build” installation, we work with the customer to determine the needed capacity and to optimize energy efficiency of the MEP systems that best suit the proposed facility. The final design, terms, price and timing of the project are then negotiated with the customer or its representatives, after which any necessary modifications are made to the system plan. In “plan and spec” installation, we participate in a bid process to provide labor, equipment, materials and installation based on the end user’s plans and engineering specifications.
Once an agreement has been reached, we order the necessary materials and equipment for delivery to meet the project schedule. In many instances we fabricate ductwork, conduit and piping and assemble certain components for the system based on the mechanical drawing specifications. Finally, we install the systems at the project site, working closely with the owner or general contractor. Our average project takes six to nine months to complete, with an average contract price of approximately $875,000. We also perform larger project work, with 824 contracts in progress at December 31, 2022 with contract prices in excess of $2 million. Our largest project in progress at December 31, 2022 had a contract price of $74.5 million. Project contracts typically provide for periodic billings to the customer as we meet progress milestones or incur cost on the project. Project contracts in our industry also frequently allow for a small portion of progress billings or contract price to be withheld by the customer until after we have completed the work. Amounts withheld under this practice are known as retention or retainage.
Renovation, Expansion, Maintenance, Monitoring, Repair and Replacement Services for Existing Buildings—Our renovation, expansion, maintenance, monitoring, repair and replacement services in existing buildings comprised approximately 51.4% of our consolidated 2022 revenue. Maintenance and repair services are provided either in response to service calls or under a service agreement. Service calls are coordinated by customer service representatives or dispatchers that use computer and communication technology to process orders, arrange service calls, dispatch technicians and communicate with and invoice customers. Service technicians work from service vehicles equipped with commonly used parts, supplies and tools to complete a variety of jobs. Optimal maintenance is crucial to energy efficient operations. Commercial, industrial and institutional service agreements usually have terms of one or more years, with automatic annual renewals, and frequently include thirty- to sixty-day cancellation notice periods. We also provide remote monitoring of power usage, temperature, pressure, humidity and air flow for MEP and other building systems.
Sources of Supply
The raw materials and components we use include MEP system components, ductwork, pipe, conduit, wire, electrical fixtures, steel, sheet metal and copper tubing and piping. These raw materials and components are generally available from a variety of domestic or foreign suppliers at competitive prices. In ordinary times, delivery times are typically short for most raw materials and standard components, but during periods of peak demand, including as we continue to experience the effects of the pandemic, may extend to several months. We estimate that direct purchase of commodities and finished products comprises between 40% and 45% of our average project cost. We have procedures to reduce commodity cost exposure such as purchasing commodities early for projects, as well as selectively including time or market-based escalation and escape provisions in bids and contracts.
Chillers, electrical switch gear and generators for large applications typically have the longest delivery time and frequently have lead times of six months or even longer. The major components of commercial MEP systems are compressors and chillers that are manufactured primarily by Carrier, Lennox, Daikin, Trane, and York. The major suppliers of building automation control systems are Automated Logic, Cisco, Delta, Distech Controls, Honeywell, Johnson Controls, Rockwell Automation, Schneider Electric, Siemens, Trane, and York. The major suppliers of electrical switchgear and generators are Caterpillar, Cummins, Eaton and Schneider Electric. We do not have any significant contracts guaranteeing us a supply of raw materials or components.
Cyclicality and Seasonality
The construction industry is subject to business cycle fluctuation. As a result, our volume of business, particularly in new construction projects and renovation, may be adversely affected by declines in new installation and replacement projects in various geographic regions of the United States during periods of economic weakness.
The mechanical and electrical contracting industries are also subject to seasonal variations. The demand for new installation and replacement is generally lower during the winter months (the first quarter of the year) due to reduced construction activity during inclement weather and less use of air conditioning during the colder months. Demand for our services is generally higher in the second and third calendar quarters due to increased construction activity and increased use of air conditioning during the warmer months. Accordingly, we expect our revenue and operating results generally will be lower in the first calendar quarter.
Sales and Marketing
We have a diverse customer base, with our top customer representing 8% of consolidated 2022 revenue, and our largest customer often changes from year to year. Management and a dedicated sales force are responsible for developing and maintaining successful long-term relationships with key customers. Customers generally include building owners and developers and property managers, as well as general contractors, architects and consulting engineers. We intend to continue our emphasis on developing and maintaining long-term relationships with our customers by providing superior, high-quality service in a professional manner. We believe we can continue to leverage the diverse technical and marketing strengths at individual locations to expand the services offered in other local markets. With respect to multi-location service opportunities, we maintain a national sales force in our national accounts group.
Human Capital Resources
Employees—As of December 31, 2022, we had approximately 14,100 employees as compared to approximately 13,200 employees as of December 31, 2021. We have collective bargaining agreements covering 12 employees. We have not experienced and do not expect any significant strikes or work stoppages and believe our relations with employees covered by collective bargaining agreements are good.
Culture and Core Values—Our values define, inform, and guide the way we operate both within our Company and in the communities where we do business. Our core values are to be safe; be honest; be respectful; be innovative; and be collaborative. These values set the foundation for our Code of Conduct, which applies to all employees, officers, and directors of the Comfort Systems USA family of companies. The Code of Conduct is regularly reinforced to the Company’s employees and management through periodic ethics, equal opportunity employment, and anti-corruption trainings. In addition, certain business partners, such as consultants, agents, suppliers, contractors, and other third
parties, serve as an extension of the Company. They are expected to follow the spirit of our Code of Conduct, all applicable laws, and any applicable contractual provisions when working on our behalf.
We believe that the way we conduct business is just as important as the business we do. Operating with integrity helps us deliver on the promises we have made to each other, our customers, and the communities where we live and work. It is also the basis for ensuring continued growth and success. Everyone at our Company shares a responsibility for doing business ethically and in a sustainable manner, preserving our good name. We ensure that this responsibility applies at every level in our organization, and everyone from corporate officers to members of our Board of Directors, to our field personnel is responsible for overseeing these efforts.
Recruiting and Training—Our continued success depends, in part, on our ability to continue to attract, retain and motivate qualified engineers, service technicians, field supervisors and project managers. We believe our success in retaining qualified employees will be based on the quality of our recruiting, training, compensation, employee benefits programs and opportunities for advancement. We provide numerous training programs for management, sales, and leadership, as well as on-the-job training, technical training, apprenticeship programs, attractive benefit packages and career advancement opportunities within our Company.
Safety—We have established comprehensive safety programs throughout our operations to ensure that all employees comply with safety standards we have established and that are established under federal, state, and local laws and regulations. Safety leadership establishes safety programs and benchmarking to improve safety across the Company. Additionally, our employment screening process seeks to determine that prospective employees have requisite skills, sufficient background references and acceptable driving records, if applicable. Our rate of incidents recordable under the standards of the Occupational Safety and Health Administration (“OSHA”) per one hundred employees per year, also known as the OSHA recordable rate, was 1.01 during 2022. This level was 33% better than the most recently published OSHA rate for our industry.
Diversity and Inclusion—We are an equal opportunity employer, and we welcome and celebrate our teams’ differences, experiences, and beliefs. We expect all employees to be treated with dignity and respect in an environment free from discrimination and harassment regardless of race, color, religion, sex, sexual orientation, gender identity or expression, national origin, age, disability, veteran status, genetic information, or any other protected class. We know that diversity is truly a competitive advantage that helps drive growth and innovation, and we have increasingly focused on diversity and inclusion programs within our Company. Diversity and inclusion are among our leadership team’s top priorities, with clearly outlined near-term actions to accelerate progress in outreach, representation, development, and advancement of underrepresented groups within our Company. Our Board of Directors and Board committees provide oversight on certain human capital matters, including our diversity and inclusion strategy.
Insurance and Litigation
The primary insured risks in our operations are bodily injury, property damage and workers’ compensation injuries. We retain the risk for workers’ compensation, employer’s liability, auto liability, general liability and employee group health claims resulting from uninsured deductibles per-incident or occurrence. Because we have very large per incident deductibles, the vast majority of our claims are paid by us, so as a practical matter we self-insure the great majority of these risks. Losses up to such per-incident deductible amounts are estimated and accrued based upon known facts, historical trends and industry averages using the assistance of an actuary to project the extent of these obligations.
We are subject to certain claims and lawsuits arising in the normal course of business. We maintain various insurance coverages to minimize financial risk associated with these claims. We have estimated and provided accruals for probable losses and related legal fees associated with certain litigation in our consolidated financial statements. While we cannot predict the outcome of these proceedings, in our opinion and based on reports of counsel, any liability arising from these matters individually and in the aggregate will not have a material effect on our operating results, cash flows or financial condition, after giving effect to provisions already recorded.
We typically warrant labor for the first year after installation on new MEP systems that we build and install, and we pass through to the customer manufacturers’ warranties on equipment. We generally warrant labor for thirty days after servicing existing MEP systems. We do not expect warranty claims to have a material adverse effect on our financial position or results of operations.
Competition
The mechanical and electrical contracting industries are highly competitive and consist of thousands of local and regional companies. We believe that purchasing decisions in the commercial, industrial, and institutional markets are based on (i) competitive price, (ii) relationships, (iii) quality, timeliness, and reliability, (iv) tenure, financial strength, and access to bonding, (v) range of capabilities, and (vi) scale of operation. To improve our competitive position, we focus on both the consultative “design and build” installation market and the maintenance, repair, and replacement market to develop and strengthen customer relationships. In addition, we believe our ability to provide multi-location coverage and a broad range of services gives us a strategic advantage over smaller competitors who may have more limited resources and capabilities.
We believe that we are larger than most of our competitors, which are generally small, owner-operated companies in a specific area. However, there are divisions of larger contracting companies, utilities and MEP equipment manufacturers that provide MEP services in some of the same service lines and geographic areas we serve. Some of these competitors and potential competitors have greater financial resources than we do to finance development opportunities and support their operations. We believe our smaller competitors generally compete with us based on price and their long-term relationships with local customers. Our larger competitors compete with us on those factors but may also provide attractive financing and comprehensive service and product packages.
Vehicles
We operate a fleet of various owned or leased service trucks, vans and support vehicles. We believe these vehicles generally are well maintained and sufficient for our current operations.
Climate Change and Sustainability
We recognize our environmental and societal responsibilities and are committed to sustainability and to improving our environmental footprint as well as operating our business in a manner that seeks to protect the health and safety of our employees, customers, and the public. Our focus on environmental stewardship and improving productivity drives not only our efforts to become more energy efficient but also improvements in our customers' impact on climate change. Replacing an aging building’s existing systems with modern, energy-efficient systems significantly reduces a building’s energy consumption and carbon footprint while improving cost, air quality, and overall system effectiveness.
We are subject to the requirements of numerous federal, state, and local laws, regulations, and rules that promote the protection of the environment. While capital expenditures or operating costs for environmental compliance cannot be predicted with certainty, we do not currently anticipate that they will have a material effect on our capital expenditures or competitive position in the short term.
Additionally, we have increased our voluntary reporting through a submission to CDP (formerly the Carbon Disclosure Project), wherein, among other things, we disclosed the results of our first annual greenhouse gas emissions inventory. Such additional reporting is a continuation of our efforts to adhere to voluntary reporting standards. For example, in 2022, we received a silver medal as a result of our EcoVadis submission, and we published our second sustainability report (i) following the Task Force on Climate-related Financial Disclosures (“TCFD”) and the Sustainability Accounting Standard Board’s (“SASB”) standards for the Engineering and Construction Services industry, and (ii) in accordance with the Global Reporting Initiative (“GRI”) Standards: Core option. Finally, we have published a number of new policies and guidelines related to environmental, social and governance matters, including: a Supplier Diversity Policy, a Supplier Code of Conduct, an Environmental Policy and a Labor & Human Rights Policy.
Governmental Regulation and Environmental Matters
Our operations are subject to various federal, state and local laws and regulations, including: (i) licensing requirements applicable to engineering, construction and service technicians, (ii) building and MEP codes and zoning ordinances, (iii) regulations relating to consumer protection, including those governing residential service agreements, (iv) special bidding and procurement requirements on government projects, (v) wage and hour regulations, and (vi) regulations relating to worker safety and protection of the environment. For example, our operations are subject to the requirements of OSHA and comparable state laws directed towards protection of employees. We believe we have all required licenses to conduct our operations and are in substantial compliance with applicable regulatory requirements. If
we fail to comply with applicable regulations, we could be subject to substantial fines or revocation of our operating licenses.
Many state and local regulations governing the MEP services trades require individuals to hold permits and licenses. In some cases, a required permit or license held by a single individual may be sufficient to authorize specified activities for all of our service technicians who work in the state or county that issued the permit or license. We seek to ensure that, where possible, we have two employees who hold any such permits or licenses that may be material to our operations in a particular geographic region.
Our operations are subject to the federal Clean Air Act, as amended, which governs air emissions and imposes specific requirements on the use and handling of ozone-depleting refrigerants generally classified as chlorofluorocarbons (“CFCs”) or hydrochlorofluorocarbons (“HCFCs”). Clean Air Act regulations promulgated by the United States Environmental Protection Agency (“USEPA”) require the certification of service technicians involved in the service or repair of equipment containing these refrigerants and also regulate the containment and recycling of these refrigerants. These requirements have increased our training expenses and expenditures for containment and recycling equipment. The Clean Air Act is intended ultimately to eliminate the use of ozone-depleting substances such as CFCs and HCFCs in the United States and to require alternative refrigerants to be used in replacement HVAC systems. Some replacement refrigerants, already in use, and classified as hydrofluorocarbons (“HFCs”) are not ozone-depleting substances. HFCs are considered by USEPA to have high global warming potential. USEPA may at some point require the phase-out of HFCs and expand existing technician certification requirements to cover the handling of HFCs. We do not believe the existing regulations governing technician certification requirements for the handling of ozone-depleting substances or possible future regulations applicable to HFCs will materially affect our business on the whole because, although they require us to incur modest ongoing training costs, our competitors also incur such costs, and such regulations may encourage or require our customers to update their MEP systems.
Additional Information
Our Internet address is www.comfortsystemsusa.com. We make available free of charge on or through our website our annual report on Form 10-K, quarterly reports on Form 10-Q, current reports on Form 8-K, and amendments to those reports filed or furnished pursuant to Section 13(a) or 15(d) of the Exchange Act as soon as reasonably practicable after we electronically file such material with, or furnish it to, the Securities and Exchange Commission (the “SEC”). These materials are also available at www.sec.gov. Our website also includes our code of ethics, titled the “Code of Conduct,” together with other governance materials including our corporate governance standards and our Board committee charters for the audit committee, the compensation committee, and the governance and nominating committee; the executive committee, formed in 2019, operates under written grants of authority that may be amended from time to time by the Board. Printed versions of our code of ethics and our corporate governance standards may be obtained upon written request to our Corporate Compliance Officer at our headquarters address.
The content of our websites is not incorporated by reference into this annual report on Form 10-K or in any other report or document we file with the SEC, and any references to our websites are intended to be inactive textual references only.
Item 1A. Risk Factors
Our business is subject to a variety of risks and uncertainties, including, but not limited to, the risks and uncertainties described below. You should carefully consider the risks described below, together with all other information included in this report, including information contained in the “Business,” “Management’s Discussion and Analysis of Financial Condition and Results of Operations” and “Quantitative and Qualitative Disclosures about Market Risk” sections. Our business, financial condition, results of operations or cash flows could be adversely affected by the occurrence of any of these events, which could cause actual results to differ materially from expected and historical results, and the trading price of our common stock could decline.
Risks Related to Our Business
Economic downturns in the markets in which we operate may materially and adversely affect our business because our business is dependent on levels of construction activity.
The demand for our services is dependent upon the existence of construction projects and service requirements within the markets in which we operate. Any period of economic recession affecting a market or industry in which we transact business is likely to adversely impact our business. Many of the projects we work on have long lifecycles from conception to completion, and the bulk of our performance generally occurs late in a construction project’s lifecycle. We experience the results of economic trends well after an economic cycle begins, and therefore have generally continued to experience the results of an economic recession well after conditions in the general economy have improved.
The industries and markets in which we operate have always been and will continue to be vulnerable to macroeconomic downturns because they are cyclical in nature. When there is a reduction in demand, it often leads to greater price competition as well as decreased revenue and profit. The lasting effects of a recession can also increase economic instability with our vendors, subcontractors, developers, and general contractors, which can increase our liability exposure and result in us not being paid in full or at all on some projects, thus decreasing our revenue and profit. Further, to the extent some of our vendors, subcontractors, developers, or general contractors seek bankruptcy protection, such bankruptcy will likely force us to incur additional costs in attorneys’ fees, as well as other professional consultants, and will result in decreased revenue and profit. Additionally, because 6.2% of our revenue for the year ended December 31, 2022 was attributable to projects in the government sector, a reduction in federal, state, or local government spending in our industries and markets could result in decreased revenue and profit for us.
Because we bear the risk of cost overruns in most of our contracts, we may experience reduced profits or, in some cases, losses under these contracts if costs increase above our estimates.
Our contract prices are established largely based on estimates and assumptions of our projected costs, including assumptions about: future economic conditions; prices, including commodity prices and inflation; availability of labor, including the costs of providing labor, equipment, and materials; and other factors outside our control. If our estimates or assumptions prove to be inaccurate, circumstances change in a way that renders our assumptions and estimates inaccurate or we fail to successfully execute the work, cost overruns may occur, and we could experience reduced profits or a loss for affected projects. For instance, unanticipated technical problems may arise, we could have difficulty obtaining permits or approvals, local laws, labor costs or labor conditions could change, bad weather could delay construction, raw materials prices could increase, our suppliers or subcontractors may fail to perform as expected or site conditions may be different than we expected. Further rising inflation may result in higher costs for labor and materials needed to complete our contracts, and we may be unable to pass these heightened costs to our customers. We are also exposed to increases in energy prices, particularly as they relate to gasoline prices. Additionally, in certain circumstances, we guarantee project completion or the achievement of certain acceptance and performance testing levels by a scheduled date. Failure to meet schedule or performance requirements typically results in additional costs to us, and in some cases, we may also create liability for consequential and liquidated damages. Performance problems for existing and future projects could cause our actual results of operations to differ materially from those we anticipate and could damage our reputation within our industry and our customer base.
Our backlog is subject to unexpected adjustments and cancellations, which means that amounts included in our backlog may not result in actual revenue or translate into profits.
Backlog reflects revenue still to be recognized under contracted or committed installation and replacement project work. Our backlog as of December 31, 2022 was $4.06 billion. The predictive value of backlog information is limited to indications of general revenue direction over the near term, and we cannot guarantee that the revenue projected from our backlog will be realized or, if realized, will be profitable. Projects may remain in our backlog for an extended period of time, or project cancellations or scope adjustments may occur with respect to contracts reflected in our backlog. Such changes may adversely affect the revenues and profit we ultimately realize on these projects.
The effects of the COVID-19 pandemic and related economic repercussions have materially affected how we and our customers, vendors, subcontractors, developers, and general contractors are operating our businesses, and the duration and extent to which this will negatively impact our future results of operations and overall financial performance remains uncertain.
The COVID-19 pandemic has negatively impacted the global economy, affected consumer spending and global supply chains, and created significant volatility and disruption of financial markets. We have experienced resulting disruptions to our business operations. The COVID-19 pandemic continues to present potential risks to our business, particularly in light of new variants of the virus which have emerged, such as the Omicron variant and the more recent BA.4 and BA.5 sub-variants of the virus. The extent of the impact of the COVID-19 pandemic on our business and financial performance, including our ability to execute our near-term and long-term business strategies and initiatives in the expected time frame, depends on numerous evolving factors outside our control including: emergence of new variants of the virus and increased transmission rates; government, social, business and other actions that have been and will be taken in response to the COVID-19 pandemic; additional waves of COVID-19 infections; the efficacy of vaccines on new variants of the virus and overall vaccination rates; the effect of government or customer vaccine or testing requirements on employee retention and recruitment; and the effect of the COVID-19 pandemic on short- and long-term general economic conditions.
Even after the initial COVID-19 outbreak has subsided, we may continue to experience materially adverse impacts to our business as a result of its global economic impact. We continue to experience permitting, regulatory, and supply chain delays attributable to the COVID-19 pandemic. In addition to these current dynamics, the COVID-19 pandemic may create or exacerbate risks related to our operations and regulatory and compliance matters. Even though the initial effects of the COVID-19 pandemic may have waned, our business, financial condition, results of operations or c
Showing the first 8K of 65K characters. Open the full section
Item 1B. Unresolved Staff Comments
None.
Item 2. Properties
As of December 31, 2022, we owned 15 properties. Other than these owned properties, we lease the real property and buildings from which we operate. Our facilities are located in 27 states and consist of offices, shops and fabrication, maintenance and warehouse facilities. Generally, leases range from three to ten years and are on terms we believe to be commercially reasonable. A majority of these premises are leased from individuals or entities with whom we have no other business relationship. In certain instances, these leases are with current or former employees. To the extent we renew, enter into leases or otherwise change leases with current or former employees, we enter into such agreements on terms that reflect a fair market valuation for the properties. Leased premises range in size from approximately 1,000 square feet to 175,000 square feet. To maximize available capital, we generally intend to continue to lease our properties, but may consider further purchases of property where we believe ownership would be more economical. We believe that our facilities are sufficient for our current needs.
We lease our executive and administrative offices in Houston, Texas.
Item 3. Legal Proceedings
We are subject to certain legal and regulatory claims, including lawsuits arising in the normal course of business. We maintain various insurance coverages to minimize financial risk associated with these claims. We have estimated and provided accruals for probable losses and related legal fees associated with certain litigation in our consolidated financial statements. While we cannot predict the outcome of these proceedings, in management’s opinion and based on reports of counsel, any liability arising from these matters individually and in the aggregate will not have a material effect on our operating results, cash flows or financial condition, after giving effect to provisions already recorded.
In 2022, we recorded a net gain of $5.1 million related to legal matters that merited changes to our assessments of the related accruals in the ordinary course of our business based on information received in 2022. The largest change resulted from favorable developments related to a dispute with a customer regarding the outcome of a completed project as well as the obligation to perform subcontract work under two executed letters of intent for subsequent projects that we believed were not enforceable. The net gain of $5.1 million was recorded primarily as an increase in gross profit in our Consolidated Statements of Operations.
As of December 31, 2022, we recorded an accrual for unresolved matters, which is not material to our financial statements, based on our analysis of likely outcomes related to the respective matters; however, it is possible that the ultimate outcome and associated costs will deviate from our estimates and that, in the event of an unexpectedly adverse outcome, we may experience additional costs and expenses in future periods.
Item 4. Mine Safety Disclosures
Not applicable.
Item 4A. Executive Officers of the Registrant
Executive officers are appointed by our Board of Directors and hold office until their successors are elected and duly qualified. The following persons serve as executive officers of the Company.
Brian E. Lane, age 65, has served as our Chief Executive Officer and President since December 2011 and as a director since November 2010. Mr. Lane served as our President and Chief Operating Officer from March 2010 until December 2011. Mr. Lane joined the Company in October 2003 and served as Vice President and then Senior Vice President for Region One of the Company until he was named Executive Vice President and Chief Operating Officer in January 2009. Prior to joining the Company, Mr. Lane spent fifteen years at Halliburton, the global service and equipment company devoted to energy, industrial, and government customers. During his tenure at Halliburton, he held various positions in business development, strategy, and project initiatives. He departed as the Regional Director of Europe and Africa. Mr. Lane’s additional experience includes serving as a Regional Director of Capstone Turbine Corporation, a distributed power manufacturer. He also was a Vice President of Kvaerner, an international engineering and construction company where he focused on the chemical industry. Mr. Lane holds a Bachelor of Science in Chemistry from the University of Notre Dame and a Master of Business Administration from Boston College.
William George, age 58, has served as our Executive Vice President and Chief Financial Officer since May 2005, was our Senior Vice President, General Counsel and Secretary from May 1998 to May 2005, and was our Vice President, General Counsel and Secretary from March 1997 to April 1998. Since October 2011, Mr. George has also served as Regional Vice President. Mr. George was a member of our founding management team in connection with our formation in 1997. From October 1995 to February 1997, Mr. George was Vice President and General Counsel of American Medical Response, Inc., a publicly-traded healthcare transportation company. From September 1992 to September 1995, Mr. George practiced corporate and antitrust law at Ropes & Gray, a Boston, Massachusetts, law firm. Mr. George holds a Bachelor of Science in Economics from Brigham Young University and a Juris Doctorate from Harvard Law School.
Julie S. Shaeff, age 57, has served as our Senior Vice President and Chief Accounting Officer since May 2005, was our Vice President and Corporate Controller from March 2002 to May 2005, and was our Assistant Corporate Controller from September 1999 to February 2002. From 1996 to August 1999, Ms. Shaeff was Financial Accounting Manager—Corporate Controllers Group for Browning-Ferris Industries, Inc., a publicly-traded waste services company. From 1987 to 1995, she held various positions with Arthur Andersen LLP. Ms. Shaeff is a Certified Public Accountant and holds a Bachelor of Business Administration in Accounting from Texas A&M University.
Trent T. McKenna, age 50, has served as Executive Vice President and Chief Operating Officer since January 2022 and was formerly Senior Vice President and Chief Operating Officer during 2021. Mr. McKenna previously served as our Senior Vice President and Vice President – Region 4 from January 2019 to December 2020; Senior Vice President, General Counsel and Secretary from August 2013 to December 2018; Vice President, General Counsel and Secretary from May 2005 to August 2013; and Associate General Counsel from August 2004 to May 2005. From February 1999 to August 2004, Mr. McKenna was a practicing attorney in the area of complex commercial litigation in the Houston, Texas, office of Akin Gump Strauss Hauer & Feld LLP, an international law firm. Mr. McKenna earned a Bachelor of Arts degree in English from Brigham Young University and his Juris Doctorate from Duke University School of Law.
Laura F. Howell, age 35, has served as Senior Vice President and General Counsel for the Company since January 2022 and formerly served as Vice President and General Counsel from January 2019 to December 2021. Previously, Ms. Howell served as the Associate General Counsel from January 2018 to December 2018 and as Senior Counsel, Corporate from November 2014 to December 2017. Prior to joining the Company, she was an associate in the corporate department of the Houston office of Latham & Watkins, LLP from November 2013 to October 2014. From September 2012 to October 2013, Ms. Howell was an associate in the corporate department of the Silicon Valley office of Fenwick & West, LLP. Ms. Howell holds a Bachelor of Arts in Economics from Wake Forest University and a Juris Doctorate from Stanford Law School.
Terrence Reed, age 63, has served as Senior Vice President of People and Leadership Development for the Company since March 2021. Mr. Reed joined the Company after working in various senior manufacturing and HR leadership positions in several organizations, including Koch Engineered Solutions and Buckeye Technologies. Mr. Reed is a graduate of the University of South Alabama, where he completed studies in Mechanical Engineering, and is a former US Army officer.
PART II
Item 5. Market for Registrant’s Common Equity, Related Stockholder Matters and Issuer Purchases of Equity Securities
Our Common Stock is traded under the symbol FIX on the New York Stock Exchange.
As of February 16, 2023, there were approximately 285 stockholders of record of our Common Stock, and the last reported sale price on that date was $125.88 per share.
We expect to continue paying cash dividends quarterly, although there is no assurance as to future dividends because they depend on future earnings, capital requirements, and financial condition. In addition, our credit agreement may limit the amount of dividends we can pay at any time that our Net Leverage Ratio exceeds 2.75 to 1.00.
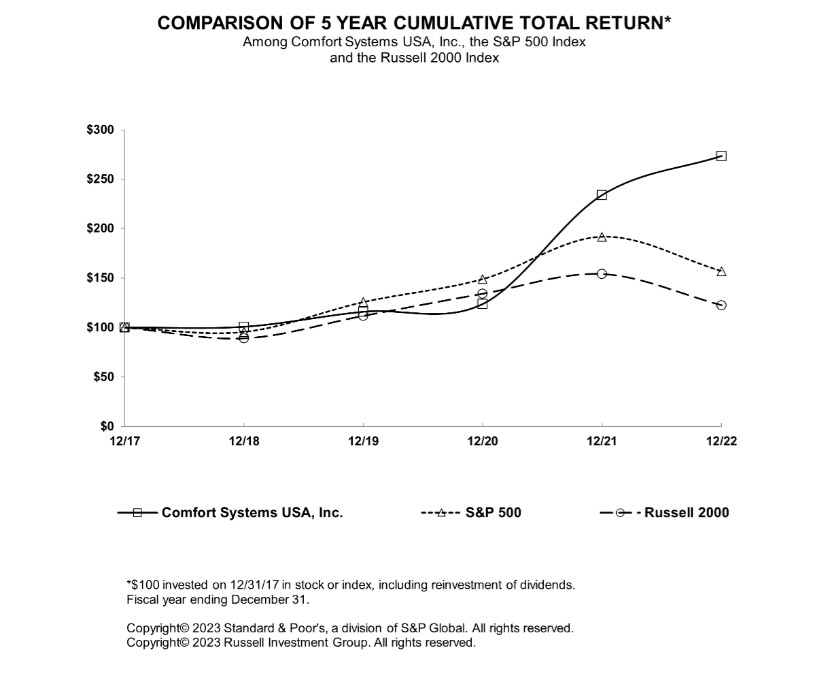
The following Corporate Performance Graph and related information shall not be deemed “soliciting material” or to be “filed” with the SEC, nor shall such information be incorporated by reference into any future filing under the Securities Act or the Exchange Act, except to the extent that we specifically incorporate it by reference into such filing.
Recent Sales of Unregistered Securities
None.
Issuer Purchases of Equity Securities
On March 29, 2007, our Board of Directors (the “Board”) approved a stock repurchase program to acquire up to 1.0 million shares of our outstanding common stock. Subsequently, the Board has from time to time increased the number of shares that may be acquired under the program and approved extensions of the program. On May 17, 2022, the Board approved an extension to the program by increasing the shares authorized for repurchase by 0.7 million shares. Since the inception of the repurchase program, the Board has approved 10.9 million shares to be repurchased. As of December 31, 2022, we have repurchased a cumulative total of 10.1 million shares at an average price of $24.52 per share under the repurchase program.
The share repurchases will be made from time to time at our discretion in the open market or privately negotiated transactions, as permitted by securities laws and other legal requirements, and subject to market conditions and other factors. The Board may modify, suspend, extend or terminate the program at any time. During the year ended December 31, 2022, we repurchased 0.4 million shares for approximately $38.2 million at an average price of $86.45 per share.
During the year ended December 31, 2022, we purchased our common shares in the following amounts at the following average prices:
| | | | | | | | | | | |
|---|---|---|---|---|---|---|---|---|---|---|
| | | | | Total Number of Shares | Maximum Number of | |||||
| | | | | | | | Purchased as Part of | | Shares that May Yet Be | |
| | | Total Number of | | Average Price | | Publicly Announced Plans | | Purchased Under the Plans | ||
| Period | | Shares Purchased | | Paid Per Share | | or Programs (1) | | or Programs | ||
| January 1 - January 31 | 52,203 | | $ | 89.68 | 9,727,000 | 566,751 | | |||
| February 1 - February 28 | 82,012 | | $ | 86.07 | 9,809,012 | 484,739 | | |||
| March 1 - March 31 | 27,399 | | $ | 86.05 | 9,836,411 | 457,340 | | |||
| April 1 - April 30 | — | | $ | — | 9,836,411 | 457,340 | | |||
| May 1 - May 31 | 156,680 | | $ | 84.33 | 9,993,091 | 951,034 | | |||
| June 1 - June 30 | 70,009 | | $ | 79.19 | 10,063,100 | 881,025 | | |||
| July 1 - July 31 | 4,496 | | $ | 82.13 | 10,067,596 | 876,529 | | |||
| August 1 - August 31 | — | | $ | — | 10,067,596 | 876,529 | | |||
| September 1 - September 30 | 32,050 | | $ | 99.97 | 10,099,646 | 844,479 | | |||
| October 1 - October 31 | 13,200 | | $ | 100.15 | 10,112,846 | 831,279 | | |||
| November 1 - November 30 | — | | $ | — | 10,112,846 | 831,279 | | |||
| December 1 - December 31 | 4,000 | | $ | 116.65 | 10,116,846 | 827,279 | | |||
| | 442,049 | | $ | 86.45 | 10,116,846 | 827,279 | |
| (1) | Purchased as part of a program announced on March 29, 2007 under which, since the inception of this program, 10.9 million shares have been approved for repurchase. |
|---|
Under our stock incentive plans, employees may elect to have us withhold common shares to satisfy statutory federal, state and local tax withholding obligations arising on the vesting of restricted stock awards and exercise of options. When we withhold these shares, we are required to remit to the appropriate taxing authorities the market price of the shares withheld, which could be deemed a purchase of the common shares by us on the date of withholding.
Item 6. [Reserved]
Item 7. Management’s Discussion and Analysis of Financial Condition and Results of Operations
The following discussion and analysis should be read in conjunction with the Consolidated Financial Statements and related notes included elsewhere in this annual report on Form 10-K. Also see “Forward-Looking Statements” discussion.
Introduction and Overview
We are a national provider of comprehensive mechanical and electrical installation, renovation, maintenance, repair and replacement services within the mechanical and electrical services industries. We operate primarily in the commercial, industrial and institutional markets and perform most of our work in industrial, healthcare, education, office, technology, retail and government facilities. We operate our business in two business segments: mechanical and electrical.
Nature and Economics of Our Business
In our mechanical business segment, customers hire us to ensure HVAC systems deliver specified or generally expected heating, cooling, conditioning and circulation of air in a facility. This entails installing core system equipment such as packaged heating and air conditioning units, or in the case of larger facilities, separate core components such as chillers, boilers, air handlers, and cooling towers. We also typically install connecting and distribution elements such as piping and ducting.
In our electrical business segment, our principal business activity is electrical construction and engineering in the commercial and industrial field. We also perform electrical logistics services, electrical service work, and electrical construction and engineering services.
In both our mechanical and electrical business segments, our responsibilities usually require conforming the systems to pre-established engineering drawings and equipment and performance specifications, which we frequently participate in establishing. Our project management responsibilities include staging equipment and materials to project sites, deploying labor to perform the work, and coordinating with other service providers on the project, including any subcontractors we might use to deliver our portion of the work.
Approximately 87.0% of our revenue is earned on a project basis for installation services in newly constructed facilities or for replacement of systems in existing facilities. When competing for project business, we usually estimate the costs we will incur on a project, and then propose a bid to the customer that includes a contract price and other performance and payment terms. Our bid price and terms are intended to cover our estimated costs on the project and provide a profit margin to us commensurate with the value of the installed system to the customer, the risk that project costs or duration will vary from estimate, the schedule on which we will be paid, the opportunities for other work that we might forego by committing capacity to this project, and other costs that we incur to support our operations but which are not specific to the project. Typically, customers will seek pricing from competitors for a given project. While the criteria on which customers select a provider vary widely and include factors such as quality, technical expertise, on-time performance, post-project support and service, and company history and financial strength, we believe that price for value is the most influential factor for most customers in choosing a mechanical or electrical installation and service provider.
After a customer accepts our bid, we generally enter into a contract with the customer that specifies what we will deliver on the project, what our related responsibilities are and how much and when we will be paid. Our overall price for the project is typically set at a fixed amount in the contract, although changes in project specifications or work conditions that result in unexpected additional work are usually subject to additional payment from the customer via what are commonly known as change orders. Project contracts typically provide for periodic billings to the customer as we meet progress milestones or incur cost on the project. Project contracts in our industry also frequently allow for a small portion of progress billings or contract price to be withheld by the customer until after we have completed the work. Amounts withheld under this practice are known as retention or retainage.
Labor, materials and overhead costs account for the majority of our cost of service. Accordingly, labor management and utilization have the most impact on our project performance. Given the fixed price nature of much of our project work, if our initial estimate of project costs is wrong or we incur cost overruns that cannot be recovered in change orders, we can experience reduced profits or even significant losses on fixed price project work. We also perform some project work on a cost-plus or a time and materials basis, under which we are paid our costs incurred plus an agreed-upon profit margin, and such projects are sometimes subject to a guaranteed maximum cost. These margins are frequently less than fixed-price contract margins because there is less risk of unrecoverable cost overruns in cost-plus or time and materials work.
As of December 31, 2022, we had 10,636 projects in process. Our average project takes six to nine months to complete, with an average contract price of approximately $875,000. Our projects generally require working capital funding of equipment and labor costs. Customer payments on periodic billings generally do not recover these costs until late in the job. Our average project duration, together with typical retention terms as discussed above, generally allow us to complete the realization of revenue and earnings in cash within one year. We have what we consider to be a well-diversified distribution of revenue across end-use sectors that we believe reduces our exposure to negative developments in any given sector. Because of the integral nature of our services to most buildings, we have the legal right in almost all cases to attach liens to buildings or related funding sources when we have not been fully paid for installing systems, except with respect to some government buildings. The service work that we do, which is discussed further below, usually does not give rise to lien rights.
We also perform larger projects. Taken together, projects with contract prices of $2 million or more totaled $7.7 billion of aggregate contract value as of December 31, 2022, or approximately 82%, out of a total contract value for all projects in progress of $9.3 billion. Generally, projects closer in size to $2 million will be completed in one year or less. It is unusual for us to work on a project that exceeds two years in length.
A stratification of projects in progress as of December 31, 2022, by contract price, is as follows:
| | | | | | | |
|---|---|---|---|---|---|---|
| | | Aggregate | ||||
| | | | | Contract | ||
| | | No. of | | Price Value | ||
| Contract Price of Project | | Projects | | (millions) | ||
| Under $2 million | 9,812 | | $ | 1,628.5 | | |
| $2 million - $10 million | 610 | | 2,698.6 | | ||
| $10 million - $20 million | 112 | | 1,645.6 | | ||
| $20 million - $40 million | 82 | | 2,345.3 | | ||
| Greater than $40 million | 20 | | 985.2 | | ||
| Total | 10,636 | | $ | 9,303.2 | |
In addition to project work, approximately 13.0% of our revenue represents maintenance and repair service on already installed HVAC, electrical, and controls systems. This kind of work usually takes from a few hours to a few days to perform. Prices to the customer are based on the equipment and materials used in the service as well as technician labor time. We usually bill the customer for service work when it is complete, typically with payment terms of up to thirty days. We also provide maintenance and repair service under ongoing contracts. Under these contracts, we are paid regular monthly or quarterly amounts and provide specified service based on customer requirements. These agreements typically are for one or more years and frequently contain thirty- to sixty-day cancellation notice periods.
A relatively small portion of our revenue comes from national and regional account customers. These customers typically have multiple sites and contract with us to perform maintenance and repair service. These contracts may also provide for us to perform new or replacement systems installation. We operate a national call center to dispatch technicians to sites requiring service. We perform the majority of this work with our own employees, with the balance being subcontracted to third parties that meet our performance qualifications.
Profile and Management of Our Operations
We manage our 42 operating units based on a variety of factors. Financial measures we emphasize include profitability and use of capital as indicated by cash flow and by other measures of working capital principally involving project cost, billings and receivables. We also monitor selling, general, administrative and indirect project support expense, backlog, workforce size and mix, growth in revenue and profits, variation of actual project cost from original estimate, and overall financial performance in comparison to budget and updated forecasts. Operational factors we emphasize include project selection, estimating, pricing, safety, management and execution practices, labor utilization, training, and the make-up of both existing backlog as well as new business being pursued, in terms of project size, technical application, facility type, end-use customers and industries and location of the work.
Most of our operations compete on a local or regional basis. Attracting and retaining effective operating unit managers is an important factor in our business, particularly in view of the relative uniqueness of each market and operation, the importance of relationships with customers and other market participants, such as architects and consulting engineers, and the high degree of competition and low barriers to entry in most of our markets. Accordingly, we devote considerable attention to operating unit management quality, stability, and contingency planning, including related considerations of compensation and non-competition protection where applicable.
Economic and Industry Factors
As a mechanical and electrical services provider, we operate in the broader nonresidential construction services industry and are affected by trends in this sector. While we do not have operations in all major cities of the United States, we believe our national presence is sufficiently large that we experience trends in demand for and pricing of our services that are consistent with trends in the national nonresidential construction sector. As a result, we monitor the views of major construction sector forecasters along with macroeconomic factors they believe drive the sector, including trends in gross domestic product, interest rates, business investment, employment, demographics and the fiscal condition of federal, state and local governments.
Spending decisions for building construction, renovation and system replacement are generally made on a project basis, usually with some degree of discretion as to when and if projects proceed. With larger amounts of capital,
time, and discretion involved, spending decisions are affected to a significant degree by uncertainty, particularly concerns about economic and financial conditions and trends. We have experienced periods of time when economic weakness caused a significant slowdown in decisions to proceed with installation and replacement project work.
Operating Environment and Management Emphasis
During the five-year period from 2015 to 2019, there was an increase in nonresidential building construction and renovation activity levels. In 2020, the advent of a global pandemic led to some delays in service and construction, including delayed project starts and air pockets or pauses during 2020 and 2021. We believe that delays and air pockets have now substantially abated; however, we expect to continue to experience supply chain constraints and reduced labor availability during 2023.
We have a credit facility in place with terms we believe are favorable that does not expire until July 2027. As of December 31, 2022, we had $580.8 million of credit available to borrow under our credit facility. We have strong surety relationships to support our bonding needs, and we believe our relationships with the surety markets are strong and benefit from our operating history and financial position. We have generated positive free cash flow in each of the last twenty-four calendar years and will continue our emphasis in this area. We believe that the relative size and strength of our Balance Sheet and surety relationships, as compared to most companies in our industry, represent competitive advantages for us.
As discussed at greater length in “Results of Operations” below, we expect price competition to continue as local and regional industry participants compete for customers. We will continue to invest in our service business, to pursue the more active sectors in our markets, and to emphasize our regional and national account business.
Critical Accounting Estimates
Management’s discussion and analysis of financial condition and results of operations are based upon our consolidated financial statements, which have been prepared in accordance with U.S. generally accepted accounting principles. The preparation of these consolidated financial statements requires us to make estimates, judgments and assumptions that can have a meaningful effect on the amounts reported within our consolidated financial statements. Note 2, “Summary of Significant Accounting Policies and Estimates” of the Notes to Consolidated Financial Statements in Part II, Item 8 of this Form 10-K describes the significant accounting policies and methods used in the preparation of the Company’s consolidated financial statements. Management bases its estimates on historical experience and on various other assumptions it believes to be reasonable under the circumstances. The Company has identified the following as its critical accounting estimates:
Revenue Recognition – The Company recognizes revenue based on the extent of progress towards completion of the performance obligation using the cost-to-cost input method of accounting, as it best depicts the transfer of assets to the customer that occurs as we incur costs on our contracts. Under the cost-to-cost measure of progress, the extent of progress towards completion is measured based on the ratio of costs incurred to date to the total estimated costs at completion of the performance obligation. The cost-to-cost input method of accounting is also affected by changes in job performance, job conditions, and final contract settlements. These factors may result in revisions to estimated costs and, therefore, revenue. Such revisions are frequently based on further estimates and subjective assessments. Variations from estimated project costs could have a significant impact on our operating results, depending on project size, and the recoverability of the variation from change orders collected from customers.
_Accounting for Self-Insurance Liabilitie_s – We are substantially self-insured for workers’ compensation, employer’s liability, auto liability, general liability and employee group health claims, in view of the relatively high per-incident deductibles we absorb under our insurance arrangements for these risks. Losses are estimated and accrued based upon known facts, historical trends and industry averages. Insurance liabilities are difficult to estimate due to various required judgements, including the severity of an injury, the determination of our liability in proportion to other parties, timely reporting of occurrences, ongoing treatment or loss mitigation, general trends in litigation recovery outcomes and the effectiveness of safety and risk management programs.
Accounting for Income Taxes – Our provision for income taxes, deferred tax assets and liabilities, and liabilities for uncertain tax positions reflect management’s best estimate of current and future taxes to be paid. Significant judgments and estimates are required in the determination of our income taxes, including the ability to recover our deferred tax assets based on assumptions about future taxable income. We record liabilities for uncertain tax positions when we determine whether it is more likely than not that the positions will be sustained based on their technical merits
and we recognize tax benefits that are more than 50 percent likely to be realized upon ultimate settlement with the relevant taxing authority.
Acquisitions – We recognize assets acquired and liabilities assumed in business combinations based on fair value estimates as of the date of acquisition. In certain acquisitions, we agree to pay additional amounts to sellers contingent upon achievement by the acquired businesses of certain predetermined profitability targets. We recognize liabilities for these contingent obligations based on their estimated fair value at the date of acquisition. Key assumptions used to determine the fair value of contingent obligations include, but are not limited to, future cash flows and operating income, probabilities of achieving such future cash flows and operating income and a weighted average cost of capital.
Recoverability of Goodwill and Identifiable Intangible Assets – Determining whether impairment indicators exist and estimating the fair value of the Company’s goodwill reporting units and intangible assets for impairment testing requires significant judgment.
In the evaluation of goodwill for impairment, we have to first assess qualitative factors to determine whether the existence of events or circumstances lead to a determination that it is more likely than not that the fair value of one of our reporting units is greater than its carrying value. If we perform a quantitative assessment, then we calculate the fair value of the reporting unit and compare the fair value with the carrying value of the reporting unit. We estimate the fair value of the reporting unit based on a market approach and an income approach, which utilizes discounted future cash flows. Assumptions critical to the fair value estimates under the discounted cash flow model include discount rates, cash flow projections, projected long-term growth rates and the determination of terminal values. Key assumptions in the market approach include multiples used to value each reporting unit.
We amortize identifiable intangible assets with finite lives over their estimated useful lives. Changes in strategy and/or market condition may result in adjustments to recorded intangible asset balances or their useful lives.
Results of Operations (in thousands, except percentages):
| | | | | | | | | | | | | | | | | |
|---|---|---|---|---|---|---|---|---|---|---|---|---|---|---|---|---|
| | | Year Ended December 31, | | |||||||||||||
| | | 2022 | 2021 | 2020 | | |||||||||||
| Revenue | | $ | 4,140,364 | 100.0 | % | $ | 3,073,636 | 100.0 | % | $ | 2,856,659 | 100.0 | % | |||
| Cost of services | | 3,398,756 | 82.1 | % | 2,510,429 | 81.7 | % | 2,309,676 | 80.9 | % | ||||||
| Gross profit | | 741,608 | 17.9 | % | 563,207 | 18.3 | % | 546,983 | 19.1 | % | ||||||
| Selling, general and administrative expenses | | 489,344 | 11.8 | % | 376,309 | 12.2 | % | 357,777 | 12.5 | % | ||||||
| Gain on sale of assets | | (1,585) | — | | (1,540) | (0.1) | % | (1,445) | (0.1) | % | ||||||
| Operating income | | 253,849 | 6.1 | % | 188,438 | 6.1 | % | 190,651 | 6.7 | % | ||||||
| Interest income | | 46 | — | | 24 | — | | 103 | — | | ||||||
| Interest expense | | (13,352) | (0.3) | % | (6,196) | (0.2) | % | (8,385) | (0.3) | % | ||||||
| Changes in the fair value of contingent earn-out obligations | | (4,819) | (0.1) | % | 7,820 | 0.3 | % | 9,119 | 0.3 | % | ||||||
| Other income (expense) | | 134 | — | | 188 | — | | 52 | — | | ||||||
| Income before income taxes | | 235,858 | 5.7 | % | 190,274 | 6.2 | % | 191,540 | 6.7 | % | ||||||
| Provision (benefit) for income taxes | | (10,089) | | | | 46,926 | | | | 41,401 | | | | |||
| Net income | | $ | 245,947 | | | | $ | 143,348 | | | | $ | 150,139 | | | |
2022 Compared to 2021
We had 41 operating locations as of December 31, 2021. In the second quarter of 2022, we completed the acquisition of Atlantic Electric, LLC (“Atlantic”), which reports as a separate operating location. We had 42 operating locations as of December 31, 2022. Acquisitions are included in our results of operations from the respective acquisition date. The same-store comparison from 2022 to 2021, as described below, excludes Atlantic, which was acquired on April 1, 2022, MEP Holding Co., Inc. (“MEP Holdings”), which was acquired on December 31, 2021, eleven months of results for Ivey Mechanical Company, LLC (“Ivey”), which was acquired on December 1, 2021, and seven months of results for Amteck Holdco LLC (“Amteck”), which was acquired on August 1, 2021. An operating location is included in the same-store comparison on the first day it has comparable prior year operating data, except for immaterial acquisitions that are often absorbed and integrated with existing operations.
Revenue—Revenue increased $1.07 billion, or 34.7%, to $4.14 billion in 2022 compared to 2021. The increase included a 12.9% increase primarily related to the Amteck, Ivey, MEP Holdings and Atlantic acquisitions, as well as a 21.8% increase in revenue related to same-store activity.
The following table presents our operating segment revenue (in thousands, except percentages):
| | | | | | | | | | | | | |
|---|---|---|---|---|---|---|---|---|---|---|---|---|
| | Year Ended December 31, | |||||||||||
| | 2022 | | 2021 | |||||||||
| Revenue: | | | | | | | | | | | | |
| Mechanical Services | | $ | 3,178,475 | 76.8 | % | | $ | 2,542,623 | 82.7 | % | ||
| Electrical Services | | 961,889 | 23.2 | % | | 531,013 | 17.3 | % | ||||
| Total | | $ | 4,140,364 | 100.0 | % | | $ | 3,073,636 | 100.0 | % |
Revenue for our mechanical services segment increased $635.9 million, or 25.0%, to $3.18 billion in 2022 compared to 2021. Of this increase, $164.9 million resulted from an additional eleven months of revenue related to the Ivey acquisition, and $471.0 million was attributable to same-store activity. The same-store revenue increase was broad-based and included an increase in activity in the industrial sector at our North Carolina operation ($79.5 million) and one of our Texas operations ($32.7 million), in the retail, restaurants and entertainment sector at one of our Florida operations ($35.0 million) and our Arizona operation ($26.0 million), and in the healthcare sector at another one of our Texas operations ($26.4 million).
Revenue for our electrical services segment increased $430.9 million, or 81.1%, to $961.9 million in 2022 compared to 2021. The increase primarily resulted from an additional seven months of revenue related to the Amteck acquisition ($110.2 million), as well as the acquisitions of MEP Holdings ($90.6 million) and Atlantic ($31.6 million). The same-store revenue increase of $198.5 million was primarily attributable to an increase in activity in the industrial sector at our Texas electrical operation ($172.5 million).
Backlog reflects revenue still to be recognized under contracted or committed installation and replacement project work. Project work generally lasts less than one year. Service agreement revenue, service work and short duration projects, which are generally billed as performed, do not flow through backlog. Accordingly, backlog represents only a portion of our revenue for any given future period, and it represents revenue that is likely to be reflected in our operating results over the next six to twelve months. As a result, we believe the predictive value of backlog information is limited to indications of general revenue direction over the near term, and should not be interpreted as indicative of ongoing revenue performance over several quarters.
The following table presents our operating segment backlog (in thousands, except percentages):
| | | | | | | | | | | | | |
|---|---|---|---|---|---|---|---|---|---|---|---|---|
| | December 31, | | | December 31, | ||||||||
| | 2022 | | 2021 | |||||||||
| Backlog: | | | | | | | | | | | | |
| Mechanical Services | | $ | 3,299,630 | 81.2 | % | | $ | 1,753,340 | 75.8 | % | ||
| Electrical Services | | 764,113 | 18.8 | % | | 558,544 | 24.2 | % | ||||
| Total | | $ | 4,063,743 | 100.0 | % | | $ | 2,311,884 | 100.0 | % |
Backlog as of December 31, 2022 was $4.06 billion, a 25.0% increase from September 30, 2022 backlog of $3.25 billion and a 75.8% increase from December 31, 2021 backlog of $2.31 billion. The sequential backlog increase was primarily a result of increased project bookings at one of our Texas operations ($540.7 million), our North Carolina operation ($310.6 million) and our Indiana operation ($50.5 million). The sequential backlog increase was partially offset by completion of project work at one of our Virginia operations ($70.0 million). The year-over-year backlog increase included the acquisition of Atlantic ($30.2 million) as well as a same-store increase of $1.72 billion, or 74.5%. Same-store year-over-year backlog was broad-based, and increased primarily due to increased project bookings at one of our Texas operations ($649.0 million), our North Carolina operation ($432.7 million), our Indiana operation ($109.7 million), our Texas electrical operation ($104.1 million) and our Utah operation ($64.2 million).
Gross Profit—Gross profit increased $178.4 million, or 31.7%, to $741.6 million in 2022 as compared to 2021. The increase included a $68.4 million, or 12.1%, increase related to the Amteck, Ivey, MEP Holdings and Atlantic acquisitions, as well as a $110.0 million, or 19.6%, increase on a same-store basis. The same-store increase in gross
profit was broad-based and was primarily driven by higher revenues in the current year including increased volumes at our Texas electrical operation ($20.5 million) and our North Carolina operation ($15.2 million). Additionally, we achieved improvements in project execution at one of our Texas operations ($12.0 million) and our Arizona operation ($10.7 million). Furthermore, we recorded an increase of $4.9 million in gross profit related to positive developments on legal matters in 2022. As a percentage of revenue, gross profit decreased from 18.3% in 2021 to 17.9% in 2022 primarily due to a higher percentage of electrical segment revenue and new construction revenue in the current year, as well as materials and equipment being a higher percentage of our costs in the current year.
Selling, General and Administrative Expenses (“SG&A”)—SG&A increased $113.0 million, or 30.0%, to $489.3 million for 2022 as compared to 2021. On a same-store basis, excluding amortization expense, SG&A increased $55.6 million, or 16.1%. The same-store increase is primarily due to higher same-store revenue, an increase in consulting fees and other expenses of $4.7 million related to the credit for increasing research activities (the “R&D tax credit”) for prior tax years and increased compensation costs attributable to increased headcount ($33.1 million), as well as an increase in travel-related expenses ($4.4 million), which were lower in the prior year due to the impacts of COVID-19 on travel. Additionally, bad debt expense increased $4.1 million on a same-store basis, primarily due to benefits recorded in the prior period when we lowered reserves to reflect the business impacts relating to COVID-19 stabilizing. Amortization expense increased $6.2 million during the period primarily as a result of the Amteck, Ivey, MEP Holdings and Atlantic acquisitions. As a percentage of revenue, SG&A decreased from 12.2% in 2021 to 11.8% in 2022 due to the factors discussed above.
We have included same-store SG&A, excluding amortization, because we believe it is an effective measure of comparative results of operations. However, same-store SG&A, excluding amortization, is not considered under generally accepted accounting principles to be a primary measure of an entity’s financial results, and accordingly, should not be considered an alternative to SG&A as shown in our Consolidated Statements of Operations.
| | | | | | | | |
|---|---|---|---|---|---|---|---|
| | Year Ended | | |||||
| | December 31, | | |||||
| | 2022 | 2021 | |||||
| | (in thousands) | | |||||
| SG&A | | $ | 489,344 | | $ | 376,309 | |
| Less: SG&A from companies acquired | | (51,181) | | — | | ||
| Less: Amortization expense | | (36,426) | | (30,214) | | ||
| Same-store SG&A, excluding amortization expense | | $ | 401,737 | | $ | 346,095 | |
Interest Expense—Interest expense increased $7.2 million, or 115.5%, in 2022. The increase in interest expense is due to an increase in our average interest rate on our outstanding borrowings in 2022 compared to the prior year as well as a higher average outstanding debt balance as compared to the prior year. Additionally, we expensed $0.2 million in the second quarter of 2022 related to the unamortized debt issuance costs for the term loan, which was refinanced in the amendment of our senior credit facility.
Changes in the Fair Value of Contingent Earn-out Obligations—The contingent earn-out obligations are measured at fair value each reporting period and changes in estimates of fair value are recognized in earnings. Expense from changes in the fair value of contingent earn-out obligations increased $12.6 million in 2022 compared to 2021. This increase was primarily caused by higher expenses at our Texas electrical operation and Ivey, driven by stronger actual current earnings and forecasted results.
Provision (Benefit) for Income Taxes—We conduct business throughout the United States in virtually all fifty states. Our effective tax rate changes based upon our relative profitability, or lack thereof, in the federal and various state jurisdictions with differing tax rates and rules. In addition, discrete items, such as tax law changes, judgments and legal structures can impact our effective tax rate. These items can also include the tax treatment for impairment of goodwill and other intangible assets, changes in fair value of acquisition-related assets and liabilities, uncertain tax positions, and accounting for losses associated with underperforming operations.
Our benefit for income taxes for 2022 was $10.1 million with a negative effective tax rate of 4.3%, as compared to the provision for income taxes of $46.9 million with an effective tax rate of 24.7% for 2021. The effective rate for 2022 was significantly lower than the 21% federal statutory rate due to a reduction in net unrecognized tax benefits primarily from settlement with the Internal Revenue Service (the “IRS”) for the 2016, 2017 and 2018 tax years (7.6%), the filing of returns to claim the R&D tax credit for the 2019, 2020 and 2021 tax years (15.1%) and inclusion of the
R&D tax credit for the current year 2022 (6.7%). These benefits were partially offset by net state income taxes (4.0%) and nondeductible expenses, including nondeductible expenses related to TAS Energy Inc. (“TAS”) (1.7%). The effective rate for 2021 was higher than the 21% federal statutory rate primarily due to net state income taxes (3.9%) and nondeductible expenses, including nondeductible expenses related to TAS (1.3%), partially offset by reductions for stock-based compensation (1.2%) and the energy efficient commercial buildings deduction (the “179D deduction”) allocated to us (0.4%). Refer to Note 11 in the Consolidated Financial Statements for a reconciliation of the federal statutory rates to the effective tax rates reflected in our financial statements.
The decrease in our effective tax rate from 2021 to 2022 was primarily due to recognition of prior years’ tax benefits from the R&D tax credit for the 2016 through 2021 tax years following an IRS survey of our previously filed refund claims for 2016, 2017 and 2018. The Joint Committee on Taxation approved such refunds in late January 2022.
2021 Compared to 2020
For a discussion of the period-to-period comparison of 2021 to 2020, please refer to “Item 7—Management’s Discussion and Analysis of Financial Condition and Results of Operations—Results of Operations—2021 Compared to 2020” in our Annual Report on Form 10-K for the year ended December 31, 2021.
Outlook
We experienced strong demand in 2022, and we believe that we have largely recovered from negative impacts to industry demand in our business due to the business disruption caused by COVID-19. We are seeing fewer instances of delayed starts of new construction work; however, we continue to experience increased labor costs. We also are experiencing supply constraints and cost increases, reduced availability, and delays in delivery of various materials and equipment. We are recognizing these challenges in our job planning and pricing, and we are working to order materials earlier than usual and seeking to collaborate with customers to share supply risks and to mitigate the effects of these challenges.
We have a good pipeline of opportunities and potential backlog, and we have been generally successful in maintaining activity levels and productivity and in procuring needed materials despite ongoing challenges. Considering all these factors, we currently anticipate solid earnings and cash flow in 2023. We continue to prepare for a wide range of challenges and economic circumstances, including a potential recession; however, despite challenges, we currently expect supportive conditions for our industry are likely to continue in 2023.
Liquidity and Capital Resources
| | | | | | | | | | | |
|---|---|---|---|---|---|---|---|---|---|---|
| | | | | | | | | | | |
| | | Year Ended December 31, | | |||||||
| | 2022 | 2021 | 2020 | |||||||
| | | (in thousands) | | |||||||
| Cash provided by (used in): | | | | | | |||||
| Operating activities | | $ | 301,531 | | $ | 180,151 | | $ | 286,510 | |
| Investing activities | | (97,178) | | (246,722) | | (207,802) | | |||
| Financing activities | | (205,915) | | 70,451 | | (74,600) | | |||
| Net increase (decrease) in cash and cash equivalents | | $ | (1,562) | | $ | 3,880 | | $ | 4,108 | |
| Free cash flow: | | | | | | | | | | |
| Cash provided by operating activities | | $ | 301,531 | | $ | 180,151 | | $ | 286,510 | |
| Purchases of property and equipment | | (48,359) | | (22,330) | | (24,131) | | |||
| Proceeds from sales of property and equipment | | 2,858 | | 3,101 | | 2,270 | | |||
| Free cash flow | | $ | 256,030 | | $ | 160,922 | | $ | 264,649 | |
Cash Flow
Our business does not require significant amounts of investment in long-term fixed assets. The substantial majority of the capital used in our business is working capital that funds our costs of labor and installed equipment deployed in project work until our customer pays us. Customary terms in our industry allow customers to withhold a small portion of the contract price until after we have completed the work, typically for six months. Amounts withheld under this practice are known as retention or retainage. Our average project duration, together with typical retention terms, generally allow us to complete the realization of revenue and earnings in cash within one year.
2022 Compared to 2021
Cash Provided by Operating Activities—Cash flow from operations is primarily influenced by demand for our services and operating margins but can also be influenced by working capital needs associated with the various types of services that we provide. In particular, working capital needs may increase when we commence large volumes of work under circumstances where project costs, primarily associated with labor, equipment and subcontractors, are required to be paid before the receivables resulting from the work performed are billed and collected. Working capital needs are generally higher during the late winter and spring months as we prepare and plan for the increased project demand when favorable weather conditions exist in the summer and fall months. Conversely, working capital assets are typically converted to cash during the late summer and fall months as project completion is underway. These seasonal trends are sometimes offset by changes in the timing of major projects, which can be impacted by the weather, project delays or accelerations and other economic factors that may affect customer spending.
We generated $301.5 million of cash flow from operating activities during 2022 compared with $180.2 million during 2021. The $121.4 million increase in cash provided was primarily driven by higher earnings in the current year, a $108.6 million benefit from billings in excess of costs, attributable to the timing of billings and various project work and a $72.8 million increase in deferred revenue liabilities driven by large advance payments received in 2022. The benefit from the advance payments received in 2022 will reverse in 2023, except to the extent that additional advanced payments are received in 2023. We made income tax payments of $52.6 million during 2022 related to the capitalization of research and experimental expenditures pursuant to the Tax Cuts and Jobs Act (2017). These payments were partially offset by $33.3 million of income tax refunds received in early 2022. These benefits were also partially offset by a $165.1 million change in receivables, net driven by the increase in revenue compared to the prior year.
Cash Used in Investing Activities—Cash used in investing activities was $97.2 million for 2022 compared to $246.7 million during 2021. The $149.5 million decrease in cash used primarily relates to a decrease in cash paid (net of cash acquired) for acquisitions, partially offset by higher purchases of property and equipment in the current year compared to 2021.
Cash Provided by (Used in) Financing Activities—Cash used in financing activities was $205.9 million for 2022 compared to cash provided by financing activities of $70.5 million during 2021. The $276.4 million increase in
cash used is primarily due to higher net repayments on debt in the current year driven by strong operating cash flows, as well as due to an increase in share repurchases in 2022.
2021 Compared to 2020
For a discussion of the period-to-period comparison of 2021 to 2020, please refer to “Item 7—Management’s Discussion and Analysis of Financial Condition and Results of Operations—Liquidity and Capital Resources—2021 Compared to 2020” in our Annual Report on Form 10-K for the year ended December 31, 2021.
Free Cash Flow
We define free cash flow as cash provided by operating activities, less customary capital expenditures, plus the proceeds from asset sales. We believe free cash flow, by encompassing both profit margins and the use of working capital over our approximately one year working capital cycle, is an effective measure of operating effectiveness and efficiency. We have included free cash flow information here for this reason, and because we are often asked about it by third parties evaluating us. However, free cash flow is not considered under generally accepted accounting principles to be a primary measure of an entity’s financial results, and accordingly free cash flow should not be considered an alternative to operating income, net income, or amounts shown in our Consolidated Statements of Cash Flows as determined under generally accepted accounting principles. Free cash flow may be defined differently by other companies.
Share Repurchase Program
On March 29, 2007, our Board of Directors approved a stock repurchase program to acquire up to 1.0 million shares of our outstanding common stock. Subsequently, the Board has from time to time increased the number of shares that may be acquired under the program and approved extensions of the program. On May 17, 2022, the Board approved an extension to the program by increasing the shares authorized for repurchase by 0.7 million shares. Since the inception of the repurchase program, the Board has approved 10.9 million shares to be repurchased. As of December 31, 2022, we have repurchased a cumulative total of 10.1 million shares at an average price of $24.52 per share under the repurchase program.
The share repurchases will be made from time to time at our discretion in the open market or privately negotiated transactions as permitted by securities laws and other legal requirements, and subject to market conditions and other factors. The Board may modify, suspend, extend or terminate the program at any time. During the year ended December 31, 2022, we repurchased 0.4 million shares for approximately $38.2 million at an average price of $86.45 per share.
Debt
Revolving Credit Facility
On May 25, 2022, we amended our senior credit facility (as amended, the “Facility”) arranged by Wells Fargo Bank, National Association, as administrative agent, and provided by a syndicate of banks, increasing our borrowing capacity from $562.5 million (of which $450 million was a revolving credit facility) to $850 million. As amended, the Facility is composed of a revolving credit line guaranteed by certain of our subsidiaries, in the amount of $850.0 million. The amended Facility also provides for an accordion or increase option not to exceed the greater of (a) $250 million and (b) 1.0x Credit Facility Adjusted EBITDA (as defined below), as well as a sublimit of up to $175.0 million issuable in the form of letters of credit. The Facility expires in July 2027 and is secured by a first lien on substantially all of our personal property except for assets related to projects subject to surety bonds and the equity of, and assets held by, certain unrestricted subsidiaries and our wholly owned captive insurance company, and a second lien on our assets related to projects subject to surety bonds. In 2022, we incurred approximately $2.3 million in financing and professional costs in connection with the amendment to the Facility, which, combined with previously unamortized costs of $1.2 million, are being amortized on a straight-line basis as a non-cash charge to interest expense over the remaining term of the Facility. As of December 31, 2022, we had $215.0 million of outstanding borrowings on the revolving credit facility, $54.2 million in letters of credit and $580.8 million of credit available.
There are two interest rate options for borrowings under the Facility, the Base Rate Loan (as defined in the Facility) option and the Secured Overnight Financing Rate (“SOFR”) Loan option. These rates are floating rates determined by the broad financial markets, meaning they can and do move up and down from time to time. Additional margins are then added to these two rates.
Certain of our vendors require letters of credit to ensure reimbursement for amounts they are disbursing on our behalf, such as to beneficiaries under our self-funded insurance programs. We have also occasionally used letters of credit to guarantee performance under our contracts and to ensure payment to our subcontractors and vendors under those contracts. Such letters of credit are issued under the Facility for a fee. The letter of credit fees range from 1.00% to 2.00% per annum, based on the Net Leverage Ratio.
Commitment fees are payable on the portion of the revolving loan capacity not in use for borrowings or letters of credit at any given time. These fees range from 0.15% to 0.25% per annum, based on the Net Leverage Ratio.
Interest expense included the following primary elements (in thousands):
| | | | | | | | | | | |
|---|---|---|---|---|---|---|---|---|---|---|
| | | Year Ended December 31, | ||||||||
| | 2022 | 2021 | 2020 | |||||||
| Interest expense on notes to former owners | | $ | 1,139 | | $ | 1,052 | | $ | 1,354 | |
| Interest expense on borrowings and unused commitment fees | | 10,955 | | 3,371 | | 5,319 | | |||
| Interest expense (income) on interest rate swaps | | | (332) | | | 499 | | | 338 | |
| Interest expense on finance leases | | | 4 | | | 57 | | | — | |
| Letter of credit fees | | 800 | | 679 | | 830 | | |||
| Amortization of debt financing costs | | 786 | | 538 | | 544 | | |||
| Total | | $ | 13,352 | | $ | 6,196 | | $ | 8,385 | |
The Facility contains financial covenants defining various financial measures and the levels of these measures with which we must comply. Covenant compliance is assessed as of each quarter end. Credit Facility Adjusted EBITDA is defined under the Facility for financial covenant purposes as consolidated net income for the four fiscal quarters ending as of any given quarterly covenant compliance measurement date, plus the corresponding amounts for (a) interest expense; (b) provision for income taxes; (c) depreciation and amortization; (d) stock or equity compensation; (e) other non-cash charges; and (f) pre-acquisition results of acquired companies. The following is a reconciliation of Credit Facility Adjusted EBITDA to net income for 2022 (in thousands):
| | | | | |
|---|---|---|---|---|
| Net income | $ | 245,947 | ||
| Provision (benefit) for income taxes | | (10,089) | | |
| Interest expense, net | | 13,306 | | |
| Depreciation and amortization expense | | 81,347 | | |
| Stock-based compensation | | 10,532 | | |
| Pre-acquisition results of acquired companies, as defined under the Facility | | 356 | | |
| Credit Facility Adjusted EBITDA | | $ | 341,399 | |
The Facility’s principal financial covenants include:
Net Leverage Ratio—The Facility requires that the ratio of (a) our Consolidated Total Indebtedness (as defined in the Facility) minus unrestricted cash and cash equivalents up to $100,000,000, to (b) our Credit Facility Adjusted EBITDA not exceed 3.50 to 1.00 as of the end of each fiscal quarter.
Interest Coverage Ratio—The Facility requires that the ratio of (a) Credit Facility Adjusted EBITDA to (b) consolidated interest expense, defined as all interest paid or accrued on indebtedness during the period excluding amortization of debt incurrence expenses, original issue discount, and mark-to-market interest expense, be at least 3.00 to 1.00. Credit Facility Adjusted EBITDA and consolidated interest expense are calculated for purposes of this covenant for the four fiscal quarters ending as of any given quarterly covenant compliance measurement date.
Other Restrictions—The Facility (a) permits unlimited acquisitions when the Company’s Net Leverage Ratio is less than or equal to 3.25 to 1.00, (b) expands certain baskets for permitted indebtedness and
liens, and (c) permits unlimited distributions, stock repurchases, and investments when the Net Leverage Ratio is less than or equal to 2.75 to 1.00.
While the Facility’s financial covenants do not specifically govern capacity under the Facility, if our debt level under the Facility at a quarter-end covenant compliance measurement date were to cause us to violate the Facility’s Net Leverage Ratio covenant, our borrowing capacity under the Facility and the favorable terms that we currently have could be negatively impacted.
We were in compliance with all of our financial covenants as of December 31, 2022.
Notes to Former Owners
As part of the consideration used to acquire ten companies, we have outstanding notes to the former owners. Together, these notes had an outstanding balance of $41.0 million as of December 31, 2022. At December 31, 2022, future principal payments of notes to former owners by maturity year are as follows (dollars in thousands):
| | | | | | | |
|---|---|---|---|---|---|---|
| | | Balance at | | Range of Stated | ||
| | December 31, 2022 | | Interest Rates | |||
| 2023 | | $ | 9,000 | | 2.5 | % |
| 2024 | | 7,200 | | 2.5 - 3.0 | % | |
| 2025 | | 22,215 | | 2.3 - 3.0 | % | |
| 2026 | | 2,625 | | 2.5 | % | |
| Total | | $ | 41,040 | | | |
Outlook
We have generated positive net free cash flow for the last twenty-four calendar years, much of which occurred during challenging economic and industry conditions. We also continue to have significant borrowing capacity under our credit facility, and we maintain what we feel are reasonable cash balances. We believe these factors will provide us with sufficient liquidity to fund our operations for the foreseeable future.
Other Commitments
As is common in our industry, we have entered into certain off-balance sheet arrangements in the ordinary course of business that result in risks not directly reflected in our Consolidated Balance Sheets, such as obligations involving letters of credit and surety guarantees.
Certain of our vendors require letters of credit to ensure reimbursement for amounts they are disbursing on our behalf, such as to beneficiaries under our self-funded insurance programs. We have also occasionally used letters of credit to guarantee performance under our contracts and to ensure payment to our subcontractors and vendors under those contracts. The letters of credit we provide are actually issued by our lenders through the Facility as described above. A letter of credit commits the lenders to pay specified amounts to the holder of the letter of credit if the holder demonstrates that we have failed to perform specified actions. If this were to occur, we would be required to reimburse the lenders. Depending on the circumstances of such a reimbursement, we may also have to record a charge to earnings for the reimbursement. Absent a claim, there is no payment or reserving of funds by us in connection with a letter of credit. However, because a claim on a letter of credit would require immediate reimbursement by us to our lenders, letters of credit are treated as a use of the Facility’s capacity just the same as actual borrowings. Claims against letters of credit are rare in our industry. To date, we have not had a claim made against a letter of credit that resulted in payments by a lender or by us. We believe that it is unlikely that we will have to fund claims under a letter of credit in the foreseeable future.
Many customers, particularly in connection with new construction, require us to post performance and payment bonds issued by a financial institution known as a surety. If we fail to perform under the terms of a contract or to pay subcontractors and vendors who provided goods or services under a contract, the customer may demand that the surety make payments or provide services under the bond. We must reimburse the sureties for any expenses or outlays they incur. To date, we are not aware of any losses to our sureties in connection with bonds the sureties have posted on our behalf, and we do not expect such losses to be incurred in the foreseeable future.
Under standard terms in the surety market, sureties issue bonds on a project-by-project basis, and can decline to issue bonds at any time. Historically, approximately 10% to 20% of our business has required bonds. While we currently have strong surety relationships to support our bonding needs, future market conditions or changes in our sureties’ assessment of our operating and financial risk could cause our sureties to decline to issue bonds for our work. If that were to occur, our alternatives include doing more business that does not require bonds, posting other forms of collateral for project performance, such as letters of credit or cash, and seeking bonding capacity from other sureties. We would likely also encounter concerns from customers, suppliers and other market participants as to our creditworthiness. While we believe our general operating and financial characteristics would enable us to ultimately respond effectively to an interruption in the availability of bonding capacity, such an interruption would likely cause our revenue and profits to decline in the near term.
Material Cash Requirements
Our material cash expenditures consist of normal operating expenditures, such as personnel costs, as well as the items noted in the following table. The table below summarizes current and long-term material cash requirements as of December 31, 2022, which we expect to fund primarily with operating cash flows (in thousands):
| | | | | | | | | | | | | | | | | | | | | | | |
|---|---|---|---|---|---|---|---|---|---|---|---|---|---|---|---|---|---|---|---|---|---|---|
| | Twelve Months Ending December 31, | | | | | | | | ||||||||||||||
| | 2023 | 2024 | 2025 | 2026 | 2027 | Thereafter | Total | |||||||||||||||
| Revolving credit facility | $ | — | $ | — | $ | — | $ | — | $ | 215,000 | $ | — | $ | 215,000 | | |||||||
| Notes to former owners | | 9,000 | | 7,200 | | 22,215 | | | 2,625 | | — | | — | | 41,040 | | ||||||
| Other debt | | | — | | 132 | | 54 | | 19 | | — | | — | | 205 | | ||||||
| Interest payable | | 13,189 | | 12,859 | | 12,414 | | | 12,213 | | 6,302 | | — | | 56,977 | | ||||||
| Operating lease obligations | | 26,275 | | 23,743 | | 22,471 | | 19,172 | | 14,914 | | 51,638 | | 158,213 | | |||||||
| Total | | $ | 48,464 | | $ | 43,934 | | $ | 57,154 | | $ | 34,029 | | $ | 236,216 | | $ | 51,638 | | $ | 471,435 | |
As of December 31, 2022, we have $54.2 million in letter of credit commitments, of which $28.9 million will expire in 2023 and $25.3 million will expire in 2024. The substantial majority of these letters of credit are posted with insurers who disburse funds on our behalf in connection with our workers’ compensation, auto liability and general liability insurance program. These letters of credit provide additional security to the insurers that sufficient financial resources will be available to fund claims on our behalf, many of which develop over long periods of time, should we ever encounter financial duress. Posting of letters of credit for this purpose is a common practice for entities that manage their self-insurance programs through third-party insurers as we do. While some of these letter of credit commitments expire in 2023, we expect nearly all of them, particularly those supporting our insurance programs, will be renewed annually.
As discussed in Note 11 “Income Taxes,” included in our Consolidated Balance Sheet at December 31, 2022 is $11.5 million of liabilities for uncertain tax positions, or unrecognized tax benefits. We believe it is reasonably possible that a reduction of up to $5.3 million in unrecognized tax benefits could occur within the next twelve months. However, due to the uncertain and complex application of tax regulations, combined with the difficulty in predicting when tax audits may be concluded, we generally cannot make reliable estimates of the timing of cash flows related to these liabilities.
Other than the lease obligations discussed in Note 10 “Leases,” we have no significant purchase or operating commitments outside of commitments to deliver equipment and provide labor in the ordinary course of performing project work.
Item 7A. Quantitative and Qualitative Disclosures about Market Risk
We are exposed to market risk primarily related to potential adverse changes in interest rates, as discussed below. We are actively involved in monitoring exposure to market risk and continue to develop and utilize appropriate risk management techniques. We are not exposed to any other significant financial market risks, including commodity price risk, or foreign currency exchange risk from the use of derivative financial instruments. At times, we use derivative financial instruments to manage our interest rate risk.
We have exposure to changes in interest rates under our revolving credit facility. Our debt with fixed interest rates consists of notes to former owners of acquired companies and acquired notes payable.
The following table presents principal amounts (stated in thousands) and related average interest rates by year of maturity for our debt obligations at December 31, 2022:
| | | | | | | | | | | | | | | | | | | | | | | |
|---|---|---|---|---|---|---|---|---|---|---|---|---|---|---|---|---|---|---|---|---|---|---|
| | Twelve Months Ending December 31, | | | | | | | | ||||||||||||||
| | 2023 | 2024 | 2025 | 2026 | 2027 | Thereafter | Total | |||||||||||||||
| Fixed Rate Debt | | $ | 9,000 | | $ | 7,332 | | $ | 22,269 | | $ | 2,644 | | $ | — | | $ | — | | $ | 41,245 | |
| Average Interest Rate | | 2.5% | | 2.5% | | 2.5% | | 2.5% | | — | | — | | 2.5% | | |||||||
| Variable Rate Debt | | $ | — | | $ | — | | $ | — | | $ | — | | $ | 215,000 | | $ | — | | $ | 215,000 | |
The weighted average interest rate applicable to the borrowings under the revolving credit facility was approximately 5.7% as of December 31, 2022 and 1.4% as of December 31, 2021.
We measure certain assets at fair value on a nonrecurring basis. These assets are recognized at fair value when they are deemed to be other-than-temporarily impaired. We did not recognize any impairments in the current year on those assets required to be measured at fair value on a nonrecurring basis.
The valuation of the Company’s contingent earn-out payments is determined using a probability weighted discounted cash flow method. This analysis reflects the contractual terms of the purchase agreements (e.g., minimum and maximum payment, length of earn-out periods, manner of calculating any amounts due, etc.) and utilizes assumptions with regard to future cash flows, probabilities of achieving such future cash flows and a discount rate.
Item 8. Financial Statements and Supplementary Data
INDEX TO FINANCIAL STATEMENTS
Report of Independent Registered Public Accounting Firm
To the stockholders and the Board of Directors of Comfort Systems USA, Inc.
Opinion on the Financial Statements
We have audited the accompanying consolidated balance sheets of Comfort Systems USA, Inc. and its consolidated subsidiaries (the “Company”) as of December 31, 2022 and 2021, the related consolidated statements of operations, stockholders’ equity, and cash flows, for each of the two years in the period ended December 31, 2022, and the related notes (collectively, referred to as the “financial statements”). In our opinion, the financial statements present fairly, in all material respects, the financial position of the Company as of December 31, 2022 and 2021, and the results of its operations and its cash flows for each of the two years in the period ended December 31, 2022, in conformity with accounting principles generally accepted in the United States of America.
We have also audited, in accordance with the standards of the Public Company Accounting Oversight Board (United States) (PCAOB), the Company’s internal control over financial reporting as of December 31, 2022, based on criteria established in Internal Control—Integrated Framework (2013) issued by the Committee of Sponsoring Organizations of the Treadway Commission and our report dated February 22, 2023, expressed an unqualified opinion on the Company’s internal control over financial reporting.
Basis for Opinion
These financial statements are the responsibility of the Company’s management. Our responsibility is to express an opinion on the Company’s financial statements based on our audits. We are a public accounting firm registered with the PCAOB and are required to be independent with respect to the Company in accordance with the U.S. federal securities laws and the applicable rules and regulations of the Securities and Exchange Commission and the PCAOB.
We conducted our audits in accordance with the standards of the PCAOB. Those standards require that we plan and perform the audits to obtain reasonable assurance about whether the financial statements are free of material misstatement, whether due to error or fraud. Our audits included performing procedures to assess the risks of material misstatement of the financial statements, whether due to error or fraud, and performing procedures that respond to those risks. Such procedures included examining, on a test basis, evidence regarding the amounts and disclosures in the financial statements. Our audits also included evaluating the accounting principles used and significant estimates made by management, as well as evaluating the overall presentation of the financial statements. We believe that our audits provide a reasonable basis for our opinion.
Critical Audit Matter
The critical audit matter communicated below is a matter arising from the current-period audit of the consolidated financial statements that was communicated or required to be communicated to the audit committee and that (1) relates to accounts or disclosures that are material to the consolidated financial statements and (2) involved our especially challenging, subjective, or complex judgments. The communication of a critical audit matter does not alter in any way our opinion on the consolidated financial statements, taken as a whole, and we are not, by communicating the critical audit matter below, providing a separate opinion on the critical audit matter or on the accounts or disclosures to which it relates.
Revenue from Contracts with Customers–Refer to Notes 2 and 3 to the consolidated financial statements
Critical Audit Matter Description
The Company recognizes revenue based on the extent of progress towards completion of the performance obligation. The Company generally uses a cost-to-cost input method to measure progress for its contracts, as it depicts the transfer of assets to the customer that occurs as the Company incurs costs, which include labor, materials, subcontractors’ costs, other direct costs, and an allocation of indirect costs. Under the cost-to-cost measure of progress, the extent of progress towards completion is measured based on the ratio of costs incurred to date to the total estimated costs at completion of the performance obligation. Revenue, including estimated fees or profits, is recorded proportionally as costs are incurred.
The cost-to-cost input method of accounting is also affected by changes in job performance, job conditions, and final contract settlements. These factors may result in revisions to estimated costs and, therefore, revenue. Such revisions are frequently based on further estimates and subjective assessments. Variations from estimated project costs could have a significant impact on operating results, depending on project size, and the recoverability of the variation from change orders collected from customers.
Given the judgments necessary to account for the Company’s contracts with customers, specifically the estimates of total costs that will be incurred at contract completion, which are complex and subject to many variables, auditing the corresponding balances and related accounting estimates required extensive audit effort due to the complexity of these estimates, and a high degree of auditor judgment when performing audit procedures and evaluating the results of those procedures.
How the Critical Audit Matter was Addressed in the Audit
Our audit procedures related to management’s estimates and judgments included within the Company’s estimated total costs at completion, included the following, among others:
| ● | We tested the operating effectiveness of controls over the recognition of revenue, including those over the determination of estimated costs at completion of the contracts (including the estimated progress toward completion). |
|---|
| ● | We evaluated quarter-over-quarter changes in contract profit estimates for a selection of contracts by obtaining explanations from Company’s management regarding the timing and amount of the changes in estimates and corroborating these inquiries by inspecting documents, including management workplans, customer communications, change orders, vendor invoices, and supplier or subcontractor communications. |
|---|
| ● | We developed an independent expectation of recorded revenue at certain operating units using analytical procedures and considering relevant current and historical information and compared our expectations to the recorded revenue for the operating unit. |
|---|
| ● | For a sample of contracts with customers, we performed the following: |
|---|
| o | Evaluated the reasonableness of management’s estimates of total costs and profit at completion by: |
|---|
| | ◾ | Evaluating management’s estimate of total costs at completion for each selected contract by performing corroborating inquiries with the Company’s project managers and personnel involved with the selected contr
Showing the first 8K of 140K characters. Open the full section
Item 9. Changes in and Disagreements with Accountants on Accounting and Financial Disclosure
None.
Item 9A. Controls and Procedures
Evaluation of Disclosure Controls and Procedures
Our executive management is responsible for ensuring the effectiveness of the design and operation of our disclosure controls and procedures. We conducted an evaluation under the supervision and with the participation of our management, including our Chief Executive Officer and Chief Financial Officer, of the effectiveness of the design and operation of our disclosure controls and procedures (as defined in Rules 13a-15(e) and 15d-15(e) under the Securities Exchange Act of 1934) as of the end of the period covered by this report. Based on that evaluation, our Chief Executive Officer and Chief Financial Officer have concluded that our disclosure controls and procedures (as defined in Rules 13a-15(e) and 15d-15(e) of the Securities Exchange Act of 1934) were effective as of the end of the period covered by this report.
Changes in Internal Control over Financial Reporting
There have not been any changes in our internal control over financial reporting (as such term is defined in Rules 13a-15(f) and 15d-15(f) under the Securities Exchange Act of 1934) during the three months ended December 31, 2022 that have materially affected, or are reasonably likely to materially affect, internal control over financial reporting.
Management’s Report on Internal Control over Financial Reporting
Our management is responsible for establishing and maintaining adequate internal control over financial reporting as defined in Rule 13a-15(f) and 15d-15(f) under the Securities Exchange Act of 1934. Our internal control over financial reporting is a process designed to provide reasonable assurance regarding the reliability of financial reporting and the preparation of our consolidated financial statements for external purposes in accordance with U.S. generally accepted accounting principles. Internal control over financial reporting includes those policies and procedures that (i) pertain to the maintenance of records that in reasonable detail accurately and fairly reflect the transactions and dispositions of the assets of the company; (ii) provide reasonable assurance that transactions are recorded as necessary to permit preparation of financial statements in accordance with U.S. generally accepted accounting principles, and that receipts and expenditures of the company are being made only in accordance with authorizations of management and directors of the company; and (iii) provide reasonable assurance regarding prevention or timely detection of unauthorized acquisition, use or disposition of the company’s assets that could have a material effect on the financial statements.
Under the supervision and with the participation of our management, including our Chief Executive Officer and Chief Financial Officer, we conducted an evaluation of the effectiveness of our internal control over financial reporting as of December 31, 2022 based on the framework in Internal Control—Integrated Framework issued by the Committee of Sponsoring Organizations of the Treadway Commission (COSO 2013 framework). Based on that evaluation, our management concluded that our internal control over financial reporting was effective as of December 31, 2022.
Because of its inherent limitations, internal control over financial reporting may not prevent or detect misstatements. Also, projections of any evaluation of effectiveness to future periods are subject to the risk that controls may become inadequate because of changes in conditions, or that the degree of compliance with the policies or procedures may deteriorate.
Deloitte & Touche LLP, an independent registered public accounting firm, as stated in their report which is included elsewhere herein, has issued an attestation report auditing the effectiveness of our internal control over financial reporting as of December 31, 2022.
Report of Independent Registered Public Accounting Firm
To the stockholders and the Board of Directors of Comfort Systems USA, Inc.
Opinion on Internal Control over Financial Reporting
We have audited the internal control over financial reporting of Comfort Systems USA, Inc. and its consolidated subsidiaries (the “Company”) as of December 31, 2022, based on criteria established in Internal Control — Integrated Framework (2013) issued by the Committee of Sponsoring Organizations of the Treadway Commission (COSO). In our opinion, the Company maintained, in all material respects, effective internal control over financial reporting as of December 31, 2022, based on criteria established in Internal Control — Integrated Framework (2013) issued by COSO.
We have also audited, in accordance with the standards of the Public Company Accounting Oversight Board (United States) (PCAOB), the consolidated financial statements of the Company for the year ended December 31, 2022, and our report dated February 22, 2023, expressed an unqualified opinion on those consolidated financial statements.
Basis for Opinion
The Company’s management is responsible for maintaining effective internal control over financial reporting and for its assessment of the effectiveness of internal control over financial reporting, included in the accompanying Management’s Report on Internal Control over Financial Reporting. Our responsibility is to express an opinion on the Company’s internal control over financial reporting based on our audit. We are a public accounting firm registered with the PCAOB and are required to be independent with respect to the Company in accordance with the U.S. federal securities laws and the applicable rules and regulations of the Securities and Exchange Commission and the PCAOB.
We conducted our audit in accordance with the standards of the PCAOB. Those standards require that we plan and perform the audit to obtain reasonable assurance about whether effective internal control over financial reporting was maintained in all material respects. Our audit included obtaining an understanding of internal control over financial reporting, assessing the risk that a material weakness exists, testing and evaluating the design and operating effectiveness of internal control based on the assessed risk, and performing such other procedures as we considered necessary in the circumstances. We believe that our audit provides a reasonable basis for our opinion.
Definition and Limitations of Internal Control over Financial Reporting
A company’s internal control over financial reporting is a process designed to provide reasonable assurance regarding the reliability of financial reporting and the preparation of financial statements for external purposes in accordance with generally accepted accounting principles. A company’s internal control over financial reporting includes those policies and procedures that (1) pertain to the maintenance of records that, in reasonable detail, accurately and fairly reflect the transactions and dispositions of the assets of the company; (2) provide reasonable assurance that transactions are recorded as necessary to permit preparation of financial statements in accordance with generally accepted accounting principles, and that receipts and expenditures of the company are being made only in accordance with authorizations of management and directors of the company; and (3) provide reasonable assurance regarding prevention or timely detection of unauthorized acquisition, use, or disposition of the company’s assets that could have a material effect on the financial statements.
Because of its inherent limitations, internal control over financial reporting may not prevent or detect misstatements. Also, projections of any evaluation of effectiveness to future periods are subject to the risk that controls may become inadequate because of changes in conditions, or that the degree of compliance with the policies or procedures may deteriorate.
/s/ Deloitte & Touche LLP
Houston, Texas
February 22, 2023
Item 9B. Other Information
None.
Item 9C. Disclosure Regarding Foreign Jurisdictions that Prevent Inspections
Not applicable.
PART III
Item 10. Directors, Executive Officers and Corporate Governance
We have adopted a code of ethics that applies to our principal executive officer, our principal financial officer, and our principal accounting officer, as well as to our other employees. This code of ethics consists of our Code of Conduct. The Company has made this code of ethics available on our website, as described in Item 1 of this annual report on Form 10-K. If we make substantive amendments to this code of ethics or grant any waiver, including any implicit waiver, we will disclose the nature of such amendment or waiver on our website or in a report on Form 8-K within four business days of such amendment or waiver.
The other information required by this Item 10 will be furnished on or prior to May 1, 2023 (and is hereby incorporated by reference) by an amendment hereto or pursuant to a definitive proxy statement involving the election of directors pursuant to Regulation 14A that will contain such information.
ITEMS 11, 12, 13 AND 14.
The information required by Items 11, 12, 13 and 14 will be furnished on or prior to May 1, 2023 (and is hereby incorporated by reference) by an amendment hereto or pursuant to a definitive proxy statement involving the election of directors pursuant to Regulation 14A that will contain such information. Notwithstanding the foregoing, information appearing in the sections “Compensation Committee Report” and “Audit Committee Report” shall not be deemed to be incorporated by reference in this Form 10-K.
PART IV
Item 15. Exhibits and Financial Statement Schedules
| (a) | The following documents are filed as part of this annual report on Form 10-K: |
|---|
| (1) | Consolidated Financial Statements: The Index to the Consolidated Financial Statements is included under Part II, Item 8 of this annual report on Form 10-K and is incorporated herein by reference. |
|---|
| (2) | Financial Statement Schedules: |
|---|
None.
| (b) | Exhibits |
|---|
Reference is made to the Index of Exhibits immediately following the signature page thereof, which is incorporated herein by reference.
| (c) | Excluded financial statements: |
|---|
None.
Item 16. Form 10-K Summary
None.
INDEX OF EXHIBITS
| | | | | Incorporated by Referenceto the Exhibit Indicated Belowand to the Filing with the****Commission Indicated Below | ||
|---|---|---|---|---|---|---|
| Exhibit****Number | Description of Exhibits | Exhibit****Number | Filing or File Number | |||
| 101.INS | | Inline XBRL Instance Document | | | | Filed Herewith |
| 101.SCH | | Inline XBRL Taxonomy Extension Schema Document | | | | Filed Herewith |
| 101.CAL | | Inline XBRL Taxonomy Extension Calculation Linkbase Document | | | | Filed Herewith |
| 101.DEF | | Inline XBRL Taxonomy Extension Definition Linkbase Document | | | | Filed Herewith |
| 101.LAB | | Inline XBRL Taxonomy Extension Label Linkbase Document | | | | Filed Herewith |
| 101.PRE | | Inline XBRL Taxonomy Extension Presentation Linkbase Document | | | | Filed Herewith |
| 104 | | Cover Page Interactive Data File (the cover page XBRL tags are embedded in the Inline XBRL document) | | | | |
| * | Management contract or compensatory plan. |
|---|
SIGNATURES
Pursuant to the requirements of Section 13 or 15(d) of the Securities Exchange Act of 1934, the registrant has duly caused this report to be signed on its behalf by the undersigned, thereunto duly authorized.
| | | |
|---|---|---|
| | COMFORT SYSTEMS USA, INC. | |
| | | |
| | By: | /s/ BRIAN E. LANE |
| | | Brian E. Lane |
| | | President and Chief Executive Officer |
| Date: February 22, 2023 | | |
Pursuant to the requirements of the Securities Exchange Act of 1934, this report has been signed by the following persons on behalf of the registrant and in the capacities and on the dates indicated.
| Signature | Title | Date | |||
| | | | | | |
| /s/ Brian E. Lane | | President, Chief Executive Officer, and | | February 22, 2023 | |
| Brian E. Lane | | Director (Principal Executive Officer) | | | |
| | | | | | |
| /s/ William George | | Executive Vice President and Chief Financial | | February 22, 2023 | |
| William George | | Officer (Principal Financial Officer) | | | |
| | | | | | |
| /s/ Julie S. Shaeff | | Senior Vice President and Chief Accounting | | February 22, 2023 | |
| Julie S. Shaeff | | Officer (Principal Accounting Officer) | | | |
| | | | | | |
| /s/ Franklin Myers | | Chairman of the Board | | February 22, 2023 | |
| Franklin Myers | | | | | |
| | | | | | |
| /s/ Darcy G. Anderson | | Director | | February 22, 2023 | |
| Darcy G. Anderson | | | | | |
| | | | | | |
| /s/ Herman E. Bulls | | Director | | February 22, 2023 | |
| Herman E. Bulls | | | | | |
| | | | | | |
| /s/ Alan P. Krusi | | Director | | February 22, 2023 | |
| Alan P. Krusi | | | | | |
| | | | | | |
| /s/ Pablo G. Mercado | | Director | | February 22, 2023 | |
| Pablo G. Mercado | | | | | |
| | | | | | |
| /s/ William J. Sandbrook | | Director | | February 22, 2023 | |
| William J. Sandbrook | | | | | |
| | | | | | |
| /s/ Constance E. Skidmore | | Director | | February 22, 2023 | |
| Constance E. Skidmore | | | | | |
| | | | | | |
| /s/ Vance W. Tang | | Director | | February 22, 2023 | |
| Vance W. Tang | | | | | |
| | | | | | |
| /s/ Cindy L. Wallis-Lage | | Director | | February 22, 2023 | |
| Cindy L. Wallis-Lage | | | | | |