 filings.tools
Comfort Systems USA (FIX) 10-K risk factor changes: FY2023 vs FY2022
The 2023-12-31 10-K against the 2022-12-31 one, compared heading by heading and sentence by sentence.
Item 1A27 rewritten6 added17 removed326 unchanged
All filing items693 rewritten315 added265 removed1,682 unchanged
Summary
counted, not written
- Item 1A lists 40 risk factor headings: 0 new, 0 reworded and 40 unchanged since FY2022. 1 heading from FY2022 no longer appears.
- Sentence by sentence, 315 added, 265 removed, 693 rewritten and 1,682 unchanged across 16 items that differ.
- New this year: Item 1C. Cybersecurity.
New Item 1A headings (0)
No risk factor heading in this filing is absent from FY2022.
Removed Item 1A headings (1)
- The effects of the COVID-19 pandemic and related economic repercussions have materially affected how we and our customers, vendors, subcontractors, developers, and general contractors are operating our businesses, and the duration and extent to which this will negatively impact our future results of operations and overall financial performance remains uncertain.
A heading is new when no FY2022 heading matches it after ignoring case and punctuation, and reworded when it shares at least 60 percent of its words with one that went away. All current risk factor headings.
Sentences by item
21 items, with every count and a link to each item that changed
Underlined words on a shaded ground are new in FY2023; struck-through words were in FY2022. Sentences that are wholly new or wholly gone are labelled rather than marked.
Item 1A. Risk Factors
27 rewritten, 6 added, 17 removed, 326 unchanged
Any period of economic recession affecting a market or industry in which we [removed: transact business is likely to adversely impact our business.]
Additionally, because [removed: 6.2%] [added: 5.8%] of our revenue for the year ended December 31, [removed: 2022] [added: 2023] was attributable to projects in the government sector, a reduction in federal, state, or local government spending in our industries and markets could result in decreased revenue and profit for us.
[removed: Further] [added: Further,] rising inflation may result in higher costs for labor and materials needed to complete our contracts, and we may be unable to pass these heightened costs to our customers.
Our backlog as of December 31, [removed: 2022] [added: 2023] was [removed: $4.06] [added: $5.16] billion.
The global economy [removed: is experiencing historically] [added: has recently experienced] high rates of inflation and market and economic volatility, resulting from a number of factors, including the war between Russia and [removed: Ukraine] [added: Ukraine, the war between Israel] and [added: Hamas, and] supply chain constraints.
Further, there are market concerns that the United States economy [removed: may be in or soon enter] [added: could experience] a recession.
In efforts to combat inflation, the U.S. Federal Reserve raised interest rates multiple times in [removed: 2022] [added: recent years] and may [removed: continue to increase interest rates into 2023.][added: do so again in 2024 (or may slow any rate reductions from what the market currently anticipates).]
Smaller competitors are sometimes able to win bids for these [added: projects based on price alone due to their lower cost and financial return requirements.]
[removed: As such,] [added: If] we [removed: cannot guarantee our ability] [added: are not able] to maintain a sufficient level of bonding capacity in the future, [removed: which] [added: it] could preclude our ability to bid for certain contracts or successfully contract with some customers.
[removed: If our surety companies] were to limit or eliminate our access to bonds, our alternatives would include seeking bonding capacity from other surety companies, increasing business with clients that do not require bonds and posting other forms of collateral for project performance, such as letters of credit or cash.
We may need to perform our work under a variety of conditions, including but not limited to, difficult terrain, difficult site conditions and busy urban centers where delivery of materials and availability of labor may be impacted, clean-room environments where strict procedures must be followed and sites that may have been exposed to harsh and hazardous conditions and outbreaks of infectious disease, such as the [removed: ongoing] COVID-19 pandemic.
Extreme weather conditions (such as storms, droughts, extreme heat or cold, wildfires and floods) may limit the availability of resources, [added: increase our costs, or may cause projects to be cancelled.]
Compliance with more stringent laws or regulations, as well as more vigorous enforcement policies of the regulatory [removed: agencies] [added: agencies,] could increase the costs of projects for our customers or, in some cases, prevent a project from going forward, which could in turn have an adverse effect on our financial condition and results of operations.
The last several years have been periodically marked by political and economic concerns, including the [removed: ongoing] COVID-19 pandemic, decreased consumer confidence, the effects of international conflicts such as the [removed: war] [added: wars] between Russia and [removed: Ukraine,] [added: Ukraine and between Israel and Hamas,] tariffs, energy costs and inflation.
Further, ongoing economic instability in the global markets, including from the [removed: ongoing] COVID-19 pandemic, supply chain disruptions, rising inflation and interest rates and the [removed: war] [added: wars] between Russia and [removed: Ukraine,] [added: Ukraine and between Israel and Hamas,] could limit our ability to access the capital markets at a time when we would like, or need, to raise capital, which could have an impact on our ability to react to changing business conditions or new opportunities.
Labor shortages, including the [removed: current] [added: recent] U.S. labor shortage, increased labor costs or the loss of key personnel may reduce our profitability and negatively impact our business.
If our business resources become strained or over-burdensome, our earnings may be adversely affected, and we may be unable to increase revenue [removed: growth.]
New cyber-related [removed: regulations] [added: regulations, including the cybersecurity risk management, strategy, governance and incident disclosure rules adopted by the SEC in 2023,] or other requirements could require significant additional resources and cause us to incur significant costs, which could have an adverse effect on our results of operations and cash flows.
[removed: The implementation of new systems and information] technology could adversely impact our operations by requiring substantial capital expenditures, diverting management’s attention, or causing delays or difficulties in transitioning to new systems.
Examples of such misconduct include employee or subcontractor theft, personal misconduct and failure to comply with safety standards, [removed: including regulatory, company or site-specific COVID-19 safety protocols,] laws and regulations, customer requirements, environmental laws and any other applicable laws or regulations.
Our [removed: 169] [added: 172] locations are located in 27 states, which exposes us to a variety of different state and local laws and regulations, particularly those pertaining to contractor licensing requirements.
Because [removed: 6.2%] [added: 5.8%] of our revenue for the year ended December 31, [removed: 2022] [added: 2023] was attributable to projects in the government sector, prohibitions against bidding on future government contracts could have an adverse effect on our financial condition and results of operations.
These hazards can cause personal injury and loss of life, severe damage to or destruction of [added: property and equipment and other consequential damages and could lead to suspension of operations, large damage claims and, in extreme cases, criminal liability.]
An adverse outcome of such a review or examination could adversely affect our operating results and [removed: financial condition.]
A variety of events may cause the market price of our common stock to fluctuate significantly, including the following: (i) the risk factors described in this Annual Report on Form 10-K; (ii) a shortfall in operating revenue or net income from that expected by securities analysts and investors; (iii) quarterly fluctuations in our operating results; (iv) changes in securities analysts’ estimates of our financial performance or that of our competitors or companies in our industry generally; (v) general conditions in our customers’ [removed: industries, including as a result] [added: industries; (vi) general conditions in the securities markets; (vii) our announcements] of [added: significant contracts, milestones and acquisitions; (viii) our relationship with other companies; (ix) our investors’ view of] the [added: sectors and markets in which we operate; and (x) additions or departures of key personnel.]
Force majeure or extraordinary events beyond the control of the contracting parties, such as natural and man-made disasters, as well as outbreaks of infectious disease [removed: (_e.g._,] [added: (e.g.,] COVID-19) and terrorist actions, could negatively impact us.
We typically negotiate contract language through which we are granted certain relief from force majeure events in private client contracts and review and attempt to mitigate force majeure events in both public and private [removed: client contracts.]
transact business is likely to adversely impact our business.
If our surety companies
growth.
The implementation of new systems and information
financial condition.
client contracts.
The effects of the COVID-19 pandemic and related economic repercussions have materially affected how we and our customers, vendors, subcontractors, developers, and general contractors are operating our businesses, and the duration and extent to which this will negatively impact our future results of operations and overall financial performance remains uncertain.
The COVID-19 pandemic has negatively impacted the global economy, affected consumer spending and global supply chains, and created significant volatility and disruption of financial markets.
We have experienced resulting disruptions to our business operations.
The COVID-19 pandemic continues to present potential risks to our business, particularly in light of new variants of the virus which have emerged, such as the Omicron variant and the more recent BA.4 and BA.5 sub-variants of the virus.
The extent of the impact of the COVID-19 pandemic on our business and financial performance, including our ability to execute our near-term and long-term business strategies and initiatives in the expected time frame, depends on numerous evolving factors outside our control including: emergence of new variants of the virus and increased transmission rates; government, social, business and other actions that have been and will be taken in response to the COVID-19 pandemic; additional waves of COVID-19 infections; the efficacy of vaccines on new variants of the virus and overall vaccination rates; the effect of government or customer vaccine or testing requirements on employee retention and recruitment; and the effect of the COVID-19 pandemic on short- and long-term general economic conditions.
Even after the initial COVID-19 outbreak has subsided, we may continue to experience materially adverse impacts to our business as a result of its global economic impact.
We continue to experience permitting, regulatory, and supply chain delays attributable to the COVID-19 pandemic.
In addition to these current dynamics, the COVID-19 pandemic may create or exacerbate risks related to our operations and regulatory and compliance matters.
Even though the initial effects of the COVID-19 pandemic may have waned, our business, financial condition, results of operations or cash flows may continue to be adversely affected.
projects based on price alone due to their lower cost and financial return requirements.
increase our costs, or may cause projects to be cancelled.
In addition, flexible working arrangements at our corporate offices increased as a result of the COVID-19 pandemic, and these arrangements have resulted in a higher extent of remote working.
This and other possible changing work practices may adversely impact our ability to maintain the security, proper function and availability of our information technology and systems since remote working by our employees could strain our technology resources and introduce operational risk, including heightened cybersecurity risk.
Remote working environments may be less secure and more susceptible to hacking attacks, including phishing and social engineering attempts that have sought, and may seek, to exploit remote working environments.
property and equipment and other consequential damages and could lead to suspension of operations, large damage claims and, in extreme cases, criminal liability.
ongoing COVID-19 pandemic; (vi) general conditions in the securities markets; (vii) our announcements of significant contracts, milestones and acquisitions; (viii) our relationship with other companies; (ix) our investors’ view of the sectors and markets in which we operate; and (x) additions or departures of key personnel.
Item 7. Management’s Discussion and Analysis of Financial Condition and Results of Operations
114 rewritten, 58 added, 57 removed, 239 unchanged
We operate primarily in the commercial, industrial and institutional markets and perform most of our work in [removed: industrial,] [added: manufacturing,] healthcare, education, office, technology, retail and government facilities.
Approximately [removed: 87.0%] [added: 89.0%] of our revenue is earned on a project basis for installation services in newly constructed facilities or for replacement of systems in existing facilities.
As of December 31, [removed: 2022,] [added: 2023,] we had [removed: 10,636] [added: 10,481] projects in process.
Our average project takes six to nine months to complete, with an average contract price of approximately [removed: $875,000.][added: $1.1 million.]
Taken together, projects with contract prices of $2 million or more totaled [removed: $7.7] [added: $10.2] billion of aggregate contract value as of December 31, [removed: 2022,] [added: 2023,] or approximately [removed: 82%,] [added: 86%,] out of a total contract value for all projects in progress of [removed: $9.3] [added: $12.0] billion.
A stratification of projects in progress as of December 31, [removed: 2022,] [added: 2023,] by contract price, is as follows:
| $10 million - $20 million | | [removed: 112] [added: 125] | | | [removed: 1,645.6] [added: 1,761.0] | |
| $20 million - $40 million | | [removed: 82] [added: 96] | | | [removed: 2,345.3] [added: 2,688.2] | |
| Greater than $40 million | | [removed: 20] [added: 40] | | | [removed: 985.2] [added: 2,448.7] | |
In addition to project work, approximately [removed: 13.0%] [added: 11.0%] of our revenue represents maintenance and repair service on already installed HVAC, electrical, and controls systems.
We manage our [removed: 42] [added: 44] operating units based on a variety of factors.
As of December 31, [removed: 2022,] [added: 2023,] we had [removed: $580.8] [added: $779.8] million of credit available to borrow under our credit facility.
We have generated positive free cash flow in each of the last [removed: twenty-four] [added: twenty-five] calendar years and will continue our emphasis in this area.
Significant judgments and estimates are required in the determination of our income taxes, including the ability to recover our [removed: deferred tax assets based on assumptions about future taxable income.]
We record liabilities for uncertain tax positions when we determine whether it is more likely than not that the positions will be sustained based on their technical [removed: merits][added: merits, and we recognize tax benefits that are more than 50 percent likely to be realized upon ultimate settlement with the relevant taxing authority.]
| | | [removed: 2022] [added: 2023] | | | | | [removed: 2021] [added: 2022] | | | | | [removed: 2020] [added: 2021] | | | | |
| Revenue | | $ | [removed: 4,140,364] [added: 5,206,760] | | 100.0 | % | $ | [removed: 3,073,636] [added: 4,140,364] | | 100.0 | % | $ | [removed: 2,856,659] [added: 3,073,636] | | 100.0 | % |
| Cost of services | | | [removed: 3,398,756] [added: 4,216,251] | | [removed: 82.1] [added: 81.0] | % | | [removed: 2,510,429] [added: 3,398,756] | | [removed: 81.7] [added: 82.1] | % | | [removed: 2,309,676] [added: 2,510,429] | | [removed: 80.9] [added: 81.7] | % |
| Gross profit | | | [removed: 741,608] [added: 990,509] | | [removed: 17.9] [added: 19.0] | % | | [removed: 563,207] [added: 741,608] | | [removed: 18.3] [added: 17.9] | % | | [removed: 546,983] [added: 563,207] | | [removed: 19.1] [added: 18.3] | % |
| Selling, general and administrative expenses | | | [removed: 489,344] [added: 574,423] | | [removed: 11.8] [added: 11.0] | % | | [removed: 376,309] [added: 489,344] | | [removed: 12.2] [added: 11.8] | % | | [removed: 357,777] [added: 376,309] | | [removed: 12.5] [added: 12.2] | % |
| Gain on sale of assets | | | [removed: (1,585)] [added: (2,302)] | | — | | | [removed: (1,540)] [added: (1,585)] | | [removed: (0.1)] [added: —] | [removed: %] [added: ] | | [removed: (1,445)] [added: (1,540)] | | (0.1) | % |
| Operating income | | | [removed: 253,849] [added: 418,388] | | [removed: 6.1] [added: 8.0] | % | | [removed: 188,438] [added: 253,849] | | 6.1 | % | | [removed: 190,651] [added: 188,438] | | [removed: 6.7] [added: 6.1] | % |
| Interest income | | | [removed: 46] [added: 3,492] | | [removed: —] [added: 0.1] | [removed: ] [added: %] | | [removed: 24] [added: 46] | | — | | | [removed: 103] [added: 24] | | — | |
| Interest expense | | | [removed: (13,352)] [added: (10,281)] | | [removed: (0.3)] [added: (0.2)] | % | | [removed: (6,196)] [added: (13,352)] | | [removed: (0.2)] [added: (0.3)] | % | | [removed: (8,385)] [added: (6,196)] | | [removed: (0.3)] [added: (0.2)] | % |
| Changes in the fair value of contingent earn-out obligations | | | [removed: (4,819)] [added: (23,607)] | | [removed: (0.1)] [added: (0.5)] | % | | [removed: 7,820] [added: (4,819)] | | [removed: 0.3] [added: (0.1)] | % | | [removed: 9,119] [added: 7,820] | | 0.3 | % |
| Other income [removed: (expense)] | | | [removed: 134] [added: 202] | | — | | | [removed: 188] [added: 134] | | — | | | [removed: 52] [added: 188] | | — | |
| Income before income taxes | | | [removed: 235,858] [added: 388,194] | | [removed: 5.7] [added: 7.5] | % | | [removed: 190,274] [added: 235,858] | | [removed: 6.2] [added: 5.7] | % | | [removed: 191,540] [added: 190,274] | | [removed: 6.7] [added: 6.2] | % |
| Provision (benefit) for income taxes | | | [removed: (10,089)] [added: 64,796] | | | | | [removed: 46,926] [added: (10,089)] | | | | | [removed: 41,401] [added: 46,926] | | | |
| Net income | | $ | [removed: 245,947] [added: 323,398] | | | | $ | [removed: 143,348] [added: 245,947] | | | | $ | [removed: 150,139] [added: 143,348] | | | |
We had [removed: 41] [added: 44] operating locations as of December 31, [removed: 2021.][added: 2023.]
In the [removed: second] [added: first] quarter of [removed: 2022,] [added: 2023,] we completed the acquisition of [removed: Atlantic Electric, LLC (“Atlantic”),] [added: Eldeco, Inc. (“Eldeco”),] which reports as a separate operating location.
The same-store comparison from [removed: 2022] [added: 2023] to [removed: 2021,] [added: 2022,] as described below, excludes [removed: Atlantic,] [added: Eldeco,] which was acquired on [removed: April] [added: February] 1, [removed: 2022, MEP Holding Co., Inc. (“MEP Holdings”), which was acquired on December 31, 2021, eleven months of results for Ivey Mechanical Company, LLC (“Ivey”),] [added: 2023, DECCO,] which was acquired on [removed: December 1, 2021,] [added: October 2, 2023,] and [removed: seven] [added: three] months of results for [removed: Amteck Holdco] [added: Atlantic Electric,] LLC [removed: (“Amteck”),] [added: (“Atlantic”),] which was acquired on [removed: August] [added: April] 1, [removed: 2021.][added: 2022.]
The increase included a [removed: 12.9%] [added: 3.3%] increase [removed: primarily] related to the [removed: Amteck, Ivey, MEP Holdings] [added: Eldeco, DECCO] and Atlantic acquisitions, as well as a [removed: 21.8%] [added: 22.5%] increase in revenue related to same-store activity.
| | | [removed: 2022] [added: 2023] | | | [added: 2022] | | [removed: ] | 2021 | | | [removed: | |]
| Total | | $ | [removed: 4,140,364] [added: 5,206,760] | | 100.0 | % | | $ | [removed: 3,073,636] [added: 4,140,364] | | 100.0 | % |
Revenue for our mechanical [removed: services] segment increased [removed: $635.9] [added: $767.5] million, or [removed: 25.0%,] [added: 24.1%,] to [removed: $3.18] [added: $3.95] billion in [removed: 2022] [added: 2023] compared to [removed: 2021.][added: 2022.]
Of this increase, [removed: $164.9] [added: $12.8] million resulted from [removed: an additional eleven months of revenue related to] the [removed: Ivey acquisition,] [added: acquisition of DECCO,] and [removed: $471.0] [added: $754.7] million was attributable to same-store activity.
Revenue for our electrical [removed: services] segment increased [removed: $430.9] [added: $298.8] million, or [removed: 81.1%,] [added: 31.1%,] to [removed: $961.9 million] [added: $1.26 billion] in [removed: 2022] [added: 2023] compared to [removed: 2021.][added: 2022.]
The increase primarily resulted from [added: the acquisition of Eldeco ($115.5 million), as well as] an additional [removed: seven] [added: three] months of revenue related to the [removed: Amteck acquisition ($110.2 million), as well as the acquisitions of MEP Holdings ($90.6 million) and] Atlantic [removed: ($31.6] [added: acquisition ($6.7] million).
The same-store revenue increase of [removed: $198.5] [added: $176.6] million was primarily attributable to an increase in activity in the [removed: industrial] [added: technology] sector at our Texas electrical operation [removed: ($172.5] [added: ($96.3 million) and in the manufacturing sector at our North Carolina electrical operation ($49.4] million).
| Under $2 million | | 9,477 | | $ | 1,722.1 | |
| $2 million - $10 million | | 743 | | | 3,346.2 | |
| Total | | 10,481 | | $ | 11,966.2 | |
We experienced increasing demand in 2022 and 2023, and we expect that the demand environment, especially for industrial and technology customers, will remain at high levels in 2024.
Although we have largely recovered from negative impacts caused by the COVID-19 pandemic, we continue to experience increased labor costs, supply constraints and cost increases, and delays in delivery of various materials and equipment.
We expect that constraints and delays will continue to abate in 2024; however, we anticipate that pressure on cost and availability, especially for skilled labor, will continue throughout 2024.
deferred tax assets based on assumptions about future taxable income.
2023 Compared to 2022
In the fourth quarter of 2023, we completed the acquisition of DECCO, Inc. (“DECCO”), which reports as a separate operating location.
_Revenue_—Revenue increased $1.07 billion, or 25.8%, to $5.21 billion in 2023 compared to 2022.
The same-store revenue growth was largely driven by strong market conditions.
The increase in demand has been particularly strong in the technology and manufacturing sectors such as data centers, chip plants, food, pet food and pharmaceuticals.
| | | 2023 | | | | | | 2022 | | | | |
| Mechanical Segment | | $ | 3,946,022 | | 75.8 | % | | $ | 3,178,475 | | 76.8 | % |
| Electrical Segment | | | 1,260,738 | | 24.2 | % | | | 961,889 | | 23.2 | % |
The same-store revenue increase primarily resulted from an increase in activity in the technology sector at one of our Texas operations ($260.0 million) and our North Carolina operation ($158.0 million), and in the manufacturing sector at one of our Indiana operations ($92.4 million) and another one of our Texas operations ($49.2 million).
| | | December 31, 2023 | | | | | | December 31, 2022 | | | | |
| Mechanical Segment | | $ | 4,027,927 | | 78.1 | % | | $ | 3,299,630 | | 81.2 | % |
| Electrical Segment | | | 1,129,449 | | 21.9 | % | | | 764,113 | | 18.8 | % |
The year-over-year backlog increase included the acquisitions of Eldeco ($150.7 million) and DECCO ($29.7 million) as well as a same-store increase of $913.3 million, or 22.5%.
_Gross Profit_—Gross profit increased $248.9 million, or 33.6%, to $990.5 million in 2023 as compared to 2022.
As a percentage of revenue, gross profit increased from 17.9% in 2022 to 19.0% in 2023, primarily due to the factors discussed above and improvements in our electrical segment gross profit margin.
Our overall margin increases were partially offset by growth in modular construction jobs in 2023, which have lower margins than any of our other businesses.
The same-store increase is primarily due to higher same-store revenue and increased compensation costs ($59.9 million), largely attributable to increased headcount.
This increase was partially offset by a decrease in professional fees of $3.3 million as compared to the prior year related to the credit for increasing research activities (the “R&D tax credit”) for prior tax years.
| | | 2023 | | | 2022 | | |
| SG&A | | $ | 574,423 | | $ | 489,344 | |
| Same-store SG&A, excluding amortization expense | | $ | 520,200 | | $ | 452,918 | |
_Interest Income_—Interest income increased $3.4 million in 2023 as compared to 2022.
The increase in interest income is primarily due to interest awarded to us related to a dispute with a customer.
_Interest Expense_—Interest expense decreased $3.1 million, or 23.0%, in 2023 as compared to 2022.
Expense or income from changes in earn-out valuations may be more volatile in future periods due to large earn-out agreements for acquisitions that closed in the first quarter of 2024.
The effective rate for
2023 was lower than the 21% federal statutory rate due to the current year R&D tax credit (6.3%) and an increase in the R&D tax credit for the 2022 tax year (2.8%).
These R&D tax credit benefits were partially offset by net state income taxes (3.7%) and nondeductible expenses (1.5%).
As a result of conforming amendments made to the R&D tax credit in connection with the deferral of tax deductions for research and experimental (“R&E”) expenditures pursuant to the Tax Cuts and Jobs Act (2017), our provision for income taxes for the year ended December 31, 2023 benefited from a $10.0 million increase in the R&D tax credit.
Of the $10.0 million increase, $4.9 million related to the R&D tax credit for the 2022 tax year.
We experienced strong ongoing demand in 2023, and, although we have largely recovered from negative impacts caused by the COVID-19 pandemic, we continue to experience increased labor costs, supply constraints, and delays in delivery of various materials and equipment.
deployed in project work until our customer pays us.
2023 Compared to 2022
| Under $2 million | | 9,812 | | $ | 1,628.5 | |
| $2 million - $10 million | | 610 | | | 2,698.6 | |
| Total | | 10,636 | | $ | 9,303.2 | |
During the five-year period from 2015 to 2019, there was an increase in nonresidential building construction and renovation activity levels.
We believe that delays and air pockets have now substantially abated; however, we expect to continue to experience supply chain constraints and reduced labor availability during 2023.
and we recognize tax benefits that are more than 50 percent likely to be realized upon ultimate settlement with the relevant taxing authority.
_Revenue_—Revenue increased $1.07 billion, or 34.7%, to $4.14 billion in 2022 compared to 2021.
| Mechanical Services | | $ | 3,178,475 | | 76.8 | % | | $ | 2,542,623 | | 82.7 | % |
| Electrical Services | | | 961,889 | | 23.2 | % | | | 531,013 | | 17.3 | % |
The same-store revenue increase was broad-based and included an increase in activity in the industrial sector at our North Carolina operation ($79.5 million) and one of our Texas operations ($32.7 million), in the retail, restaurants and entertainment sector at one of our Florida operations ($35.0 million) and our Arizona operation ($26.0 million), and in the healthcare sector at another one of our Texas operations ($26.4 million).
| | | December 31, | | | | | | December 31, | | | | |
| Mechanical Services | | $ | 3,299,630 | | 81.2 | % | | $ | 1,753,340 | | 75.8 | % |
| Electrical Services | | | 764,113 | | 18.8 | % | | | 558,544 | | 24.2 | % |
The sequential backlog increase was partially offset by completion of project work at one of our Virginia operations ($70.0 million).
_Gross Profit_—Gross profit increased $178.4 million, or 31.7%, to $741.6 million in 2022 as compared to 2021.
The same-store increase in gross
Furthermore, we recorded an increase of $4.9 million in gross profit related to positive developments on legal matters in 2022.
As a percentage of revenue, gross profit decreased from 18.3% in 2021 to 17.9% in 2022 primarily due to a higher percentage of electrical segment revenue and new construction revenue in the current year, as well as materials and equipment being a higher percentage of our costs in the current year.
The same-store increase is primarily due to higher same-store revenue, an increase in consulting fees and other expenses of $4.7 million related to the credit for increasing research activities (the “R&D tax credit”) for prior tax years and increased compensation costs attributable to increased headcount ($33.1 million), as well as an increase in travel-related expenses ($4.4 million), which were lower in the prior year due to the impacts of COVID-19 on travel.
Additionally, bad debt expense increased $4.1 million on a same-store basis, primarily due to benefits recorded in the prior period when we lowered reserves to reflect the business impacts relating to COVID-19 stabilizing.
| SG&A | | $ | 489,344 | | $ | 376,309 | |
| Same-store SG&A, excluding amortization expense | | $ | 401,737 | | $ | 346,095 | |
_Interest Expense_—Interest expense increased $7.2 million, or 115.5%, in 2022.
Additionally, we expensed $0.2 million in the second quarter of 2022 related to the unamortized debt issuance costs for the term loan, which was refinanced in the amendment of our senior credit facility.
R&D tax credit for the current year 2022 (6.7%).
The effective rate for 2021 was higher than the 21% federal statutory rate primarily due to net state income taxes (3.9%) and nondeductible expenses, including nondeductible expenses related to TAS (1.3%), partially offset by reductions for stock-based compensation (1.2%) and the energy efficient commercial buildings deduction (the “179D deduction”) allocated to us (0.4%).
The decrease in our effective tax rate from 2021 to 2022 was primarily due to recognition of prior years’ tax benefits from the R&D tax credit for the 2016 through 2021 tax years following an IRS survey of our previously filed refund claims for 2016, 2017 and 2018.
The Joint Committee on Taxation approved such refunds in late January 2022.
2021 Compared to 2020
We experienced strong demand in 2022, and we believe that we have largely recovered from negative impacts to industry demand in our business due to the business disruption caused by COVID-19.
We are seeing fewer instances of delayed starts of new construction work; however, we continue to experience increased labor costs.
We also are experiencing supply constraints and cost increases, reduced availability, and delays in delivery of various materials and equipment.
| | | 2022 | | | 2021 | | | 2020 | | |
We made income tax payments of $52.6 million during 2022 related to the capitalization of research and experimental expenditures pursuant to the Tax Cuts and Jobs Act (2017).
These payments were partially offset by $33.3 million of income tax refunds received in early 2022.
These benefits were also partially offset by a $165.1 million change in receivables, net driven by the increase in revenue compared to the prior year.
The $276.4 million increase in
Such letters of credit are issued under the Facility for a fee.
Credit Facility Adjusted EBITDA is defined under the Facility for financial covenant purposes as consolidated net income for the four fiscal quarters ending as of any given quarterly covenant compliance measurement date, plus the corresponding amounts for (a) interest expense; (b) provision for income taxes; (c) depreciation and amortization; (d) stock or equity compensation; (e) other non-cash charges; and (f) pre-acquisition results of acquired companies.
The following is a reconciliation of Credit Facility Adjusted EBITDA to net income for 2022 (in thousands):
An excerpt. Shown here: 40 of 114 rewritten, 40 of 58 added and 40 of 57 removed. The counts are complete. For every sentence, read Item 7. Management’s Discussion and Analysis of Financial Condition and Results of Operations in the FY2023 filing and the FY2022 filing.
Item 7A. Quantitative and Qualitative Disclosures about Market Risk
4 rewritten, 5 added, 5 removed, 11 unchanged
The following table presents principal amounts (stated in thousands) and related average interest rates by year of maturity for our debt obligations at December 31, [removed: 2022:][added: 2023:]
| | | Twelve Months Ending December 31, | | | | | | | | | | | | | | [added: | |] | [added: |] | | [added: | |] | [added: |] | | [added: | |] | [added: |]
| | | [removed: 2023 | | |] 2024 | | | 2025 | | | 2026 | | | 2027 | | | [added: 2028 | | | | | |] Thereafter | | | [added: | | |] Total | | | [added: | | |]
The weighted average interest rate applicable to the borrowings under the revolving credit facility was approximately 5.7% as of December 31, [removed: 2022 and 1.4% as of December 31, 2021.][added: 2022.]
| | | | | | | | | | | | | | | | | | | | | | | | | | | | | | | | |
| --- | --- | --- | --- | --- | --- | --- | --- | --- | --- | --- | --- | --- | --- | --- | --- | --- | --- | --- | --- | --- | --- | --- | --- | --- | --- | --- | --- | --- | --- | --- | --- |
| Fixed Rate Debt | | $ | 4,867 | | $ | 21,701 | | $ | 14,144 | | $ | 3,500 | | $ | — | | | | | $ | — | | | | | $ | 44,212 | | | | |
| Average Interest Rate | | | 3.2% | | | 3.3% | | | 4.3% | | | 5.5% | | | — | | | | | | — | | | | | | 3.8% | | | | |
There were no outstanding borrowings on the revolving credit facility as of December 31, 2023.
| | | | | | | | | | | | | | | | | | | | | | | |
| --- | --- | --- | --- | --- | --- | --- | --- | --- | --- | --- | --- | --- | --- | --- | --- | --- | --- | --- | --- | --- | --- | --- |
| Fixed Rate Debt | | $ | 9,000 | | $ | 7,332 | | $ | 22,269 | | $ | 2,644 | | $ | — | | $ | — | | $ | 41,245 | |
| Average Interest Rate | | | 2.5% | | | 2.5% | | | 2.5% | | | 2.5% | | | — | | | — | | | 2.5% | |
| Variable Rate Debt | | $ | — | | $ | — | | $ | — | | $ | — | | $ | 215,000 | | $ | — | | $ | 215,000 | |
Item 1. Business
51 rewritten, 17 added, 28 removed, 168 unchanged
We build, install, maintain, repair and replace mechanical, electrical and plumbing (“MEP”) systems throughout our [removed: 42] [added: 44] operating units with [removed: 169] [added: 172] locations in [removed: 128] [added: 131] cities throughout the United States.
We operate primarily in the commercial, industrial and institutional MEP markets and perform most of our services in [removed: industrial,] [added: manufacturing,] healthcare, education, office, technology, retail and government facilities.
Substantially all of our consolidated [removed: 2022] [added: 2023] revenue was derived from commercial, industrial and institutional customers and multi-family residential projects.
Approximately [removed: 48.6%] [added: 54.8%] of our revenue was attributable to installation services in newly constructed facilities and [removed: 51.4%] [added: 45.2%] was attributable to renovation, expansion, maintenance, repair and replacement services in existing buildings.
Our consolidated [removed: 2022] [added: 2023] revenue was derived from the following service industries:
| Mechanical Services | | [removed: 76.8] [added: 75.8] | % |
| Electrical Services | | [removed: 23.2] [added: 24.2] | % |
| | ● | construction of and installation in new buildings, which provided approximately [removed: 48.6%] [added: 54.8%] of our revenue in [removed: 2022,] [added: 2023,] and |
| | ● | renovation, expansion, maintenance, repair and replacement in existing buildings, which provided the remaining [removed: 51.4%] [added: 45.2%] of our [removed: 2022] [added: 2023] revenue. |
We focus on strengthening core operating competencies, on leading in sustainability, [removed: efficiency] [added: efficiency,] and technological improvement, and on [removed: increasing profit margins.][added: being fairly compensated for the work we do and the risks we manage on behalf of our customers.]
_Attract, Retain and Invest in our Employees_—We seek to attract and retain quality employees by providing [removed: them] an enhanced career path that offers a stable income, attractive [removed: benefits packages,] [added: benefits,] and excellent growth opportunities.
[removed: We believe that] these complex markets are attractive because of their growth opportunities, large and diverse customer base, attractive margins, and potential for long-term relationships with building owners.
We opportunistically allocate our engineering, field, and supervisory labor from [added: one operation to another to use our employee base more fully, meet our customers’ needs and share expertise.]
Our distribution of revenue in [removed: 2022] [added: 2023] by end-use sector was as follows:
| Office Buildings | | [removed: 8.4] [added: 7.7] | % |
| Retail, Restaurants and Entertainment | | [removed: 7.5] [added: 6.0] | % |
| Multi-Family and Residential | | [removed: 3.0] [added: 3.5] | % |
Approximately [removed: 87.0%] [added: 89.0%] of our revenue is earned on a project basis for installation of systems in newly constructed or existing facilities.
As of December 31, [removed: 2022,] [added: 2023,] we had [removed: 10,636] [added: 10,481] projects in process with an aggregate contract value of approximately [removed: $9.3] [added: $12.0] billion.
Our average project takes six to nine months to complete, with an average contract price of approximately [removed: $875,000.][added: $1.1 million.]
This average project size, when taken together with the approximately [removed: 13.0%] [added: 11.0%] of our revenue derived from maintenance and service, provides us with a broad base of work in the construction services sector.
Above all, we have concluded that as technology develops in our [removed: industry] [added: industry,] the fundamental prerequisite for leadership is adopting such opportunities in the quality, accuracy, and buildability of our designs.
Accordingly, we have invested in [removed: the] experts, training, and internal and external knowledge transfer to ensure that we are properly scaling, [removed: achieving true] [added: optimizing] buildability, and fundamentally and continuously improving our design capabilities to meet our customers’ evolving requirements.
Our goal is to use our scale and strategic investments to maintain a leading position in design and modeling excellence, [removed: optimize] [added: increase] productivity and quality, and ultimately position ourselves to capitalize from ongoing or future technological developments.
Through recent and ongoing development and acquisitions, we plan to continue to improve [removed: on] our unmatched capability in mechanical off-site or modular construction.
_Service Growth Initiative_—Over the last several [removed: years] [added: years,] we have made substantial investments to expand our service and maintenance revenue by increasing the value we can offer to service and maintenance customers.
We are actively concentrating managerial and sales resources on training and hiring experienced employees to sell and [removed: profitably perform service work.]
_Construction and Installation Services for New Buildings_—Our installation business related to newly constructed facilities, which comprised approximately [removed: 48.6%] [added: 54.8%] of our consolidated [removed: 2022] [added: 2023] revenue, involves the design, engineering, integration, installation and start-up of MEP and related systems.
In many [removed: instances] [added: instances,] we fabricate ductwork, conduit and piping and assemble certain components for the system based on the mechanical drawing specifications.
We also perform larger project work, with [removed: 824] [added: 1,004] contracts in progress at December 31, [removed: 2022] [added: 2023] with contract prices in excess of $2 million.
Our largest project in progress at December 31, [removed: 2022] [added: 2023] had a contract price of [removed: $74.5] [added: $149.6] million.
_Renovation, Expansion, Maintenance, Monitoring, Repair and Replacement Services for Existing Buildings_—Our renovation, expansion, maintenance, monitoring, repair and replacement services in existing buildings comprised approximately [removed: 51.4%] [added: 45.2%] of our consolidated [removed: 2022] [added: 2023] revenue.
Service calls are coordinated by customer service representatives or dispatchers [removed: that use computer and communication technology] to process orders, arrange service calls, dispatch technicians and communicate with and invoice customers.
The raw materials and components we [removed: use] [added: install and service] include MEP system [removed: components,] [added: components such as] ductwork, pipe, [removed: conduit, wire,] [added: valves, fittings,] electrical [removed: fixtures, steel, sheet metal] [added: wire, conduit] and [removed: copper tubing] [added: fixtures, fabricated steel] and [removed: piping.][added: sheet metal.]
[removed: In] [added: During] ordinary times, delivery times are typically short for most raw materials and standard [removed: components, but during periods of peak demand, including as we continue to experience the effects of the pandemic, may extend to several months.][added: components.]
We estimate that [added: the] direct purchase of commodities and finished products comprises between 40% and 45% of our average project cost.
We have a diverse customer base, with our top customer representing [removed: 8%] [added: 14%] of consolidated [removed: 2022 revenue, and our largest customer often changes from year to year.][added: 2023 revenue.]
_Employees_—As of December 31, [removed: 2022,] [added: 2023,] we had approximately [removed: 14,100] [added: 15,800] employees as compared to approximately [removed: 13,200] [added: 14,100] employees as of December 31, [removed: 2021.][added: 2022.]
We have collective bargaining agreements covering [removed: 12] [added: 7] employees.
The Code of Conduct is regularly reinforced to the Company’s employees and management through periodic ethics, equal opportunity employment, and anti-corruption [removed: trainings.]
At Comfort Systems USA, Inc., our core purpose is to “Build Legacies” with our people, customers, and the companies who join us.
To accomplish this purpose, we strive every day to be the best organization in the world (i) for a craft worker to build a successful career, (ii) for construction, service and administrative professionals to grow and thrive, (iii) for customers to meet their crucial building and service needs, and (iv) for any company in our industry to join with the assurance that their people will be respected and nurtured and that their legacy will be perpetuated and built upon.
We believe that
| Manufacturing | | 33.6 | % |
| Technology | | 21.4 | % |
| Healthcare | | 10.6 | % |
| Education | | 9.5 | % |
| Government | | 5.8 | % |
| Other | | 1.9 | % |
profitably perform service work.
Our average project takes six to nine months to complete, with an average contract price of approximately $1.1 million.
However, during periods of peak demand, including recent residual effects of the COVID-19 pandemic, lead-times for certain components may extend to several months.
Orders for manufactured commercial HVAC equipment, electrical switch gear, and large application power generators have experienced the longest lead-times, and it is not uncommon for lead-times to be greater than six months.
The primary manufacturers of the major components in a commercial MEP system are: Trane, Carrier, York, Daikin (chillers and roof tops units), Baltimore Aircoil and SPX (cooling towers), Schneider Electric, Eaton, ABB (electrical switchgear), Caterpillar, Cummins, Kohler (power generators), Johnson Controls, Automated Logic and Siemens (building automation).
Our largest customer can change from year to year.
trainings.
In 2023, we continued our efforts to adhere to voluntary reporting standards by (i) submitting to CDP (formerly the Carbon Disclosure Project), wherein, among other things, we disclosed the results of our annual greenhouse gas emissions inventory, and (ii) publishing our 2022 sustainability report, which followed the Task Force on Climate-related Financial Disclosures and the Sustainability Accounting Standard Board’s standards for the Engineering and Construction Services industry and the Global Reporting Initiative Standards: Core option.
one operation to another to use our employee base more fully, meet our customers’ needs and share expertise.
| Industrial | | 47.7 | % |
| Healthcare | | 14.1 | % |
| Education | | 10.8 | % |
| Government | | 6.2 | % |
| Other | | 2.3 | % |
A stratification of projects in progress as of December 31, 2022, by contract price, is as follows:
| | | | | | | |
| --- | --- | --- | --- | --- | --- | --- |
| | | | | Aggregate | | |
| | | | | Contract | | |
| | | No. of | | Price Value | | |
| Contract Price of Project | | Projects | | (millions) | | |
| Under $2 million | | 9,812 | | $ | 1,628.5 | |
| $2 million - $10 million | | 610 | | | 2,698.6 | |
| $10 million - $20 million | | 112 | | | 1,645.6 | |
| $20 million - $40 million | | 82 | | | 2,345.3 | |
| Greater than $40 million | | 20 | | | 985.2 | |
| Total | | 10,636 | | $ | 9,303.2 | |
Chillers, electrical switch gear and generators for large applications typically have the longest delivery time and frequently have lead times of six months or even longer.
The major components of commercial MEP systems are compressors and chillers that are manufactured primarily by Carrier, Lennox, Daikin, Trane, and York.
The major suppliers of building automation control systems are Automated Logic, Cisco, Delta, Distech Controls, Honeywell, Johnson Controls, Rockwell Automation, Schneider Electric, Siemens, Trane, and York.
The major suppliers of electrical switchgear and generators are Caterpillar, Cummins, Eaton and Schneider Electric.
parties, serve as an extension of the Company.
Additionally, we have increased our voluntary reporting through a submission to CDP (formerly the Carbon Disclosure Project), wherein, among other things, we disclosed the results of our first annual greenhouse gas emissions inventory.
Such additional reporting is a continuation of our efforts to adhere to voluntary reporting standards.
For example, in 2022, we received a silver medal as a result of our EcoVadis submission, and we published our second sustainability report (i) following the Task Force on Climate-related Financial Disclosures (“TCFD”) and the Sustainability Accounting Standard Board’s (“SASB”) standards for the Engineering and Construction Services industry, and (ii) in accordance with the Global Reporting Initiative (“GRI”) Standards: Core option.
If
An excerpt. Shown here: 40 of 51 rewritten, all 17 added and all 28 removed. The counts are complete. For every sentence, read Item 1. Business in the FY2023 filing and the FY2022 filing.
Item 3. Legal Proceedings
2 rewritten, 3 added, 0 removed, 6 unchanged
The largest change resulted from favorable developments related to a dispute with a customer regarding the outcome of a completed project as well as the obligation to perform subcontract work under two executed letters of intent for subsequent projects that we [removed: believed were not enforceable.]
As of December 31, [removed: 2022,] [added: 2023,] we recorded an accrual for unresolved matters, which is not material to our financial statements, based on our analysis of likely outcomes related to the respective matters; however, it is possible that the ultimate outcome and associated costs will deviate from our estimates and that, in the event of an unexpectedly adverse outcome, we may experience additional costs and expenses in future periods.
In the first quarter of 2023, we recorded a pre-tax gain of $6.8 million from legal developments and settlements that primarily relate to disputes with customers regarding the outcome of completed projects as well as an obligation to perform subcontract work under two executed letters of intent for subsequent projects that we believed were not enforceable.
The pre-tax gain of $6.8 million was recorded as an increase in gross profit of $6.6 million, a reduction in SG&A of $0.7 million, an increase in interest income of $1.3 million and an increase in the change in fair value of contingent earn-out obligations expense of $1.8 million in our Consolidated Statements of Operations.
believed were not enforceable.
Cover and table of contents
15 rewritten, 1 added, 0 removed, 84 unchanged
| For the fiscal year ended December 31, [removed: 2022] [added: 2023] | |
Indicate by check mark whether any of those error corrections are restatements that required a [removed: recover] [added: recovery] analysis of incentive-based compensation received by any of the registrant’s executive officers during the relevant [removed: recover] [added: recovery] period pursuant to §240.10D-1(b).
The aggregate market value of the voting stock held by non-affiliates of the registrant at June 30, [removed: 2022] [added: 2023] was approximately [removed: $2.91] [added: $5.75] billion, based on the [removed: $83.15] [added: $164.20] last sale price of the registrant’s common stock on the New York Stock Exchange on June 30, [removed: 2022.][added: 2023.]
As of February 16, [removed: 2023, 35,738,041] [added: 2024, 35,684,609] shares of the registrant’s common stock were outstanding (excluding treasury shares of [removed: 5,385,324).][added: 5,438,756).]
The information required by Part III (other than the required information regarding executive officers) is incorporated by reference from the registrant’s definitive proxy statement, which will be filed with the Commission not later than 120 days following December 31, [removed: 2022.][added: 2023.]
| [Item 1B.](#ITEM1BUnresolvedStaffComments_139610) | [Unresolved Staff Comments](#ITEM1BUnresolvedStaffComments_139610) | [removed: 23] [added: 22] |
| [Item 2.](#ITEM2Properties_592424) | [Properties](#ITEM2Properties_592424) | [removed: 23] [added: 24] |
| [Item 4.](#ITEM4MineSafetyDisclosures_231930) | [Mine Safety Disclosures](#ITEM4MineSafetyDisclosures_231930) | [removed: 24] [added: 25] |
| [Item 4A.](#ITEM4AExecutiveOfficersoftheRegistrant_3) | [Executive Officers of the Registrant](#ITEM4AExecutiveOfficersoftheRegistrant_3) | [removed: 24] [added: 25] |
| [Item 5.](#ITEM5MarketforRegistrantsCommonEquityRel) | [Market for Registrant’s Common Equity, Related Stockholder Matters and Issuer Purchases of Equity Securities](#ITEM5MarketforRegistrantsCommonEquityRel) | [removed: 25] [added: 26] |
| [Item 6.](#ITEM6SelectedFinancialData_853719) | [Reserved](#ITEM6SelectedFinancialData_853719) | [removed: 27] [added: 28] |
| [Item 7.](#ITEM7ManagementsDiscussionandAnalysisofF) | [Management’s Discussion and Analysis of Financial Condition and Results of Operations](#ITEM7ManagementsDiscussionandAnalysisofF) | [removed: 27] [added: 28] |
| [Item 7A.](#ITEM7AQuantitativeandQualitativeDisclosu) | [Quantitative and Qualitative Disclosures about Market Risk](#ITEM7AQuantitativeandQualitativeDisclosu) | [removed: 39] [added: 40] |
| [Item 9.](#ITEM9ChangesinandDisagreementswithAccoun) | [Changes in and Disagreements with Accountants on Accounting and Financial Disclosure](#ITEM9ChangesinandDisagreementswithAccoun) | [removed: 76] [added: 75] |
| [Item 9A.](#ITEM9AControlsandProcedures_403685) | [Controls and Procedures](#ITEM9AControlsandProcedures_403685) | [removed: 76] [added: 75] |
| [Item 1C.](#ITEM1CCybersecurity) | [Cybersecurity](#ITEM1CCybersecurity) | 23 |
Item 1C. Cybersecurity
0 rewritten, 30 added, 0 removed, 0 unchanged
New section this year
Risk Management and Strategy
The Company has adopted processes designed to identify, assess and manage material risks from cybersecurity threats, and the Company’s full Board and management is actively involved in overseeing the risk management process.
These processes include response to, and an assessment of, internal and external threats to the security, confidentiality, integrity and availability of Company data and systems, along with other material risks to Company operations.
We recognize the critical importance of maintaining the trust and confidence of our customers, business partners and employees.
As part of our risk management process, the Company engages in the periodic assessment and testing of the Company’s policies, standards, processes and practices that are designed to address cybersecurity threats and incidents.
These efforts include a wide range of activities, including audits, assessments, tabletop exercises, threat modeling, vulnerability testing and other exercises focused on evaluating the effectiveness of our cybersecurity measures and planning.
The Company regularly engages third parties to perform assessments on our cybersecurity measures, including information security maturity assessments, audits and independent reviews of our information security control environment and operating effectiveness.
The results of such assessments, audits and reviews are reported to the Board, and the Company adjusts its cybersecurity policies, standards, processes and practices as necessary based on the information provided by these assessments, audits and reviews.
The Company’s cybersecurity program is focused on the following key areas:
- Departmental Collaboration: The Company has implemented a comprehensive, cross-functional approach to identifying, preventing and mitigating cybersecurity threats and incidents, while also implementing controls and procedures that provide for the prompt escalation of cybersecurity incidents so that decisions regarding the public disclosure and reporting of such incidents can be made by management in a timely manner.
- Technical Safeguards: The Company deploys technical safeguards that are designed to protect the Company’s information systems from cybersecurity threats and are evaluated and improved through vulnerability assessments and cybersecurity threat intelligence.
- Incident Response and Recovery Planning: The Company has established and maintains comprehensive incident response and recovery plans that fully address the Company’s response to a cybersecurity incident, and such plans are tested and evaluated on a regular basis.
- Third-Party Risk Management: The Company maintains a comprehensive, risk-based approach to identifying and overseeing cybersecurity risks presented by third parties, including vendors, service providers, potential acquisition targets and other external users of the Company’s systems, as well as the systems of third parties that could adversely impact our business in the event of a cybersecurity incident affecting those third-party systems.
- Education and Awareness: The Company provides regular training for personnel regarding cybersecurity threats as a means to equip the Company’s personnel with effective tools to address cybersecurity threats, and to communicate the Company’s evolving information security policies, standards, processes and practices.
- Governance: As discussed in more detail under the heading “Governance,” the Board’s oversight of cybersecurity risk management is supported by members of management and relevant management committees.
Cybersecurity threats, including as a result of any previous cybersecurity incidents, have not materially affected and are not reasonably likely to materially affect the Company, including its business strategy, results of operations or financial condition.
However, because of the inherent nature of cybersecurity threats and the evolution of such threats over time, the Company’s processes, oversight and risk management cannot provide absolute assurance that a cybersecurity threat will not have a material effect on the Company in the future.
Governance
The Company has established a risk committee (the “Risk Committee”) consisting of executive officers, including the Company’s Chief Information Security Officer (“CISO”), that is directly responsible for the Company’s risk management process.
The Company’s cybersecurity policies, standards, and practices are integrated into the Company’s risk management process.
The Board oversees information technology, data security, and cybersecurity risk management through regular reports and presentations from the CISO and other management members.
Vance Tang, Chair of the Nominating, Governance, and Sustainability Committee, serves as the Board Liaison for Cybersecurity.
Mr. Tang has completed extensive training on cybersecurity risk mitigation, including certification related to completion of the NACD Cyber Risk Oversight Program.
The Risk Committee meets at least annually to define and improve the risk-mapping process and considers any updates at least quarterly.
In addition, the Risk Committee presents comprehensive reports directly to the Board at least annually through the enterprise risk management matrix, which, as described below, is reviewed by the Audit Committee.
The Company’s Audit Committee is briefed on cybersecurity risks at least once each calendar year and as necessary with respect to any material cybersecurity incidents.
The Audit Committee also reviews the enterprise risk management matrix presented by the Risk Committee on an annual basis.
The process of reviewing the matrix includes an overall assessment of the Company’s compliance with cybersecurity policies, including topics such as risk assessment, risk management and control decisions, service provider arrangements, test results, security incidents and responses, and recommendations for changes and updates to policies and procedures.
Item 2. Properties
2 rewritten, 0 added, 0 removed, 9 unchanged
As of December 31, [removed: 2022,] [added: 2023,] we owned [removed: 15] [added: 16] properties.
Leased premises range in size from approximately 1,000 square feet to [removed: 175,000] [added: 500,000] square feet.
Item 4A. Executive Officers of the Registrant
6 rewritten, 0 added, 0 removed, 32 unchanged
Lane,_ age [removed: 65,] [added: 66,] has served as our Chief Executive Officer and President since December 2011 and as a director since November 2010.
_William George,_ age [removed: 58,] [added: 59,] has served as our Executive Vice President and Chief Financial Officer since May 2005, was our Senior Vice President, General Counsel and Secretary from May 1998 to May 2005, and was our Vice President, General Counsel and Secretary from March 1997 to April 1998.
Shaeff,_ age [removed: 57,] [added: 58,] has served as our Senior Vice President and Chief Accounting Officer since May 2005, was our Vice President and Corporate Controller from March 2002 to May 2005, and was our Assistant Corporate Controller from September 1999 to February 2002.
McKenna,_ age [removed: 50,] [added: 51,] has served as Executive Vice President and Chief Operating Officer since January 2022 and was formerly Senior Vice President and Chief Operating Officer during 2021.
Howell,_ age [removed: 35,] [added: 36,] has served as Senior Vice President and General Counsel for the Company since January 2022 and formerly served as Vice President and General Counsel from January 2019 to December 2021.
_Terrence Reed_, age [removed: 63,] [added: 64,] has served as Senior Vice [added: President, Chief Human Resources Officer since January 2024 and formerly served as Senior Vice] President of People and Leadership Development [removed: for the Company since] [added: from] March [removed: 2021.][added: 2021 to December 2023.]
Item 5. Market for Registrant’s Common Equity, Related Stockholder Matters and Issuer Purchases of Equity Securities
6 rewritten, 13 added, 13 removed, 22 unchanged
As of February 16, [removed: 2023,] [added: 2024,] there were approximately [removed: 285] [added: 262] stockholders of record of our Common Stock, and the last reported sale price on that date was [removed: $125.88] [added: $248.50] per share.
The following Corporate Performance Graph and related information shall not be deemed “soliciting material” or to be “filed” with the SEC, nor shall such information be incorporated by reference into any future filing under the Securities Act [added: of 1933 (the “Securities Act”)] or the Exchange Act, except to the extent that we specifically incorporate it by reference into such filing.
[removed: 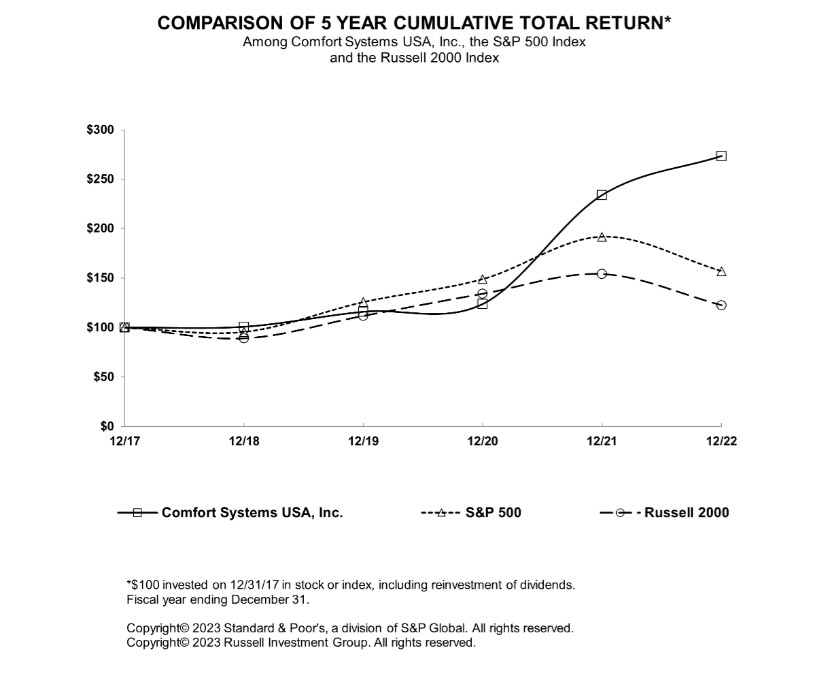][added: ]
As of December 31, [removed: 2022,] [added: 2023,] we have repurchased a cumulative total of [removed: 10.1] [added: 10.3] million shares at an average price of [removed: $24.52] [added: $26.27] per share under the repurchase program.
During the year ended December 31, [removed: 2022,] [added: 2023,] we repurchased [removed: 0.4] [added: 0.1] million shares for approximately [removed: $38.2] [added: $21.3] million at an average price of [removed: $86.45] [added: $152.75] per share.
During the year ended December 31, [removed: 2022,] [added: 2023,] we purchased our common shares in the following amounts at the following average prices:
| January 1 - January 31 | | 17,100 | | $ | 116.89 | | 10,133,946 | | 810,179 | |
| February 1 - February 28 | | 8,500 | | $ | 122.13 | | 10,142,446 | | 801,679 | |
| March 1 - March 31 | | 3,800 | | $ | 139.69 | | 10,146,246 | | 797,879 | |
| April 1 - April 30 | | 22,200 | | $ | 132.20 | | 10,168,446 | | 775,679 | |
| May 1 - May 31 | | 300 | | $ | 149.28 | | 10,168,746 | | 775,379 | |
| June 1 - June 30 | | 1,500 | | $ | 152.26 | | 10,170,246 | | 773,879 | |
| July 1 - July 31 | | 500 | | $ | 154.60 | | 10,170,746 | | 773,379 | |
| August 1 - August 31 | | — | | $ | — | | 10,170,746 | | 773,379 | |
| September 1 - September 30 | | 9,750 | | $ | 175.37 | | 10,180,496 | | 763,629 | |
| October 1 - October 31 | | 65,250 | | $ | 164.81 | | 10,245,746 | | 698,379 | |
| November 1 - November 30 | | 5,278 | | $ | 186.26 | | 10,251,024 | | 693,101 | |
| December 1 - December 31 | | 5,300 | | $ | 189.79 | | 10,256,324 | | 687,801 | |
| | | 139,478 | | $ | 152.75 | | 10,256,324 | | 687,801 | |
| January 1 - January 31 | | 52,203 | | $ | 89.68 | | 9,727,000 | | 566,751 | |
| February 1 - February 28 | | 82,012 | | $ | 86.07 | | 9,809,012 | | 484,739 | |
| March 1 - March 31 | | 27,399 | | $ | 86.05 | | 9,836,411 | | 457,340 | |
| April 1 - April 30 | | — | | $ | — | | 9,836,411 | | 457,340 | |
| May 1 - May 31 | | 156,680 | | $ | 84.33 | | 9,993,091 | | 951,034 | |
| June 1 - June 30 | | 70,009 | | $ | 79.19 | | 10,063,100 | | 881,025 | |
| July 1 - July 31 | | 4,496 | | $ | 82.13 | | 10,067,596 | | 876,529 | |
| August 1 - August 31 | | — | | $ | — | | 10,067,596 | | 876,529 | |
| September 1 - September 30 | | 32,050 | | $ | 99.97 | | 10,099,646 | | 844,479 | |
| October 1 - October 31 | | 13,200 | | $ | 100.15 | | 10,112,846 | | 831,279 | |
| November 1 - November 30 | | — | | $ | — | | 10,112,846 | | 831,279 | |
| December 1 - December 31 | | 4,000 | | $ | 116.65 | | 10,116,846 | | 827,279 | |
| | | 442,049 | | $ | 86.45 | | 10,116,846 | | 827,279 | |
Item 8. Financial Statements and Supplementary Data
390 rewritten, 158 added, 136 removed, 682 unchanged
| [Report of Independent Registered Public Accounting [removed: Firm](#ReportofIndependentRegisteredPublicAccou)] [added: Firm](#ReportOfIndependentRegisteredPublic)] (PCAOB ID No. 34) | | 42 |
| [Consolidated Balance Sheets](#CONSOLIDATEDBALANCESHEETS_522126) | | [removed: 45] [added: 44] |
| [Consolidated Statements of Operations](#CONSOLIDATEDSTATEMENTSOFOPERATIONS_39514) | | [removed: 46] [added: 45] |
| [Consolidated Statements of Stockholders’ Equity](#STATEMENTSOFSTOCKHOLDERSEQUITY_511143) | | [removed: 47] [added: 46] |
| [Consolidated Statements of Cash Flows](#STATEMENTSOFCASHFLOWS_915327) | | [removed: 48] [added: 47] |
| [Notes to Consolidated Financial Statements](#NOTESTOCONSOLIDATEDFINANCIALSTATEMENTS_6) | | [removed: 49] [added: 48] |
We have audited the accompanying consolidated balance sheets of Comfort Systems USA, Inc. and its consolidated subsidiaries (the “Company”) as of December 31, [removed: 2022] [added: 2023] and [removed: 2021,] [added: 2022,] the related consolidated statements of operations, stockholders’ equity, and cash flows, for each of the [removed: two] [added: three] years in the period ended December 31, [removed: 2022,] [added: 2023,] and the related notes (collectively, referred to as the “financial statements”).
In our opinion, the financial statements present fairly, in all material respects, the financial position of the Company as of December 31, [removed: 2022] [added: 2023] and [removed: 2021,] [added: 2022,] and the results of its operations and its cash flows for each of the [removed: two] [added: three] years in the period ended December 31, [removed: 2022,] [added: 2023,] in conformity with accounting principles generally accepted in the United States of America.
We have also audited, in accordance with the standards of the Public Company Accounting Oversight Board (United States) (PCAOB), the Company’s internal control over financial reporting as of December 31, [removed: 2022,] [added: 2023,] based on criteria established in _Internal [removed: Control—Integrated] [added: Control — Integrated] Framework (2013)_ issued by the Committee of Sponsoring Organizations of the Treadway Commission and our report dated February 22, [removed: 2023,] [added: 2024,] expressed an unqualified opinion on the Company’s internal control over financial reporting.
The critical audit matter communicated below is a matter arising from the current-period audit of the [removed: consolidated] financial statements that was communicated or required to be communicated to the audit committee and that (1) relates to accounts or disclosures that are material to the [removed: consolidated] financial statements and (2) involved our especially challenging, subjective, or complex judgments.
The communication of [removed: a] [added: this] critical audit matter does not alter in any way our opinion on the [removed: consolidated] financial statements, taken as a whole, and we are not, by communicating the critical audit matter below, providing a separate opinion on the critical audit matter or on the accounts or disclosures to which it relates.
Revenue from Contracts with [removed: Customers–Refer] [added: Customers – Refer] to Notes 2 and 3 to the [removed: consolidated financial statements][added: Consolidated Financial Statements]
[removed: Such revisions are] frequently based on further estimates and subjective assessments.
Our audit procedures related to management’s estimates and judgments included within the Company’s estimated total costs at [removed: completion,] [added: contract completion for its contracts with customers] included the following, among others:
| ● | We tested the operating effectiveness of controls over the recognition of revenue, including those over the determination of estimated [added: total] costs at [added: contract] completion [removed: of the contracts] (including the estimated progress toward completion). |
| ● | We developed an independent expectation of recorded revenue at certain operating units using analytical procedures [removed: and considering] [added: to incorporate] relevant current and historical information and compared our expectations to the recorded revenue for the operating unit. |
| | o | Evaluated the reasonableness of management’s estimates of total costs and profit at [added: contract] completion by: |
| | ◾ | Evaluating management’s estimate of total costs at [removed: completion for each selected] contract [added: completion] by performing corroborating inquiries with the Company’s project managers and personnel involved with the [removed: selected] contracts, and comparing the estimates to management’s workplans, suppliers’ contracts, subcontract agreements, third-party invoices from suppliers, historical actual results, and/or engineering specifications. |
| | ◾ | Evaluating management’s ability to accurately estimate total costs and profits at [added: contract] completion by analyzing the comparison of actual costs and profits [added: for completed projects] or current year [removed: estimates] [added: estimated costs of completion] to prior year management’s estimates. |
| | ◾ | Evaluating changes in estimates [removed: and] [added: of total costs at contract completion by] obtaining evidence regarding timing and amounts supporting these changes in estimates such as approved change order documents, communications with the customer, subcontract agreements and related amendments, [added: and] recent actual [removed: costs, and other sources.] [added: costs.] |
| | | [added: | 2023 | | |] 2022 | | | 2021 | | [removed: ] |
| [removed: Cash and cash equivalents] [added: CASH AND CASH EQUIVALENTS, beginning of period] | | [removed: $] | 57,214 | | [removed: $] | 58,776 | | [added: | 54,896 | |]
| Billed accounts receivable, less allowance for credit losses of [removed: $10,640] [added: $11,926] and [removed: $8,808,] [added: $10,640,] respectively | | | [removed: 1,024,082] [added: 1,318,926] | | | [removed: 773,716] [added: 1,024,082] | |
| Unbilled accounts receivable, less allowance for credit losses of [removed: $1,011] [added: $850] and [removed: $715,] [added: $1,011,] respectively | | | [removed: 77,030] [added: 72,774] | | | [removed: 61,881] [added: 77,030] | |
| Other receivables, less allowance for credit losses of [removed: $510] [added: $522] and [removed: $503,] [added: $510,] respectively | | | [removed: 38,369] [added: 166,319] | | | [removed: 57,491] [added: 38,369] | |
| Inventories | | | [removed: 35,309] [added: 65,538] | | | [removed: 21,853] [added: 35,309] | |
| Prepaid expenses and other | | | [removed: 48,456] [added: 54,309] | | | [removed: 23,704] [added: 48,456] | |
| Costs and estimated earnings in excess of billings, less allowance for credit losses of [removed: $80] [added: $79] and [removed: $84,] [added: $80,] respectively | | | [removed: 27,211] [added: 28,084] | | | [removed: 29,900] [added: 27,211] | |
| Total current assets | | | [removed: 1,307,671] [added: 1,911,100] | | | [removed: 1,027,321] [added: 1,307,671] | |
| PROPERTY AND EQUIPMENT, NET | | | [removed: 143,949] [added: 208,568] | | | [removed: 128,554] [added: 143,949] | |
| LEASE RIGHT-OF-USE ASSET | | | [removed: 130,666] [added: 205,712] | | | [removed: 124,756] [added: 130,666] | |
| GOODWILL | | | [removed: 611,789] [added: 666,834] | | | [removed: 592,114] [added: 611,789] | |
| IDENTIFIABLE INTANGIBLE ASSETS, NET | | | [removed: 273,901] [added: 280,397] | | | [removed: 304,781] [added: 273,901] | |
| DEFERRED TAX ASSETS | | | [removed: 115,665] [added: 17,723] | | | [removed: 22,905] [added: 115,665] | |
| OTHER NONCURRENT ASSETS | | | [removed: 13,837] [added: 15,245] | | | [removed: 8,683] [added: 13,837] | |
| Total assets | | $ | [removed: 2,597,478] [added: 3,305,579] | | $ | [removed: 2,209,114] [added: 2,597,478] | |
| Current maturities of long-term debt | | $ | [removed: 9,000] [added: 4,867] | | $ | [removed: 2,788] [added: 9,000] | |
| Accounts payable | | | [removed: 337,385] [added: 419,962] | | | [removed: 254,788] [added: 337,385] | |
| Accrued compensation and benefits | | | [removed: 127,765] [added: 169,136] | | | [removed: 129,971] [added: 127,765] | |
| Accrued self-insurance | | | [removed: 27,644] [added: 27,774] | | | [removed: 22,227] [added: 27,644] | |
| | | |
Such revisions are
February 22, 2024
| | | 2023 | | | 2022 | | |
| Net income | | — | | | — | | — | | | — | | | — | | | 323,398 | | | 323,398 | |
| Issuance of restricted stock & performance stock | | — | | | — | | 94,729 | | | 3,398 | | | 1,117 | | | — | | | 4,515 | |
| Share repurchase | | — | | | — | | (139,478) | | | (21,304) | | | — | | | — | | | (21,304) | |
| BALANCE AT DECEMBER 31, 2023 | | 41,123,365 | | $ | 411 | | (5,438,625) | | $ | (209,807) | | $ | 339,562 | | $ | 1,147,663 | | $ | 1,277,829 | |
| Accounts payable and accrued liabilities | | | 136,467 | | | 93,110 | | | (5,171) | |
| Billings in excess of costs and estimated earnings and deferred revenue | | | 349,166 | | | 226,019 | | | 53,795 | |
_Recently Adopted Accounting Pronouncements_
ASU 2021-08 is effective for
fiscal years beginning after December 15, 2022 and interim periods within that year.
In November 2023, the FASB issued ASU 2023-07, “Segment Reporting (Topic 280): Improvements to Reportable Segment Disclosures.” This standard requires entities to disclose, on an annual and interim basis, significant segment expenses that are regularly provided to the chief decision maker and included within each reported measure of segment profit and loss.
We are currently evaluating the impact ASU 2023-07 will have on our disclosures; however, the standard will not have an impact on our consolidated financial position, results of operations or cash flows.
In December 2023, the FASB issued ASU 2023-09, “Income Taxes (Topic 740): Improvements to Income Tax Disclosures.” This standard requires entities to disclose more detailed information in the reconciliation of their statutory tax rate to their effective tax rate.
The standard also requires entities to make additional disclosures on income taxes paid as well as on certain income statement-related disclosures.
ASU 2023-09 is effective for fiscal years beginning after December 15, 2024.
Early adoption is permitted.
We are currently evaluating the impact ASU 2023-09 will have on our disclosures; however, the standard will not have an impact on our consolidated financial position, results of operations or cash flows.
service financial assets due to lien rights, which we are more likely to have on construction jobs.
| | 2023 | | | | | | | | | | | | 2022 | | | | | | | | | | |
Unbilled accounts receivable are amounts due to us that we have earned under a contract where our right to payment is unconditional.
A right to consideration is unconditional if only the passage of time is required before payment of the consideration is due.
been impaired involve market-based information.
Loss estimates associated with the larger and
invoiced to the customer at any point during the contract.
services underlying each performance obligation.
the changes on current and prior periods based on our progress towards complete satisfaction of a performance obligation.
| Manufacturing | | | $ | 1,751,684 | | 33.6 | % | | $ | 1,426,962 | | 34.5 | % | | $ | 970,986 | | 31.6 | % |
| Technology | | | | 1,114,382 | | 21.4 | % | | | 546,290 | | 13.2 | % | | | 385,702 | | 12.5 | % |
| Total | | | $ | 5,206,760 | | 100.0 | % | | $ | 4,140,364 | | 100.0 | % | | $ | 3,073,636 | | 100.0 | % |
| Total | | | $ | 5,206,760 | | 100.0 | % | | $ | 4,140,364 | | 100.0 | % | | $ | 3,073,636 | | 100.0 | % |
Contract assets are not
Contract assets and liabilities in the Consolidated Balance Sheet consisted of the following amounts as of December 31, 2023 and December 31, 2022 (in thousands):
| Contract liabilities: | | | | | |
| Billings in excess of costs and estimated earnings and deferred revenue | $ | 909,538 | | $ | 548,293 |
Contract assets and liabilities fluctuate year to year based on various factors, including, but not limited to, the variability in billing and payment terms of customers and changes in the number and size of projects in progress at period end.
Contract assets and contract liabilities increased from December 31, 2022 to December 31, 2023 by approximately $0.9 million and $361.2 million, respectively.
The increase in contract assets was primarily due to an increase of $4.1 million as a result of the acquisitions of Eldeco, Inc. (“Eldeco”) and DECCO, Inc. (“DECCO”).
| HIDDEN_ROW | | |
| --- | --- | --- |
| [Report of Independent Registered Public Accounting Firm](#ReportofIndependentRegisteredEY) (PCAOB ID No. 42) | | 44 |
Report of Independent Registered Public Accounting Firm
To the stockholders and the Board of Directors of Comfort Systems USA, Inc.
Opinion on the Financial Statements
Basis for Opinion
These financial statements are the responsibility of the Company’s management.
Our responsibility is to express an opinion on the Company’s financial statements based on our audits.
We are a public accounting firm registered with the PCAOB and are required to be independent with respect to the Company in accordance with the U.S. federal securities laws and the applicable rules and regulations of the Securities and Exchange Commission and the PCAOB.
Those standards require that we plan and perform the audits to obtain reasonable assurance about whether the financial statements are free of material misstatement, whether due to error or fraud.
Such procedures included examining, on a test basis, evidence regarding the amounts and disclosures in the financial statements.
Our audits also included evaluating the accounting principles used and significant estimates made by management, as well as evaluating the overall presentation of the financial statements.
Houston, Texas
February 22, 2023
We have audited the accompanying consolidated statements of operations, stockholders’ equity and cash flows of Comfort Systems USA, Inc. (the Company) for the year ended December 31, 2020, and the related notes (collectively referred to as the “consolidated financial statements”).
In our opinion, the consolidated financial statements present fairly, in all material respects, the results of the Company’s operations and its cash flows for the year ended December 31, 2020, in conformity with U.S. generally accepted accounting principles.
We conducted our audit in accordance with the standards of the PCAOB.
Our audit included performing procedures to assess the risks of material misstatement of the financial statements, whether due to error or fraud, and performing procedures that respond to those risks.
We believe that our audit provides a reasonable basis for our opinion.
/s/ Ernst & Young LLP
We served as the Company’s auditor from 2002 to 2021.
February 25, 2021,
except for Note 16, as to which the date is
February 23, 2022
| | | | | | | | |
| --- | --- | --- | --- | --- | --- | --- | --- |
| Billings in excess of costs and estimated earnings | | | 461,781 | | | 307,380 | |
| Deferred revenue | | | 86,512 | | | 13,734 | |
| | | | | | | | | | | | |
| --- | --- | --- | --- | --- | --- | --- | --- | --- | --- | --- | --- |
| BALANCE AT DECEMBER 31, 2019 | | 41,123,365 | | $ | 411 | | (4,465,448) | | $ | (103,960) | | $ | 320,168 | | $ | 368,685 | | $ | 585,304 | |
| Net income | | — | | | — | | — | | | — | | | — | | | 150,139 | | | 150,139 | |
| Cumulative-effect adjustment (1) | | — | | | — | | — | | | — | | | — | | | (515) | | | (515) | |
| Issuance of restricted stock & performance stock | | — | | | — | | 128,889 | | | 3,102 | | | (1,247) | | | — | | | 1,855 | |
| Share repurchase | | — | | | — | | (684,634) | | | (30,120) | | | — | | | — | | | (30,120) | |
_____________________________________
| | (1) | Represents the adjustment to Retained Earnings as a result of adopting Accounting Standards Update (ASU) No. 2016-13, “Financial Instruments – Credit Losses (Topic 326),” on January 1, 2020. |
| Accounts payable and accrued liabilities | | | 165,888 | | | 4,004 | | | 11,087 | |
| Billings in excess of costs and estimated earnings | | | 153,241 | | | 44,620 | | | 19,434 | |
An excerpt. Shown here: 40 of 390 rewritten, 40 of 158 added and 40 of 136 removed. The counts are complete. For every sentence, read Item 8. Financial Statements and Supplementary Data in the FY2023 filing and the FY2022 filing.
Item 9A. Controls and Procedures
7 rewritten, 7 added, 1 removed, 38 unchanged
There have not been any changes in our internal control over financial reporting (as such term is defined in Rules 13a-15(f) and 15d-15(f) under the Securities Exchange Act of 1934) during the three months ended December 31, [removed: 2022] [added: 2023] that have materially affected, or are reasonably likely to materially affect, internal control over financial reporting.
Under the supervision and with the participation of our management, including our Chief Executive Officer and Chief Financial Officer, we conducted an evaluation of the effectiveness of our internal control over financial reporting as of December 31, [removed: 2022] [added: 2023] based on the framework in Internal Control—Integrated Framework issued by the Committee of Sponsoring Organizations of the Treadway Commission (COSO 2013 framework).
Based on that evaluation, our management concluded that our internal control over financial reporting was effective as of December 31, [removed: 2022.][added: 2023.]
Deloitte & Touche LLP, an independent registered public accounting firm, as stated in their report which is included elsewhere herein, has issued an attestation report auditing the effectiveness of our internal control over financial reporting as of December 31, [removed: 2022.][added: 2023.]
We have audited the internal control over financial reporting of Comfort Systems USA, Inc. and its consolidated subsidiaries (the “Company”) as of December 31, [removed: 2022,] [added: 2023,] based on criteria established in _Internal Control — Integrated Framework (2013)_ issued by the Committee of Sponsoring Organizations of the Treadway Commission (COSO).
In our opinion, the Company maintained, in all material respects, effective internal control over financial reporting as of December 31, [removed: 2022,] [added: 2023,] based on criteria established in _Internal Control — Integrated Framework (2013)_ issued by COSO.
We have also audited, in accordance with the standards of the Public Company Accounting Oversight Board (United States) (PCAOB), the consolidated financial statements of the Company for the year ended December 31, [removed: 2022,] [added: 2023,] and our report dated February 22, [removed: 2023,] [added: 2024,] expressed an unqualified opinion on those consolidated financial statements.
The Company acquired Eldeco, Inc. in February 2023 and DECCO, Inc. in October 2023.
Due to the recent nature of these business combinations, Eldeco and DECCO’s internal control over financial reporting and related processes have not been fully integrated into the Company’s existing systems and internal control over financial reporting as of December 31, 2023.
As such, our management has excluded Eldeco and DECCO from its assessment of the effectiveness of internal control over financial reporting as of December 31, 2023.
Collectively, Eldeco and DECCO comprised 5.2% of total assets and 2.5% of revenues in our consolidated financial statements as of and for the year ended December 31, 2023.
As described in Management’s Report on Internal Control over Financial Reporting, management excluded from its assessment the internal control over financial reporting at Eldeco, Inc. (acquired February 1, 2023) and DECCO, Inc. (acquired October 2, 2023), and whose financial statements collectively constitute 5.2% of total assets and 2.5% of total revenues in the consolidated financial statement amounts as of and for the year ended December 31, 2023.
Accordingly, our audit did not include the internal control over financial reporting at Eldeco, Inc. and DECCO, Inc.
February 22, 2024
February 22, 2023
Item 9B. Other Information
0 rewritten, 3 added, 1 removed, 0 unchanged
Securities Trading Plans of Directors and Officers
During the three months ended December 31, 2023, no directors or officers of the Company adopted or terminated a “Rule 10b5-1 trading arrangement” or “non-Rule 10b5-1 trading arrangement,” as defined in Item 408(a) and (c) of Regulation S-K.
None.
Item 10. Directors, Executive Officers and Corporate Governance
2 rewritten, 0 added, 0 removed, 7 unchanged
The other information required by this Item 10 will be furnished on or prior to May 1, [removed: 2023] [added: 2024] (and is hereby incorporated by reference) by an amendment hereto or pursuant to a definitive proxy statement involving the election of directors pursuant to Regulation 14A that will contain such information.
The information required by Items 11, 12, 13 and 14 will be furnished on or prior to May 1, [removed: 2023] [added: 2024] (and is hereby incorporated by reference) by an amendment hereto or pursuant to a definitive proxy statement involving the election of directors pursuant to Regulation 14A that will contain such information.
Item 15. Exhibits and Financial Statement Schedules
0 rewritten, 1 added, 0 removed, 13 unchanged
Item 16. Form 10-K Summary
67 rewritten, 13 added, 7 removed, 40 unchanged
| | | [added: |] | | Incorporated by Referenceto the Exhibit Indicated Belowand to the Filing with theCommission Indicated Below | | | [added: |]
| ExhibitNumber | | [added: |] Description of Exhibits | | ExhibitNumber | | Filing or File Number | [added: |]
| 3.1 | | [added: |] [Second Amended and Restated Certificate of Incorporation of the Registrant](http://www.sec.gov/Archives/edgar/data/1035983/0000890566-97-001319-index.html) | | 3.1 | | 333-24021 | [added: |]
| 3.2 | | [added: |] [Certificate of Amendment dated May 21, 1998](http://www.sec.gov/Archives/edgar/data/1035983/0000890566-99-000401-index.html) | | 3.2 | | 1998 Form 10-K | [added: |]
| 3.3 | | [added: |] [Certificate of Amendment dated July 9, 2003](http://www.sec.gov/Archives/edgar/data/1035983/000104746904005828/a2129426zex-3_3.htm) | | 3.3 | | 2003 Form 10-K | [added: |]
| 3.4 | | [added: |] [Certificate of Amendment dated May 20, 2016](http://www.sec.gov/Archives/edgar/data/1035983/000110465916122345/a16-10750_2ex3d1.htm) | | 3.1 | | May 20, 2016 Form 8-K | [added: |]
| 3.5 | | [added: |] [Amended and Restated Bylaws of Comfort Systems USA, Inc.](http://www.sec.gov/Archives/edgar/data/1035983/000110465916107645/a16-7178_1ex3d1.htm) | | 3.1 | | March 25, 2016 Form 8-K | [added: |]
| 4.1 | | [added: |] [Form of certificate evidencing ownership of Common Stock of the Registrant](http://www.sec.gov/Archives/edgar/data/1035983/0000890566-97-001319-index.html) | | 4.1 | | 333-24021 | [added: |]
| 4.2 | | [added: |] [Description of Registrant’s Securities](https://www.sec.gov/Archives/edgar/data/1035983/000155837020001491/ex-4d2.htm) | | 4.2 | | 2019 Form 10-K | [added: |]
| *10.1 | | [added: |] [Employment Agreement between the Company, Eastern Heating & Cooling, Inc. and Alfred J. Giardinelli, Jr.](http://www.sec.gov/Archives/edgar/data/1035983/000095012903003918/h07903exv10w1.txt) | | 10.1 | | Second Quarter 2003 Form 10-Q | [added: |]
| *10.2 | | [added: |] [Form of Comfort Systems USA, Inc. Executive Severance Policy](http://www.sec.gov/Archives/edgar/data/1035983/000104746908005698/a2185250zex-10_3.htm) | | 10.3 | | First Quarter 2008 Form 10-Q | [added: |]
| *10.3 | | [added: |] [Form of Directors and Officers Indemnification Agreement](http://www.sec.gov/Archives/edgar/data/1035983/000110465909033654/a09-12567_2ex10d1.htm) | | 10.1 | | May 19, 2009 Form 8-K | [added: |]
| 10.4 | | [added: |] [Second Amended and Restated Credit Agreement by and among Comfort Systems USA, Inc., as Borrower and Wells Fargo Bank, National Association, as Administrative Agent/Wells Fargo Securities LLC, as Sole Lead Arranger and Sole Lead Book Runner/Bank of Texas, N.A., Capital One, N.A., and Regions Bank as Co-Syndication Agent/and Certain Financial Institutions as Lenders](http://www.sec.gov/Archives/edgar/data/1035983/000110465910039133/a10-14233_1ex10d1.htm) | | 10.1 | | July 22, 2010 Form 8-K/A | [added: |]
| 10.5 | | [added: |] [Stock Purchase Agreement, dated July 28, 2010](http://www.sec.gov/Archives/edgar/data/1035983/000110465910040867/a10-14873_1ex10d1.htm) | | 10.1 | | July 30, 2010 Form 8-K | [added: |]
| 10.6 | | [added: |] [Amendment No. 1 to Second Amended and Restated Credit Agreement, Second Amended and Restated Security Agreement, and Second Amended and Restated Pledge Agreement](http://www.sec.gov/Archives/edgar/data/1035983/000104746911009144/a2206146zex-10_1.htm) | | 10.1 | | Third Quarter 2011 Form 10-Q | [added: |]
| 10.7 | | [added: |] [Amendment No. 2 to Second Amended and Restated Credit Agreement and Amendment to Other Loan Documents](http://www.sec.gov/Archives/edgar/data/1035983/000104746913007932/a2216107zex-10_1.htm) | | 10.1 | | Second Quarter 2013 Form 10-Q | [added: |]
| *10.8 | | [added: |] [Form of Option Award under the Comfort Systems USA, Inc. 2012 Equity Incentive Plan](http://www.sec.gov/Archives/edgar/data/1035983/000104746915001294/a2223211zex-10_33.htm) | | 10.33 | | 2014 Form 10-K | [added: |]
| 10.9 | | [added: |] [Amendment No. 3 to Second Amended and Restated Credit Agreement and Amendment to Other Loan Documents](http://www.sec.gov/Archives/edgar/data/1035983/000104746914008664/a2221896zex-10_1.htm) | | 10.1 | | Third Quarter 2014 Form 10-Q | [added: |]
| 10.10 | | [added: |] [Agreement and Plan of Merger between the Company and Dyna Ten Corporation, dated April 7, 2014](http://www.sec.gov/Archives/edgar/data/1035983/000110465914026747/a14-10230_1ex10d1.htm) | | 10.1 | | April 9, 2014 Form 8-K | [added: |]
| *10.11 | | [added: |] [Form of Amended Change in Control Agreement](http://www.sec.gov/Archives/edgar/data/1035983/000104746915008149/a2226337zex-10_1.htm) | | 10.1 | | Third Quarter 2015 Form 10-Q | [added: |]
| 10.12 | | [added: |] [Amendment No. 4 to Second Amended and Restated Credit Agreement and Amendment to Other Loan Documents](http://www.sec.gov/Archives/edgar/data/1035983/000104746916010332/a2227387zex-10_40.htm) | | 10.40 | | 2015 Form 10-K | [added: |]
| *10.13 | | [added: |] [Form of 2016 Stock Option Notice](http://www.sec.gov/Archives/edgar/data/1035983/000110465916107645/a16-7178_1ex10d3.htm) | | 10.3 | | March 25, 2016 Form 8-K | [added: |]
| *10.14 | | [added: |] [Resignation and General Release Agreement between the Company and James Mylett, dated as of January 10, 2017](http://www.sec.gov/Archives/edgar/data/1035983/000110465917001957/a17-1811_1ex10d1.htm) | | 10.1 | | January 11, 2017 Form 8-K | [added: |]
| [removed: ] [added: ] | [removed: ] [added: ] | [removed: ] | [added: |] | Incorporated by Referenceto the Exhibit Indicated Belowand to the Filing with theCommission Indicated Below | | | [added: |]
| ExhibitNumber | | [added: |] Description of Exhibits | [removed: ] | ExhibitNumber | [removed: ] | Filing or File Number | [added: |]
| 10.15 | | [added: |] [Stock Purchase Agreement, dated February 21, 2017, by and among the Company, BCH, the Selling Shareholders and Daryl Blume, in his capacity as representative of the Selling Shareholders](http://www.sec.gov/Archives/edgar/data/1035983/000110465917011244/a17-7023_1ex2d1.htm) | | 2.1 | | [added: |] February 23, 2017 Form 8-K |
| 10.16 | | [added: |] [Form of Promissory Note, dated April 1, 2017, issued by the Company in favor of each of the Selling Shareholders](http://www.sec.gov/Archives/edgar/data/1035983/000110465917020991/a17-10800_1ex10d1.htm) | | 10.1 | | [added: |] April 3, 2017 Form 8-K |
| *10.17 | | [added: |] [2017 Omnibus Incentive Plan](http://www.sec.gov/Archives/edgar/data/1035983/000155837017002563/fix-20170523xdef14a.htm) | | A | | [added: |] April 10, 2017 Proxy Statement |
| *10.18 | | [added: |] [2017 Senior Management Annual Performance Plan](http://www.sec.gov/Archives/edgar/data/1035983/000155837017002563/fix-20170523xdef14a.htm) | | B | | [added: |] April 10, 2017 Proxy Statement |
| *10.19 | | [added: |] [Form of Restricted Stock Unit Agreement under the Company’s 2012 Equity Incentive Plan](http://www.sec.gov/Archives/edgar/data/1035983/000155837017002931/fix-20170331ex102e9479d.htm) | | 10.2 | | [added: |] First Quarter 2017 Form 10-Q |
| *10.20 | | [added: |] [Form of Stock Option Notice under the Company’s 2012 Equity Incentive Plan](http://www.sec.gov/Archives/edgar/data/1035983/000155837017002931/fix-20170331ex103bc199c.htm) | | 10.3 | | [added: |] First Quarter 2017 Form 10-Q |
| *10.21 | | [added: |] [Form of Dollar-denominated Performance Restricted Stock Unit Agreement under the Company’s 2012 Equity Incentive Plan](http://www.sec.gov/Archives/edgar/data/1035983/000155837017002931/fix-20170331ex104628293.htm) | | 10.4 | | [added: |] First Quarter 2017 Form 10-Q |
| *10.22 | | [added: |] [Form of Restricted Stock Unit Agreement under the Company’s 2017 Omnibus Incentive Plan](http://www.sec.gov/Archives/edgar/data/1035983/000155837018003336/fix-20180331ex101c8a191.htm) | | 10.1 | | [added: |] First Quarter 2018 Form 10-Q |
| *10.23 | | [added: |] [Form of Stock Option Notice under the Company’s 2017 Omnibus Incentive Plan](http://www.sec.gov/Archives/edgar/data/1035983/000155837018003336/fix-20180331ex102ce3cf4.htm) | | 10.2 | | [added: |] First Quarter 2018 Form 10-Q |
| *10.24 | | [added: |] [Form of Dollar-denominated Performance Restricted Stock Unit Agreement under the Company’s 2017 Omnibus Incentive Plan](http://www.sec.gov/Archives/edgar/data/1035983/000155837018003336/fix-20180331ex10323834b.htm) | | 10.3 | | [added: |] First Quarter 2018 Form 10-Q |
| 10.25 | | [added: |] [Amendment No. 5 to Second Amended and Restated Credit Agreement and Amendment to Other Loan Documents](http://www.sec.gov/Archives/edgar/data/1035983/000155837018005771/fix-20180630ex1010b4b06.htm) | | 10.1 | | [added: |] Second Quarter 2018 Form 10-Q |
| 10.26 | | [added: |] [Purchase Agreement, dated February 21, 2019, by and among the Company, Walker, the Shareholder Sellers and Scott Walker, in his capacity as representative of the Shareholder Sellers](https://www.sec.gov/Archives/edgar/data/1035983/000110465919010746/a19-5185_2ex2d1.htm) | | 2.1 | | [added: |] February 26, 2019 Form 8-K |
| 10.27 | | [added: |] [Amendment No. 6 to Second Amended and Restated Credit Agreement and Amendment to Other Loan Documents](https://www.sec.gov/Archives/edgar/data/1035983/000155837020001491/ex-10d56.htm) | | 10.56 | | [added: |] 2019 Form 10-K |
| 10.28 | | [added: |] [Agreement and Plan of Merger dated as of March 9, 2020 among Comfort Systems USA, Inc., OSC Acquisition Corp., TAS Energy Inc., and Element Partners II, L.P., as Stockholder Representative](https://www.sec.gov/Archives/edgar/data/1035983/000110465920033252/tm2012107d1_ex2-1.htm) | | 2.1 | | [added: |] March 13, 2020 Form 8-K |
| *10.29 | | [added: |] [Resignation and General Release Agreement between Comfort Systems USA, Inc. and Terrence Young, dated as of January 18, 2022](https://www.sec.gov/Archives/edgar/data/1035983/000110465922005448/tm222551d2_ex10-1.htm) | | 10.1 | | [added: |] January 19, 2022 Form 8-K |
| --- | --- | --- | --- | --- | --- | --- | --- | --- |
| --- | --- | --- | --- | --- | --- | --- | --- | --- |
| *10.32 | | | [Form of Restricted Stock Unit Agreement with Revisions under the Company’s 2017 Omnibus Incentive Plan](https://www.sec.gov/Archives/edgar/data/1035983/000155837023006827/fix-20230331xex10d1.htm) | | 10.1 | | | First Quarter 2023 Form 10-Q |
| *10.33 | | | [Form of Dollar-denominated Performance Restricted Stock Unit Agreement with Revisions under the Company’s 2017 Omnibus Incentive Plan](https://www.sec.gov/Archives/edgar/data/1035983/000155837023006827/fix-20230331xex10d2.htm) | | 10.2 | | | First Quarter 2023 Form 10-Q |
| *10.34 | | | [Form of Restricted Stock Unit Agreement without “Rule of 75” Vesting under the Company’s 2017 Omnibus Incentive Plan](https://www.sec.gov/Archives/edgar/data/1035983/000155837024001529/fix-20231231xex10d34.htm) | | 10.34 | | | Filed Herewith |
| | | | | | Incorporated by Referenceto the Exhibit Indicated Belowand to the Filing with theCommission Indicated Below | | | |
| --- | --- | --- | --- | --- | --- | --- | --- | --- |
| ExhibitNumber | | | Description of Exhibits | | ExhibitNumber | | Filing or File Number | |
| 97 | | | [Comfort Systems USA, Inc. Policy for Recoupment of Incentive Compensation](https://www.sec.gov/Archives/edgar/data/1035983/000155837024001529/fix-20231231xex97.htm) | | | | | Filed Herewith |
| | | | | | | | | |
| /s/ RHOMAN J. HARDY | | Director | | February 22, 2024 | |
| Rhoman J. Hardy | | | | | |
| | | | | | | |
| --- | --- | --- | --- | --- | --- | --- |
| | | | | | | |
| 16.1 | | [Letter to Securities and Exchange Commission from Ernst & Young LLP, dated March 15, 2021](https://www.sec.gov/Archives/edgar/data/1035983/000110465921036255/tm219577d1_ex16-1.htm) | | 16.1 | | March 15, 2021 Form 8-K |
| 23.2 | | [Consent of Ernst & Young LLP](https://www.sec.gov/Archives/edgar/data/1035983/000155837023001757/fix-20221231xex23d2.htm) | | | | Filed Herewith |
| /s/ Alan P. Krusi | | Director | | February 22, 2023 | |
| Alan P. Krusi | | | | | |
An excerpt. Shown here: 40 of 67 rewritten, all 13 added and all 7 removed. The counts are complete. For every sentence, read Item 16. Form 10-K Summary in the FY2023 filing and the FY2022 filing.