 filings.tools
General Dynamics 10-K 2019-12-31
Filed 2020-02-10. 22 sections, 392K characters. Original on sec.gov · Markdown · JSON
Cover and table of contents

UNITED STATES SECURITIES AND EXCHANGE COMMISSION
Washington, D.C. 20549
FORM 10-K
(Mark One)
[☒] ANNUAL REPORT PURSUANT TO SECTION 13 OR 15(d) OF THE SECURITIES EXCHANGE ACT OF 1934
For the fiscal year ended December 31, 2019
OR
[☐] TRANSITION REPORT PURSUANT TO SECTION 13 OR 15(d) OF THE SECURITIES EXCHANGE ACT OF 1934
For the transition period from _______ to _______
Commission File Number 1-3671
GENERAL DYNAMICS CORPORATION
(Exact name of registrant as specified in its charter)
| Delaware | 13-1673581 | |||
| State or other jurisdiction of incorporation or organization | IRS Employer Identification No. | |||
| 11011 Sunset Hills Road | Reston, | Virginia | 20190 | |
| Address of principal executive offices | Zip code |
Registrant’s telephone number, including area code:
| (703) | 876-3000 |
Securities registered pursuant to Section 12(b) of the Act:
| Title of each class | Trading Symbol(s) | Name of each exchange on which registered |
| Common stock | GD | New York Stock Exchange |
Securities registered pursuant to Section 12(g) of the Act:
| None |
Indicate by check mark if the registrant is a well-known seasoned issuer, as defined in Rule 405 of the Securities Act. Yes ü No ___
Indicate by check mark if the registrant is not required to file reports pursuant to Section 13 or Section 15(d) of the Act. Yes ___ No ü
Indicate by check mark whether the registrant (1) has filed all reports required to be filed by Section 13 or 15(d) of the Securities Exchange Act of 1934 during the preceding 12 months (or for such shorter period that the registrant was required to file such reports), and (2) has been subject to such filing requirements for the past 90 days. Yes ü No ___
Indicate by check mark whether the registrant has submitted electronically every Interactive Data File required to be submitted pursuant to Rule 405 of Regulation S-T (§232.405 of this chapter) during the preceding 12 months (or for such shorter period that the registrant was required to submit such files). Yes ü No ___
Indicate by check mark whether the registrant is a large accelerated filer, an accelerated filer, a non-accelerated filer, a smaller reporting company, or an emerging growth company. See the definitions of “large accelerated filer,” “accelerated filer,” “smaller reporting company,” and “emerging growth company” in Rule 12b-2 of the Exchange Act.
Large accelerated filer ü Accelerated filer __ Non-accelerated filer __ Smaller reporting company __ ☐ Emerging growth company __☐
If an emerging growth company, indicate by check mark if the registrant has elected not to use the extended transition period for complying with any new or revised financial accounting standards provided pursuant to Section 13(a) of the Exchange Act. __
Indicate by check mark whether the registrant is a shell company (as defined in Rule 12b-2 of the Exchange Act). Yes ☐ No ü
The aggregate market value of the voting common equity held by non-affiliates of the registrant was $48,851,568,997 as of June 30, 2019 (based on the closing price of the shares on the New York Stock Exchange).
289,627,333 shares of the registrant’s common stock, $1 par value per share, were outstanding on January 26, 2020.
DOCUMENTS INCORPORATED BY REFERENCE:
Part III incorporates by reference information from certain portions of the registrant’s definitive proxy statement for the 2020 annual meeting of shareholders to be filed with the Securities and Exchange Commission within 120 days after the close of the fiscal year.
INDEX
PART I
Item 1. BUSINESS
(Dollars in millions, except per-share amounts or unless otherwise noted)
BUSINESS OVERVIEW
General Dynamics is a global aerospace and defense company that offers a broad portfolio of products and services in business aviation; combat vehicles, weapons systems and munitions; information technology (IT) services; command, control, communications, computers, intelligence, surveillance and reconnaissance (C4ISR) solutions; and shipbuilding and ship repair.
General Dynamics was incorporated in Delaware in 1952. We took actions beginning in the mid-1990s that laid the foundation for modern-day General Dynamics, including acquiring Gulfstream Aerospace Corporation, combat-vehicle businesses, IT services and C4ISR solutions companies, and additional shipyards. In 2018, we continued to position our company for future growth and superior profitability through the acquisition of CSRA, our largest acquisition to date.
Our company consists of 10 business units, which are organized into five operating segments: Aerospace, Combat Systems, Information Technology, Mission Systems and Marine Systems. We refer to the latter four segments collectively as our defense segments. We have a balanced business model which gives each business unit the flexibility to stay agile and maintain an intimate understanding of customer requirements. Each business unit is responsible for the execution of its strategy and operational performance. Our corporate leaders set the overall strategy and governance for the company and are responsible for allocating and deploying capital. Our ethos — based on honesty, transparency, trust and alignment — undergirds our culture, our business model and our decision-making. This unique model keeps us focused on our priorities: exceeding customer expectations; executing on backlog; managing costs; implementing continuous improvement; and maximizing earnings, cash and return on invested capital.
Following is additional information on each of our operating segments.
AEROSPACE
Our Aerospace segment is at the forefront of the business-jet industry. The segment consists of our Gulfstream and Jet Aviation business units. We offer a family of Gulfstream aircraft and provide a full range of services for business aircraft produced by Gulfstream and other original equipment manufacturers. We have earned our reputation through:
| • | superior aircraft design, quality, performance, safety and reliability; |
| • | technologically advanced flight deck and cabin systems; and |
| • | industry-leading customer support. |
Gulfstream designs, manufactures and supports the world’s most technologically advanced business-jet aircraft. Our product line encompasses aircraft across a variety of price and performance options from mid- to ultra-large-cabin business jets. The many combinations of range, speed, size and cabin customization generate aircraft best suited for each customer’s unique requirements.
Our disciplined and consistent approach to new product development allows us to repeatedly introduce first-to-market capabilities that set industry standards for safety, performance, quality, speed and comfort.
Our continual investment in research and development (R&D) leads to new aircraft that consistently broaden customer offerings while raising the bar for safety and performance. Product enhancement and development efforts include initiatives in advanced avionics, composites, flight-control and vision systems, acoustics, and cabin technologies. As part of its sustainability strategy, Gulfstream, in 2019, made its first customer sales of sustainable aviation fuel.
In 2019, the all-new G600 earned both its type and production certificates from the U.S. Federal Aviation Administration (FAA), and we delivered the first aircraft to customers. The G600 has a range of 6,500 nautical miles at a cruise speed of Mach 0.85 and a maximum operating speed of Mach 0.925. The aircraft has earned 11 city-pair speed records and has low cabin altitude air pressure to reduce travel fatigue. The G600 joins the G500, which achieved its certifications and first customer deliveries in 2018. Both aircraft reflect our consistent, long-term investment in R&D, and both have seen strong customer interest. The G500 and G600 received Aviation Week’s 2020 Platform Laureate Award for extraordinary achievement in business aviation.
The ultra-long-range, ultra-large-cabin G650 and G650ER continue to generate significant customer interest, with more than 400 aircraft of this family currently operating in 40 countries. Since the first G650 entered service in 2012, its capabilities and reliability have led to significant sales and installed base around the globe. In 2019, the G650ER continued to demonstrate superior speed and range capabilities, conducting a record-setting flight from Singapore to Tucson, Arizona, over a distance of 8,379 nautical miles at an average speed of 597 miles per hour (Mach 0.85).
In October, we announced the launch of the ultra-long-range G700, which we expect will enter service in 2022. The G700 is designed to blend our most spacious cabin with the advanced Symmetry flight deck and superior high-speed performance to enable a range of 7,500 nautical miles at Mach 0.85 or 6,400 nautical miles at Mach 0.90. There is already significant customer interest in this new product in both the domestic and international markets.
Gulfstream designs, develops and manufactures aircraft in Savannah, Georgia, including manufacturing of all large-cabin models. The mid-cabin G280 is assembled by a non-U.S. partner. All models are outfitted in Gulfstream’s U.S. facilities. In support of Gulfstream’s growing aircraft portfolio and customer base, we continue to invest in our facilities. At our Savannah campus, we have added new purpose-built manufacturing facilities, increased aircraft service capacity, and opened a customer-support distribution center and a dedicated R&D center.
We offer comprehensive support for the more than 2,800 Gulfstream aircraft in service around the world and operate the largest factory-owned service network in the industry. We operate a 24/7 year-round Customer Support Center and offer on-call Gulfstream aircraft technicians ready to deploy around the world for customer service requirements.
In 2019, we opened a new maintenance, repair and overhaul (MRO) facility in Savannah to accommodate fleet growth, giving Gulfstream more than one-million square feet of dedicated MRO hangar, office and shop space in Savannah. We also significantly expanded our MRO service center in Appleton, Wisconsin, which now has more than 100,000 square feet of hangar space, enough to accommodate 12 G650ER aircraft.
In 2019, Gulfstream and Jet Aviation opened a new 10,000-square-foot terminal and 43,000-square-foot hangar at Van Nuys, the primary business-aviation airport servicing the Los Angeles area. Gulfstream utilizes the space as an MRO service center, its second in the area complementing its Long Beach facility. Van Nuys will serve as the operating base for Gulfstream’s local Field and Airborne Support Team (FAST), a rapid-response unit that specializes in troubleshooting grounded aircraft. Jet Aviation uses the space as a fixed-base operator (FBO) facility and became the first FBO at Van Nuys to offer sustainable aviation fuel.
Jet Aviation has been a global leader in business-aviation services for over 50 years, providing comprehensive services and an extensive network of locations for aircraft owners and operators. With approximately 50 airport sites throughout North America, Europe, the Middle East and Asia Pacific, our offerings include maintenance, FBO, aircraft management, charter, staffing and government fleet services. In 2019, we continued to grow our global footprint, conducting acquisitions, expansions or significant renovations in key business-aviation markets including Teterboro, New
Showing the first 8K of 62K characters. Open the full section
Item 1A. RISK FACTORS
An investment in our common stock or debt securities is subject to risks and uncertainties. Investors should consider the following factors, in addition to the other information contained in this Annual Report on Form 10-K, before deciding whether to purchase our securities.
Investment risks can be market-wide as well as unique to a specific industry or company. The market risks faced by an investor in our stock are similar to the uncertainties faced by investors in a broad range of industries. There are some risks that apply more specifically to our business.
Our revenue is concentrated with the U.S. government. This customer relationship involves some specific risks. In addition, our sales to non-U.S. customers expose us to different financial and legal risks. Despite the varying nature of our government and commercial operations and the markets they serve, each segment shares some common risks, such as the ongoing development of high-technology products and the price, availability and quality of commodities and subsystems.
The U.S. government provides a significant portion of our revenue. In 2019, approximately 65% of our consolidated revenue was from the U.S. government. Levels of U.S. defense spending are driven by threats to national security. Competing demands for federal funds can pressure various areas of spending. Decreases in U.S. government defense and other spending or changes in spending allocation or priorities could result in one or more of our programs being reduced, delayed or terminated, which could impact our financial performance.
For additional information relating to U.S. budget matters, see the Business Environment section of Management’s Discussion and Analysis of Financial Condition and Results of Operations in Item 7.
U.S. government contracts are not always fully funded at inception, and any funding is subject to disruption or delay. Our U.S. government revenue is funded by agency budgets that operate on an October-to-September fiscal year. Early each calendar year, the President of the United States presents to the Congress the budget for the upcoming fiscal year. This budget proposes funding levels for every federal agency and is the result of months of policy and program reviews throughout the executive branch. For the remainder of the year, the Appropriations and Authorization Committees of the Congress review the President’s budget proposals and establish the funding levels for the upcoming fiscal year. Once these levels are enacted into law, the Executive Office of the President administers the funds to the agencies.
There are two primary risks associated with the U.S. government budget cycle. First, the annual process may be delayed or disrupted. If the annual budget is not approved by the beginning of the government fiscal year, portions of the U.S. government can shut down or operate under a continuing resolution that maintains spending at prior-year levels, which can impact funding for our programs and timing of new awards. Second, the Congress typically appropriates funds on a fiscal-year basis, even though contract performance may extend over many years. Future revenue under existing multi-year contracts is conditioned on the continuing availability of congressional appropriations. Changes in appropriations in subsequent years may impact the funding available for these programs. Delays or changes in funding can impact the timing of available funds or lead to changes in program content.
Our U.S. government contracts are subject to termination rights by the customer. U.S. government contracts generally permit the government to terminate a contract, in whole or in part, for convenience. If a contract is terminated for convenience, a contractor usually is entitled to receive payments for its allowable costs incurred and the proportionate share of fees or earnings for the work performed. The government may also terminate a contract for default in the event of a breach by the contractor. If a contract is terminated for default, the government in most cases pays only for the work it has accepted. The termination of multiple or large programs could have a material adverse effect on our future revenue and earnings.
Government contractors operate in a highly regulated environment and are subject to audit by the U.S. government. Numerous U.S. government agencies routinely audit and review government contractors. These agencies review a contractor’s performance under its contracts and compliance with applicable laws, regulations and standards. The U.S. government also reviews the adequacy of, and compliance with, internal control systems and policies, including the contractor’s purchasing, property, estimating, material, earned value management and accounting systems. In some cases, audits may result in delayed payments or contractor costs not being reimbursed or subject to repayment. If an audit or investigation were to result in allegations against a contractor of improper or illegal activities, civil or criminal penalties and administrative sanctions could result, including termination of contracts, forfeiture of profits, suspension of payments, fines and suspension or prohibition from doing business with the U.S. government. In addition, reputational harm could result if allegations of impropriety were made. In some cases, audits may result in disputes with the respective government agency that can result in negotiated settlements, arbitration or litigation. Moreover, new laws, regulations or standards, or changes to existing ones, can increase our performance and compliance costs and reduce our profitability.
Our Aerospace segment is subject to changing customer demand for business aircraft. The business-jet market is driven by the demand for business-aviation products and services by corporate, individual and government customers in the United States and around the world. The Aerospace segment’s results also depend on other factors, including general economic conditions, the availability of credit, pricing pressures and trends in capital goods markets. In addition, if customers default on existing contracts and the contracts are not replaced, the segment’s anticipated revenue and profitability could be reduced materially.
Earnings and margin depend on our ability to perform on our contracts. When agreeing to contractual terms, our management team makes assumptions and projections about future conditions and events. The accounting for our contracts and programs requires assumptions and estimates about these conditions and events. These projections and estimates assess:
| • | the productivity and availability of labor; |
| • | the complexity of the work to be performed; |
| • | the cost and availability of materials and components; and |
| • | schedule requirements. |
If there is a significant change in one or more of these circumstances, estimates or assumptions, or if the risks under our contracts are not managed adequately, the profitability of contracts could be adversely affected. This could affect earnings and margin materially.
Earnings and margin depend in part on subcontractor and vendor performance. We rely on other companies to provide materials, components and subsystems for our products. Subcontractors also perform some of the services that we provide to our customers. We depend on these subcontractors and vendors to meet our contractual obligations in full compliance with customer requirements and applicable law. Misconduct by subcontractors, such as a failure to comply with procurement regulations or engaging in unauthorized activities, may harm our future revenue and earnings. We manage our supplier base carefully to avoid or minimize customer issues. We sometimes rely on only one or two sources of supply that, if disrupted, could have an adverse effect on our ability to meet our customer commitments. Our ability to perform our obligations may be materially adversely affected if one or more of these suppliers is unable to provide the agreed-upon materials, perform the agreed-upon services in a timely and cost-effective manner, or engages in misconduct or other improper activities.
Sales and operations outside the United States are subject to different risks that may be associated with doing business in foreign countries. In some countries there is increased chance for economic, legal or political changes, and procurement procedures may be less robust or mature, which may complicate the contracting process. Our non-U.S. operations may be sensitive to and impacted by changes in a foreign government’s national policies and priorities, political leadership and budgets, which may be influenced by changes in threat environments, geopolitical uncertainties, volatility in economic conditions and other economic and political factors. Changes and developments in any of these matters or factors may occur suddenly and could impact funding for programs or delay purchasing decisions or customer payments. Non-U.S. transactions can involve increased financial and legal risks arising from foreign exchange rate variability and differing legal systems. Our non-U.S. operations are subject to U.S. and foreign laws and regulations, including laws and regulations relating to import-export controls, technology transfers, the Foreign Corrupt Practices Act (FCPA) and other anti-corruption laws, and the International Traffic in Arms Regulations (ITAR). An unfavorable event or trend in any one or more of these factors or a failure to comply with U.S. or foreign laws could result in administrative, civil or criminal liabilities, including suspension or debarment from government contracts or suspension of our export privileges, and could materially adversely affect revenue and earnings associated with our non-U.S. operations.
In addition, some non-U.S. government customers require contractors to enter into letters of credit, performance or surety bonds, bank guarantees and other similar financial arrangements. We may also be required to agree to specific in-country purchases, manufacturing agreements or financial support arrangements, known as offsets, that require us to satisfy investment or other requirements or face penalties. Offset requirements may extend over several years and could require us to team with local companies to fulfill these requirements. If we do not satisfy these financial or offset requirements, our future revenue and earnings may be materially adversely affected.
Our future success depends in part on our ability to develop new products and technologies and maintain a qualified workforce to meet the needs of our customers. Many of the products and services we provide involve sophisticated technologies and engineering, with related complex manufacturing and system-integration processes. Our customers’ requirements change and evolve regularly. Accordingly, our future performance depends in part on our ability to continue to develop, manufacture and provide innovative products and services and bring those offerings to market quickly at cost-effective prices. Some new products, particularly in our Aerospace segment, must meet extensive and time-consuming regulatory requirements that are often outside our control and may result in unanticipated delays. Additionally, due
to the highly specialized nature of our business, we must hire and retain the skilled and qualified personnel necessary to perform the services required by our customers. To the extent that the demand for skilled personnel exceeds supply, we could experience higher labor, recruiting or training costs in order to attract and retain such employees. If we were unable to develop new products that meet customers’ changing needs and satisfy regulatory requirements in a timely manner or successfully attract and retain qualified personnel, our future revenue and earnings may be materially adversely affected.
We have made and expect to continue to make investments, including acquisitions and joint ventures, that involve risks and uncertainties. When evaluating potential acquisitions and joint ventures, we make judgments regarding the value of business opportunities, technologies, and other assets and the risks and costs of potential liabilities based on information available to us at the time of the transaction. Whether we realize the anticipated benefits from these transactions depends on multiple factors, including our integration of the businesses involved; the performance of the underlying products, capabilities or technologies; market conditions following the acquisition; and acquired liabilities, including some that may not have been identified prior to the acquisition. These factors could materially adversely affect our financial results.
Changes in business conditions may cause goodwill and other intangible assets to become impaired. Goodwill represents the purchase price paid in excess of the fair value of net tangible and intangible assets acquired in a business combination. Goodwill is not amortized and remains on our balance sheet indefinitely unless there is an impairment or a sale of a portion of the business. Goodwill is subject to an impairment test on an annual basis or when circumstances indicate that the likelihood of an impairment is greater than 50%. Such circumstances include a significant adverse change in the business climate for one of our reporting units or a decision to dispose of a reporting unit or a significant portion of a reporting unit. We face some uncertainty in our business environment due to a variety of challenges, including changes in government spending. We may experience unforeseen circumstances that adversely affect the value of our goodwill or intangible assets and trigger an evaluation of the amount of the recorded goodwill and intangible assets. Future write-offs of goodwill or other intangible assets as a result of an impairment in the business could materially adversely affect our results of operations and financial condition.
Our business could be negatively impacted by cybersecurity events and other disruptions. We face various cybersecurity threats, including threats to our information technology (IT) infrastructure and attempts to gain access to our proprietary or classified information, denial-of-service attacks, as well as threats to the physical security of our facilities and employees, and threats from terrorist acts. We also design and manage IT systems and products that contain IT systems for various customers. We generally face the same security threats for these systems as for our own internal systems. In addition, we face cyber threats from entities that may seek to target us through our customers, vendors, subcontractors and other third parties with whom we do business. Accordingly, we maintain information security staff, policies and procedures for managing risk to our information systems, and conduct employee training on cybersecurity to mitigate persistent and continuously evolving cybersecurity threats. However, there can be no assurance that any such actions will be sufficient to prevent cybersecurity breaches, disruptions, unauthorized release of sensitive information or corruption of data.
We have experienced cybersecurity threats such as viruses and attacks targeting our IT systems. Such prior events have not had a material impact on our financial condition, results of operations or liquidity. However, future threats could, among other things, cause harm to our business and our reputation; disrupt our operations; expose us to potential liability, regulatory actions and loss of business; challenge our eligibility for future work on sensitive or classified systems for government customers; and impact our results of operations materially. Due to the evolving nature of these security threats, the potential impact
of any future incident cannot be predicted. Our insurance coverage may not be adequate to cover all the costs related to cybersecurity attacks or disruptions resulting from such events.
FORWARD-LOOKING STATEMENTS
This Annual Report on Form 10-K contains forward-looking statements that are based on management’s expectations, estimates, projections and assumptions. Words such as “expects,” “anticipates,” “plans,” “believes,” “scheduled,” “outlook,” “estimates,” “should” and variations of these words and similar expressions are intended to identify forward-looking statements. Examples include projections of revenue, earnings, operating margin, segment performance, cash flows, contract awards, aircraft production, deliveries and backlog. In making these statements we rely on assumptions and analyses based on our experience and perception of historical trends, current conditions and expected future developments as well as other factors we consider appropriate under the circumstances. We believe our estimates and judgments are reasonable based on information available to us at the time. Forward-looking statements are made pursuant to the safe harbor provisions of the Private Securities Litigation Reform Act of 1995, as amended. These statements are not guarantees of future performance and involve risks and uncertainties that are difficult to predict. Therefore, actual future results and trends may differ materially from what is forecast in forward-looking statements due to a variety of factors, including, without limitation, the risk factors discussed in this Form 10-K.
All forward-looking statements speak only as of the date of this report or, in the case of any document incorporated by reference, the date of that document. All subsequent written and oral forward-looking statements attributable to General Dynamics or any person acting on our behalf are qualified by the cautionary statements in this section. We do not undertake any obligation to update or publicly release any revisions to forward-looking statements to reflect events, circumstances or changes in expectations after the date of this report. These factors may be revised or supplemented in subsequent reports on SEC Forms 10-Q and 8-K.
Item 1B. UNRESOLVED STAFF COMMENTS
None.
Item 2. PROPERTIES
We operate in a number of offices, manufacturing plants, laboratories, warehouses and other facilities in the United States and abroad. We believe our facilities are adequate for our present needs and, given planned improvements and construction, expect them to remain adequate for the foreseeable future.
On December 31, 2019, our segments had primary operations at the following locations:
| • | Aerospace – Scottsdale, Arizona; Burbank, Lincoln, Long Beach and Van Nuys, California; West Palm Beach, Florida; Brunswick, Pooler and Savannah, Georgia; Cahokia, Illinois; Bedford and Westfield, Massachusetts; Las Vegas, Nevada; Teterboro, New Jersey; New York, New York; Tulsa, Oklahoma; San Juan, Puerto Rico; Dallas and Houston, Texas; Dulles, Virginia; Appleton, Wisconsin; Brisbane, Cairns, Darwin, Perth and Sydney, Australia; Vienna, Austria; Beijing, Hong Kong and Shanghai, China; Berlin, Dusseldorf and Munich, Germany; Jakarta, Indonesia; Kuala Lumpur, Malaysia; Valetta, Malta; Mexicali, Mexico; Amsterdam and Rotterdam, the Netherlands; Manila, Philippines; Singapore; Basel, |
Geneva and Zurich, Switzerland; Bangkok, Thailand; Dubai and Fujairah, United Arab Emirates; Farnborough and Luton, United Kingdom.
| • | Combat Systems – Anniston, Alabama; East Camden and Hampton, Arkansas; Crawfordsville, St. Petersburg and Tallahassee, Florida; Marion, Illinois; Saco, Maine; Sterling Heights, Michigan; Joplin, Missouri; Lincoln, Nebraska; Lima, Ohio; Eynon, Red Lion and Scranton, Pennsylvania; Ladson, South Carolina; Garland, Texas; Williston, Vermont; Auburn and Sumner, Washington; Vienna, Austria; La Gardeur, London, St. Augustin and Valleyfield, Canada; Berlin, Kaiserslautern, Neubrandenburg and Woldegk, Germany; Granada, Madrid, Sevilla and Trubia, Spain; Kreuzlingen and Tägerwilen, Switzerland; Merthyr Tydfil and Oakdale, United Kingdom. |
| • | Information Technology – Daleville, Alabama; Pawcatuck, Connecticut; Bossier City, Louisiana; Annapolis Junction and Columbia, Maryland; Westwood, Massachusetts; Rensselaer, New York; Fayetteville, North Carolina; Arlington, Chesapeake, Sterling and several locations in Fairfax County, Virginia. |
| • | Mission Systems – Cullman, Alabama; Scottsdale, Arizona; San Jose, California; Orlando, Florida; Annapolis Junction, Maryland; Dedham, Pittsfield and Taunton, Massachusetts; Bloomington, Minnesota; Florham Park, New Jersey; Catawba, Conover and Greensboro, North Carolina; Kilgore, Plano and Wortham, Texas; Fairfax and Marion, Virginia; Calgary, Halifax and Ottawa, Canada; Tallinn, Estonia; Oakdale and St. Leonards, United Kingdom. |
| • | Marine Systems – San Diego, California; Groton, New London and Stonington, Connecticut; Jacksonville, Florida; Bath and Brunswick, Maine; North Kingstown, Rhode Island; Norfolk and Portsmouth, Virginia; Bremerton, Washington; Mexicali, Mexico. |
A summary of floor space by segment on December 31, 2019, follows:
| (Square feet in millions) | Company-owned Facilities | Leased Facilities | Government-owned Facilities | Total | |||||||
| Aerospace | 6.3 | 8.9 | — | 15.2 | |||||||
| Combat Systems | 6.1 | 4.3 | 5.5 | 15.9 | |||||||
| Information Technology | 0.2 | 4.7 | — | 4.9 | |||||||
| Mission Systems | 3.5 | 3.7 | 0.9 | 8.1 | |||||||
| Marine Systems | 8.2 | 3.8 | — | 12.0 | |||||||
| Total square feet | 24.3 | 25.4 | 6.4 | 56.1 |
Item 3. LEGAL PROCEEDINGS
For information relating to legal proceedings, see Note O to the Consolidated Financial Statements in Item 8.
Item 4. MINE SAFETY DISCLOSURES
Not applicable.
INFORMATION ABOUT OUR EXECUTIVE OFFICERS
All of our executive officers are appointed annually. None of our executive officers were selected pursuant to any arrangement or understanding between the officer and any other person. The name, age, offices and positions of our executives held for at least the past five years as of February 10, 2020, were as follows (references are to positions with General Dynamics Corporation, unless otherwise noted):
| Name, Position and Office | Age |
| Jason W. Aiken - Senior Vice President and Chief Financial Officer since January 2014; Vice President of the company and Chief Financial Officer of Gulfstream Aerospace Corporation, September 2011 - December 2013; Vice President and Controller, April 2010 - August 2011; Staff Vice President, Accounting, July 2006 - March 2010 | 47 |
| Christopher J. Brady - Vice President of the company and President of General Dynamics Mission Systems since January 2019; Vice President, Engineering of General Dynamics Mission Systems, January 2015 - December 2018; Vice President, Engineering of General Dynamics C4 Systems, May 2013 - December 2014; Vice President, Assured Communications Systems of General Dynamics C4 Systems, August 2004 - May 2013 | 57 |
| Mark L. Burns - Vice President of the company and President of Gulfstream Aerospace Corporation since July 2015; Vice President of the company since February 2014; President, Product Support of Gulfstream Aerospace Corporation, June 2008 - June 2015 | 60 |
| Gregory S. Gallopoulos - Senior Vice President, General Counsel and Secretary since January 2010; Vice President and Deputy General Counsel, July 2008 - January 2010; Managing Partner of Jenner & Block LLP, January 2005 - June 2008 | 60 |
| M. Amy Gilliland - Senior Vice President of the company since April 2015; President of General Dynamics Information Technology since September 2017; Deputy for Operations of General Dynamics Information Technology, April 2017 - September 2017; Senior Vice President, Human Resources and Administration, April 2015 - March 2017; Vice President, Human Resources, February 2014 - March 2015; Staff Vice President, Strategic Planning, January 2013 - February 2014; Staff Vice President, Investor Relations, June 2008 - January 2013 | 45 |
| Kevin M. Graney - Vice President of the company and President of Electric Boat Corporation since October 2019; Vice President of the company and President of NASSCO, January 2017 - October 2019; Vice President and General Manager of NASSCO, November 2013 - January 2017 | 55 |
| Kimberly A. Kuryea - Senior Vice President, Human Resources and Administration since April 2017; Vice President and Controller, September 2011 - March 2017; Chief Financial Officer of General Dynamics Advanced Information Systems, November 2007 - August 2011; Staff Vice President, Internal Audit, March 2004 - October 2007 | 52 |
| Christopher Marzilli - Executive Vice President, Information Technology and Mission Systems since January 2019; Vice President of the company and President of General Dynamics Mission Systems, January 2015 - December 2018; Vice President of the company and President of General Dynamics C4 Systems, January 2006 - December 2014; Senior Vice President and Deputy General Manager of General Dynamics C4 Systems, November 2003 - January 2006 | 60 |
| William A. Moss - Vice President and Controller since April 2017; Staff Vice President, Internal Audit, May 2015 - March 2017; Staff Vice President, Accounting, August 2010 - May 2015 | 56 |
| Phebe N. Novakovic - Chairman and Chief Executive Officer since January 2013; President and Chief Operating Officer, May 2012 - December 2012; Executive Vice President, Marine Systems, May 2010 - May 2012; Senior Vice President, Planning and Development, July 2005 - May 2010; Vice President, Strategic Planning, October 2002 - July 2005 | 62 |
| Mark C. Roualet - Executive Vice President, Combat Systems, since March 2013; Vice President of the company and President of General Dynamics Land Systems, October 2008 - March 2013; Senior Vice President and Chief Operating Officer of General Dynamics Land Systems, July 2007 - October 2008 | 61 |
| Robert E. Smith - Executive Vice President, Marine Systems, since July 2019; Vice President of the company and President of Jet Aviation, January 2014 - July 2019; Vice President and Chief Financial Officer of Jet Aviation, July 2012 - January 2014 | 52 |
| Gary L. Whited - Vice President of the company and President of General Dynamics Land Systems since March 2013; Senior Vice President of General Dynamics Land Systems, September 2011 - March 2013; Vice President and Chief Financial Officer of General Dynamics Land Systems, June 2006 - September 2011 | 59 |
PART II
Item 5. MARKET FOR THE COMPANY’S COMMON EQUITY, RELATED STOCKHOLDER MATTERS AND ISSUER PURCHASES OF EQUITY SECURITIES
Our common stock is listed on the New York Stock Exchange under the trading symbol “GD.”
On January 26, 2020, there were approximately 10,000 holders of record of our common stock.
For information regarding securities authorized for issuance under our equity compensation plans, see Note Q to the Consolidated Financial Statements contained in Item 8.
We did not make any unregistered sales of equity securities in 2019.
The following table provides information about our fourth-quarter purchases of equity securities that are registered pursuant to Section 12 of the Securities Exchange Act of 1934, as amended:
| Period | Total Number of Shares | Average Price per Share | |||||
| Shares Delivered or Withheld Pursuant to Restricted Stock Vesting* | |||||||
| 9/30/19-10/27/19 | 36 | $ | 184.36 | ||||
| 10/28/19-11/24/19 | 412 | 183.36 | |||||
| 11/25/19-12/31/19 | — | — | |||||
| 448 | $ | 183.44 |
- Represents shares withheld by, or delivered to, us pursuant to provisions in agreements with recipients of restricted stock granted under our equity compensation plans that allow us to withhold, or the recipient to deliver to us, the number of shares with a fair value equal to the statutory tax withholding due upon vesting of the restricted shares.
On December 5, 2018, the board of directors authorized management to repurchase up to 10 million additional shares of the company’s outstanding common stock on the open market. We did not repurchase any shares in the fourth quarter of 2019. On December 31, 2019, 6.4 million shares remained authorized by our board of directors for repurchase.
For additional information relating to our purchases of common stock during the past three years, see Note M to the Consolidated Financial Statements in Item 8.
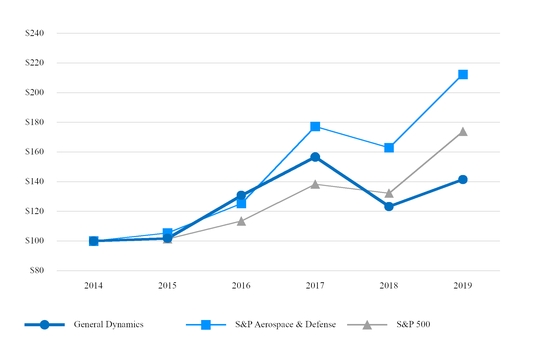
The following performance graph compares the cumulative total return to shareholders on our common stock, assuming reinvestment of dividends, with similar returns for the Standard & Poor’s® 500 Index and the Standard & Poor’s® Aerospace & Defense Index, both of which include General Dynamics.
Cumulative Total Return
Based on Investments of $100 Beginning December 31, 2014
(Assumes Reinvestment of Dividends)
Item 6. SELECTED FINANCIAL DATA
The following table presents selected historical financial data derived from the Consolidated Financial Statements and other company information for each of the five years presented. This information should be read in conjunction with Management’s Discussion and Analysis of Financial Condition and Results of Operations in Item 7 and the Consolidated Financial Statements and the Notes thereto in Item 8.
| (Dollars and shares in millions, except per-share and employee amounts) | ||||||||||||||||||||
| 2019 | 2018 | 2017 | 2016 | 2015 | ||||||||||||||||
| Summary of Operations | ||||||||||||||||||||
| Revenue | $ | 39,350 | $ | 36,193 | $ | 30,973 | $ | 30,561 | $ | 31,781 | ||||||||||
| Operating earnings | 4,648 | 4,457 | 4,236 | 3,744 | 4,494 | |||||||||||||||
| Operating margin | 11.8 | % | 12.3 | % | 13.7 | % | 12.3 | % | 14.1 | % | ||||||||||
| Interest, net | (460 | ) | (356 | ) | (103 | ) | (91 | ) | (83 | ) | ||||||||||
| Provision for income tax, net | (718 | ) | (727 | ) | (1,165 | ) | (977 | ) | (1,183 | ) | ||||||||||
| Earnings from continuing operations | 3,484 | 3,358 | 2,912 | 2,679 | 3,036 | |||||||||||||||
| Return on sales (a) | 8.9 | % | 9.3 | % | 9.4 | % | 8.8 | % | 9.6 | % | ||||||||||
| Discontinued operations, net of tax | — | (13 | ) | — | (107 | ) | — | |||||||||||||
| Net earnings | 3,484 | 3,345 | 2,912 | 2,572 | 3,036 | |||||||||||||||
| Diluted earnings per share: | ||||||||||||||||||||
| Continuing operations | 11.98 | 11.22 | 9.56 | 8.64 | 9.29 | |||||||||||||||
| Net earnings | 11.98 | 11.18 | 9.56 | 8.29 | 9.29 | |||||||||||||||
| Cash Flows | ||||||||||||||||||||
| Net cash provided by operating activities | $ | 2,981 | $ | 3,148 | $ | 3,876 | $ | 2,163 | $ | 2,607 | ||||||||||
| Net cash (used) provided by investing activities | (994 | ) | (10,234 | ) | (788 | ) | (391 | ) | 200 | |||||||||||
| Net cash (used) provided by financing activities | (1,997 | ) | 5,086 | (2,399 | ) | (2,169 | ) | (4,367 | ) | |||||||||||
| Net cash used by discontinued operations | (51 | ) | (20 | ) | (40 | ) | (54 | ) | (43 | ) | ||||||||||
| Cash dividends declared per common share | 4.08 | 3.72 | 3.36 | 3.04 | 2.76 | |||||||||||||||
| Financial Position | ||||||||||||||||||||
| Cash and equivalents | $ | 902 | $ | 963 | $ | 2,983 | $ | 2,334 | $ | 2,785 | ||||||||||
| Total assets | 48,841 | 45,408 | 35,046 | 33,172 | 32,538 | |||||||||||||||
| Short- and long-term debt | 11,930 | 12,417 | 3,982 | 3,888 | 3,399 | |||||||||||||||
| Shareholders’ equity | 13,577 | 11,732 | 11,435 | 10,301 | 10,440 | |||||||||||||||
| Debt-to-equity (b) | 87.9 | % | 105.8 | % | 34.8 | % | 37.7 | % | 32.6 | % | ||||||||||
| Debt-to-capital (c) | 46.8 | % | 51.4 | % | 25.8 | % | 27.4 | % | 24.6 | % | ||||||||||
| Book value per share (d) | 46.88 | 40.64 | 38.52 | 34.06 | 33.36 | |||||||||||||||
| Other Information | ||||||||||||||||||||
| Free cash flow from operations (e) | $ | 1,994 | $ | 2,458 | $ | 3,448 | $ | 1,771 | $ | 2,038 | ||||||||||
| Return on equity (f) | 27.2 | % | 28.1 | % | 26.6 | % | 25.6 | % | 27.7 | % | ||||||||||
| Return on invested capital (e) | 14.0 | % | 15.4 | % | 16.8 | % | 16.3 | % | 18.1 | % | ||||||||||
| Funded backlog | 57,530 | 55,826 | 52,031 | 51,783 | 53,449 | |||||||||||||||
| Total backlog | 86,945 | 67,871 | 63,175 | 62,206 | 67,786 | |||||||||||||||
| Shares outstanding | 289.6 | 288.7 | 296.9 | 302.4 | 313.0 | |||||||||||||||
| Weighted average shares outstanding: | ||||||||||||||||||||
| Basic | 288.3 | 295.3 | 299.2 | 304.7 | 321.3 | |||||||||||||||
| Diluted | 290.8 | 299.2 | 304.6 | 310.4 | 326.7 | |||||||||||||||
| Employees | 102,900 | 105,600 | 98,600 | 98,800 | 99,900 |
| (a) | Return on sales is calculated as earnings from continuing operations divided by revenue. |
| (b) | Debt-to-equity ratio is calculated as total debt divided by total equity as of year end. |
| (c) | Debt-to-capital ratio is calculated as total debt divided by the sum of total debt plus total equity as of year end. |
| (d) | Book value per share is calculated as total equity divided by total outstanding shares as of year end. |
| (e) | See Item 7, Management’s Discussion and Analysis of Financial Condition and Results of Operations, for a reconciliation of net cash provided by operating activities to free cash flow from operations and the calculation of return on invested capital (ROIC), both of which are non-GAAP management metrics. |
| (f) | Return on equity is calculated by dividing earnings from continuing operations by our average equity during the year. |
Item 7. MANAGEMENT’S DISCUSSION AND ANALYSIS OF FINANCIAL CONDITION AND RESULTS OF OPERATIONS
(Dollars in millions, except per-share amounts or unless otherwise noted)
A discussion regarding our financial condition and results of operations for 2019 compared with 2018 is presented below. A discussion regarding our financial condition and results of operations for 2018 compared with 2017 can be found in Item 7 of our Annual Report on Form 10-K for the year ended December 31, 2018.
For an overview of our operating segments, including a discussion of our major products and services, see the Business discussion contained in Item 1. The following discussion should be read in conjunction with our Consolidated Financial Statements included in Item 8.
BUSINESS ENVIRONMENT
With approximately 65% of our revenue from the U.S. government, government spending levels, particularly defense spending, influence our financial performance. Over the past several years, U.S. defense spending has been mandated by the Budget Control Act of 2011 (BCA). The BCA establishes spending caps over a 10-year period through 2021, including a sequester mechanism that would impose additional defense cuts if an annual defense appropriations bill is enacted above the spending cap.
On August 2, 2019, the Bipartisan Budget Act of 2019 (BBA) was signed into law, which raised discretionary spending limits established by the BCA for fiscal year (FY) 2020 and FY 2021. On December 20, 2019, the FY 2020 defense appropriations bill was signed into law. It totaled $691 billion and included $619 billion in the base budget in compliance with the BBA spending caps and $72 billion for overseas contingency operations, representing an increase of approximately 3% over the total FY 2019 spending level.
The long-term outlook for our U.S. defense business is influenced by the U.S. military’s funding priorities, the diversity of our programs and customers, our insight into customer requirements stemming from our incumbency on core programs, our ability to evolve our products to address a fast-changing threat environment and our proven track record of successful contract execution.
International demand for military equipment and information technologies presents opportunities for our non-U.S. operations and exports from our North American businesses. While the revenue potential can be significant, there are risks to doing business in foreign countries, including changing budget priorities and overall spending pressures unique to each country.
In our Aerospace segment, we continue to experience strong demand across our product portfolio. We expect our investment in the development of new aircraft products and technologies to support the Aerospace segment’s long-term growth. Similarly, we believe the aircraft services business will be a source of steady revenue growth as the global business-jet fleet continues to grow.
RESULTS OF OPERATIONS
INTRODUCTION
An understanding of our accounting practices is necessary in the evaluation of our financial statements and operating results. The following paragraphs explain how we recognize revenue and operating costs in our operating segments and the terminology we use to describe our operating results.
In the Aerospace segment, we record revenue on contracts for new aircraft when the customer obtains control of the asset, which is generally upon delivery and acceptance by the customer of the fully outfitted aircraft. Revenue associated with the segment’s custom completions of narrow-body and wide-body aircraft and the segment’s services businesses is recognized as work progresses or upon delivery of services. Fluctuations in revenue from period to period result from the number and mix of new aircraft deliveries, progress on aircraft completions, and the level and type of aircraft services performed during the period.
The majority of the Aerospace segment’s operating costs relates to new aircraft production on firm orders and consists of labor, material, subcontractor and overhead costs. The costs are accumulated in production lots, recorded in inventory and recognized as operating costs at aircraft delivery based on the estimated average unit cost in a production lot. While changes in the estimated average unit cost for a production lot impact the level of operating costs, the amount of operating costs reported in a given period is based largely on the number and type of aircraft delivered. Operating costs in the Aerospace segment’s completions and services businesses are recognized generally as incurred.
For new aircraft, operating earnings and margin are a function of the prices of our aircraft, our operational efficiency in manufacturing and outfitting the aircraft, and the mix of ultra-large-cabin, large-cabin and mid-cabin aircraft deliveries. Aircraft mix can also refer to the stage of program maturity for our aircraft models. A new aircraft model typically has lower margins in its initial production lots, and then margins generally increase as we realize efficiencies in the production process. Additional factors affecting the segment’s earnings and margin include the volume, mix and profitability of completions and services work performed, the volume of and market for pre-owned aircraft, and the level of general and administrative (G&A) and net research and development (R&D) costs incurred by the segment.
In the defense segments, revenue on long-term government contracts is recognized generally over time as the work progresses, either as products are produced or as services are rendered. Typically, revenue is recognized over time using costs incurred to date relative to total estimated costs at completion to measure progress toward satisfying our performance obligations. Incurred cost represents work performed, which corresponds with, and thereby best depicts, the transfer of control to the customer. Contract costs include labor, material, overhead and, when appropriate, G&A expenses. Variances in costs recognized from period to period reflect primarily increases and decreases in production or activity levels on individual contracts. Because costs are used as a measure of progress, year-over-year variances in cost result in corresponding variances in revenue, which we generally refer to as volume.
Operating earnings and margin in the defense segments are driven by changes in volume, performance or contract mix. Performance refers to changes in profitability based on adjustments to estimates at completion on individual contracts. These adjustments result from increases or decreases to the estimated value of the contract, the estimated costs to complete the contract or both. Therefore, changes in costs incurred in the period compared with prior periods do not necessarily impact profitability. It is only when total estimated costs at completion on a given contract change without a corresponding change in the contract value (or vice versa) that the profitability of that contract may be impacted. Contract mix refers to changes in the volume of higher- versus lower-margin work. Higher or lower margins can result from a
number of factors, including contract type (e.g., fixed-price/cost-reimbursable) and type of work (e.g., development/production). Contract mix can also refer to the stage of program maturity for our long-term production contracts. New long-term production contracts typically have lower margins initially, and then margins generally increase as we achieve learning curve improvements or realize other cost reductions.
CONSOLIDATED OVERVIEW
2019 IN REVIEW
| • | Record-high operating performance: |
| ◦ | Revenue of $39.4 billion with growth in all of our segments. |
| ◦ | Operating earnings of $4.6 billion, an increase of 4.3% from 2018. |
| ◦ | Earnings from continuing operations per diluted share of $11.98, an increase of 6.8% from 2018. |
| • | Record-high backlog of $86.9 billion increased $1 |
Showing the first 8K of 72K characters. Open the full section
Item 7A. QUANTITATIVE AND QUALITATIVE DISCLOSURES ABOUT MARKET RISK
We are exposed to market risk, primarily from foreign currency exchange rates, interest rates, commodity prices and investments. See Note N to the Consolidated Financial Statements in Item 8 for a discussion of these risks. The following quantifies the market risk exposure arising from hypothetical changes in foreign currency exchange rates and interest rates.
We had notional forward exchange and interest rate swap contracts outstanding of $5 billion and $5.8 billion on December 31, 2019 and 2018, respectively. A 10% unfavorable rate movement in our portfolio of forward exchange and interest rate swap contracts would have resulted in the following hypothetical, incremental pretax gains (losses):
| (Dollars in millions) | 2019 | 2018 | |||||
| Recognized | $ | 60 | $ | 61 | |||
| Unrecognized | (161 | ) | (135 | ) |
Foreign Currency Risk. Our exchange-rate sensitivity relates primarily to changes in the Canadian dollar, euro, Swiss franc and British pound exchange rates. These losses and gains would be offset by corresponding gains and losses in the remeasurement of the underlying transactions being hedged. We believe these foreign currency forward exchange contracts and the offsetting underlying commitments, when taken together, do not create material market risk.
Interest Rate Risk. Our financial instruments subject to interest rate risk include variable-rate commercial paper and fixed- and floating-rate long-term debt obligations. On December 31, 2019, we had $10.5 billion par value of fixed-rate debt and $1 billion of floating-rate notes. Our fixed-rate debt obligations are not putable, and we do not trade these securities in the market. A 10% unfavorable interest rate movement would not have a material impact on the fair value of our fixed-rate debt. As described in Note K to the Consolidated Financial Statements in Item 8, we entered into derivative financial instruments, specifically interest rate swap contracts, to eliminate our floating-rate interest risk.
Investment Risk. Our investment policy allows for purchases of fixed-income securities with an investment-grade rating and a maximum maturity of up to five years. On December 31, 2019, we held $902 in cash and equivalents, but held no marketable securities other than those held in trust to meet some of our obligations under workers’ compensation and non-qualified supplemental executive retirement plans. On December 31, 2019, these marketable securities totaled $207 and were reflected at fair value on the Consolidated Balance Sheet in other current and noncurrent assets.
Item 8. FINANCIAL STATEMENTS AND SUPPLEMENTARY DATA
CONSOLIDATED STATEMENT OF EARNINGS
| Year Ended December 31 | |||||||||||
| (Dollars in millions, except per-share amounts) | 2019 | 2018 | 2017 | ||||||||
| Revenue: | |||||||||||
| Products | $ | 23,130 | $ | 20,149 | $ | 19,016 | |||||
| Services | 16,220 | 16,044 | 11,957 | ||||||||
| 39,350 | 36,193 | 30,973 | |||||||||
| Operating costs and expenses: | |||||||||||
| Products | (18,569 | ) | (15,894 | ) | (14,773 | ) | |||||
| Services | (13,722 | ) | (13,584 | ) | (9,958 | ) | |||||
| General and administrative (G&A) | (2,411 | ) | (2,258 | ) | (2,006 | ) | |||||
| (34,702 | ) | (31,736 | ) | (26,737 | ) | ||||||
| Operating earnings | 4,648 | 4,457 | 4,236 | ||||||||
| Interest, net | (460 | ) | (356 | ) | (103 | ) | |||||
| Other, net | 14 | (16 | ) | (56 | ) | ||||||
| Earnings from continuing operations before income tax | 4,202 | 4,085 | 4,077 | ||||||||
| Provision for income tax, net | (718 | ) | (727 | ) | (1,165 | ) | |||||
| Earnings from continuing operations | 3,484 | 3,358 | 2,912 | ||||||||
| Discontinued operations, net of tax provision of $13 in 2018 | — | (13 | ) | — | |||||||
| Net earnings | $ | 3,484 | $ | 3,345 | $ | 2,912 | |||||
| Earnings per share | |||||||||||
| Basic: | |||||||||||
| Continuing operations | $ | 12.09 | $ | 11.37 | $ | 9.73 | |||||
| Discontinued operations | — | (0.04 | ) | — | |||||||
| Net earnings | $ | 12.09 | $ | 11.33 | $ | 9.73 | |||||
| Diluted: | |||||||||||
| Continuing operations | $ | 11.98 | $ | 11.22 | $ | 9.56 | |||||
| Discontinued operations | — | (0.04 | ) | — | |||||||
| Net earnings | $ | 11.98 | $ | 11.18 | $ | 9.56 |
The accompanying Notes to Consolidated Financial Statements are an integral part of these financial statements.
CONSOLIDATED STATEMENT OF COMPREHENSIVE INCOME
| Year Ended December 31 | ||||||||||||
| (Dollars in millions) | 2019 | 2018 | 2017 | |||||||||
| Net earnings | $ | 3,484 | $ | 3,345 | $ | 2,912 | ||||||
| Gains on cash flow hedges | 97 | 36 | 341 | |||||||||
| Unrealized gains on marketable securities | — | — | 9 | |||||||||
| Foreign currency translation adjustments | 186 | (300 | ) | 348 | ||||||||
| Change in retirement plans’ funded status | (886 | ) | (61 | ) | 20 | |||||||
| Other comprehensive (loss) income, pretax | (603 | ) | (325 | ) | 718 | |||||||
| Benefit (provision) for income tax, net | 162 | 5 | (151 | ) | ||||||||
| Other comprehensive (loss) income, net of tax | (441 | ) | (320 | ) | 567 | |||||||
| Comprehensive income | $ | 3,043 | $ | 3,025 | $ | 3,479 |
The accompanying Notes to Consolidated Financial Statements are an integral part of these financial statements.
CONSOLIDATED BALANCE SHEET
| December 31 | |||||||
| (Dollars in millions) | 2019 | 2018 | |||||
| ASSETS | |||||||
| Current assets: | |||||||
| Cash and equivalents | $ | 902 | $ | 963 | |||
| Accounts receivable | 3,544 | 3,759 | |||||
| Unbilled receivables | 7,857 | 6,576 | |||||
| Inventories | 6,306 | 5,977 | |||||
| Other current assets | 1,171 | 914 | |||||
| Total current assets | 19,780 | 18,189 | |||||
| Noncurrent assets: | |||||||
| Property, plant and equipment, net | 4,475 | 3,978 | |||||
| Intangible assets, net | 2,315 | 2,585 | |||||
| Goodwill | 19,677 | 19,594 | |||||
| Other assets | 2,594 | 1,062 | |||||
| Total noncurrent assets | 29,061 | 27,219 | |||||
| Total assets | $ | 48,841 | $ | 45,408 | |||
| LIABILITIES AND SHAREHOLDERS’ EQUITY | |||||||
| Current liabilities: | |||||||
| Short-term debt and current portion of long-term debt | $ | 2,920 | $ | 973 | |||
| Accounts payable | 3,162 | 3,179 | |||||
| Customer advances and deposits | 7,148 | 7,270 | |||||
| Other current liabilities | 3,571 | 3,317 | |||||
| Total current liabilities | 16,801 | 14,739 | |||||
| Noncurrent liabilities: | |||||||
| Long-term debt | 9,010 | 11,444 | |||||
| Other liabilities | 9,453 | 7,493 | |||||
| Commitments and contingencies (see Note O) | |||||||
| Total noncurrent liabilities | 18,463 | 18,937 | |||||
| Shareholders’ equity: | |||||||
| Common stock | 482 | 482 | |||||
| Surplus | 3,039 | 2,946 | |||||
| Retained earnings | 31,633 | 29,326 | |||||
| Treasury stock | (17,358 | ) | (17,244 | ) | |||
| Accumulated other comprehensive loss | (4,219 | ) | (3,778 | ) | |||
| Total shareholders’ equity | 13,577 | 11,732 | |||||
| Total liabilities and shareholders’ equity | $ | 48,841 | $ | 45,408 |
The accompanying Notes to Consolidated Financial Statements are an integral part of these financial statements.
CONSOLIDATED STATEMENT OF CASH FLOWS
| Year Ended December 31 | |||||||||||
| (Dollars in millions) | 2019 | 2018 | 2017 | ||||||||
| Cash flows from operating activities - continuing operations: | |||||||||||
| Net earnings | $ | 3,484 | $ | 3,345 | $ | 2,912 | |||||
| Adjustments to reconcile net earnings to net cash from operating activities: | |||||||||||
| Depreciation of property, plant and equipment | 466 | 436 | 362 | ||||||||
| Amortization of intangible and finance lease right-of-use assets | 363 | 327 | 79 | ||||||||
| Equity-based compensation expense | 133 | 140 | 123 | ||||||||
| Deferred income tax (benefit) provision | 92 | (3 | ) | 401 | |||||||
| Discontinued operations, net of tax | — | 13 | — | ||||||||
| (Increase) decrease in assets, net of effects of business acquisitions: | |||||||||||
| Accounts receivable | 176 | 417 | (195 | ) | |||||||
| Unbilled receivables | (1,303 | ) | (800 | ) | (987 | ) | |||||
| Inventories | (376 | ) | (591 | ) | (182 | ) | |||||
| Other current assets | 8 | 310 | 207 | ||||||||
| Increase (decrease) in liabilities, net of effects of business acquisitions: | |||||||||||
| Accounts payable | 6 | (197 | ) | 657 | |||||||
| Customer advances and deposits | (105 | ) | 36 | 264 | |||||||
| Other, net | 37 | (285 | ) | 235 | |||||||
| Net cash provided by operating activities | 2,981 | 3,148 | 3,876 | ||||||||
| Cash flows from investing activities: | |||||||||||
| Capital expenditures | (987 | ) | (690 | ) | (428 | ) | |||||
| Business a |
Showing the first 8K of 184K characters. Open the full section
Item 9. CHANGES IN AND DISAGREEMENTS WITH ACCOUNTANTS ON ACCOUNTING AND FINANCIAL DISCLOSURE
None.
Item 9A. CONTROLS AND PROCEDURES
EVALUATION OF DISCLOSURE CONTROLS AND PROCEDURES
Our management, under the supervision and with the participation of the Chief Executive Officer and the Chief Financial Officer, evaluated the effectiveness of our disclosure controls and procedures as of December 31, 2019, (as defined in Rule 13a-15(e) and Rule 15d-15(e) under the Securities Exchange Act of 1934, as amended). Based on this evaluation, the Chief Executive Officer and Chief Financial Officer concluded that, on December 31, 2019, our disclosure controls and procedures were effective.
The certifications of the company’s Chief Executive Officer and Chief Financial Officer required under Section 302 of the Sarbanes-Oxley Act have been filed as Exhibits 31.1 and 31.2 to this report.
MANAGEMENT’S REPORT ON INTERNAL CONTROL OVER FINANCIAL REPORTING
To the Shareholders of General Dynamics Corporation:
The management of General Dynamics Corporation is responsible for establishing and maintaining adequate internal control over financial reporting and for its assessment of the effectiveness of internal control over financial reporting as defined in Rules 13a-15(f) and 15d-15(f) under the Exchange Act. Our internal control system was designed to provide reasonable assurance to our management and board of directors regarding the preparation and fair presentation of published financial statements.
Because of its inherent limitations, internal control over financial reporting may not prevent or detect misstatements. Also, projections of any evaluation of effectiveness to future periods are subject to the risk that controls may become inadequate because of changes in conditions, or that the degree of compliance with the policies or procedures may deteriorate.
Our management evaluated the effectiveness of our internal control over financial reporting as of December 31, 2019. In making this evaluation, we used the criteria set forth by the Committee of Sponsoring Organizations of the Treadway Commission in Internal Control – Integrated Framework (2013). Based on our evaluation we believe that, as of December 31, 2019, our internal control over financial reporting is effective based on those criteria.
KPMG LLP has issued an audit report on the effectiveness of our internal control over financial reporting. The KPMG report immediately follows this report.
 |  | |||
| Phebe N. Novakovic | Jason W. Aiken | |||
| Chairman and Chief Executive Officer | Senior Vice President and Chief Financial Officer |
REPORT OF INDEPENDENT REGISTERED PUBLIC ACCOUNTING FIRM
To the Board of Directors and Shareholders of General Dynamics Corporation:
Opinion on Internal Control Over Financial Reporting
We have audited General Dynamics Corporation and subsidiaries’ (the Company) internal control over financial reporting as of December 31, 2019, based on criteria established in Internal Control – Integrated Framework (2013) issued by the Committee of Sponsoring Organizations of the Treadway Commission. In our opinion, the Company maintained, in all material respects, effective internal control over financial reporting as of December 31, 2019, based on criteria established in Internal Control – Integrated Framework (2013) issued by the Committee of Sponsoring Organizations of the Treadway Commission.
We also have audited, in accordance with the standards of the Public Company Accounting Oversight Board (United States) (PCAOB), the Consolidated Balance Sheet of the Company as of December 31, 2019 and 2018, the related Consolidated Statements of Earnings, Comprehensive Income, Cash Flows, and Shareholders’ Equity for each of the years in the three-year period ended December 31, 2019, and the related notes (collectively, the Consolidated Financial Statements), and our report dated February 10, 2020, expressed an unqualified opinion on those Consolidated Financial Statements.
Basis for Opinion
The Company’s management is responsible for maintaining effective internal control over financial reporting and for its assessment of the effectiveness of internal control over financial reporting, included in the accompanying Management’s Report on Internal Control over Financial Reporting. Our responsibility is to express an opinion on the Company’s internal control over financial reporting based on our audit. We are a public accounting firm registered with the PCAOB and are required to be independent with respect to the Company in accordance with the U.S. federal securities laws and the applicable rules and regulations of the Securities and Exchange Commission and the PCAOB.
We conducted our audit in accordance with the standards of the PCAOB. Those standards require that we plan and perform the audit to obtain reasonable assurance about whether effective internal control over financial reporting was maintained in all material respects. Our audit of internal control over financial reporting included obtaining an understanding of internal control over financial reporting, assessing the risk that a material weakness exists, and testing and evaluating the design and operating effectiveness of internal control based on the assessed risk. Our audit also included performing such other procedures as we considered necessary in the circumstances. We believe that our audit provides a reasonable basis for our opinion.
Definition and Limitations of Internal Control Over Financial Reporting
A company’s internal control over financial reporting is a process designed to provide reasonable assurance regarding the reliability of financial reporting and the preparation of financial statements for external purposes in accordance with generally accepted accounting principles. A company’s internal control over financial reporting includes those policies and procedures that (1) pertain to the maintenance of records that, in reasonable detail, accurately and fairly reflect the transactions and dispositions of the assets of the company; (2) provide reasonable assurance that transactions are recorded as necessary to permit preparation of financial statements in accordance with generally accepted accounting principles, and that receipts and expenditures of the company are being made only in accordance with authorizations of management and directors of the company; and (3) provide reasonable assurance regarding prevention or timely detection
of unauthorized acquisition, use, or disposition of the company’s assets that could have a material effect on the financial statements.
Because of its inherent limitations, internal control over financial reporting may not prevent or detect misstatements. Also, projections of any evaluation of effectiveness to future periods are subject to the risk that controls may become inadequate because of changes in conditions, or that the degree of compliance with the policies or procedures may deteriorate.
 | ||
| McLean, Virginia | ||
| February 10, 2020 |
CHANGES IN INTERNAL CONTROL OVER FINANCIAL REPORTING
There were no changes in our internal control over financial reporting that occurred during the quarter ended December 31, 2019, that have materially affected, or are reasonably likely to materially affect, our internal control over financial reporting.
Item 9B. OTHER INFORMATION
None.
PART III
Item 10. DIRECTORS, EXECUTIVE OFFICERS AND CORPORATE GOVERNANCE
The information required to be set forth herein, except for the information included under Information About Our Executive Officers in Part I, is included in the sections entitled “Election of the Board of Directors of the Company,” “Governance of the Company – Our Culture of Ethics,” “Audit Committee Report” and, if included, “Other Information – Delinquent Section 16(a) Reports” in our definitive proxy statement for our 2020 annual shareholders meeting (the Proxy Statement), which sections are incorporated herein by reference.
Item 11. EXECUTIVE COMPENSATION
The information required to be set forth herein is included in the sections entitled “Governance of the Company – Director Compensation,” “Compensation Discussion and Analysis,” “Executive Compensation” and “Compensation Committee Report” in our Proxy Statement, which sections are incorporated herein by reference.
Item 12. SECURITY OWNERSHIP OF CERTAIN BENEFICIAL OWNERS AND MANAGEMENT AND RELATED STOCKHOLDER MATTERS
The information required to be set forth herein is included in the sections entitled “Security Ownership of Management” and “Security Ownership of Certain Beneficial Owners” in our Proxy Statement, which sections are incorporated herein by reference.
The information required to be set forth herein with respect to securities authorized for issuance under our equity compensation plans is included in the section entitled “Equity Compensation Plan Information” in our Proxy Statement, which section is incorporated herein by reference.
Item 13. CERTAIN RELATIONSHIPS AND RELATED TRANSACTIONS, AND DIRECTOR INDEPENDENCE
The information required to be set forth herein is included in the sections entitled “Governance of the Company – Related Person Transactions Policy” and “Governance of the Company – Director Independence” in our Proxy Statement, which sections are incorporated herein by reference.
Item 14. PRINCIPAL ACCOUNTANT FEES AND SERVICES
The information required to be set forth herein is included in the section entitled “Selection of Independent Auditors – Audit and Non-Audit Fees” in our Proxy Statement, which section is incorporated herein by reference.
PART IV
Item 15. EXHIBITS
| 1. | Consolidated Financial Statements |
| Consolidated Statement of Earnings |
| Consolidated Statement of Comprehensive Income |
| Consolidated Balance Sheet |
| Consolidated Statement of Cash Flows |
| Consolidated Statement of Shareholders’ Equity |
| Notes to Consolidated Financial Statements (A to T) |
| 2. | Index to Exhibits - General Dynamics Corporation |
Commission File No. 1-3671
Exhibits listed below, which have been filed with the Commission pursuant to the Securities Act of 1933, as amended, or the Securities Exchange Act of 1934, as amended, and which were filed as noted below, are hereby incorporated by reference and made a part of this report with the same effect as if filed herewith.
| 32.2 | Certification by CFO pursuant to 18 U.S.C. Section 1350, as adopted pursuant to Section 906 of the Sarbanes-Oxley Act of 2002** |
| 101.INS | Inline eXtensible Business Reporting Language (XBRL) Instance Document – the instance document does not appear in the Interactive Data File because its XBRL tags are embedded within the Inline XBRL document. |
| 101.SCH | Inline XBRL Taxonomy Extension Schema Document** |
| 101.CAL | Inline XBRL Taxonomy Extension Calculation Linkbase Document** |
| 101.DEF | Inline XBRL Taxonomy Extension Definition Linkbase Document** |
| 101.LAB | Inline XBRL Taxonomy Extension Label Linkbase Document** |
| 101.PRE | Inline XBRL Taxonomy Extension Presentation Linkbase Document** |
| 104 | Cover Page Interactive Data File (embedded within the Inline XBRL document and contained in Exhibit 101) |
- Indicates a management contract or compensatory plan or arrangement required to be filed pursuant to Item 15(b) of Form 10-K.
** Filed or furnished herewith.
In accordance with Item 601(b)(4)(iii)(A) of Regulation S-K, copies of certain instruments defining the rights of holders of long-term debt of the company are not filed herewith. Pursuant to this regulation, we hereby agree to furnish a copy of any such instrument to the SEC upon request.
Item 16. FORM 10-K SUMMARY
None.
SIGNATURES
Pursuant to the requirements of the Securities Exchange Act of 1934, the Registrant has duly caused this report to be signed on its behalf by the undersigned thereunto duly authorized.
| GENERAL DYNAMICS CORPORATION | ||
| by |  | |
| William A. Moss | ||
| Vice President and Controller | ||
| Dated: February 10, 2020 |
Pursuant to the requirements of the Securities Exchange Act of 1934, this report has been signed below on February 10, 2020, by the following persons on behalf of the Registrant and in the capacities indicated, including a majority of the directors.
| Chairman, Chief Executive Officer and Director |
| Phebe N. Novakovic | (Principal Executive Officer) |
| Senior Vice President and Chief Financial Officer |
| Jason W. Aiken | (Principal Financial Officer) |
| Vice President and Controller |
| William A. Moss | (Principal Accounting Officer) |
| * | |
| James S. Crown | Director |
| * | |
| Rudy F. deLeon | Director |
| * | |
| Cecil D. Haney | Director |
| * | |
| Lester L. Lyles | Director |
| * | |
| Mark M. Malcolm | Director |
| * | |
| James N. Mattis | Director |
| * | |
| C. Howard Nye | Director |
| * | |
| William A. Osborn | Director |
| * | |
| Catherine B. Reynolds | Director |
| * | |
| Laura J. Schumacher | Director |
| * | |
| John G. Stratton | Director |
| * | |
| Peter A. Wall | Director |
- By Gregory S. Gallopoulos pursuant to a Power of Attorney executed by the directors listed above, which Power of Attorney has been filed as an exhibit hereto and incorporated herein by reference thereto.
 | |||
| Gregory S. Gallopoulos | |||
| Senior Vice President, General Counsel and Secretary |