 filings.tools
Item 5. Market for Registrant’s Common Equity, Related Stockholder Matters and Issuer Purchases of Equity Securities
6K characters. Original on sec.gov · Markdown
Item 5. Market for Registrant’s Common Equity, Related Stockholder Matters and Issuer Purchases of Equity Securities
Price Range of Common Stock
Our common stock is traded on the NASDAQ Global Select Market under the symbol “SYMC.” The high and low closing sales prices set forth below are as reported on the NASDAQ Global Select Market during each quarter of the two most recent fiscal years. During the fourth quarter of fiscal 2016, we paid a special dividend of $4.00 per share, resulting in a substantial decline in the sales price of our common stock on March 4, 2016.
| 2016 | 2015 | ||||||||||||||||||||||||||||||
| Fourth Quarter | Third Quarter | Second Quarter | First Quarter | Fourth Quarter | Third Quarter | Second Quarter | First Quarter | ||||||||||||||||||||||||
| High | $ | 20.88 | $ | 21.37 | $ | 23.47 | $ | 25.90 | $ | 26.69 | $ | 26.58 | $ | 24.77 | $ | 23.04 | |||||||||||||||
| Low | $ | 16.62 | $ | 19.50 | $ | 19.33 | $ | 23.03 | $ | 23.28 | $ | 21.94 | $ | 22.42 | $ | 19.97 |
Stockholders
As of April 1, 2016, there were 1,849 stockholders of record.
Dividends
During fiscal 2016, 2015 and 2014, we declared and paid aggregate cash dividends of $3.0 billion or $4.60 per common share, $413 million or $0.60 per common share, and $418 million or $0.60 per common share, respectively. Dividends declared and paid each quarter during fiscal 2016, 2015 and 2014 were $0.15 per share. Additionally, a special dividend of $4.00 per share was declared and paid in the fourth quarter of fiscal 2016. Our restricted stock and performance-based stock units have dividend equivalent rights entitling holders to dividend equivalents to be paid in the form of cash upon vesting, for each share of the underlying units. On May 12, 2016, we declared a cash dividend of $0.075 per share of common stock to be paid on June 22, 2016, to all stockholders of record as of the close of business on June 8, 2016. All future dividends and dividend equivalents are subject to the approval of our Board of Directors.
Repurchases of our equity securities
Through our stock repurchase programs we have repurchased shares on a quarterly basis since the fourth quarter of fiscal 2004. Under these programs, shares may be repurchased on the open market and through ASR transactions.
In November 2015, we entered into an ASR transaction with a financial institution to repurchase $500 million of our common stock. In January 2016, the purchase period for this ASR ended and we received an additional 5.0 million shares of our common stock. The total shares received and retired under the terms of this ASR transaction were 24.9 million, with an average price paid per share of $20.08.
In March 2016, we entered into multiple ASR transactions with financial institutions to repurchase an aggregate of $1 billion of our common stock. In exchange for an up-front payment of $1 billion, the financial institutions committed to deliver shares during the purchase period for these ASRs, which will end in or before the third quarter of fiscal 2017. During the fourth quarter of fiscal 2016, 42.4 million shares were delivered and retired under these ASRs, and the final number of shares to be delivered and the average price paid per share will be determined at the conclusion of the purchase period.
The maximum dollar value of shares that may yet be purchased under the plans or programs is $790 million. See Note 9 of our Notes to Consolidated Financial Statements for additional information regarding our stock repurchase programs.
Stock performance graph
This performance graph shall not be deemed “filed” for purposes of Section 18 of the Exchange Act or otherwise subject to the liabilities under that Section, and shall not be deemed to be incorporated by reference into any filing of Symantec under the Securities Act or the Exchange Act.
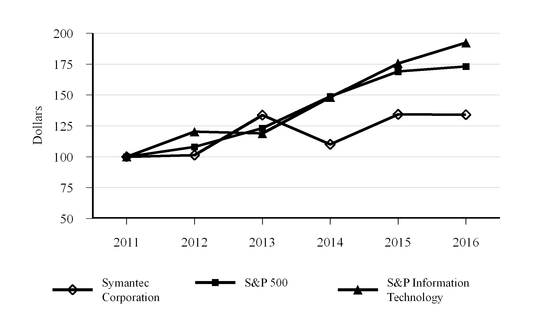
The graph below compares the cumulative total stockholder return on our common stock with the cumulative total return on the S&P 500 Composite Index and the S&P Information Technology Index for the five years ended April 1, 2016 (assuming the investment of $100 in our common stock and in each of the other indices on the last day of trading for fiscal 2011, and the reinvestment of all dividends). The comparisons in the graph below are based on historical data and are not intended to forecast the possible future performance of our common stock.
COMPARISON OF FIVE-YEAR CUMULATIVE TOTAL RETURN
Among Symantec Corporation, the S&P 500 Index
and the S&P Information Technology Index
| 2011 | 2012 | 2013 | 2014 | 2015 | 2016 | ||||||||||||||||||
| Symantec Corporation | $ | 100.00 | $ | 101.30 | $ | 133.69 | $ | 110.03 | $ | 134.25 | $ | 134.02 | |||||||||||
| S&P 500 | $ | 100.00 | $ | 108.00 | $ | 123.08 | $ | 148.80 | $ | 169.03 | $ | 173.18 | |||||||||||
| S&P Information Technology | $ | 100.00 | $ | 120.31 | $ | 118.96 | $ | 148.18 | $ | 175.60 | $ | 192.33 |
Previous: Item 4. Mine Safety Disclosures · Next: Item 6. Selected Financial Data