 filings.tools
Item 7. Management’s Discussion and Analysis of Financial Condition and Results of Operations
41K characters. Original on sec.gov · Markdown
Item 7. Management’s Discussion and Analysis of Financial Condition and Results of Operations
Please read the following discussion and analysis of our financial condition and results of operations together with our Consolidated Financial Statements and related Notes thereto included under Item 15 of this Annual Report on Form 10-K.
OVERVIEW
Fiscal calendar and basis of presentation
We have a 52/53-week fiscal year ending on the Friday closest to March 31. Unless otherwise stated, references to years in this report relate to fiscal year and periods ended March 31, 2017, April 1, 2016 and April 3, 2015. Our fiscal 2017 and 2016 were 52-week years whereas our fiscal 2015 was a 53-week year.
The results of Veritas are presented as discontinued operations in our Consolidated Statements of Operations and thus have been excluded from continuing operations and segment results for all reported periods. Accordingly, the following discussion reflects our current segment reporting structure, which was reduced from three to two segments, and segment results for all reported periods have been adjusted to conform to the current segment structure. In addition, the following discussion relates to our continuing operations unless stated otherwise.
Financial highlights and business trends
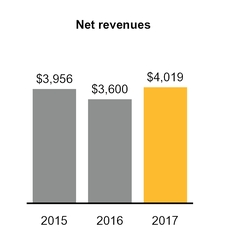
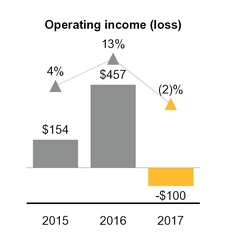
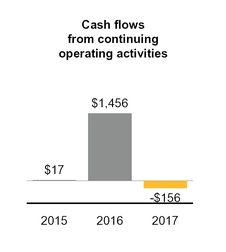
The following charts provide an overview of key financial metrics for each of the last three fiscal years in millions, except for percentage of revenues.


In fiscal 2017, we made two key acquisitions to expand our offerings in both our operating segments:
| • | In August 2016, we acquired Blue Coat, a provider of advanced web security solutions for global enterprises and governments. The addition of Blue Coat’s suite of network and cloud security products to our Enterprise Security segment has enhanced our existing portfolio of threat protection and information protection products while positioning us to provide new cybersecurity solutions that address the ever-evolving threat landscape. |
| • | In February 2017, we acquired LifeLock, a provider of proactive identity theft protection services for consumers and consumer risk management services for enterprises. The addition of LifeLock’s identity and fraud protection offerings to our Consumer Digital Safety segment allows us to provide a comprehensive digital safety solution designed to protect information across devices and users in the connected home and family. |
| • | See Note 6 of the Consolidated Financial Statements for additional information about our acquisitions. |
Here are our key financial results for continuing operations in fiscal 2017 as compared to fiscal 2016:
| • | Consolidated revenue increased by 12%, primarily driven by a 22% increase in revenue from our Enterprise Security segment due to the acquisition of Blue Coat. |
| • | Consumer Digital Safety segment revenue remained relatively flat as the Norton-branded product revenue decline of 4% was largely offset by increased revenue of $67 million due to the acquisition of LifeLock. During fiscal 2017, the Norton-branded product revenue decline improved year-over-year as we benefited from the shift to subscription-based contracts. |
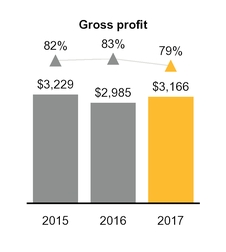
| • | Our gross margin decreased four percentage points primarily due to lower relative gross margins on Blue Coat and LifeLock revenue as a result of the impact of acquisition-related write-downs of pre-acquisition deferred revenues. Additionally, our gross margin was negatively impacted by amortization of $122 million of acquired Blue Coat and LifeLock intangible assets and the write-up of acquired inventory of $24 million related to the Blue Coat acquisition. |
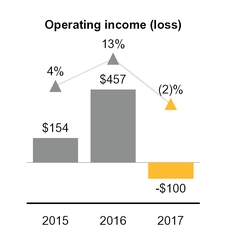
| • | Our operating margin decreased fifteen percentage points primarily due to increased operating expenses as a result of Blue Coat and LifeLock post-acquisition operating expenses including stock-based compensation from assumed equity awards and amortization of acquired intangible assets. We also incurred acquisition-related and integration expenses of $120 million related to the Blue Coat and LifeLock acquisitions. In addition, restructuring, transition, and other related costs increased year-over-year as a result of the implementation of new cost saving initiatives. |
| • | Cash paid for income taxes increased $779 million, primarily due to the one-time payment related to the gain on sale from the divestiture of Veritas during fiscal 2016. |
| • | Deferred revenue increased 6% to $2.8 billion from $2.6 billion as of March 31, 2017 and April 1, 2016, respectively, mainly as a result of our Blue Coat and LifeLock acquisitions. The increase was partly offset by the amortization of deferred revenue from Veritas retained contracts. |
We expect our operating margin to fluctuate in future periods as a result of a number of factors, including our operating results and the timing and amount of expenses incurred.
RESULTS OF OPERATIONS
Segment operating results
Enterprise Security Segment by fiscal year
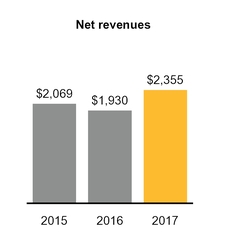
Our Enterprise Security segment protects organizations so they can securely conduct business while leveraging new platforms and data. The following tables are in millions except for percentage of revenues.

2017 compared to 2016
Revenue increased $425 million, or 22%, primarily due to $427 million in revenue from sales of Blue Coat network protection products. Due to the fair value adjustment of deferred revenue as a result of the accounting for the Blue Coat acquisition, we excluded revenue of $116 million in the post-acquisition period. In addition, services revenue increased $16 million while revenue from sales of endpoint management solutions decreased $23 million. Operating income increased $85 million, or 83%, primarily due to increased revenue, a reduction of expenses from new and ongoing cost savings initiatives, and favorable currency fluctuations of $16 million, and a decrease in unallocated corporate charges of $22 million. These increases were partially offset by increased expenses associated with the Blue Coat acquisition in the post-acquisition period, and acquired inventory write-up related to the Blue Coat acquisition of $24 million.
2016 compared to 2015
Revenue decreased $139 million, or 7%, primarily due to unfavorable foreign currency fluctuations of $90 million, as well as decrease in sales of endpoint management solutions and our mail cloud security products. Operating income decreased $191 million, or 65%, primarily due to decreased revenue and increased allocation of stranded costs. These stranded costs consist of overhead expenses resulting from the sale of Veritas and primarily include information technology infrastructure and services, and real estate costs. In addition, revenue decreased partially due to the impact of the additional week from the 53-week fiscal 2015 year.
Consumer Digital Safety Segment by fiscal year
Our Consumer Digital Safety segment focuses making it simple for customers to be productive and protected at home and at work. The following tables are in millions except for percentage of revenues.

2017 compared to 2016
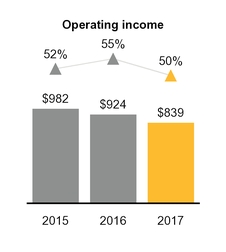
Revenue decreased $6 million primarily due to a decline in revenue from sales of Norton-branded products of $73 million as the revenue generated from customer additions was not sufficient to replace revenue lost through customer attrition. The decline was largely offset by a $67 million increase in revenue due to the acquisition of LifeLock. Due to the fair value adjustment of deferred revenue as a result of the accounting for the LifeLock acquisition, we excluded revenue of $28 million in the post-acquisition period. While the trend of declining revenues from sales of Norton-branded products continued in fiscal 2017, we began to benefit from the shift to subscription-based contracts, resulting in a lower decline in fiscal 2017 as compared to the prior two fiscal years. Operating income decreased $85 million, or 9%, primarily due to the Norton revenue decline coupled with a loss from LifeLock’s operations. LifeLock’s operating loss was a result of the deferred revenue fair value write-down.
2016 compared to 2015
Revenue decreased $217 million, or 11%, primarily due to new Norton customer acquisition not being sufficient to replace Norton customers lost through natural attrition and a reduction in revenue from OEM arrangements. Unfavorable currency fluctuations of $81 million also contributed to the decline in revenue. Operating income decreased $58 million, or 6%, primarily due to the decreases in revenue in this segment, which were partially offset by reductions in cost of revenue, sales and marketing and research and development expenses.
Net revenues by geographical region by fiscal year
Revenue by country as presented below is based on the billing location of the customer.
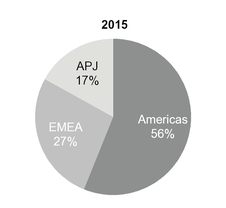
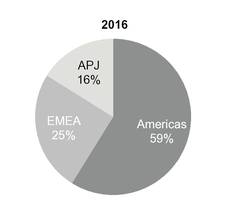
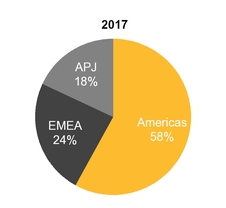
| Total: | $ | 3,956 | million | Total: | $ | 3,600 | million | Total: | $ | 4,019 | million |
Note: Americas include U.S., Canada and Latin America; EMEA includes Europe, Middle East and Africa; APJ includes Asia Pacific and Japan.
2017 compared to 2016
Fluctuations in the U.S. dollar compared to foreign currencies favorably impacted our international revenue by approximately $20 million for fiscal 2017 as compared to fiscal 2016. Fiscal 2017 revenue for the APJ region was favorably impacted by foreign currency fluctuations of $33 million. Fiscal 2017 revenue for the EMEA region was unfavorably impacted by foreign currency fluctuations of $13 million.
2016 compared to 2015
Fluctuations in the U.S. dollar compared to foreign currencies unfavorably impacted our international revenue by approximately $171 million for fiscal 2016 as compared to fiscal 2015. Fiscal 2016 revenue for the EMEA and APJ regions decreased primarily due to unfavorable foreign currency fluctuations of $119 million and $49 million, respectively, compared to fiscal 2015.
Our international sales are expected to continue to be a significant portion of our revenue. As a result, we expect revenue to continue to be affected by foreign currency exchange rates as compared to the U.S. dollar. We are unable to predict the extent to which revenue in future periods will be impacted by changes in foreign currency exchange rates. If international sales become a greater portion of our total sales in the future, changes in foreign currency exchange rates may have a potentially greater impact on our revenue and operating results.
Cost of revenues by fiscal year
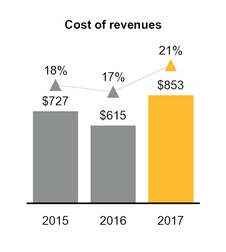
Cost of revenues consists primarily of technical support costs, costs of billable services, fees to OEMs under revenue-sharing agreements, hardware costs, and fulfillment costs, as well as intangible asset amortization, and is presented below in millions except for percentage of revenues.
2017 compared to 2016
Our cost of revenues increased $238 million primarily due to $122 million of increased amortization related to the acquired Blue Coat and LifeLock intangible assets and other costs related to sales of the acquired Blue Coat and LifeLock products including an acquired product inventory fair value write-up of $24 million. These increases in cost of revenues were partially offset by a decrease in unallocated corporate charges of $22 million.
2016 compared to 2015
Our cost of revenues decreased $112 million primarily due to favorable currency effects, a decrease in OEM royalty fees, and a decrease in service related and content delivery expenses.
Operating expenses by fiscal year
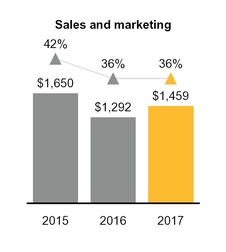
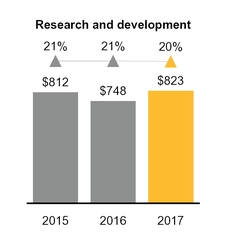
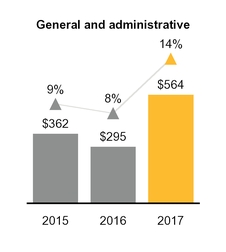
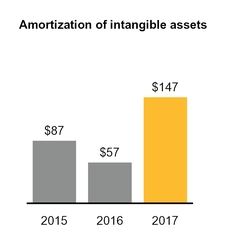
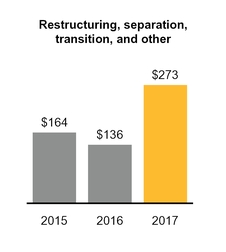
The following charts are in millions except for percentage of revenues.
2017 compared to 2016
Sales and marketing expense increased $167 million primarily as a result of the acquisitions of Blue Coat and LifeLock, increased stock-based compensation expense of $54 million and increased integration expense of $24 million. These increases were partially offset by a reduction of expenses from new and ongoing cost savings initiatives and decreased unallocated corporate charges of $88 million.
Research and development expense increased $75 million primarily as a result of the acquisition of Blue Coat and an increase of $54 million of stock-based compensation expense. These increases were partially offset by a reduction of expenses from new and ongoing cost savings initiatives and decreased unallocated corporate charges of $44 million.
General and administrative expense increased $269 million primarily as a result of the acquisition of Blue Coat and an increase of $160 million of stock-based compensation expense. In addition, we incurred increased acquisition-related and integration expenses of $79 million. These increases were partly offset by a reduction of expenses from new and ongoing cost savings initiatives and decreased unallocated corporate charges of $32 million.
Our stock-based compensation in operating expenses increased $268 million primarily due to the equity awards assumed in the Blue Coat and LifeLock acquisitions, and the expected level of achievement for performance-based restricted stock units
(“PRUs”) granted in fiscal 2017. Our stock-based compensation expense will continue to fluctuate in future periods as a result of a number of factors including the achievement levels of PRU performance conditions.
Amortization of intangible assets increased $90 million primarily due to the intangible assets of $2.9 billion acquired in the Blue Coat and LifeLock acquisitions.
2016 compared to 2015
Sales and marketing expense decreased $358 million primarily due to a reduction of unallocated corporate charges of $328 million.
Research and development expense decreased $64 million primarily due to a reduction of unallocated corporate charges of $76 million.
General and administrative expenses decreased $67 million primarily due to a reduction of unallocated corporate charges of $91 million, partially offset by an increase in stock-based compensation expense.
Amortization of intangible assets decreased $30 million primarily due to certain intangible assets becoming fully amortized during fiscal 2015.
Restructuring, separation, transition, and other
We initiated a restructuring plan in the first quarter of fiscal 2017 to reduce complexity by means of long-term structural improvements. We expect to reduce headcount and close certain facilities in connection with the restructuring plan. These actions are expected to be completed in fiscal 2018. On an annual basis we expect this restructuring plan to generate net cost efficiencies and cost synergies which, when completed, will favorably impact our continuing operating expenses in excess of $550 million. As of March 31, 2017, in connection with this restructuring plan, we expect to incur approximately $240 million to $290 million in expenses in fiscal 2018.
Additionally, we expect continuing significant transition costs associated with the implementation of a new enterprise resource planning system and costs to automate business processes, as well as significant charges related to the integration of Blue Coat and LifeLock.
See Note 4 to the Consolidated Financial Statements for further information on our restructuring, separation, transition, and other related costs.
Non-operating expense, net by fiscal year
The following charts are in millions.


2017 compared to 2016
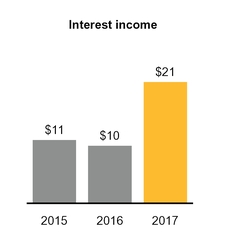
Non-operating expense, net, increased $97 million to $162 million from $65 million as of March 31, 2017 and April 1, 2016, respectively, primarily driven by an increase in interest expense of $133 million, mainly related to our increased borrowings in fiscal 2017. The non-operating expense, net increase was partially offset by increased income from transition service agreements (“TSA”) of $14 million, pursuant to which we provided Veritas certain limited services. See Note 8 and Note 13 to the Consolidated Financial Statements for more information about our debt and TSAs.
2016 compared to 2015
Non-operating expense, net, increased $12 million primarily due to net foreign currency remeasurement losses.
Provision for income taxes by fiscal year
We are a U.S.-based multinational company subject to tax in multiple U.S. and international tax jurisdictions. A substantial portion of our international earnings were generated from subsidiaries organized in Ireland and Singapore. Our results of operations would be adversely affected to the extent that our geographical mix of income becomes more weighted toward
jurisdictions with higher tax rates and would be favorably affected to the extent the relative geographic mix shifts to lower tax jurisdictions. Any change in our mix of earnings is dependent upon many factors and is therefore difficult to predict. See Note 5 to the Consolidated Financial Statements for more information.
The following charts are in millions except for percentages.
2017 compared to 2016
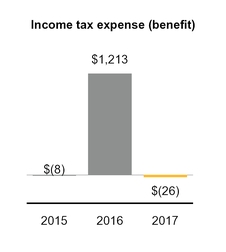
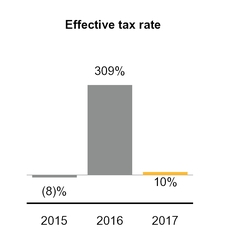
The decrease in our effective tax rate in 2017 as compared to 2016 was primarily driven by tax expense of $1.1 billion in 2016 for providing U.S. taxes on certain undistributed foreign earnings, primarily those attributable to the sale of Veritas, partially offset by tax expense of $52 million in 2017 related to the loss of tax attributes as a result of restructuring activities.
2016 compared to 2015
The increase in our effective tax rate in 2016 compared to 2015 was primarily driven by $1.1 billion of tax expense in 2016 for providing U.S. taxes on certain undistributed foreign earnings, primarily those attributable to the sale of Veritas.
LIQUIDITY AND CAPITAL RESOURCES
Sources and uses of cash
We have historically relied on cash flow from operations, borrowings under credit facilities, issuances of debt and equity securities, and sale of business, more recently, for our liquidity needs. As of March 31, 2017, we had cash, cash equivalents and short-term investments of $4.3 billion, of which $9 million is included in our other current assets. We also have an unused credit facility of $1.0 billion resulting in a liquidity position of approximately $5.3 billion. As of March 31, 2017, $3.3 billion in cash, cash equivalents, and short-term investments were held by our foreign subsidiaries. We have provided U.S. deferred taxes on a portion of our undistributed foreign earnings sufficient to address the incremental U.S. tax that would be due if we needed such portion of these funds to support our operations in the U.S.
Our principal cash requirements primarily consists of acquisitions, payment of taxes, operating expenses and working capital, capital expenditures, payment of principal and interest on debt, and restructuring and integration costs. Also, we may engage, from time to time, in the open market purchase of our notes prior to their maturity. Furthermore, our capital allocation strategy contemplates a quarterly cash dividend. In addition, we regularly evaluate our ability to repurchase shares of our common stock.
Cash flows
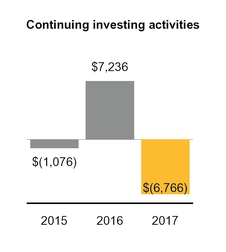
The following charts summarize cash provided by (used in) our Consolidated Statements of Cash Flows for fiscal 2015, 2016 and 2017 in millions.

Continuing operating activities
Our primary source of cash from continuing operating activities has been from cash collections from our customers. Due to seasonality, our orders are generally higher in our third and fourth fiscal quarters and lower in our first and second fiscal quarters. We therefore expect cash inflows from continuing operating activities to be affected by fluctuations in billings and timing of collections.
Our primary uses of cash from our continuing operating activities include payments for income taxes, payments for compensation and related costs, payments to our resellers and distribution partners, and other general corporate expenditures.
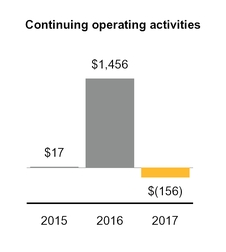
The change in continuing operating activities in fiscal 2017 compared to fiscal 2016 was primarily due to the cash payment for taxes of $887 million as a result of the gain on sale from the divestiture of Veritas, changes in working capital, and lower income from continuing operations, adjusted for non-cash items.
The change in continuing operating activities in fiscal 2016 compared to fiscal 2015 was primarily due to changes in working capital and higher income from continuing operations, adjusted for non-cash items.
Restructuring Plan. We initiated a restructuring plan in the first quarter of fiscal 2017 to reduce complexity by means of long-term structural improvements. We expect to reduce headcount and close certain facilities in connection with this restructuring plan. The total remaining cash payments in connection with the restructuring plan are expected to be approximately $270 million to $305 million. These actions are expected to be completed in fiscal 2018. See Note 4 to the Consolidated Financial Statements for more information on our restructuring plans.
Continuing investing activities
Our investing cash flows consist primarily of acquisitions, capital expenditures and investment purchases, sales, and maturities. The change in continuing investing activities in fiscal 2017 compared to fiscal 2016 was primarily due to the net cash consideration paid for our acquisitions of Blue Coat and LifeLock during fiscal 2017 of $4.5 billion and $2.2 billion, respectively. In addition, our investing activities decreased due to the absence of proceeds from the divestiture of Veritas of $6.5 billion in fiscal 2016, and reduced proceeds from maturities and sales of short-term investments of $1.3 billion. The decrease was partially offset by reduced purchases of short-term investments of $378 million during fiscal 2016.
The change in continuing investing activities in fiscal 2016 compared to fiscal 2015 was primarily due to proceeds received from the divestiture of Veritas of $6.5 billion, increased proceeds from maturities and sales of short-term investments of $331 million, and decreases in our purchases of short-term investments of $1.4 billion.
Dissenter shares. As of March 31, 2017, we have accrued $68 million for dissenting shareholders as a result of our LifeLock acquisition.
Short-term investments. In order to achieve greater investment diversification and higher yields while maintaining our objectives of preservation of capital, liquidity, and safety, we plan to increase our holdings of short-term investments.
Continuing financing activities
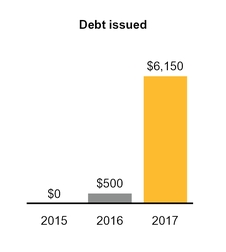
Our financing cash flows consist primarily of issuance and repayment of debt, repurchases of common stock, and payment of dividends and dividend equivalents to stockholders. In fiscal 2017, our financing activities provided $5.3 billion of cash compared to $4.7 billion use of cash in fiscal 2016. The change in fiscal 2017 was primarily driven by our borrowing activities with net proceeds of $6.1 billion partially offset by reduction in stock repurchases of $1.4 billion and decrease in quarterly dividend payments from $0.15 per share in fiscal 2016 to $0.075 per share in fiscal 2017. The dividend payments in fiscal 2016 also included a special dividend of $4.00 per share subsequent to the divestiture of Veritas.
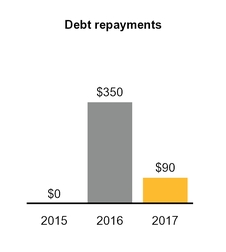
The change in continuing financing activities in fiscal 2016 compared to fiscal 2015 was primarily due to increased cash dividends and dividend equivalent payments of $2.6 billion, increased repurchases of common stock of $1.3 billion and an increase in the repayment of maturing senior notes and other obligations of $347 million, partially offset by proceeds from the issuance of convertible senior notes of $500 million.
We have made, and may from time to time in the future make, optional repayments of our debt obligations, which may include repurchases of our outstanding debt, depending on various factors, such as market conditions.
Interest payments on $3.7 billion of our variable-rate borrowings are subject to change based on market interest rates.
Borrowings. Proceeds from and repayments of borrowings fluctuate from year to year based on the amounts paid to fund acquisitions, and debt repayments. The charts below set forth total debt issued, repaid and the amount of unused credit facility for fiscal 2015, 2016 and 2017 in millions.

Credit ratings. Our credit ratings were lowered as a result of the debt we incurred due to the LifeLock acquisition. Our borrowing costs depend, in part, on our credit ratings and any further actions taken by these credit rating agencies to lower our credit ratings will likely increase our borrowing costs.
See Note 8 to the Consolidated Financial Statements for further information on our debt repayments and borrowings.
Prepayments of debt. Subsequent to March 31, 2017, we prepaid $710 million of our Senior Term Loan A-5 and $100 million of our Senior Term Loan A-1 on April 5, 2017 and May 5, 2017, respectively.
Share repurchases and dividends. Under our stock repurchase programs, we may purchase shares of our outstanding common stock through open market and through ASR transactions. On November 20, 2016, our Board of Directors increased the authorization under our stock repurchase program by $510 million. In March 2017, we entered into ASR agreements with financial institutions (the “March 2017 ASR”) to repurchase an aggregate $500 million of our common stock. The remaining $800 million authorization, to be completed in future periods, does not have an expiration date.
On May 10, 2017, we declared a cash dividend of $0.075 per share of common stock to be paid on June 21, 2017 to all stockholders of record as of the close of business on June 7, 2017. All shares of common stock issued and outstanding and unvested RSUs and PRUs as of the record date will be entitled to the dividend and dividend equivalents, respectively. Any future dividends and dividend equivalents will be subject to the approval of our Board of Directors.
The chart below sets forth information on our share repurchases and dividends and dividend equivalents paid in fiscal 2015, 2016 and 2017 in millions.

See Note 10 to the Consolidated Financial Statements for more information on our share repurchases and dividends and dividend equivalents.
Contractual obligations
The following is a schedule by years of our significant contractual obligations as of March 31, 2017:
| Payments Due by Fiscal Period | |||||||||||||||||||
| (In millions) | Total | 2018 | 2019 - 2020 | 2021 - 2022 | Thereafter | ||||||||||||||
| Debt (1) | $ | 8,310 | $ | 1,310 | $ | 2,000 | $ | 3,500 | $ | 1,500 | |||||||||
| Interest payments on debt (2) | 1,059 | 208 | 405 | 246 | 200 | ||||||||||||||
| Purchase obligations (3) | 154 | 125 | 28 | 1 | — | ||||||||||||||
| Operating leases (4) | 327 | 88 | 125 | 73 | 41 | ||||||||||||||
| Total | $ | 9,850 | $ | 1,731 | $ | 2,558 | $ | 3,820 | $ | 1,741 |
| (1) | See Note 8 to the Consolidated Financial Statements for further information on our debt. |
| (2) | Interest payments were calculated based on the contractual terms of the related Senior Notes, Convertible Senior Notes and Senior Term Facilities. Interest on variable rate debt was calculated using the interest rate in effect as of March 31, 2017. See Note 8 to the Consolidated Financial Statements for further information on the Senior Notes, Convertible Senior Notes and Senior Term Facilities. |
| (3) | These amounts are associated with agreements for purchases of goods or services generally including agreements that are enforceable and legally binding and that specify all significant terms, including fixed or minimum quantities to be purchased; fixed, minimum, or variable price provisions; and the approximate timing of the transaction. The table above also includes agreements to purchase goods or services that have cancellation provisions requiring little or no payment. The amounts under such contracts are included in the table above because management believes that cancellation of these contracts is unlikely and we expect to make future cash payments according to the contract terms or in similar amounts for similar materials. |
| (4) | We have entered into various non-cancelable operating lease agreements that expire on various dates through fiscal 2026. The amounts in the table above exclude expected sublease income. |
Due to the uncertainty with respect to the timing of future cash flows associated with our unrecognized tax benefits as of March 31, 2017 we are unable to make reasonably reliable estimates of the period of cash settlement with the respective taxing authorities. Therefore, $251 million in long-term income taxes payable has been excluded from the contractual obligations table. See Note 5 to the Consolidated Financial Statements for further information.
Indemnifications
In the ordinary course of business, we may provide indemnifications of varying scope and terms to customers, vendors, lessors, business partners, subsidiaries and other parties with respect to certain matters, including, but not limited to, losses arising out of our breach of agreements or representations and warranties made by us. Refer to Note 12 to the Consolidated Financial Statements for further information on our indemnifications.
CRITICAL ACCOUNTING POLICIES AND ESTIMATES
The methods, estimates and judgments that we use in applying our accounting policies have a significant impact on our financial position and the results that we report in our Consolidated Financial Statements. Some of these policies required us to make subjective estimates and apply judgment regarding matters that are inherently uncertain.
Our most critical estimates included:
| • | The allocation of revenue to various components of our multiple element arrangements which may contain hardware, software, licenses, maintenance and service contracts. |
| • | The valuation and allocation of the purchase price paid for acquired assets and liabilities assumed in connection with our acquisitions, which impacts our gross margin and operating expenses in periods subsequent to the acquisition. |
| • | The evaluation of the recoverability of long-lived assets (property, and equipment, identified intangibles, and goodwill), which impacts gross margin or operating expenses when we record impairments or accelerate their depreciation or amortization. |
| • | The determination of the fair value of stock options using a Black-Scholes options pricing model, which impact our gross margin and operating expenses over the option’s vesting period. |
| • | The recognition and measurement of current and deferred income taxes (including the measurement of current and deferred income taxes, including the measurement of uncertain tax positions), which impact our provision for taxes as well as tax-related assets and liabilities. |
| • | The recognition and measurement of loss contingencies, which impact gross margin or operating expenses when we recognize a loss contingency, revise the estimate for a loss contingency, or record an asset impairment. |
See Note 1 to the Consolidated Financial Statements in this annual report for further information on our critical accounting estimates and policies.
Recently issued authoritative guidance
Revenue Recognition - Contracts with Customers. In May 2014, the Financial Accounting Standards Board (“FASB”) issued new authoritative guidance for revenue from contracts with customers. The standard’s core principle is that a company will recognize revenue when it transfers promised goods or services to customers in an amount that reflects the consideration that the company expects to receive in exchange for those goods or services. In doing so, companies will need to use more judgment and make more estimates than under current guidance. These may include identifying performance obligations in the contract, estimating the amount of variable consideration to include in the transaction price, and allocating the transaction price to each separate performance obligation. In March 2016, the FASB clarified implementation guidance on principal versus agent considerations. In April 2016, the FASB issued guidance related to identifying performance obligations and licensing which reduces the cost and complexity of applying certain aspects of the guidance both at implementation and on an ongoing basis.
The new guidance may be applied retrospectively to each prior period presented (“retrospective”) or retrospectively with cumulative effect recognized in retained earnings as of the date of adoption (“modified retrospective”). We expect to adopt the new standard on a modified retrospective basis in the first quarter of fiscal 2019. We are currently evaluating the impact of the adoption of this guidance on our Consolidated Financial Statements.
Financial Instruments - Recognition and Measurement. In January 2016, the FASB issued new authoritative guidance on financial instruments. The new guidance enhances the reporting model for financial instruments, which includes amendments to address aspects of recognition, measurement, presentation and disclosure. The new guidance will be effective for us in our first quarter of fiscal 2019. Early adoption is permitted under limited circumstances but we do not intend to adopt the provisions of the new guidance early. We are currently evaluating the impact of the adoption of this guidance on our Consolidated Financial Statements.
Leases. In February 2016, the FASB issued new guidance on lease accounting which will require lessees to recognize assets and liabilities on their balance sheet for the rights and obligations created by operating leases and will also require disclosures designed to give users of financial statements information on the amount, timing, and uncertainty of cash flows arising from leases. The new guidance will be effective for us in our first quarter of fiscal 2020. Early adoption is permitted but we do not plan to adopt the provisions of the new guidance early. We are currently evaluating the impact of the adoption of this guidance on our Consolidated Financial Statements.
Employee Stock-Based Compensation. In March 2016, the FASB issued new guidance on accounting for employee stock-based compensation, which requires all income tax effects of awards to be recognized in the income statement when the awards vest or are settled, as well as revising guidance related to classification of awards as either equity or liabilities, accounting for forfeitures and classification of excess tax benefits or deficiencies on the statement of cash flows. We are electing to continue to estimate forfeitures to determine the amount of compensation cost to be recognized in each period. We do not anticipate a material impact on the Consolidated Financial Statements from the cumulative effect of these changes. The new guidance will be effective for us in our first quarter of fiscal 2018.
Credit Losses. In June 2016, the FASB issued new authoritative guidance on credit losses which changes the impairment model for most financial assets and certain other instruments. For trade receivables and other instruments, we will be required to use a new forward-looking “expected loss” model. Additionally, for available-for-sale debt securities with unrealized losses, we will measure credit losses in a manner similar to today, except that the losses will be recognized as allowances rather than
reductions in the amortized cost of the securities. The standard will be effective for us in our first quarter of fiscal 2021. We are currently evaluating the impact of the adoption of this guidance on our Consolidated Financial Statements.
Income Taxes - Intra-Entity Asset Transfers Other Than Inventory. In October 2016, the FASB issued new authoritative guidance that requires entities to immediately recognize the tax consequences of intercompany asset transfers, excluding inventory, at the transaction date, rather than deferring the tax consequences under current U.S. GAAP. The standard will be effective for us in our first quarter of fiscal 2019, and requires a modified retrospective transition method. We are currently evaluating the impact of the adoption of this guidance and anticipate it will have a material impact on our Consolidated Financial Statements.
Previous: Item 6. Selected Financial Data · Next: Item 7A. Quantitative and Qualitative Disclosures about Market Risk