 filings.tools
Item 5. Market for the Company’s Common Shares, Related Shareholder Matters and Issuer Purchases of Equity Securities
3K characters. Original on sec.gov · Markdown
Item 5. Market for the Company’s Common Shares, Related Shareholder Matters and Issuer Purchases of Equity Securities
Garmin’s shares have traded on The Nasdaq Stock Market, LLC under the symbol “GRMN” since its initial public offering on December 8, 2000 (the “IPO”). As of February 15, 2019, there were 180 shareholders of record.
The Board of Directors approved a share repurchase program on February 13, 2015, authorizing the Company to repurchase up to $300 million of the Company’s shares as market and business conditions warrant. The share repurchase authorization expired on December 31, 2017. The Company made no repurchases of shares during the year ended December 29, 2018. See Note 11 for additional information regarding the share repurchase plan.
We refer you to Item 12 of this report under the caption “Equity Compensation Plan Information” for certain equity plan information required to be disclosed by Item 201(d) of Regulation S-K.
Stock Performance Graph
This performance graph shall not be deemed ’‘filed’’ with the SEC or subject to Section 18 of the Securities Exchange Act of 1934, nor shall it be deemed incorporated by reference in any of our filings under the Securities Act of 1933, as amended.
The graph below matches Garmin Ltd.’s cumulative 5-Year total shareholder return on common stock with the cumulative total returns of the Nasdaq Composite index and the Nasdaq 100 index. The graph tracks the performance of a $100 investment in our common stock and in each index (with the reinvestment of all dividends) from 12/31/2013 to 12/31/2018.
| COMPARISON OF 5 YEAR CUMULATIVE TOTAL RETURN* Among Garmin Ltd., the NASDAQ Composite Index and the NASDAQ 100 Index | ||
|---|---|---|
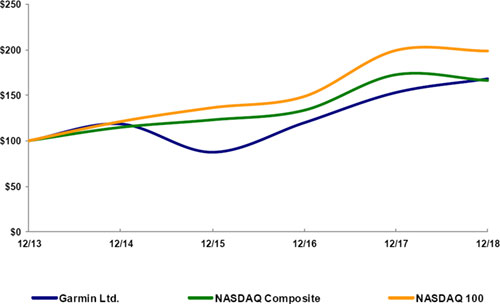 | ||
| *$100 invested on 12/31/13 in stock or index, including reinvestment of dividends. | ||
| Fiscal year ending December 31. |
| 12/13 | 12/14 | 12/15 | 12/16 | 12/17 | 12/18 | |||||||||||||||||||
|---|---|---|---|---|---|---|---|---|---|---|---|---|---|---|---|---|---|---|---|---|---|---|---|---|
| Garmin Ltd. | 100.00 | 118.40 | 87.53 | 119.57 | 152.55 | 167.55 | ||||||||||||||||||
| NASDAQ Composite | 100.00 | 114.62 | 122.81 | 133.19 | 172.11 | 165.84 | ||||||||||||||||||
| NASDAQ 100 | 100.00 | 120.99 | 136.23 | 148.44 | 198.95 | 198.30 |
The stock price performance included in this graph is not necessarily indicative of future stock price performance.
Previous: Item 4. Mine Safety Disclosure · Next: Item 6. Selected Financial Data