 filings.tools
Item 5. Market for Registrant’s Common Equity, Related Shareholder Matters and Issuer Purchases of Equity Securities
4K characters. Original on sec.gov · Markdown
Item 5. Market for Registrant’s Common Equity, Related Shareholder Matters and Issuer Purchases of Equity Securities
Market Information and Dividends
Grainger's common stock is listed and traded on the New York Stock Exchange, under the symbol GWW. The high and low sales prices for the common stock and the dividends declared and paid per share for each calendar quarter during 2017 and 2016 are shown below.
| Market Price Per Share | ||||||||||||
| Quarters | High | Low | Dividends | |||||||||
| 2017 | First | $ | 262.72 | $ | 229.05 | $ | 1.22 | |||||
| Second | 234.66 | 168.58 | 1.28 | |||||||||
| Third | 185.82 | 155.00 | 1.28 | |||||||||
| Fourth | 240.49 | 166.46 | 1.28 | |||||||||
| Year | $ | 262.72 | $ | 155.00 | $ | 5.06 | ||||||
| 2016 | First | $ | 234.77 | $ | 176.85 | $ | 1.17 | |||||
| Second | 239.95 | 212.64 | 1.22 | |||||||||
| Third | 235.53 | 212.54 | 1.22 | |||||||||
| Fourth | 240.74 | 201.94 | 1.22 | |||||||||
| Year | $ | 240.74 | $ | 176.85 | $ | 4.83 |
Grainger expects that its practice of paying quarterly dividends on its common stock will continue, although the payment of future dividends is at the discretion of Grainger’s Board of Directors and will depend upon Grainger’s earnings, capital requirements, financial condition and other factors.
Holders
The approximate number of shareholders of record of Grainger’s common stock as of February 7, 2018, was 688 with approximately 150,934 additional shareholders holding stock through nominees.
Issuer Purchases of Equity Securities - Fourth Quarter
| Period | Total Number of Shares Purchased (A) | Average Price Paid Per Share (B) | Total Number of Shares Purchased as Part of Publicly Announced Plans or Programs (C) | Maximum Number of Shares That May Yet be Purchased Under the Plans or Programs | ||
| Oct. 1 – Oct. 31 | 206,586 | $185.37 | 206,586 | 3,506,481 | shares | |
| Nov. 1 – Nov. 30 | 237,397 | $199.91 | 237,397 | 3,269,084 | shares | |
| Dec. 1 – Dec. 31 | 410,679 | $227.94 | 410,679 | 2,858,405 | shares | |
| Total | 854,662 | $209.86 | 854,662 |
| (A) | 85 shares were withheld to satisfy tax withholding obligations in connection with the vesting of employee restricted stock awards. |
| (B) | Average price paid per share includes any commissions paid and includes only those amounts related to purchases as part of publicly announced plans or programs. |
| (C) | Purchases were made pursuant to a share repurchase program approved by Grainger's Board of Directors. This plan was announced on April 16, 2015, for 15 million shares with no expiration date. Activity is reported on a trade date basis. |
Company Performance
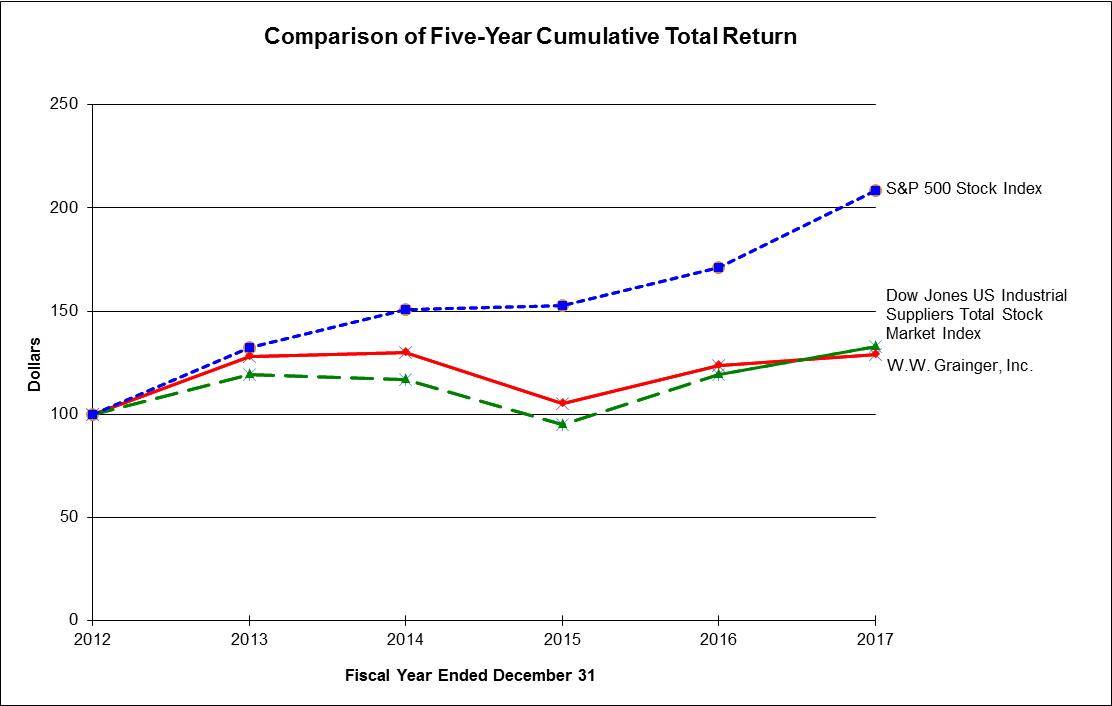
The following stock price performance graph compares the cumulative total return on an investment in Grainger common stock with the cumulative total return of an investment in each of the Dow Jones US Industrial Suppliers Total Stock Market Index and the S&P 500 Stock Index. It covers the period commencing December 31, 2012, and ending December 31, 2017. The graph assumes that the value for the investment in Grainger common stock and in each index was $100 on December 31, 2012, and that all dividends were reinvested.
| December 31, | ||||||||||||||||||
| 2012 | 2013 | 2014 | 2015 | 2016 | 2017 | |||||||||||||
| W.W. Grainger, Inc. | $ | 100 | $ | 128 | $ | 130 | $ | 105 | $ | 124 | $ | 129 | ||||||
| Dow Jones US Industrial Suppliers Total Stock Market Index | 100 | 119 | 117 | 95 | 119 | 133 | ||||||||||||
| S&P 500 Stock Index | 100 | 132 | 151 | 153 | 171 | 208 |
Previous: Item 4A. Executive Officers of the Registrant · Next: Item 6. Selected Financial Data