 filings.tools
Item 5. Market for Registrant’s Common Equity, Related Stockholder Matters and Issuer Purchases of Equity Securities.
4K characters. Original on sec.gov · Markdown
Item 5. Market for Registrant’s Common Equity, Related Stockholder Matters and Issuer Purchases of Equity Securities.
Halliburton Company’s common stock is traded on the New York Stock Exchange under the symbol "HAL." Information related to quarterly dividend payments is included under the caption “Quarterly Financial Data” in the consolidated financial statements. The declaration and payment of future dividends will be at the discretion of the Board of Directors and will depend on, among other things, future earnings, general financial condition and liquidity, success in business activities, capital requirements and general business conditions. Subject to Board of Directors approval, our intention is to continue paying dividends at our current rate during 2019.
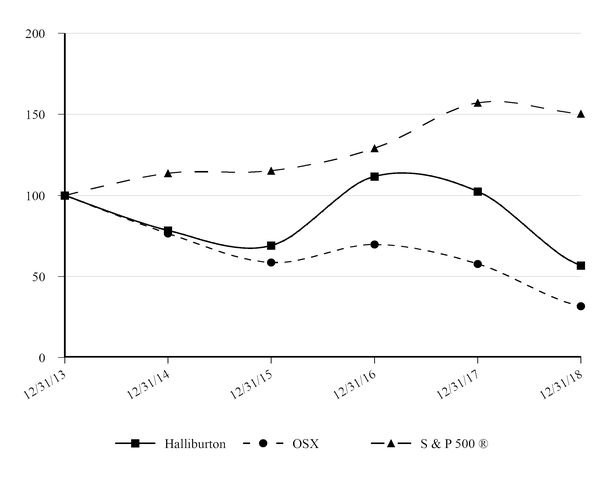
The following graph and table compare total shareholder return on our common stock for the five-year period ended December 31, 2018, with the Philadelphia Oil Service Index (OSX) and the Standard & Poor’s 500 ® Index over the same period. This comparison assumes the investment of $100 on December 31, 2013 and the reinvestment of all dividends. The shareholder return set forth is not necessarily indicative of future performance. The following graph and related information shall not be deemed “soliciting material” or to be “filed” with the SEC, nor shall such information be incorporated by reference into any future filing under the Securities Act of 1933 or the Securities Exchange Act of 1934, except to the extent that Halliburton specifically incorporates it by reference into such filing.
| December 31 | ||||||||||||||||||
| 2013 | 2014 | 2015 | 2016 | 2017 | 2018 | |||||||||||||
| Halliburton | $ | 100.00 | $ | 78.40 | $ | 69.09 | $ | 111.64 | $ | 102.44 | $ | 56.78 | ||||||
| Philadelphia Oil Service Index (OSX) | 100.00 | 76.49 | 58.60 | 69.72 | 57.73 | 31.63 | ||||||||||||
| Standard & Poor’s 500 ® Index | 100.00 | 113.69 | 115.26 | 129.05 | 157.22 | 150.33 |
At February 8, 2019, we had 11,774 shareholders of record. In calculating the number of shareholders, we consider clearing agencies and security position listings as one shareholder for each agency or listing.
The following table is a summary of repurchases of our common stock during the three-month period ended December 31, 2018.
| Period | Total Number of Shares Purchased (a) | Average Price Paid per Share | Total Number of Shares Purchased as Part of Publicly Announced Plans or Programs (b) | Maximum Number (or Approximate Dollar Value) of Shares that may yet be Purchased Under the Program (b) |
| October 1 - 31 | 2,885,114 | $34.88 | 2,868,100 | $5,400,004,968 |
| November 1 - 30 | 2,907,936 | $34.52 | 2,896,800 | $5,300,007,172 |
| December 1 - 31 | 193,064 | $30.45 | — | $5,300,007,172 |
| Total | 5,986,114 | $34.56 | 5,764,900 |
| (a) | Of the 5,986,114 shares purchased during the three-month period ended December 31, 2018, 221,214 shares were acquired from employees in connection with the settlement of income tax and related benefit withholding obligations arising from vesting in restricted stock grants. These shares were not part of a publicly announced program to purchase common stock. |
| (b) | Our Board of Directors has authorized a plan to repurchase a specified dollar amount of our common stock from time to time. During the fourth quarter of 2018, we repurchased approximately 5.8 million shares of our common stock pursuant to our share repurchase program for a total cost of approximately $200 million at an average price of $34.69 per share. Approximately $5.3 billion remained authorized for repurchases as of December 31, 2018. From the inception of this program in February 2006 through December 31, 2018, we repurchased approximately 212 million shares of our common stock for a total cost of approximately $8.8 billion. |
Previous: Item 4. Mine Safety Disclosures. · Next: Item 6. Selected Financial Data.