 filings.tools
Honeywell International 2020 10-K Annual Report
HON · CIK 773840 · Form 10-K · Fiscal year ended December 31, 2020 · Filed February 12, 2021
Revenue fell 11.1% to $32.6 billion. Net income was $4.78 billion.
22 sections, 500K characters. Original on sec.gov · ·
| Measure | Year ended Dec 31, 2020 | Year ended Dec 31, 2019 | Change |
|---|---|---|---|
| Revenue | $32.6B | $36.7B | -11.1% |
| Net income | $4.78B | $6.14B | -22.2% |
| Diluted EPS | $6.72 | $8.41 | -20.1% |
| Free cash flow* | $5.30B | $6.06B | -12.5% |
| Cash and equivalents | $14.3B | $9.07B | +57.4% |
From the XBRL facts tagged to this filing; both columns are as reported in this filing. * Computed by filings.tools: free cash flow is operating cash flow less capital spending; operating margin is operating income over revenue.
Cover and table of contents
UNITED STATES
SECURITIES AND EXCHANGE COMMISSION
WASHINGTON, D.C. 20549
Form 10-K
☒ ANNUAL REPORT PURSUANT TO SECTION 13 OR 15(d)
OF THE SECURITIES EXCHANGE ACT OF 1934
For the fiscal year ended December 31, 2020
OR
☐ TRANSITION REPORT PURSUANT TO SECTION 13 OR 15(d)
OF THE SECURITIES EXCHANGE ACT OF 1934
For the transition period from to
Commission file number 1-8974

Honeywell International Inc.
(Exact name of registrant as specified in its charter)
| Delaware | 22-2640650 | ||||||||||
| (State or other jurisdiction of incorporation or organization) | (I.R.S. Employer Identification No.) | ||||||||||
| 300 South Tryon Street | 28202 | ||||||||||
| Charlotte, | North Carolina | ||||||||||
| (Address of principal executive offices) | (Zip Code) |
Registrant’s telephone number, including area code (704) 627-6200
Securities registered pursuant to Section 12(b) of the Act:
| Title of Each Class | Trading Symbols | Name of each exchange on which registered | ||||||||||||
| Common Stock, par value $1 per share* | HON | The New York Stock Exchange | ||||||||||||
| 1.300% Senior Notes due 2023 | HON 23A | The New York Stock Exchange | ||||||||||||
| 0.000% Senior Notes due 2024 | HON 24A | The New York Stock Exchange | ||||||||||||
| 2.250% Senior Notes due 2028 | HON 28A | The New York Stock Exchange | ||||||||||||
| 0.750% Senior Notes due 2032 | HON 32 | The New York Stock Exchange |
| * The common stock is also listed on the London Stock Exchange. |
Securities registered pursuant to Section 12(g) of the Act: None
Indicate by check mark if the Registrant is a well-known seasoned issuer, as defined in Rule 405 of the Securities Act. Yes ☒ No ☐
Indicate by check mark if the Registrant is not required to file reports pursuant to Section 13 or Section 15(d) of the Exchange Act. Yes ☐ No ☒
Indicate by check mark whether the Registrant (1) has filed all reports required to be filed by Section 13 or 15(d) of the Securities Exchange Act of 1934 during the preceding 12 months (or for such shorter period that the Registrant
was required to file such reports), and (2) has been subject to such filing requirements for the past 90 days. Yes ☒ No ☐
Indicate by check mark whether the Registrant has submitted electronically every Interactive Data File required to be submitted pursuant to Rule 405 of Regulation S-T (§ 232.405 of this chapter) during the preceding 12 months (or for such shorter period that the registrant was required to submit such files). Yes ☒ No ☐
Indicate by check mark whether the Registrant is a large accelerated filer, an accelerated filer, a non-accelerated filer, a smaller reporting company, or an emerging growth company. See definitions of “large accelerated filer,” “accelerated filer,” “smaller reporting company” and "emerging growth company" in Rule 12b-2 of the Exchange Act.
Large accelerated filer ☒ Accelerated filer ☐ Non-accelerated filer ☐ Smaller reporting company ☐
Emerging growth company ☐
If an emerging growth company, indicate by check mark if the registrant has elected not to use the extended transition period for complying with any new or revised financial accounting standards provided pursuant to section 13(a) of the Exchange Act. ☐
Indicate by check mark whether the registrant has filed a report on and attestation to its management's assessment of the effectiveness of its internal control over financial reporting under Section 404(b) of the Sarbanes-Oxley Act (15 U.S.C. 7262(b)) by the registered public accounting firm that prepared or issued its audit report. Yes ☒ No ☐
Indicate by check mark whether the Registrant is a shell company (as defined in Rule 12b-2 of the Act). Yes ☐ No ☒
The aggregate market value of the voting stock held by nonaffiliates of the Registrant was approximately $97.0 billion at June 30, 2020.
There were 695,501,159 shares of Common Stock outstanding at January 29, 2021.
Documents Incorporated by Reference
Part III: Proxy Statement for Annual Meeting of Shareowners to be held May 21, 2021.
TABLE OF CONTENTS
ORGANIZATION OF OUR ANNUAL REPORT ON FORM 10-K
The order and presentation of content in our Annual Report on Form 10-K (Form 10-K) differs from the traditional U.S. Securities and Exchange Commission (SEC) Form 10-K format. We believe that our format improves readability and better presents how we organize and manage our business. See Form 10-K Cross-Reference Index for a cross-reference to the traditional SEC Form 10-K format.
CAUTIONARY STATEMENT ABOUT FORWARD-LOOKING STATEMENTS
We describe many of the trends and other factors that drive our business and future results in the section titled Management’s Discussion and Analysis of Financial Condition and Results of Operations and in other parts of this report (including under the section titled Risk Factors). Such discussions contain forward-looking statements within the meaning of Section 21E of the Securities Exchange Act of 1934, as amended (the Exchange Act). Forward-looking statements are those that address activities, events or developments that management intends, expects, projects, believes or anticipates will or may occur in the future. They are based on management’s assumptions and assessments in light of past experience and trends, current economic and industry conditions, expected future developments and other relevant factors. They are not guarantees of future performance, and actual results, developments and business decisions may differ significantly from those envisaged by our forward-looking statements. We do not undertake to update or revise any of our forward-looking statements. Our forward-looking statements are also subject to risks and uncertainties, including the impact of the coronavirus pandemic (COVID-19), that can affect our performance in both the near- and long-term. These forward-looking statements should be considered in light of the information included in this Form 10-K, including, in particular, the factors discussed within the section titled Risk Factors. Such factors may be revised or supplemented in subsequent reports on Forms 10-Q and 8-K.
1 Honeywell International, Inc.
Item 1. Business
BUSINESS
Honeywell International Inc. (Honeywell or the Company) invents and commercializes technologies that address some of the world’s most critical challenges around energy, safety, security, air travel, productivity and global urbanization. As a diversified technology and manufacturing company, we are uniquely positioned to blend physical products with software to serve customers worldwide with aerospace products and services, energy efficient products and solutions for businesses, specialty chemicals, electronic and advanced materials, process technology for refining and petrochemicals, and productivity, sensing, safety and security technologies for buildings and industries. Our products and solutions enable a safer, more comfortable and more productive world, enhancing the quality of life of people around the globe. The Honeywell brand dates back to 1906, and the Company was incorporated in Delaware in 1985.
Our Annual Report on Form 10-K, Quarterly Reports on Form 10-Q, Current Reports on Form 8-K and any amendments to those reports, are available free of charge on our website (honeywell.com) under the heading Investors (see SEC Filings) immediately after they are filed with, or furnished to, the SEC. In addition, in this Form 10-K, the Company incorporates by reference certain information from its definitive Proxy Statement for the 2021 Annual Meeting of Stockholders, which we expect to file with the SEC on or about April 9, 2021 (the Proxy Statement), and which will also be available free of charge on our website.
MAJOR BUSINESSES
We globally manage our business operations through four segments: Aerospace, Honeywell Building Technologies, Performance Materials and Technologies, and Safety and Productivity Solutions. Financial information related to our segments is included in Note 23 Segment Financial Data of Notes to Consolidated Financial Statements. The major products and services, including Honeywell Forge solutions supported by Honeywell Connected Enterprise, customers, uses and key competitors of each of our segments are:
AEROSPACE
Aerospace is a leading global supplier of products, software and services for aircrafts that it sells to original equipment manufacturers (OEM) and other customers in a variety of end markets including: air transport, regional, business and general aviation aircraft, airlines, aircraft operators and defense and space contractors. Aerospace products and services include auxiliary power units, propulsion engines, environmental control systems, integrated avionics, wireless connectivity services, electric power systems, engine controls, flight safety, communications, navigation hardware, data and software applications, radar and surveillance systems, aircraft lighting, management and technical services, advanced systems and instruments, satellite and space components, aircraft wheels and brakes, repair and overhaul services and thermal systems. Aerospace also provides spare parts, repair, overhaul and maintenance services (principally to aircraft operators) for the aftermarket. Honeywell Forge solutions are leveraged by our customers as tools to turn data into predictive maintenance and predictive analytics to enable better fleet management and make flight operations more efficient.
HONEYWELL BUILDING TECHNOLOGIES
Honeywell Building Technologies is a leading global provider of products, software, solutions and technologies that enable building owners and occupants to ensure their facilities are safe, energy efficient, sustainable and productive. Honeywell Building Technologies products and services include advanced software applications for building control and optimization; sensors, switches, control systems and instruments for energy management; access control; video surveillance; fire products; remote patient monitoring systems; and installation, maintenance and upgrades of systems. Honeywell Forge solutions enable our customers to digitally manage buildings, connecting data from different assets to enable smart maintenance, improve building performance and even protect from incoming security threats.
2 Honeywell International, Inc.
PERFORMANCE MATERIALS AND TECHNOLOGIES
Performance Materials and Technologies is a global leader in developing and manufacturing high-quality performance chemicals and materials, process technologies and automation solutions. The segment is comprised of Process Solutions, UOP and Advanced Materials. Process Solutions provides automation control, instrumentation, advanced software and related services for the oil and gas, refining, pulp and paper, industrial power generation, chemicals and petrochemicals, biofuels, life sciences, and metals, minerals and mining industries. Through its smart energy products, Process Solutions enables utilities and distribution companies to deploy advanced capabilities to improve operations, reliability and environmental sustainability. UOP provides process technology, products, including catalysts and adsorbents, equipment, and consulting services that enable customers to efficiently produce gasoline, diesel, jet fuel, petrochemicals and renewable fuels for the petroleum refining, gas processing, petrochemical, and other industries. Advanced Materials manufactures a wide variety of high-performance products, including materials used to manufacture end products such as bullet-resistant armor, nylon, computer chips and pharmaceutical packaging, and provides reduced and low global-warming-potential materials based on hydrofluoro-olefin technology. In the industrial environment, Honeywell Forge solutions enable integration and connectivity to provide a holistic view of operations and turn data into clear actions to maximize productivity and efficiency. Honeywell Forge's cybersecurity capabilities help identify risks and act on cyber-related incidents, together enabling improved operations and protecting processes, people and assets.
SAFETY AND PRODUCTIVITY SOLUTIONS
Safety and Productivity Solutions is a leading global provider of products and software that improve productivity, workplace safety and asset performance to customers around the globe. Safety products include personal protection equipment (PPE), apparel, gear, and footwear designed for work, play and outdoor activities; gas detection technology; and cloud-based notification and emergency messaging. Productivity Solutions products and services include mobile devices and software for computing, data collection and thermal printing; supply chain and warehouse automation equipment, software and solutions; custom-engineered sensors, switches and controls for sensing and productivity solutions; and software-based data and asset management productivity solutions. Honeywell Forge solutions digitally automate processes to improve efficiency while reducing downtime and safety costs.
COMPETITION
We are subject to competition in substantially all product and service areas. Some of our key competitors include but are not limited to:
-
Aerospace: Garmin, Raytheon Technologies, Safran and Thales
-
Honeywell Building Technologies: Carrier Global, Johnson Controls, Schneider Electric and Siemens
-
Performance Materials and Technologies: ABB, Albemarle, Arkema, BASF, Dupont, Emerson Electric, Exterran, Grace and Yokogawa
-
Safety and Productivity Solutions: 3M, Kion Group, MSA Safety Incorporated, TE Connectivity and Zebra Technologies
Our businesses compete on a variety of factors such as performance, applied technology, product innovation, product recognition, quality, reliability, customer service, delivery, and price. Brand identity, service to customers and quality are important competitive factors for our products and services. Our products face considerable price competition. While our competitive position varies among our products and services, we are a significant competitor in each of our major product and service classes.
3 Honeywell International, Inc.
EXECUTIVE SUMMARY
Despite a challenging 2020, we continued to deliver on our financial commitments and create long-term shareowner value. Although sales declined 11% to $32.6 billion, our differentiated solutions delivered double-digit sales growth in the defense and space, warehouse automation, PPE and recurring connected software businesses. We adapted to apply Honeywell's capabilities toward addressing the COVID-19 challenges of our customers around the world. Our execution through the downturn demonstrated our ability to move quickly and decisively to reduce fixed costs, ensure liquidity, invest in growth, and position ourselves for recovery, while at the same time, remaining focused on our three transformation initiatives – Honeywell Connected Enterprise, Honeywell Digital, and Integrated Supply Chain.
We maintained our commitment to create long-term shareowner value and, despite the downturn, we deployed $7.5 billion to capital expenditures, dividends, share repurchases and mergers and acquisitions, which was approximately $1.3 billion in excess of our operating cash flow for the year. Further, we improved our cash and short-term investments by $4.8 billion, which provided stability as well as opportunity for investment during challenging times.
As we look forward, we intend to continue deploying capital to high-return opportunities, including software and services with recurring revenue streams, positioning our business for future growth. Orders for our warehouse automation, PPE, and healthy building solutions remain strong, and we carry a robust backlog of $26.4 billion as of December 31, 2020. We are a leading software-industrial company committed to introducing state of the art technology solutions to improve efficiency, productivity and safety in high growth businesses in broad-based, attractive industrial end markets.
BUSINESS OBJECTIVES
Our businesses are focused on the following objectives:
-
Driving profitable growth by delivering innovative products through research and development and technological excellence, and through continued enhancement of our footprint in high growth regions;
-
Continuing to execute on our strategy to be a premier software-industrial company, including the ongoing expansion of Honeywell Forge connected solutions for aircraft, buildings, cybersecurity, plants, and workers and driving a recurring revenue model across the Company. Honeywell Forge provides Enterprise Performance Management Software-as-a-Service solutions to help drive operational excellence for our customers, collecting operational data from various assets and organizing data into an ecosystem where it can be useful;
-
Expanding margins by optimizing the Company’s performance through the Integrated Supply Chain and Honeywell Digital transformation initiatives, commercial excellence, repositioning, and other manufacturing and operational process improvements;
-
Executing disciplined portfolio management through rigorous merger and acquisition, divestiture, and integration processes to deliver growth and shareholder value;
-
Controlling corporate costs, including costs incurred for asbestos and environmental matters, and pension and other post-retirement benefits; and
-
Increasing availability of capital through strong cash flow generation and conversion from effective working capital management and proactive management of debt to enable the Company to strategically deploy capital for acquisitions, dividends, share repurchases and capital expenditures.
BACKLOG
Our backlog represents the estimated remaining value of work to be performed under firm contracts. Backlog is equal to our remaining performance obligations under the contracts that meet the guidance on revenue from contracts with customers as discussed in Note 3 Revenue Recognition and Contracts with Customers of Notes to Consolidated Financial Statements. Backlog was $26,376 million and $25,612 million at December 31, 2020 and 2019. We expect to recognize approximately 55% of our remaining performance obligations as revenue in 2021, and the remaining balance thereafter.
4 Honeywell International, Inc.
U.S. GOVERNMENT SALES
The Company, principally through our Aerospace segment, sells to the U.S. Government acting through its various departments and agencies and through prime contractors, including the U.S. Department of Defense (as both a prime contractor and subcontractor). We do not expect our overall operating results to be significantly affected by any proposed changes in 2021 federal defense spending due to the varied mix of the government programs which impact us (OEM production, engineering development programs, aftermarket spares and repairs and overhaul programs), as well as our diversified customer base.
| U.S. Government Sales | Years Ended December 31, | |||||||||||||||||||
| 2020 | 2019 | 2018 | ||||||||||||||||||
| Sales to the U.S. Department of Defense | $ | 3,661 | $ | 3,491 | $ | 2,832 | ||||||||||||||
| Sales to other U.S. Government departments and agencies | 557 | 566 | 571 | |||||||||||||||||
| Total Sales to the U.S. Government | $ | 4,218 | $ | 4,057 | $ | 3,403 |
INTERNATIONAL OPERATIONS
We engage in manufacturing, sales, service and research and development globally. U.S. exports and non-U.S. manufactured products are significant to our operations. U.S. exports represented 12% of our total sales in 2020, 15% in 2019 and 13% in 2018. Non-U.S. manufactured products and services, mainly in Europe and Asia, were 40% of our total sales in 2020, 40% in 2019 and 43% in 2018.
| Manufactured Products and Systems and Performance of Services | Year Ended December 31, 2020 | |||||||||||||||||||||||||
| Aerospace | Honeywell Building Technologies | Performance Materials and Technologies | Safety and Productivity Solutions | |||||||||||||||||||||||
| (% of Segment Sales) | ||||||||||||||||||||||||||
| U.S. exports | 22 | % | 2 | % | 13 | % | 2 | % | ||||||||||||||||||
| Non-U.S. manufactured products/services | 15 | % | 65 | % | 58 | % | 37 | % |
Information related to risks related to our foreign operations is included in the section titled Risk Factors under the caption “Macroeconomic and Industry Risks.”
RAW MATERIALS
The principal raw materials used in our operations are readily available. Although we occasionally experience disruption in raw materials supply, we experienced no significant problems in the purchase of key raw materials or commodities in 2020. We are not dependent on any one supplier for a material amount of our raw materials.
Prices of certain key raw materials, including copper, fluorspar, tungsten salts, ethylene, aluminum, and molybdenum in Performance Materials and Technologies and nickel, steel, titanium and other metals in Aerospace, are expected to fluctuate. We offset raw material cost increases with formula-driven or long-term supply agreements, price increases and hedging activities where feasible. We do not presently anticipate that a shortage of raw materials will cause any material adverse impacts during 2021.
PATENTS, TRADEMARKS, LICENSES AND DISTRIBUTION RIGHTS
Our segments are not dependent upon any single patent or related group of patents, trademarks, or any licenses or distribution rights. In our judgment, our intellectual property rights are adequate for the conduct of our business. We believe that, in the aggregate, the rights under our patents, trademarks, licenses and distribution rights are generally important to our operations, but we do not consider any individual patent, trademark or any licensing or distribution rights related to a specific process or product to be of material importance in relation to our total business.
5 Honeywell International, Inc.
REGULATIONS
The Company’s operations are subject to various federal, state, local and foreign government regulations, including requirements regarding the protection of human health and the environment. Our policies, practices and procedures are designed to prevent unreasonable risk of environmental damage, and of resulting financial liability, in connection with our business. Some risk of environmental damage is, however, inherent in some of our operations and products, as it is with other companies engaged in similar businesses.
We engage in the handling, manufacturing, use and disposal of many substances classified as hazardous by one or more regulatory agencies. Our policies, practices and procedures are designed to prevent unreasonable risk of environmental damage and personal injury, and to ensure that our handling, manufacture, use and disposal of these substances meet or exceed environmental and safety laws and regulations. It is possible that future knowledge or other developments, such as improved capability to detect substances in the environment or increasingly strict environmental laws and standards and enforcement policies, could bring into question our current or past handling, manufacture, use or disposal of these substances.
Among other environmental requirements, we are subject to the Federal Superfund and similar state and foreign laws and regulations, under which we have been designated as a potentially responsible party that may be liable for cleanup costs associated with current and former operating sites and various hazardous waste sites, some of which are on the U.S. Environmental Protection Agency’s National Priority List. While there is a possibility that a responsible party might be unable to obtain appropriate contribution from other responsible parties, we do not anticipate having to bear significantly more than our proportional share in multi-party situations taken as a whole.
We do not believe that Federal, State and local provisions regulating the discharge of materials into the environment, or otherwise relating to the protection of the environment, or any existing or pending climate change legislation, regulation, or international treaties or accords are reasonably likely to have a material effect in the foreseeable future on the Company’s business and we will continue to monitor emerging developments in this area.
Beyond our compliance requirements with environmental regulations, compliance with other government regulations has not had, and based on laws and regulations currently in effect, is not expected to have a material effect on the Company's capital expenditures, earnings or competitive position. See section titled Risk Factors for additional information on government regulation that could impact our business.
HUMAN CAPITAL MANAGEMENT
We believe a commitment to and investment in human capital management enables better decision making, helps us build competitive advantage, and furthers our long-term success. As of December 31, 2020, we employed approximately 103,000 employees across 70 countries, 41,000 of whom are in the United States. Human capital management is the key driver of our performance culture, which enables our workforce to respond to the fast-changing needs of our customers. Our performance culture is defined by a set of Honeywell Behaviors (Have a Passion for Winning, Be a Zealot for Growth, Think Big … Then Make It Happen, Act with Urgency, Be Courageous, Become Your Best, Be Committed, and Build Exceptional Talent), which reflect the bold, entrepreneurial spirit of our employees while emphasizing our goal to operate with speed and precision. At their foundation is a commitment to Integrity and Ethics, Inclusion and Diversity, and Workplace Respect, fundamental values that underlie everything we do.
Our commitment to these fundamental values and the Honeywell Behaviors starts at the top with a diverse Board of Directors and executive management team, who represent a broad spectrum of backgrounds and perspectives. We believe that the diversity of our current Board of Directors (four women, two Hispanics, and two African Americans) and the diversity of Honeywell’s executive leadership (more than half of the Company’s nine executive officers is diverse by ethnic background or gender) supports our evolving business strategy and is a testament to Honeywell’s ongoing commitment to hiring, developing, and retaining diverse talent. The Company’s commitment to Inclusion and Diversity enables better decision-making, helps build competitive advantages, and furthers long-term success.
In 2020, the Company established a Global Inclusion and Diversity Steering Committee co-sponsored by our Chairman and CEO, Senior Vice President and General Counsel, and Senior Vice President and Human Resources and fortified our inclusion and diversity governance structure by embedding Inclusion and Diversity Councils in each of our business groups. The re-designed governance structure provides a scalable model that supports our six affinity group employee networks for women, Black, Hispanic, veteran, LGBTQ, and disabled employees and facilitates the introduction of new networks to reflect the diverse characteristics of our workforce. These networks
6 Honeywell International, Inc.
are designed to provide training and development opportunities and expand internal networks for promotional opportunities.
In addition, our people managers are expected to model behaviors that promote a culture that is open and inclusive for all employees. We help managers develop this skill as they do any other leadership skill, though training programs, interactive learning and real time events, including the hiring and talent review processes. Our Leadership Edge program provides training in core management skills to more than 13,000 leaders across the organization.
Training programs are available to all employees through our internal learning and development platform, which assigns curriculum tailored to an employee’s job responsibilities. Employees can also access additional trainings on-demand to continue to enhance their skills. This year, we also deployed a mandatory unconscious bias training program to our global workforce as a supplement to their other learning opportunities.
Our internal talent acquisition and management platform is a key component to recruiting, hiring, and developing top-performing talent. Our hiring practices consider a diverse slate of candidates and our hiring managers are provided training and toolkits to reinforce their role in bringing diverse talent into the Company. Further, we partner with top academic institutions and external professional organizations to enhance the diversity of our workforce to attract and retain top talent. Our talent review process requires our people managers to have quarterly career discussions with each member of their teams to discuss the best opportunity for growth and development, which enhances our identification of candidates for internal promotion and succession planning.
Finally, our Code of Business Conduct establishes the baseline requirements of our integrity and compliance program and promotes an environment where everyone is treated ethically and with respect. It outlines our pledge to recognize the dignity of each individual, respect each employee, provide compensation and benefits that are competitive, promote self-development through training, and value diversity of perspectives and ideas. All employees must complete Code of Business Conduct training and, where permitted by law, must also certify each year that they will comply with the Code. In 2020, we received certifications from 100% of officers and employees where permitted by law.
Overall, we believe our culture, along with our internal tools and initiatives, enable us to effectively execute our human capital strategy. For discussion on the risks relating to our inability to attract and retain top-performing talent, please see section titled Risk Factors.
7 Honeywell International, Inc.
Item 6. Selected Financial Data
SELECTED FINANCIAL DATA
This selected financial data should be read in conjunction with the Company's Consolidated Financial Statements and related Notes included elsewhere in this Annual Report as well as the section Management's Discussion and Analysis of Financial Condition and Results of Operations.
| Years Ended December 31, | |||||||||||||||||||||||||||||
| 2020 | 2019 | 2018**(1)(2)** | 2017**(1)** | 2016 | |||||||||||||||||||||||||
| (Dollars in millions, except per share amounts) | |||||||||||||||||||||||||||||
| Results of Operations | |||||||||||||||||||||||||||||
| Net sales | $ | 32,637 | $ | 36,709 | $ | 41,802 | $ | 40,534 | $ | 39,302 | |||||||||||||||||||
| Net income attributable to Honeywell | 4,779 | 6,143 | 6,765 | 1,545 | 4,812 | ||||||||||||||||||||||||
| Earnings Per Common Share | |||||||||||||||||||||||||||||
| Earnings from operations: | |||||||||||||||||||||||||||||
| Basic | 6.79 | 8.52 | 9.10 | 2.03 | 6.30 | ||||||||||||||||||||||||
| Assuming dilution | 6.72 | 8.41 | 8.98 | 2.00 | 6.21 | ||||||||||||||||||||||||
| Dividends per share | 3.63 | 3.36 | 3.06 | 2.74 | 2.45 | ||||||||||||||||||||||||
| Balance Sheet Data | |||||||||||||||||||||||||||||
| Property, plant and equipment—net | 5,570 | 5,325 | 5,296 | 5,926 | 5,793 | ||||||||||||||||||||||||
| Total assets | 64,586 | 58,679 | 57,773 | 59,470 | 54,566 | ||||||||||||||||||||||||
| Short-term debt | 6,042 | 4,892 | 6,458 | 5,309 | 3,593 | ||||||||||||||||||||||||
| Long-term debt | 16,342 | 11,110 | 9,756 | 12,573 | 12,182 | ||||||||||||||||||||||||
| Total debt | 22,384 | 16,002 | 16,214 | 17,882 | 15,775 | ||||||||||||||||||||||||
| Redeemable noncontrolling interest | 7 | 7 | 7 | 5 | 3 | ||||||||||||||||||||||||
| Shareowners’ equity | 17,790 | 18,706 | 18,358 | 16,665 | 18,883 |
(1)2018 and 2017 Net Income attributable to Honeywell and Earnings Per Common Share were impacted by the U.S. Tax Cuts and Jobs Act.
(2)The results of operations for the Transportation Systems and Homes and Global Distribution businesses are included in the Consolidated Statement of Operations through the effective dates of the respective spin-offs, which occurred in 2018.
8 Honeywell International, Inc.
Item 7. Management’s Discussion and Analysis of Financial Condition and Results of Operations
MANAGEMENT'S DISCUSSION AND ANALYSIS OF FINANCIAL CONDITION AND RESULTS OF OPERATIONS
(Dollars in tables and graphs in millions)
The following Management’s Discussion and Analysis of Financial Condition and Results of Operations is intended to help the reader understand the results of operations and financial condition of Honeywell International Inc. and its consolidated subsidiaries (Honeywell or the Company) for the three years ended December 31, 2020. All references to Notes relate to Notes to Consolidated Financial Statements in the section titled Financial Statements and Supplementary Data.
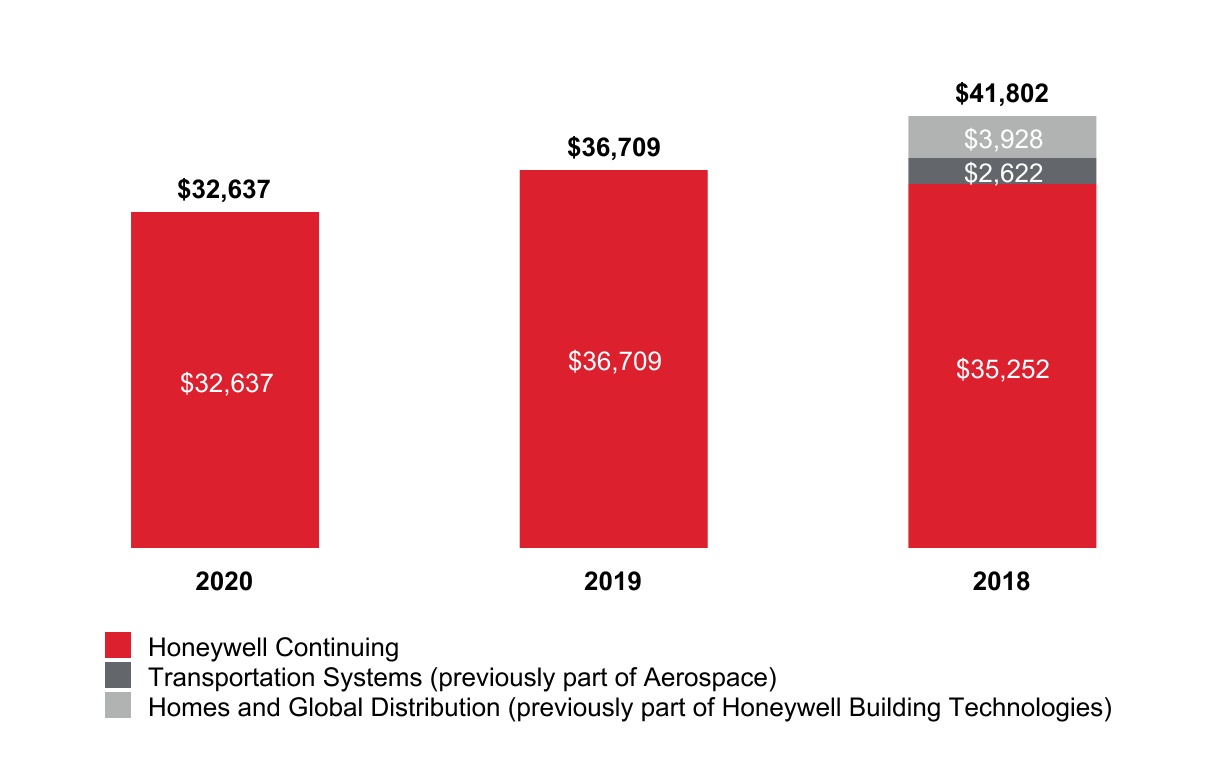
On October 1, 2018, we completed the tax-free spin-off to Honeywell shareowners of our Transportation Systems business, previously part of Aerospace, into a standalone publicly-traded company, Garrett Motion Inc. (Garrett).
On October 29, 2018, we completed the tax-free spin-off to Honeywell shareowners of our Homes and Global Distribution business, previously part of Home and Building Technologies (renamed Honeywell Building Technologies following the spin-off), into a standalone publicly-traded company, Resideo Technologies, Inc. (Resideo).
We removed the assets and liabilities associated with Garrett and Resideo from our Consolidated Balance Sheet as of the effective dates of the respective spin-offs. We included the results of operations for Garrett and Resideo in our Consolidated Statement of Operations through the effective dates of the respective spin-offs. Total sales attributable to these spin-offs were $6.6 billion for the year ended December 31, 2018.
A detailed discussion of the prior year 2019 to 2018 year-over-year changes are not included herein and can be found in the Management's Discussion and Analysis of Financial Condition and Results of Operations section in the 2019 Annual Report on Form 10-K filed February 14, 2020.
COVID-19 UPDATE
In December 2019, a novel strain of coronavirus (COVID-19) was identified in Asia. Over the next several months, COVID-19 quickly spread across the world. In March 2020, the World Health Organization declared COVID-19 a worldwide pandemic. As of December 31, 2020, the virus continues to spread and many countries are experiencing a resurgence in infection rates. Although vaccines have recently been made available, the availability and distribution of the vaccines continue to provide challenges.
Governments took unprecedented actions to contain the spread of COVID-19, temporarily shutting down non-essential businesses, issuing stay at home or “shelter in place” orders and asking citizens to avoid all non-essential travel. In certain situations, governments closed borders and issued mandatory quarantines. Companies were asked, and in many cases were required, to allow non-essential employees to work remotely. Consumer spending declined, global travel demand declined significantly, and the world entered a global recession.
These events impacted our business operations in multiple ways. In the first quarter of 2020, we quickly responded to the changing environment. In January 2020, we implemented policies in select countries within Asia to restrict travel and require employees to work from home for all roles that allow for remote work. In March 2020, we expanded this work from home policy to include our employees worldwide. We introduced appropriate safety and hygiene protocols to enable our manufacturing employees to operate safely through the pandemic. We actively monitored the changing government rules and regulations for each of our locations worldwide.
We remain cautious as many factors remain unpredictable, including the increasing rate of COVID-19 infections. We continue to monitor COVID-19 infection rates globally and acknowledge the risk of new surges in COVID-19 infections.
We prepared procedures for the phased return of our employees to office sites and trained our local site leaders in the appropriate safety and hygiene protocols. As of December 31, 2020, all of our manufacturing sites continue to operate and, outside of India, most of our employees in Asia have returned to the workplace in some capacity. We also returned small numbers of workers to select office sites within Europe and North America. In many countries, including the U.S., most of our non-manufacturing employees continue to work from home (for all roles that allow for remote work).
9 Honeywell International, Inc.
The global recession resulted in a slow-down in demand for many of the products and services that we offer. The impact on each of our businesses is outlined below:
-
Aerospace** – The decline in global travel negatively impacted many of our customers, resulting in lower demand for our products from OEMs and negatively impacted demand for our commercial aftermarket businesses. As a result, this segment's sales and profits declined for the year ended December 31, 2020, compared to the year ended December 31, 2019.
-
Performance Materials and Technologies** – Many of our customers operate in the oil and gas industry. The decline in global travel, coupled with excessive oil and gas supply, negatively impacted many of our customers and resulted in lower demand for our products. As a result, this segment's sales and profits declined for the year ended December 31, 2020, compared to the year ended December 31, 2019.
-
Honeywell Building Technologies** – Our customers own or manage buildings in a variety of industries including commercial real estate, hospitality, government, healthcare, banking and education. The global recession impacted many of these industries, resulting in a reduction of discretionary spending. As a result, this segment's sales and profits declined for the year ended December 31, 2020, compared to the year ended December 31, 2019.
-
Safety and Productivity Solutions** – The global pandemic created significant demand for our respiratory PPE and warehouse automation driving increases in this segment's sales and profits for the year ended December 31, 2020, compared to the year ended December 31, 2019.
As a result of the slowdown in demand for our products, we implemented several cost reduction programs across our enterprise. We canceled our 2020 merit increases and reduced executive and Board of Director compensation. We initiated reduced work schedules across the company and implemented permanent census reductions.
We also took several steps to secure additional liquidity. In March 2020, we entered into a $6.0 billion Delayed Draw Term Loan Agreement. In May 2020, we completed a public Senior Notes offering, which provided $3.0 billion of available liquidity and permanently reduced the undrawn commitments under the Delayed Draw Term Loan Agreement by $3.0 billion. In June 2020, we drew on the remaining $3.0 billion of commitments under the Delayed Draw Term Loan Agreement. In August 2020, we completed a public Senior Notes offering, which provided $3.0 billion of available liquidity and was used to repay the outstanding principal amount of $3.0 billion under the Delayed Draw Term Loan Agreement. As of December 31, 2020, there are no outstanding borrowings or commitments remaining under the Delayed Draw Term Loan Agreement. Further, we held $15.2 billion of available cash and cash equivalents, including short-term investments.
We continue to monitor and respond to the changing conditions created by the pandemic.
Employee Health, Safety, and Economic Wellness
We continue to monitor the COVID-19 situation and its impacts globally. We are prioritizing the health and safety of our employees. Out of an abundance of caution for the health of our employees and to support local government initiatives to stem the spread of the virus, we implemented several precautions at various sites around the world at all times in compliance with local government requirements and Centers for Disease Control and Prevention (CDC) guidelines. These include, but are not limited to:
-
Limiting visitor site access to business-essential purposes;
-
Introducing screening checks at certain sites where permissible or mandated;
-
Enabling employees to work from home wherever and whenever required or appropriate;
-
Continuously updating travel guidance, according to latest developments; and
-
Complying with all local health authority guidance or regulations and our own protocols, including requesting employees to comply with self-quarantine requirements whenever advisable.
We have taken a number of measures to support our employees during these difficult times. We extended medical benefits globally to cover out-of-pocket costs associated with testing for coronavirus, and for those on our U.S. company medical plans, we are also covering treatment costs. In Mexico, we introduced a medical benefit for employees at lower compensation levels to ensure access to private medical treatment. In the U.S., we changed our sick leave plan for non-exempt employees to make more sick time available earlier in the year if it is needed. We established a $10 million company-funded relief fund targeting employees worldwide at lower compensation levels, especially those on reduced work hours who did not receive high levels of income replacement from unemployment or other government assistance.
10 Honeywell International, Inc.
In addition to the measures to assist our employees, Honeywell contributed $2 million to establish a Small Business Innovation Fund in Charlotte to help our local economy. The fund helps storefront businesses with 50 or fewer employees make investments in new technologies and business models to adjust to the realities of operating in the COVID-19 environment. The fund prioritizes businesses owned by women, minorities and veterans.
Our Commitment to Public Health
In a partnership with the State of North Carolina and other local businesses, we announced a goal to deliver 1 million COVID-19 vaccines in North Carolina by July 4, 2021. In Phoenix, where our Aerospace business is headquartered, we will sponsor a week-long vaccination program in February 2021. In addition, Honeywell funded the provision of approximately 10 million meals and a month’s supply of hygiene kits to families in India suffering hardships due to the crisis.
As we produce critical worker safety gear such as face masks, gloves, goggles, safety suits, and protective footwear, we play an essential role in the health and well-being of people and economies. To date, Honeywell has donated more than 2 million masks to frontline workers across multiple regions. Our customers and communities are depending on us more than ever to deliver for them and we are committed to supporting the safety of our employees, customers and fellow citizens around the world.
We are investing in new production facilities and continue to expand existing facilities to increase production of essential PPE products. We will bring these products to market as quickly as possible. We are committed to healthcare professionals, first responders, distributors and other stakeholders in an effort to ensure our PPE products are being placed quickly and cost-effectively in the hands of those most in need.
We announced our new capacity in the U.S. to make N95 masks, with production lines added in Rhode Island and Arizona that will collectively produce 40 million masks each month to support health, safety, and response workers globally. In addition, we are expanding our non-U.S. capacity with a new mask manufacturing line in the UK that is expected to produce 4.5 million masks each month, and a new line in India that is expected to produce 2 million masks each month. Separately, we are collaborating with Mubadala Investment Company's subsidiary, Strata Manufacturing, in the UAE to produce 30 million masks annually.
We have communicated the following principles to our authorized distributor network:
-
Our expectation that, at a minimum, all of our partners will comply with all applicable laws prohibiting price gouging and apply appropriate diligence to the greatest extent possible to understand how our products are being purchased so that they are placed quickly and cost-effectively in the hands of those most in need - including first responders and medical professionals.
-
While we do not control the prices that third parties set, we expect our partners to fairly price PPE used in the COVID-19 response effort.
-
If we find that one of our partners is not upholding the letter or spirit of these principles, we reserve the right not to fulfill that partner’s orders and terminate our relationship with that party.
We are also investing in developing and bringing to market a wide array of new COVID-related products, including but not limited to Healthy Buildings solutions, remote operations offerings, automation technologies to help speed vaccine development, vaccine packaging solutions, an ultraviolet cleaning system for aircraft, innovative dual-layer face covers and safety packs.
Plant Productivity and Safety
In situations where our businesses were deemed essential, we worked with local officials to determine how to safely operate our manufacturing facilities. We successfully operated these manufacturing facilities with minimal disruption in our productivity. In the second quarter of 2020, we repurposed certain manufacturing facilities to produce PPE that was in short supply around the world. As of December 31, 2020, more than 95% of our manufacturing sites were operating at normal production levels.
We continue to provide essential services and produce essential goods around the world. We employ standards such as screening checks, use of masks, face coverings and other safety equipment and social distancing practices along production lines in our production facilities at all times in compliance with local government requirements and CDC guidelines. We take appropriate actions including disinfecting and quarantine procedures when a suspected COVID-19 case is identified.
11 Honeywell International, Inc.
Customers and Suppliers
Current global economic conditions due to COVID-19 have adversely affected and may continue to adversely affect our customers’ and suppliers’ ability to operate or obtain financing, particularly in our airline, oil and gas, and automotive end markets. Customer or supplier bankruptcies, delays in their ability to obtain financing, or the unavailability of financing could adversely affect our cash flow or results of operations. We continue to actively monitor both supplier and customer financial health and take measures to manage our supply chain disruptions and limit our exposure.
See section titled Risk Factors for discussion of risks associated to the COVID-19 pandemic.
12 Honeywell International, Inc.
RESULTS OF OPERATIONS
Consolidated Financial Results

Net Sales by Segment
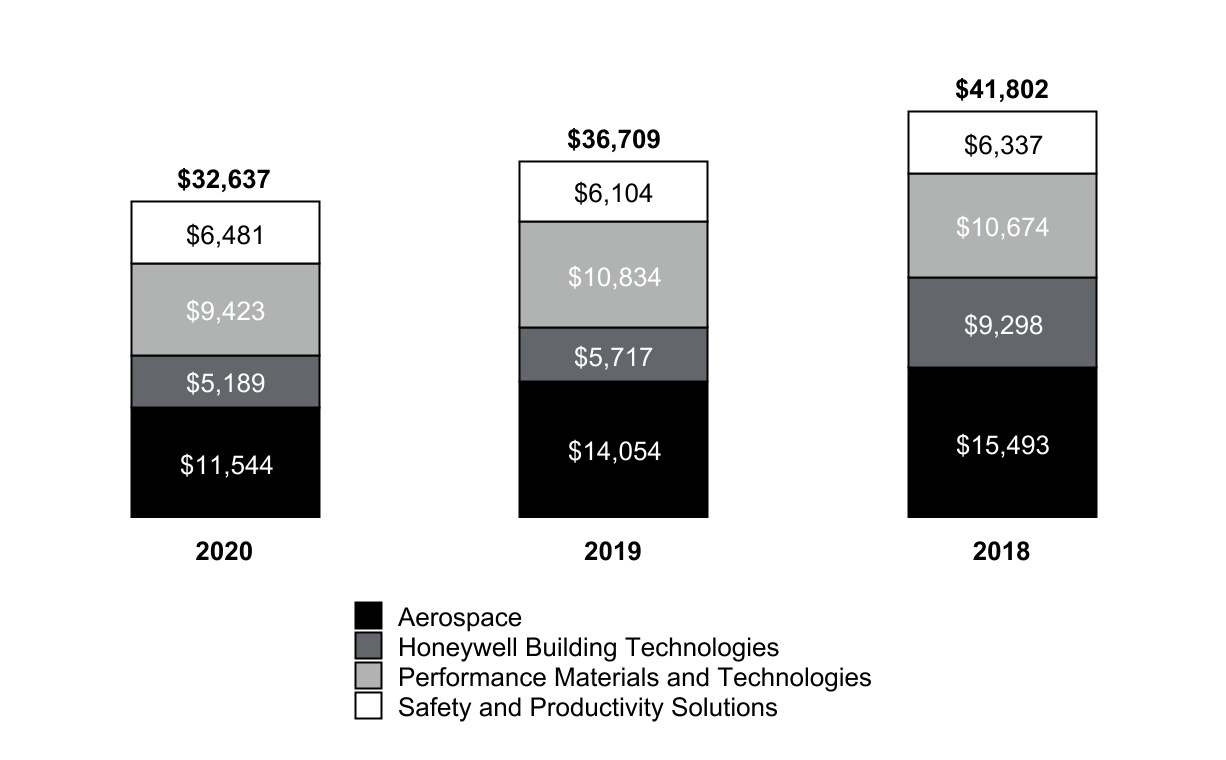
13 Honeywell International, Inc.
Net Sales Attributable to Spun-Off Entities
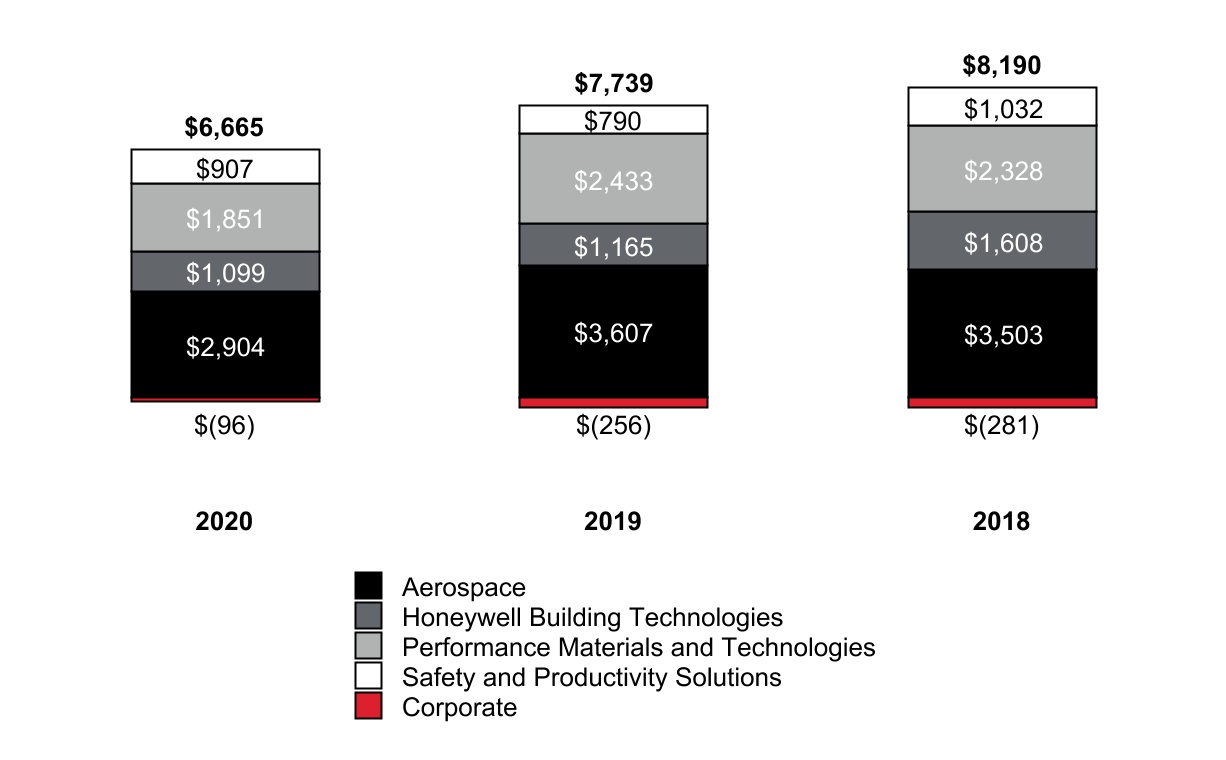
Segment Profit by Segment
14 Honeywell International, Inc.
CONSOLIDATED OPERATING RESULTS
Net Sales
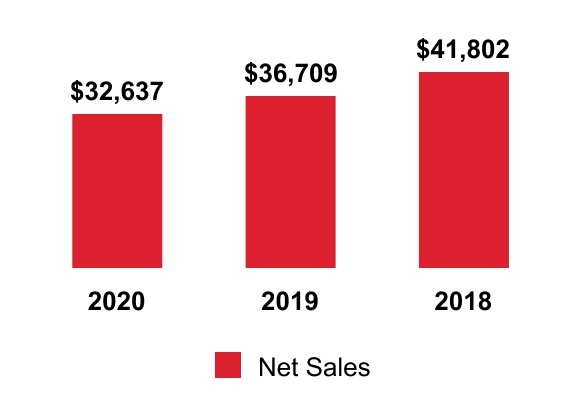
The change in net sales was attributable to the following:
| 2020 Versus 2019 | 2019 Versus 2018 | ||||||||||
| Volume | (12) | % | 3 | % | |||||||
| Price | 1 | % | 2 | % | |||||||
| Foreign Currency Translation | — | % | (1) | % | |||||||
| Acquisitions/Divestitures | — | % | (16) | % | |||||||
| (11) | % | (12) | % |
2020 compared with 2019
A discussion of net sales by segment can be found in the Review of Business Segments section of this Management Discussion and Analysis.
The unfavorable volume in 2020 was driven by:
-
Lower sales across our businesses due to the impact of the global recession attributable to COVID-19 and volatility in the oil and gas industry,
-
Partially offset by strength in respiratory PPE products, warehouse automation projects, and defense and space.
15 Honeywell International, Inc.
Cost of Products and Services Sold
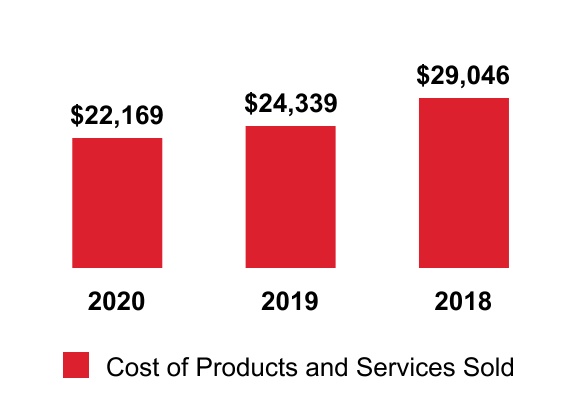
2020 compared with 2019
Cost of products and services sold decreased in 2020 primarily due to the following:
-
Lower direct and indirect material costs by approximately $1,130 million and $310 million,
-
Lower labor costs by approximately $800 million, driven by lower sales volumes and other cost actions to improve productivity.
Gross Margin
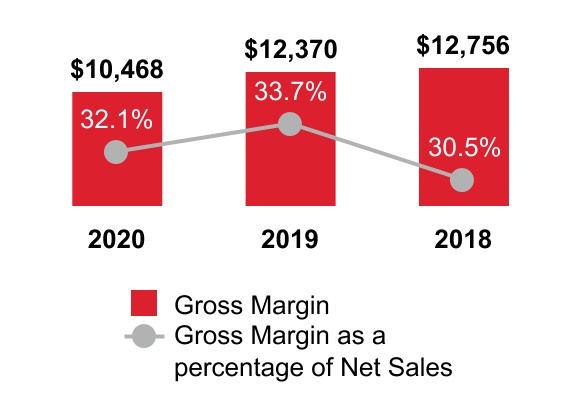
2020 compared with 2019
Gross margin percentage decreased in 2020 primarily due to the following:
-
Lower gross margin in the Performance Materials and Technologies, Aerospace, and Safety and Productivity Solutions segments,
-
Partially offset by higher Honeywell Building Technologies gross margin.
16 Honeywell International, Inc.
Selling, General and Administrative Expenses
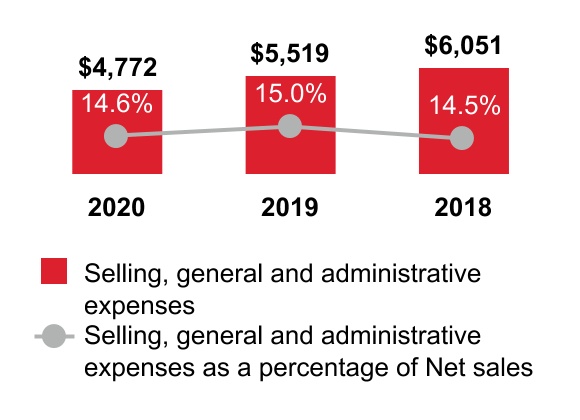
2020 compared with 2019
Selling, general and administrative expenses decreased due to higher productivity, including lower costs resulting from repositioning actions.
Other (Income) Expense
| 2020 | 2019 | 2018 | |||||||||||||||
| Other (income) expense | $ | (675) | $ | (1,065) | $ | (1,149) |
2020 compared with 2019
Other (income) expense changed due to the following:
-
Non-cash charges associated with the reduction in value of reimbursement receivables due from Garrett,
-
Lower interest income, and
-
Lower foreign exchange income,
-
Partially offset by higher pension income, higher equity income of affiliated companies and higher other postretirement income.
17 Honeywell International, Inc.
Tax Expense
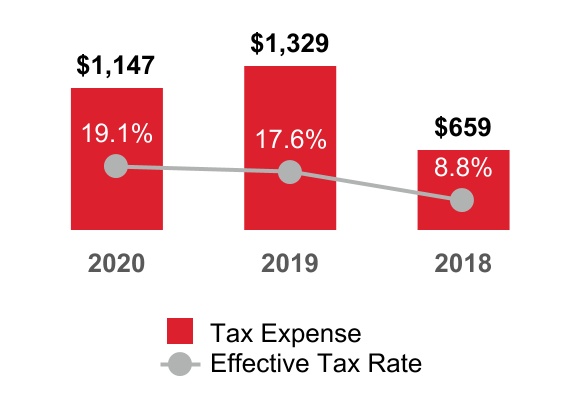
2020 compared with 2019
The effective tax rate for 2020 was lower than the U.S. federal statutory rate of 21% primarily due to the favorable resolution of a foreign tax matter related to the previously completed spin-off transactions, tax impact of restructuring, tax law changes in India, and the resolution of certain U.S. tax matters offset by accrued withholding taxes related to unremitted foreign earnings and non-cash charges related to the reduction of the aggregate carrying value of certain receivables with no corresponding tax benefit.
The effective tax rate for 2019 was lower than the U.S. federal statutory rate of 21% primarily resulting from the impacts of revised guidance related to U.S. Tax Cuts and Jobs Act and internal restructuring initiatives that resulted in a $281 million reduction of accrued withholding taxes related to unremitted foreign earnings.
For further discussion of changes in the effective tax rate, see Note 5 Income Taxes of Notes to Consolidated Financial Statements.
Net Income Attributable to Honeywell

2020 compared with 2019
Earnings per share of common stock–assuming dilution decreased due to the following:
-
Lower segment profit due to the impact of the global recession attributable to COVID-19 and volatility in the oil and gas industry,
-
Non-cash charges associated with the reduction in value of reimbursement receivables due from Garrett, and
-
Lower interest income, lower foreign exchange income, and higher repositioning costs,
-
Partially offset by lower income taxes, higher pension income, and the favorable impact of lower outstanding share count resulting from the Company's stock repurchases.
18 Honeywell International, Inc.
REVIEW OF BUSINESS SEGMENTS
We globally manage our business operations through four segments: Aerospace, Honeywell Building Technologies, Performance Materials and Technologies, and Safety and Productivity Solutions.
AEROSPACE
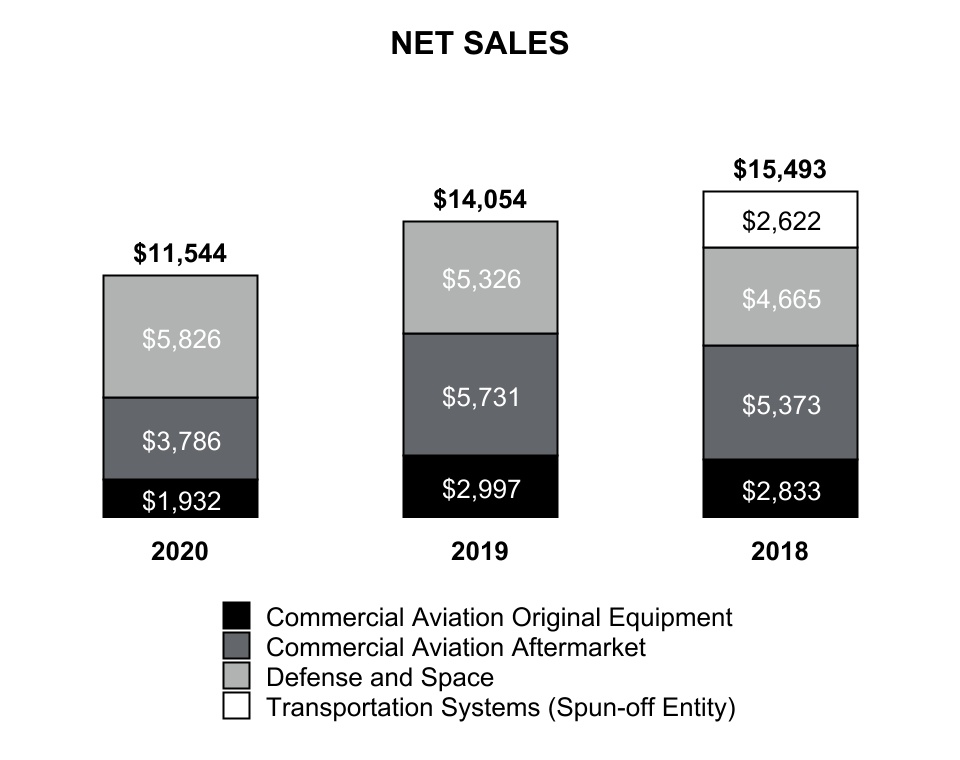
| 2020 | 2019 | Change 2020 vs 2019 | 2018 | Change 2019 vs 2018 | |||||||||||||||||||||||||
| Net sales | $ | 11,544 | $ | 14,054 | (18) | % | $ | 15,493 | (9) | % | |||||||||||||||||||
| Cost of products and services sold | 7,813 | 9,398 | 10,837 | ||||||||||||||||||||||||||
| Selling, general and administrative and other expenses | 827 | 1,049 | 1,153 | ||||||||||||||||||||||||||
| Segment profit | $ | 2,904 | $ | 3,607 | (19) | % | $ | 3,503 | 3 | % |
| Factors Contributing to Year-Over-Year Change | 2020 vs. 2019 | 2019 vs. 2018 | |||||||||||||||||||||
| Net Sales | Segment Profit | Net Sales | Segment Profit | ||||||||||||||||||||
| Organic | (18) | % | (20) | % | 9 | % | 21 | % | |||||||||||||||
| Foreign currency translation | — | % | — | % | — | % | — | % | |||||||||||||||
| Acquisitions, divestitures and other, net | — | % | 1 | % | (18) | % | (18) | % | |||||||||||||||
| Total % Change | (18) | % | (19) | % | (9) | % | 3 | % |
19 Honeywell International, Inc.
2020 compared with 2019
Aerospace Net sales decreased due to lower sales volumes as the decline in global travel resulting form COVID-19 negatively impacted many of our customers, resulting in lower demand for our products from OEMs and reduced demand for our aftermarket products and services.
-
Commercial Aviation Original Equipment sales decreased 36% (decreased 35% organic) due to lower demand from air transport and regional and business aviation OEMs.
-
Commercial Aviation Aftermarket sales decreased 34% (decreased 34% organic) due to lower demand in air transport and regional and business aviation.
-
Defense and Space sales increased 9% (increased 10% organic) driven by growth in U.S. and international defense.
Aerospace segment profit decreased due to lower sales volume and lower sales of higher margin products and services, partially offset by favorable pricing. Cost of products and services sold decreased due to lower sales volumes.
HONEYWELL BUILDING TECHNOLOGIES
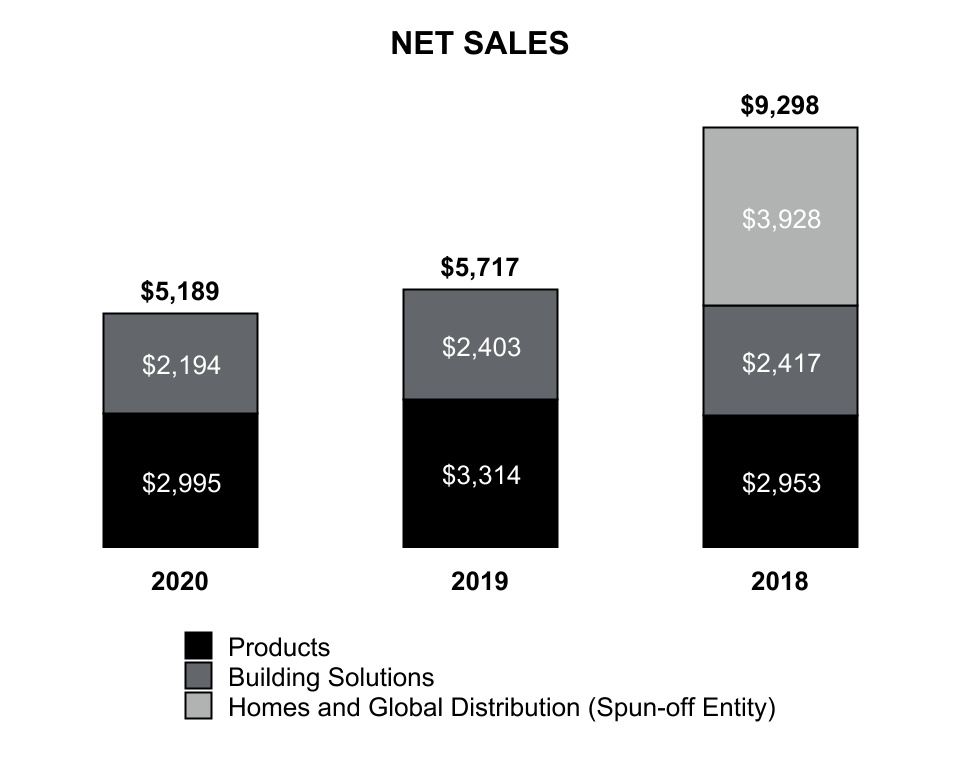
| 2020 | 2019 | Change 2020 vs. 2019 | 2018 | Change 2019 vs. 2018 | |||||||||||||||||||||||||
| Net sales | $ | 5,189 | $ | 5,717 | (9) | % | $ | 9,298 | (39) | % | |||||||||||||||||||
| Cost of products and services sold | 3,067 | 3,444 | 6,066 | ||||||||||||||||||||||||||
| Selling, general and administrative and other expenses | 1,023 | 1,108 | 1,624 | ||||||||||||||||||||||||||
| Segment profit | $ | 1,099 | $ | 1,165 | (6) | % | $ | 1,608 | (28) | % |
20 Honeywell International, Inc.
| Factors Contributing to Year-Over-Year Change | 2020 vs. 2019 | 2019 vs. 2018 | |||||||||||||||||||||
| Net Sales | Segment Profit | Net Sales | Segment Profit | ||||||||||||||||||||
| Organic | (9) | % | (5) | % | 5 | % | 8 | % | |||||||||||||||
| Foreign currency translation | — | % | (1) | % | (2) | % | (2) | % | |||||||||||||||
| Acquisitions, divestitures and other, net | — | % | — | % | (42) | % | (34) | % | |||||||||||||||
| Total % Change | (9) | % | (6) | % | (39) | % | (28) | % |
2020 compared with 2019
Honeywell Building Technologies Net sales decreased due to lower organic sales. Our customers own or manage buildings in a variety of industries including commercial real estate, hospitality, airports and other government buildings, healthcare and education. The global recession resulting from the COVID-19 pandemic impacted many of these industries, resulting in a reduction of discretionary spending and demand for our products and services.
-
Sales in Products decreased 10% (decreased 10% organic) primarily due to lower sales volumes.
-
Sales in Building Solutions decreased 9% (decreased 8% organic) primarily due to lower sales volumes and the unfavorable impact of foreign currency translation.
Honeywell Building Technologies segment profit decreased primarily due to lower sales volumes and the unfavorable impact of foreign currency translation, partially offset by favorable pricing. Cost of products and services sold decreased due to lower sales volumes.
PERFORMANCE MATERIALS AND TECHNOLOGIES

21 Honeywell International, Inc.
| 2020 | 2019 | Change 2020 vs. 2019 | 2018 | Change 2019 vs. 2018 | |||||||||||||||||||||||||
| Net sales | $ | 9,423 | $ | 10,834 | (13) | % | $ | 10,674 | 1 | % | |||||||||||||||||||
| Cost of products and services sold | 6,331 | 6,989 | 6,948 | ||||||||||||||||||||||||||
| Selling, general and administrative and other expenses | 1,241 | 1,412 | 1,398 | ||||||||||||||||||||||||||
| Segment profit | $ | 1,851 | $ | 2,433 | (24) | % | $ | 2,328 | 5 | % |
| Factors Contributing to Year-Over-Year Change | 2020 vs. 2019 | 2019 vs. 2018 | |||||||||||||||||||||
| Net Sales | Segment Profit | Net Sales | Segment Profit | ||||||||||||||||||||
| Organic | (13) | % | (24) | % | 4 | % | 6 | % | |||||||||||||||
| Foreign currency translation | — | % | — | % | (3) | % | (1) | % | |||||||||||||||
| Acquisitions, divestitures and other, net | — | — | — | % | — | % | |||||||||||||||||
| Total % Change | (13) | % | (24) | % | 1 | % | 5 | % |
2020 compared with 2019
Performance Materials and Technologies Net sales decreased primarily due to lower sales volumes. Many of our customers operate in the oil and gas industry. The decline in global travel, coupled with excessive oil and gas supply, negatively impacted many of our customers, resulting in lower demand for our products and services.
-
UOP sales decreased 25% (decreased 25% organic) driven primarily by decreases in catalyst volumes, licensing, and engineering sales volumes.
-
Process Solutions sales decreased 11% (decreased 10% organic) primarily due to lower sales volumes in products businesses, automation projects and migration services.
-
Advanced Materials sales decreased 5% (decreased 6% organic) driven primarily by decreased sales volumes in fluorine products due to lower demand in automotive refrigerants, partially offset by increased sales volumes in specialty products.
Performance Materials and Technologies segment profit decreased primarily due to operating leverage on lower sales volumes and lower sales of higher margin products and services, partially offset by other productivity actions. Cost of products and services sold decreased primarily due to lower sales volumes.
22 Honeywell International, Inc.
SAFETY AND PRODUCTIVITY SOLUTIONS

| 2020 | 2019 | Change 2020 vs. 2019 | 2018 | Change 2019 vs. 2018 | |||||||||||||||||||||||||
| Net sales | $ | 6,481 | $ | 6,104 | 6 | % | $ | 6,337 | (4) | % | |||||||||||||||||||
| Cost of products and services sold | 4,532 | 4,158 | 4,205 | ||||||||||||||||||||||||||
| Selling, general and administrative and other expenses | 1,042 | 1,156 | 1,100 | ||||||||||||||||||||||||||
| Segment profit | $ | 907 | $ | 790 | 15 | % | $ | 1,032 | (23) | % |
| Factors Contributing to Year-Over-Year Change | 2020 vs. 2019 | 2019 vs. 2018 | |||||||||||||||||||||
| Net Sales | Segment Profit | Net Sales | Segment Profit | ||||||||||||||||||||
| Organic | 6 | % | 16 | % | (4) | % | (23) | % | |||||||||||||||
| Foreign currency translation | — | % | (1) | % | (2) | % | (2) | % | |||||||||||||||
| Acquisitions, divestitures and other, net | — | % | — | % | 2 | % | 2 | % | |||||||||||||||
| Total % Change | 6 | % | 15 | % | (4) | % | (23) | % |
23 Honeywell International, Inc.
2020 compared with 2019
Safety and Productivity Solutions Net sales increased primarily due to higher organic sales. The global pandemic has created significant increased demand for our respiratory PPE and additional demand for online shopping services, bolstering demand for our warehouse automation services.
-
Sales in Safety and Retail increased 9% (increased 9% organic) primarily due to a significant increase in order volume for respiratory PPE due to the global pandemic, partially offset by lower demand for gas sensing and detection equipment.
-
Sales in Productivity Solutions and Services decreased 1% (flat organic) due to the unfavorable impact of foreign currency translation.
-
Sales in Warehouse and Workflow Solutions increased 14% (increased 14% organic) primarily due to strong demand for our warehouse automation services.
-
Sales in Sensing & IoT decreased 6% (decreased 6% organic) due to lower organic sales volumes.
Safety and Productivity Solutions segment profit increased as a result of higher productivity, higher sales volumes, and favorable pricing, partially offset by higher sales of lower margin products and the unfavorable impact of foreign currency translation. Cost of products and services sold increased primarily due to higher organic sales volumes, partially offset by higher productivity.
REPOSITIONING CHARGES
See Note 4 Repositioning and Other Charges of Notes to Consolidated Financial Statements for a discussion of our repositioning actions and related charges incurred in 2020, 2019 and 2018. Cash spending related to our repositioning actions was $564 million, $249 million and $285 million in 2020, 2019 and 2018, and was funded through operating cash flows.
Item 1A. Risk Factors
RISK FACTORS
Our business, operating results, cash flows and financial condition are subject to the material risks and uncertainties set forth below, any one of which could cause our actual results to vary materially from recent results or from our anticipated future results.
MACROECONOMIC AND INDUSTRY RISKS
Each of our businesses is subject to unique industry and economic conditions that may adversely affect the markets and operating conditions of our customers, which in turn can affect demand for our products and services and our results of operations.
-
Aerospace**—Our Aerospace business is impacted by customer buying patterns of aftermarket parts, supplier stability, factory transitions and global supply chain capacity constraints that may lead to shortages of crucial components. Operating results may be adversely affected by downturns in the global demand for air travel, which may impact new aircraft production or result in the delay or cancellation of new aircraft orders, delays in launch schedules for new aircraft, the retirement of aircraft and reductions in global flying hours, which impacts air transport and regional, business and general aviation aircraft utilization rates. Operating results may also be adversely affected by any decrease in air travel demand due to regional restrictions or suspension of service for public health, safety, or environmental events, such as the effects of the COVID-19 pandemic, which negatively impacted our operating results during 2020. Operating results could also be impacted by changes in overall trends related to end market demand for the product portfolio, as well as new entrants and non-traditional players entering the market. Operating results in our Defense and Space business unit may be affected by the mix of U.S. and foreign government appropriations for defense and space programs and by compliance risks. Results may also be impacted by the potential introduction of counterfeit parts into our global supply chain.
-
Honeywell Building Technologies**—Operating results may be adversely impacted by downturns in the level of global commercial construction activity (including retrofits and upgrades), lower capital spending and operating expenditures on building projects, decreased industrial plant expansion, changes in the competitive landscape including new market entrants and new technologies, and fluctuations in inventory levels in distribution channels.
24 Honeywell International, Inc.
-
Performance Materials and Technologies**—Operating results may be adversely impacted by downturns in capacity utilization for chemical, industrial, refining, petrochemical and semiconductor plants, our customers’ availability of capital for refinery construction and expansion, raw material demand and supply, product commoditization, continued illegal imports of hydrofluorocarbons into Europe and our ability to maximize our facilities’ production capacity and minimize downtime. Periods of increased volatility in oil and natural gas prices may result in less investment by our customers and therefore, lower demand for our products and services.
-
Safety and Productivity Solutions**—Operating results may be adversely impacted by reduced investments in process automation, safety monitoring, and plant capacity utilization initiatives, fluctuations in retail markets, a slowdown in demand for safety products, changes in the competitive landscape, including new market entrants and technology that may lead to product commoditization, and adverse industry economic conditions, all of which could result in lower market share, reduced selling prices and lower margins.
The global COVID-19 coronavirus pandemic and related impacts adversely affect and may continue to adversely affect our business, financial condition, results of operations, liquidity, and cash flow.
The global spread of coronavirus (COVID-19) creates significant volatility, uncertainty and economic disruption that impacts our business, operations and financial results and may continue to do so. The extent to which the COVID-19 pandemic will continue to impact our business, operations and financial results will depend on numerous evolving factors that we may not be able to accurately predict, including: the duration, scope and severity of the pandemic, including the extent of the continued increase in cases across the United States in particular, as well as the timing and availability of effective medical treatments and vaccines; governmental, business and individual decisions and actions; the pace of vaccine deployment; the impact of the pandemic on economic activity; and the extent to which we or our employees, customers, suppliers, service providers or other business partners may be prevented from conducting normal business activities, including due to shutdowns or other restrictive measures that may be requested or mandated by governmental authorities. These factors could, among other things, continue to disrupt (i) the purchasing, contracting and payment behaviors of our customers and their end-users; (ii) our operations, including our manufacturing activities, the shipment of our products, and the performance of our suppliers and service providers; and (iii) our liquidity and cash flow.
Risks arising from the COVID-19 pandemic impacting our business and that may continue to impact our business, financial condition, results of operations and prospects include, among other things:
-
Customer Risk**—Existing and potential customers and their end-users may continue to take actions to reduce or suspend operations, reduce or delay spending, cancel contracts, or cut costs in a manner that reduces demand for our products and services. In particular, lower demand for air travel may continue to cause our customers to delay or suspend spending in connection with the manufacturing, repair, overhaul or servicing of aircraft, and there may be long-term deterioration in demand for air travel that could impact our business beyond the current COVID-19 health crisis. Customers may also continue to attempt to renegotiate contracts and obtain concessions, face financial constraints on their ability to make payments to us on a timely basis or at all, or enter into bankruptcy or discontinue their business operations, and we may continue to be required to discount the pricing of our products. In addition, unfavorable customer site conditions, such as closure of or access restrictions to customer facilities, and disruptions to our customers’ third-party logistics, warehousing, inventory management and distribution services may continue to limit our ability to sell products, meet billing milestones or provide services.
-
Operations Risk**—The closure of our facilities, restrictions inhibiting our employees’ ability to access those facilities, and disruptions to the ability of our suppliers or service providers to deliver goods or services to us (including as a result of supplier facility closures or access restrictions, disruptions to their supply chains, and supplier liquidity or bankruptcy risk) could further disrupt our ability to provide our services and solutions and result in, among other things, terminations of customer contracts and losses of revenue. Because the COVID-19 pandemic could adversely affect our near-term and long-term revenues, earnings, liquidity and cash flows, we have taken and may be required to redeploy significant cost actions, including but not limited to reducing discretionary expenses (such as non-essential travel, contractors, and consultants), reducing hiring, canceling annual merit increases, reducing executive and board of director pay, reducing work schedules across the enterprise, shortening or staggering work schedules to match production with demand, and reducing staffing levels, as well as increasing supplier-based productivity and enhancing spending-limit controls. However, the extent to which our mitigation efforts are successful, if at all, is not currently ascertainable; also, our costs may not decrease at the same pace as revenue declines
25 Honeywell International, Inc.
as many of our costs are less variable in nature, and we may not be able to or may not choose to significantly reduce them in an effort to remain focused on long-term outlook and growth opportunities. Further, our management of the impact of COVID-19 will continue to require significant investment of time from our management and employees, as well as resources across our global enterprise. The focus on managing and mitigating the impacts of COVID-19 on our business may cause us to divert or delay the application of our resources toward new initiatives or investments, which may adversely impact our future results of operations. Issues relating to the COVID-19 pandemic may also result in legal claims or litigation against us. In addition, remote work has increased the frequency of cybersecurity attacks, including phishing and malware attempts that utilize COVID-19-related strategies, increasing the risk of a material cybersecurity incident that could result in the loss of proprietary or personal data, render us more vulnerable to future cybersecurity attacks, disrupt our operations, or otherwise cause us reputational or financial harm.
- Liquidity and Cash Flow Risk**—Because of the customer and operations risks described above, our business may not continue to generate sufficient cash flow from operations in the future to service our debt and make necessary capital expenditures. If we are unable to generate such cash flow, we may need to use existing cash balances to service our debt, and if such balances are insufficient, then we may be required to engage in one or more alternatives, such as selling assets, restructuring of existing debt, issuing new debt or obtaining additional equity capital on terms that may be onerous or highly dilutive. Our ability to refinance our indebtedness will depend on the capital markets and our financial condition at such time.
Due to the daily evolution of the COVID-19 pandemic and the responses to curb its spread, we cannot predict the ultimate impact the COVID-19 pandemic will have on our business, financial condition, results of operations, liquidity, and cash flow. Any recovery from the COVID-19 pandemic and related economic impact may be slowed or reversed by a variety of factors, such as, in the United States, the current widespread increase in COVID-19 infections. In addition, even after the COVID-19 pandemic has subsided, we may continue to experience adverse impacts to our business as a result of its global economic impact, including the current recession and any recession that may occur in the future. Further, many of the factors disclosed under Risk Factors in this Form 10-K are, and we anticipate will continue to be further, heightened or exacerbated by the impact of the COVID-19 pandemic.
A significant percentage of our sales and operations is in non-U.S. jurisdictions and is subject to the economic, political, regulatory, foreign exchange and other risks of international operations.
Our international operations, including U.S. exports, represent more than half of the Company’s sales. Risks related to international operations include exchange control regulations, wage and price controls, antitrust regulations, employment regulations, foreign investment laws, import, export and other trade restrictions (such as sanctions and embargoes), differing levels of protection of intellectual property, acts of industrial espionage, violations by our employees of anti-corruption laws (despite our efforts to mitigate such risk), changes in regulations regarding transactions with state-owned enterprises, nationalization of private enterprises, acts of terrorism, and our ability to hire and maintain qualified staff and maintain the safety of our employees in these regions. Instability and uncertainties arising from the global geopolitical environment and the evolving international and domestic political, regulatory and economic landscape, including the potential for changes in global trade policies, including sanctions and trade barriers, and trends such as populism, economic nationalism and negative sentiment toward multinational companies, as well as the cost of compliance with increasingly complex and often conflicting regulations worldwide, can impair our flexibility in modifying product, marketing, pricing or other strategies for growing our businesses, as well as our ability to improve productivity and maintain acceptable operating margins.
In December 2020, the United Kingdom and the European Union announced they had entered into a post-Brexit deal on certain aspects of trade and other strategic and political issues. Depending on the application of the terms of the trade and cooperation agreement between the United Kingdom and the European Union, we could face increased regulatory costs and challenges. The Company has developed plans to mitigate the potential impact of these costs and challenges, but the implications of these uncertainties could affect the Company's business, financial position and results of operations.
Existing free trade laws and regulations provide certain beneficial duties and tariffs for qualifying imports and exports. Changes in laws or policies governing the terms of foreign trade, and in particular increased trade restrictions, tariffs or taxes on imports from countries where we manufacture products or from where we import products or raw materials, either directly or through our suppliers, could have an impact on our competitive position and financial results.
The United States has commenced certain trade actions, including imposing tariffs on certain goods imported from China and other countries, which has resulted in retaliatory tariffs by China and other countries. Additional
26 Honeywell International, Inc.
tariffs imposed by the United States on a broader range of imports, or further retaliatory trade measures taken by China or other countries in response, could increase the cost of our products. Given the change in the U.S. presidential administration, we face uncertainty with regard to U.S. government trade policy.
Operating outside of the United States also exposes us to foreign exchange risk, which we monitor and seek to reduce through hedging activities. However, foreign exchange hedging activities bear a financial cost and may not always be available to us or be successful in eliminating such volatility. Finally, we generate significant amounts of cash outside of the United States that is invested with financial and non-financial counterparties. While we employ comprehensive controls regarding global cash management to guard against cash or investment loss and to ensure our ability to fund our operations and commitments, a material disruption to the counterparties with whom we transact business could expose Honeywell to financial loss.
Operating outside the United States also exposes us to additional intellectual property risk. The laws and enforcement practices of certain jurisdictions in which we operate may not protect our intellectual property rights to the same extent as in the U.S. and may impose joint venture, technology transfer, local service or other foreign investment requirements and restrictions that potentially compromise control over our technology and proprietary information. Failure of foreign jurisdictions to protect our intellectual property rights, an inability to effectively enforce such rights in foreign jurisdictions, or the imposition of foreign jurisdiction investment or sourcing restrictions or requirements could result in loss of valuable proprietary information and could impact our competitive position and financial results.
Risks related to our defined benefit pension plans may adversely impact our results of operations and cash flow.
Significant changes in actual investment return on pension assets, discount rates, and other factors could adversely affect our results of operations and require cash pension contributions in future periods. Changes in discount rates and actual asset returns different than our anticipated asset returns can result in significant non-cash actuarial gains or losses, which we record in the fourth quarter of each fiscal year, and, if applicable, in any quarter in which an interim re-measurement is triggered. With regard to cash pension contributions, funding requirements for our pension plans are largely dependent upon interest rates, actual investment returns on pension assets and the impact of legislative or regulatory changes related to pension funding obligations.
OPERATIONAL RISKS
Raw material price fluctuations, the ability of key suppliers to meet quality and delivery requirements, or catastrophic events can increase the cost of our products and services, impact our ability to meet commitments to customers and cause us to incur significant liabilities.
The cost of raw materials is a key element in the cost of our products, particularly in Performance Materials and Technologies (copper, fluorspar, tungsten salts, ethylene, aluminum, and molybdenum) and in Aerospace (nickel, steel, titanium and other metals). Our inability to offset material price inflation through increased prices to customers, formula-driven or long-term fixed price contracts with suppliers, productivity actions or commodity hedges could adversely affect our results of operations.
Many major components, product equipment items and raw materials, particularly in Aerospace, are procured or subcontracted on a single or sole-source basis. Although we maintain a qualification and performance surveillance process and we believe that sources of supply for raw materials and components are generally adequate, it is difficult to predict what effects shortages or price increases may have in the future. Our ability to manage inventory and meet delivery requirements may be constrained by our suppliers’ inability to scale production and adjust delivery of long-lead time products during times of volatile demand. In addition, current or future global economic uncertainty, including the ongoing COVID-19 pandemic, may affect the financial stability of our key suppliers or their access to financing, which may in turn affect their ability to perform their obligations to us. If one or more of our suppliers experiences financial difficulties, delivery delays or other performance problems, our resulting inability to fill our supply needs would jeopardize our ability to fulfill obligations under commercial and government contracts, which could, in turn, result in reduced sales and profits, contract penalties or terminations, and damage to customer relationships.
27 Honeywell International, Inc.
We may be unable to successfully execute or effectively integrate acquisitions, and divestitures may not occur as planned.
We regularly review our portfolio of businesses and pursue growth through acquisitions and seek to divest non-core businesses. We may not be able to complete transactions on favorable terms, on a timely basis, or at all. In addition, our results of operations and cash flows may be adversely impacted by (i) the failure of acquired businesses to meet or exceed expected returns, including risk of impairment; (ii) the failure to integrate multiple acquired businesses into Honeywell simultaneously and on schedule and/or to achieve expected synergies; (iii) the inability to dispose of non-core assets and businesses on satisfactory terms and conditions; and (iv) the discovery of unanticipated liabilities, labor relations difficulties, cybersecurity concerns, compliance issues or other problems in acquired businesses for which we lack contractual protections, insurance or indemnities, or, with regard to divested businesses, claims by purchasers to whom we have provided contractual indemnification.
Our future growth is largely dependent upon our ability to develop new technologies and introduce new products that achieve market acceptance in increasingly competitive markets with acceptable margins.
Our future growth rate depends upon a number of factors, including our ability to (i) identify and evolve with emerging technological and broader industry trends in our target end-markets; (ii) develop and maintain competitive products; (iii) defend our market share against an ever-expanding number of competitors, including many new and non-traditional competitors; (iv) enhance our products by adding innovative features that differentiate our products from those of our competitors and prevent commoditization of our products; (v) develop, manufacture and bring compelling new products to market quickly and cost-effectively; (vi) monitor disruptive technologies and business models; (vii) achieve sufficient return on investment for new products introduced based on capital expenditures and research and development spending; (viii) respond to changes in overall trends related to end-market demand; and (ix) attract, develop and retain individuals with the requisite technical expertise and understanding of customers’ needs to develop new technologies and introduce new products. Competitors may also develop after-market services and parts for our products which attract customers and adversely affect our return on investment for new products. The failure of our technologies or products to gain market acceptance due to more attractive offerings by our competitors or the failure to address any of the above factors could significantly reduce our revenues and adversely affect our competitive standing and prospects.
Failure to increase productivity through sustainable operational improvements, as well as an inability to successfully execute repositioning projects or to effectively manage our workforce, may reduce our profitability or adversely impact our businesses.
Our profitability and margin growth are dependent upon our ability to drive sustainable improvements. We seek productivity and cost savings benefits through repositioning actions and projects, such as consolidation of manufacturing facilities, transitions to cost-competitive regions and product line rationalizations. Risks associated with these actions include delays in execution, additional unexpected costs, realization of fewer than estimated productivity improvements and adverse effects on employee morale. We may not realize the full operational or financial benefits we expect, the recognition of these benefits may be delayed, and these actions may potentially disrupt our operations. In addition, organizational changes, increased attrition, failure to create and implement a succession plan for key Company positions, not retaining key talent, inability to attract new employees with unique skills, labor relations difficulties, or workforce stoppage could have a material adverse effect on our business, reputation, financial position and results of operations.
As a supplier to the U.S. Government, we are subject to unique risks, such as the right of the U.S. Government to terminate contracts for convenience and to conduct audits and investigations of our operations and performance.
U.S. Government contracts are subject to termination by the government, either for the convenience of the government or for our failure to perform consistent with the terms of the applicable contract. Our contracts with the U.S. Government are also subject to government audits that may recommend downward price adjustments and other changes. When appropriate and prudent, we made adjustments and paid voluntary refunds in the past and may do so in the future.
28 Honeywell International, Inc.
We are also subject to government investigations of business practices and compliance with government procurement and security regulations. If, as a result of any such investigation or other government investigations (including investigation of violations of certain environmental, employment or export laws), Honeywell or one of its businesses were found to have violated applicable law, then it could be suspended from bidding on or receiving awards of new government contracts, suspended from contract performance pending the completion of legal proceedings and/or have its export privileges suspended.
Our operations and the prior operations of predecessor companies expose us to the risk of material environmental liabilities.
Mainly because of past operations and operations of predecessor companies, we are subject to potentially material liabilities related to the remediation of environmental hazards and to claims of personal injuries or property damages that may be caused by hazardous substance releases and exposures. We continue to incur remedial response and voluntary clean-up costs for site contamination and are a party to lawsuits and claims associated with environmental and safety matters, including past production of products containing hazardous substances. Additional lawsuits, claims and costs involving environmental matters are likely to continue to arise in the future. Various federal, state, local and foreign governments regulate the use of certain materials, the discharge of materials into the environment, and/or communications respecting certain materials in our products, and can impose substantial fines and criminal sanctions for violations, and require injunctive relief measures, including installation of costly equipment, implementation of operational changes to limit emissions and/or decrease the likelihood of accidental hazardous substance releases, or limiting access of our products to markets, among others. In addition, changes in laws, regulations and enforcement of policies, the discovery of previously unknown contamination or new technology or information related to individual sites, the establishment of stricter toxicity standards with respect to certain contaminants, or the imposition of new clean-up requirements or remedial techniques could require us to incur additional costs in the future that would have a negative effect on our financial condition or results of operations.
Cybersecurity incidents could disrupt business operations, result in the loss of critical and confidential information, and adversely impact our reputation and results of operations.
Global cybersecurity threats and incidents can range from uncoordinated individual attempts to gain unauthorized access to information technology (IT) systems to sophisticated and targeted measures known as advanced persistent threats, directed at the Company, its products, its customers and/or its third party service providers, including cloud providers. Our customers, including the U.S. Government, are increasingly requiring cybersecurity protections and mandating cybersecurity standards in our products, and we may incur additional costs to comply with such demands. While we have experienced, and expect to continue to experience, these types of threats and incidents, none of them to date have been material to the Company. We seek to deploy comprehensive measures to deter, prevent, detect, respond to and mitigate these threats, including identity and access controls, data protection, vulnerability assessments, continuous monitoring of our IT networks and systems and maintenance of backup and protective systems. Despite these efforts, cybersecurity incidents, depending on their nature and scope, could potentially result in the misappropriation, destruction, corruption or unavailability of critical data and confidential or proprietary information (our own or that of third parties) and the disruption of business operations. The potential consequences of a material cybersecurity incident include financial loss, reputational damage, litigation with third parties, theft of intellectual property, fines levied by the Federal Trade Commission, diminution in the value of our investment in research, development and engineering, and increased cybersecurity protection and remediation costs due to the increasing sophistication and proliferation of threats, which in turn could adversely affect our competitiveness and results of operations.
29 Honeywell International, Inc.
The development of technology products and services presents security and safety risks.
An increasing number of our products, services and technologies are delivered with Internet of Things (IoT) capabilities and the accompanying interconnected device networks, which include sensors, data and advanced computing capabilities. We have developed product software designs that we believe are less susceptible to cyber-attacks, but despite these efforts, if our products and services that include IoT solutions do not work as intended or are compromised, the possible consequences include financial loss, reputational damage, exposure to legal claims or enforcement actions, theft of intellectual property, and diminution in the value of our investment in research, development and engineering, which in turn could adversely affect our competitiveness and results of operations.
Data privacy, data protection, and information security may require significant resources and present certain risks.
We collect, store, have access to and otherwise process certain confidential or sensitive data, including proprietary business information, personal data or other information that is subject to privacy and security laws, regulations and/or customer-imposed controls. Despite our efforts to protect such data, we may be vulnerable to material security breaches, theft, misplaced or lost data, programming errors, or employee errors that could potentially lead to the compromising of such data, improper use of our systems, software solutions or networks, unauthorized access, use, disclosure, modification or destruction of information, defective products, production downtimes and operational disruptions. In addition, we operate in an environment in which there are different and potentially conflicting data privacy laws in effect in the various U.S. states and foreign jurisdictions in which we operate and we must understand and comply with each law and standard in each of these jurisdictions while ensuring the data is secure. For example, the State of California recently passed legislation granting residents certain new data privacy rights and regulating the security of IoT devices, effective in January 2020, and California voters recently approved additional privacy legislation, which provides for the establishment of a California privacy regulator, modifies the current data privacy regulations and imposes additional data protection obligations and is effective in January 2023; European laws require us to have an approved legal mechanism to transfer personal data out of Europe; the European Union General Data Protection Regulation, which became enforceable in May 2018, superseded prior European Union data protection legislation and imposes more stringent requirements in how we collect and process personal data and provides for significantly greater penalties for noncompliance; and several other states and countries have passed or are considering laws that require personal data relating to their residents or citizens to be maintained on local servers and impose additional data transfer restrictions. Government enforcement actions can be costly and interrupt the regular operation of our business, and violations of data privacy laws can result in fines, reputational damage and civil lawsuits, any of which may adversely affect our business, reputation and financial statements.
A material disruption of our operations, particularly at our manufacturing facilities or within our information technology infrastructure, could adversely affect our business.
Our facilities, supply chains, distribution systems and information technology systems are subject to catastrophic loss due to natural disasters, including hurricanes and floods, power outages, fires, explosions, terrorism, equipment failures, sabotage, cyber incidents, any potential effects of climate change and adverse weather conditions, labor disputes, critical supply failure, inaccurate downtime forecast, political disruption, and other reasons, which can result in undesirable consequences, including financial losses and damaged relationships with customers. Another public health crises, like a regional or global pandemic, including the COVID-19 pandemic, could again disrupt our supply chain, distribution channels, production facilities, operations and customer demand, which could negatively impact our operations and adversely affect our business. We employ information technology systems and networks to support the business and rely on them to process, transmit and store electronic information, and to manage or support a variety of business processes and activities. Disruptions to our information technology infrastructure from system failures, shutdowns, power outages, telecommunication or utility failures, cybersecurity incidents, and other events, including disruptions at our cloud computing, server, systems and other third party IT service providers, could interfere with our operations, interrupt production and shipments, damage customer and business partner relationships, and negatively impact our reputation.
30 Honeywell International, Inc.
Concentrations of credit, counterparty and market risk may adversely affect our results of operations and financial condition.
We maintain long-term contractual relationships with many of our customers, suppliers, and other counterparties. While we monitor the financial health of these counterparties, we are exposed to credit and market risks of such counterparties, including those concentrated in the same or similar industries and geographic regions. Changes in economic conditions, including the impact of the COVID-19 pandemic and resulting recession, could also lead to concerns about the creditworthiness of counterparties in the same or similar industry or geography, impacting our ability to renew our long-term contractual arrangements or collect amounts due under these arrangements. Among other factors, changes in economic conditions could also result in the credit deterioration or insolvency of a significant counterparty.
Garrett is currently subject to bankruptcy proceedings in the United States Bankruptcy Court for the Southern District of New York. We have recorded an adjustment against the receivable amounts owed to us under agreements with Garrett, and depending on developments, we may be required to record an additional adjustment in whole or in part (together with a related statement of operations charge) in a future period or periods.
We regularly review the aggregate carrying value of the reimbursement receivable amounts due from Garrett in connection with our indemnification and reimbursement agreement and our tax matters agreement with Garrett. On September 20, 2020, Garrett and certain of its affiliates filed voluntary petitions for relief under Chapter 11 of the United States Bankruptcy Code in the United States Bankruptcy Court for the Southern District of New York (the Bankruptcy Court). On January 11, 2021, Garrett accepted, in the bankruptcy proceedings, a revised agreement, originally proposed by Oaktree Capital Management, L.P. (Oaktree) and Centerbridge Partners, L.P. (Centerbridge), in coordination with Honeywell, and subsequently signed by additional equity holders that, collectively with the Company, Oaketree, and Centerbridge, represent approximately 58% of Garrett's outstanding common stock and noteholders representing approximately 88% of the principal amount outstanding on Garrett's senior notes (the Final COH Plan). Based on the Final COH Plan, we believe the present value of payments to us under the Final COH Plan are an appropriate estimate of receivable amounts due in connection with the indemnification and reimbursement agreement and the tax matters agreement. There can be no assurance that the Final COH Plan will be confirmed by the Bankruptcy Court or that Garrett will be able to substantially consummate the restructuring transactions contemplated in the Final COH Plan. The ultimate outcome of the bankruptcy process is uncertain. Should any of these assumptions change and depending on the transaction and/or plan of reorganization ultimately approved by the Bankruptcy Court, the amount collected could differ from the receivable amounts currently recorded in our financial statements. There can be no assurance that recording an additional adjustment (positive or negative) against the remaining receivable amounts in whole or in part (together with a related statement of operations charge) will not be necessary in a future period or periods. See Note 20 Commitments and Contingencies of Notes to Consolidated Financial Statements for further details.
LEGAL AND REGULATORY RISKS
Our U.S. and non-U.S. tax liabilities are dependent, in part, upon the distribution of income among various jurisdictions in which we operate.
Our future results of operations could be adversely affected by changes in the effective tax rate as a result of a change in the mix of earnings in countries with differing statutory tax rates, changes in tax laws, regulations and judicial rulings (or changes in the interpretation thereof), potential taxation of digital services, changes in generally accepted accounting principles, changes in the valuation of deferred tax assets and liabilities, changes in the amount of earnings permanently reinvested offshore, the results of audits and examinations of previously filed tax returns and continuing assessments of our tax exposures and various other governmental enforcement initiatives. Our tax expense includes estimates of tax reserves and reflects other estimates and assumptions, including assessments of future earnings of the Company, which could impact the valuation of our deferred tax assets.
31 Honeywell International, Inc.
Changes in legislation or government regulations or policies can have a significant impact on our results of operations.
The sales and margins of each of our segments are directly impacted by government regulations, including environmental, safety, performance and product certification regulations. Within Aerospace, the operating results of Commercial Original Equipment and Commercial Aftermarket may be impacted by, among other things, mandates of the Federal Aviation Administration and other similar international regulatory bodies requiring the installation of equipment on aircraft. Our Defense and Space business unit may be affected by changes in government procurement regulations. Within Honeywell Building Technologies and Safety and Productivity Solutions, the demand for and cost of providing products, services and solutions can be impacted by fire, security, safety, health care, environmental and energy efficiency standards and regulations. Performance Materials and Technologies’ results of operations can be impacted by environmental standards, regulations, and judicial determinations*.* Growth in all our businesses within emerging markets may be adversely impacted by the inability to acquire and retain qualified employees where local employment law mandates may be restrictive. Changes in such regulations and government policies could negatively impact us; for instance, noncompliance with legislation and regulations can result in fines and penalties, and compliance with any new regulations or policies may be burdensome and/or require significant expenditures.
Increased public awareness and concern regarding global climate change may result in more international, regional and/or federal or other stakeholder requirements or expectations that could mandate more restrictive or expansive standards, such as stricter limits on greenhouse gas emissions or more prescriptive reporting of environmental, social, and governance metrics, than the voluntary commitments that the Company has adopted or require such changes on a more accelerated time frame. There continues to be a lack of consistent climate legislation, which creates economic and regulatory uncertainty; however, under the new U.S. presidential administration, there likely will be renewed interest in such legislation. If environmental laws or regulations are either changed or adopted and impose significant operational restrictions and compliance requirements upon the Company or its products, they could negatively impact the Company’s business, capital expenditures, results of operations, financial condition and competitive position.
We cannot predict with certainty the outcome of litigation matters, government proceedings and other contingencies and uncertainties.
We are subject to a number of lawsuits, investigations and disputes (some of which involve substantial amounts claimed) arising out of the conduct of our business, including matters relating to commercial transactions, government contracts, product liability (including asbestos), prior acquisitions and divestitures, employment, employee benefits plans, intellectual property, antitrust, anti-corruption, accounting, import and export, and environmental, health and safety matters. Our potential liabilities are subject to change over time due to new developments, changes in settlement strategy or the impact of evidentiary requirements, and we may become subject to or be required to pay damage awards or settlements that could have a material adverse effect on our results of operations, cash flows and financial condition. While we maintain insurance for certain risks, the amount of our insurance coverage may not be adequate to cover the total amount of all insured claims and liabilities. The incurrence of significant liabilities for which there is no or insufficient insurance coverage could adversely affect our results of operations, cash flows, liquidity and financial condition.
Item 7A. Quantitative and Qualitative Disclosures About Market Risks
QUANTITATIVE AND QUALITATIVE DISCLOSURES ABOUT MARKET RISKS
Information relating to market risks is included within Liquidity and Capital Resources of our Form 10-K under the caption “Financial Instruments”.
32 Honeywell International, Inc.
LIQUIDITY AND CAPITAL RESOURCES
(Dollars in tables in millions)
We continue to manage our businesses to maximize operating cash flows as the primary source of liquidity. Each of our businesses is focused on increasing operating cash flows through revenue growth, margin expansion and improved working capital turnover. Additional sources of liquidity include committed credit lines, short-term debt from the commercial paper market, long-term borrowings, access to the public debt and equity markets, U.S. cash balances and the ability to access non-U.S. cash as a result of the U.S. Tax Cuts and Jobs Act.
CASH
We monitor the third-party depository institutions that hold our cash and cash equivalents on a daily basis. Our emphasis is primarily safety of principal and secondarily maximizing yield of those funds. We diversify our cash and cash equivalents among counterparties to minimize exposure to any one of these entities. As of December 31, 2020 and 2019, we held $15.2 billion and $10.4 billion, respectively, of cash and cash equivalents, including our short-term investments.
BORROWINGS
Consolidated total borrowings were $22.4 billion and $16.0 billion as of December 31, 2020 and 2019. In response to COVID-19, the Company took several actions during 2020 to secure liquidity in light of the uncertainty in economic conditions and the credit markets, including a $6.0 billion Delayed Draw Term Loan and a total of $7.1 billion raised through Senior Note offerings. See Note 10 Long-term Debt and Credit Agreements of Notes to Consolidated Financial Statements for a summary of the actions taken by the Company to improve our short-term and long-term liquidity position in response to COVID-19.
| December 31, | |||||||||||
| 2020 | 2019 | ||||||||||
| Commercial paper and other short-term borrowings | $ | 3,597 | $ | 3,516 | |||||||
| Variable rate notes | 1,122 | 622 | |||||||||
| Fixed rate notes | 17,399 | 11,586 | |||||||||
| Other | 266 | 278 | |||||||||
| Total borrowings | $ | 22,384 | $ | 16,002 |
A source of liquidity is our ability to access the commercial paper market. Commercial paper notes are sold at a discount or premium and have a maturity of not more than 365 days from date of issuance. Borrowings under the commercial paper program are available for general corporate purposes as well as for financing acquisitions. The weighted average interest rate on commercial paper and other short-term borrowings outstanding was 0.27% and (0.37%) as of December 31, 2020 and 2019.
We also have the following revolving credit agreements:
-
A $1.5 billion 364-Day Credit Agreement (the 364-Day Credit Agreement) with a syndicate of banks, dated April 10, 2020. This 364-Day Credit Agreement is maintained for general corporate purposes. The 364-Day Credit Agreement replaced the 364-day credit agreement dated as of April 26, 2019, which was terminated on April 10, 2020. As of December 31, 2020, there were no outstanding borrowings under our 364-Day Credit Agreement.
-
A $4.0 billion Five Year Credit Agreement (the 5-Year Credit Agreement) with a syndicate of banks, dated April 26, 2019. This 5-Year Credit Agreement is maintained for general corporate purposes. Commitments under the 5-Year Credit Agreement can be increased pursuant to the terms of the 5-Year Credit Agreement to an aggregate amount not to exceed $4.5 billion. As of December 31, 2020, there were no outstanding borrowings under our 5-Year Credit Agreement.
33 Honeywell International, Inc.
We also have a current shelf registration statement filed with the SEC under which we may issue additional debt securities, common stock and preferred stock that may be offered in one or more offerings on terms to be determined at the time of the offering. We anticipate that net proceeds of any offering would be used for general corporate purposes, including repayment of existing indebtedness, share repurchases, capital expenditures and acquisitions.
CREDIT RATINGS
Our ability to access the global debt capital markets and the related cost of these borrowings, is affected by the strength of our credit rating and market conditions. Our credit ratings are periodically reviewed by the major independent debt-rating agencies. As of December 31, 2020, S&P, Fitch, and Moody’s have ratings on our debt set forth in the table below:
| S&P | Fitch | Moody's | |||||||||||||||
| Outlook | Stable | Stable | Stable | ||||||||||||||
| Short-term | A-1 | F1 | P1 | ||||||||||||||
| Long-term | A | A | A2 |
CASH FLOW SUMMARY
Our cash flows from operating, investing and financing activities, as reflected in the Consolidated Statement of Cash Flows, are summarized as follows:
| Years Ended December 31, | |||||||||||||||||
| 2020 | 2019 | 2018 | |||||||||||||||
| Cash provided by (used for): | |||||||||||||||||
| Operating activities | $ | 6,208 | $ | 6,897 | $ | 6,434 | |||||||||||
| Investing activities | (987) | (533) | 1,027 | ||||||||||||||
| Financing activities | (81) | (6,600) | (5,032) | ||||||||||||||
| Effect of exchange rate changes on cash | 68 | 16 | (201) | ||||||||||||||
| Net increase (decrease) in cash and cash equivalents | $ | 5,208 | $ | (220) | $ | 2,228 |
2020 compared with 2019
Cash provided by operating activities decreased by $689 million primarily due to lower net income of $1,364 million, partially offset by a favorable impact from working capital of $588 million (favorable accounts receivable and inventory, partially offset by accounts payable).
Cash used for investing activities increased by $454 million primarily due to a $251 million increase in payments related to settlements of derivative contracts, $211 million increase in cash paid for acquisitions, net of cash acquired, and $67 million increase in capital expenditures, partially offset by a net decrease in investments of $61 million.
Cash used for financing activities decreased by $6,519 million primarily due to a $7,399 million increase in proceeds from the issuance of long-term debt and a $686 million decrease in repurchases of common stock, partially offset by an increase in payments of long-term debt of $1,405 million.
CASH REQUIREMENTS AND ASSESSMENT OF CURRENT LIQUIDITY
In addition to our normal operating cash requirements, our principal future cash requirements will be to fund capital expenditures, share repurchases, dividends, strategic acquisitions and debt repayments. Specifically, we expect our primary cash requirements in 2021 to be as follows:
- Capital expenditures—we expect to spend approximately $1 billion for capital expenditures in 2021 primarily for growth, production and capacity expansion, implementation of cost reduction measures, maintenance, and replacement.
34 Honeywell International, Inc.
-
Share repurchases—under our share repurchase program, $3.3 billion was available as of December 31, 2020 for additional share repurchases. We expect to repurchase outstanding shares from time to time to offset the dilutive impact of employee stock-based compensation plans, including option exercises, restricted unit vesting and matching contributions under our savings plans. Additionally, we will seek to reduce share count via share repurchases as and when attractive opportunities arise. The amount and timing of future repurchases may vary depending on market conditions and our level of operating, financing and other investing activities.
-
Dividends—we increased our quarterly dividend rate by 3% to $0.93 per share of common stock effective with the fourth quarter 2020 dividend. We intend to continue to pay quarterly dividends in 2021.
We continue to identify opportunities to improve our liquidity and working capital efficiency, which includes the extension of payment terms with our suppliers. In addition, multiple third-party financial institutions offer a voluntary supply chain financing (SCF) program which enables our suppliers, at their sole discretion, to sell their receivables from the Company to these financial institutions on terms that are negotiated between the supplier and the respective financial institution. We agree on commercial terms for the goods and services we procure from our suppliers, including prices, quantities and payment terms, regardless of whether the supplier elects to participate in the SCF program. Our suppliers’ voluntary participation in the SCF program has no bearing on our payment terms and we have no economic interest in a supplier’s decision to participate in the SCF program.
Amounts due to our suppliers that elected to participate in the SCF programs are included in Accounts payable on the Consolidated Balance Sheet. At December 31, 2020, Accounts payable included $0.6 billion payable to suppliers who have elected to participate in the SCF program. Amounts settled with third-party financial institutions through the SCF program increased $0.5 billion for the year ended December 31, 2020. The increase for the year ended December 31, 2020 reflects a combination of an extension of payment terms with suppliers and increased utilization of our SCF program. All activity related to amounts due to suppliers that elected to participate in the SCF program is reflected in cash flows from operating activities in our Consolidated Statement of Cash Flows. While access to SCF could decrease if our credit ratings are downgraded, we do not believe that changes in the availability of SCF will have a significant impact on our liquidity. The impact of this program is not material to our overall liquidity.
We sell trade receivables to unaffiliated financial institutions without recourse. Transfers of the receivables are accounted for as sales and, accordingly, receivables sold are excluded from Accounts receivable—net on the Consolidated Balance Sheet and are reflected in cash flows from operating activities on the Consolidated Statement of Cash Flows. The difference between the carrying amount of the trade receivables sold and the cash received is recorded in Cost of products and services sold on the Consolidated Statement of Operations. Amounts settled with third-party financial institutions related to accounts receivable factoring were not material for the year ended December 31, 2020, and the impact of this program is not material to our overall liquidity.
Finally, we continue to assess the relative strength of each business in our portfolio as to strategic fit, market position, profit and cash flow contribution in order to identify target investment and acquisition opportunities in order to upgrade our combined portfolio. We identify acquisition candidates that will further our strategic plan and strengthen our existing core businesses. We also identify businesses that do not fit into our long-term strategic plan based on their market position, relative profitability or growth potential. These businesses are considered for potential divestiture, restructuring or other repositioning actions, subject to regulatory constraints.
Based on past performance and current expectations, we believe that our operating cash flows will be sufficient to meet our future operating cash needs. Our available cash, committed credit lines and access to the public debt and equity markets provide additional sources of short-term and long-term liquidity to fund current operations, debt maturities, and future investment opportunities.
See Note 10 Long-term Debt and Credit Agreements of Notes to Consolidated Financial Statements for additional discussion of items impacting our liquidity.
35 Honeywell International, Inc.
CONTRACTUAL OBLIGATIONS
Following is a summary of our significant contractual obligations and probable liability payments at December 31, 2020:
| Total**(6)(7)** | Payments by Period | Thereafter | |||||||||||||||||||||||||||
| 2021 | 2022 - 2023 | 2024 - 2025 | |||||||||||||||||||||||||||
| Long-term debt, including finance leases(1) | $ | 18,787 | $ | 2,445 | $ | 6,102 | $ | 2,647 | $ | 7,593 | |||||||||||||||||||
| Interest payments on long-term debt, including finance leases | 3,674 | 372 | 624 | 507 | 2,171 | ||||||||||||||||||||||||
| Operating lease liabilities | 913 | 204 | 306 | 172 | 231 | ||||||||||||||||||||||||
| Purchase obligations(2) | 3,595 | 1,374 | 1,204 | 559 | 458 | ||||||||||||||||||||||||
| Estimated environmental liability payments(3) | 660 | 225 | 213 | 181 | 41 | ||||||||||||||||||||||||
| Asbestos related liability payments(4) | 2,220 | 300 | 495 | 397 | 1,028 | ||||||||||||||||||||||||
| Asbestos insurance recoveries(5) | (402) | (36) | (89) | (70) | (207) | ||||||||||||||||||||||||
| $ | 29,447 | $ | 4,884 | $ | 8,855 | $ | 4,393 | $ | 11,315 |
(1)Assumes all long-term debt is outstanding until scheduled maturity.
(2)Purchase obligations are entered into with various vendors in the normal course of business and are consistent with our expected requirements. This includes leases that were entered into and had not yet commenced as of December 31, 2020.
(3)The payment amounts in the table only reflect the environmental liabilities which are probable and reasonably estimable as of December 31, 2020.
(4)These amounts are estimates of asbestos related cash payments for NARCO and Bendix based on our asbestos related liabilities which are probable and reasonably estimable as of December 31, 2020. See Asbestos Matters in Note 20 Commitments and Contingencies of Notes to Consolidated Financial Statements for additional information.
(5)These amounts represent our insurance recoveries that are deemed probable for asbestos related liabilities as of December 31, 2020. See Asbestos Matters in Note 20 Commitments and Contingencies of Notes to Consolidated Financial Statements for additional information.
(6)The table excludes tax liability payments, including those for unrecognized tax benefits. See Note 5 Income Taxes of Notes to Consolidated Financial Statements for additional information.
(7)The table excludes expected proceeds from the indemnification and reimbursement agreements entered into with Garrett and Resideo. See Note 20 Commitments and Contingencies of Notes to Consolidated Financial Statements for additional information.
ASBESTOS MATTERS
Payments, net of insurance recoveries, related to known asbestos matters were $229 million, $163 million and $216 million for the years ended December 31, 2020, 2019 and 2018 and are estimated to be approximately $264 million in 2021. We expect to pay these asbestos matters from operating cash flows. The timing of these payments depends on several factors, including the timing of litigation and settlements of liability claims.
Reimbursements from Garrett primarily for asbestos-related liability payments related to the Bendix business in the U.S., as defined in our indemnification and reimbursement agreement with Garrett, were $36 million in 2020. See Note 20 Commitments and Contingencies of Notes to Consolidated Financial Statements for further discussion of our asbestos matters and Garrett.
36 Honeywell International, Inc.
ENVIRONMENTAL MATTERS
Accruals during the year for environmental matters deemed probable and reasonably estimable were $173 million, $213 million and $395 million for the years ended December 31, 2020, 2019 and 2018. In addition, for the years ended December 31, 2020, 2019 and 2018, we incurred operating costs for ongoing businesses of approximately $88 million, $99 million and $95 million relating to compliance with environmental regulations.
Payments related to known environmental matters were $216 million, $256 million and $218 million for the years ended December 31, 2020, 2019 and 2018 and are estimated to be approximately $225 million in 2021. We expect to pay these environmental matters from operating cash flows. The timing of these payments depends on several factors, including the timing of litigation and settlements of remediation liability, personal injury and property damage claims, regulatory approval of cleanup projects, execution timeframe of projects, remedial techniques to be utilized and agreement with other parties.
Reimbursements from Resideo for payments related to environmental matters at certain sites, as defined in the indemnification and reimbursement agreement, were $140 million in 2020 and are expected to be $140 million in 2021. We received $35 million in reimbursement payments from Resideo in January 2021.
See Note 20 Commitments and Contingencies of Notes to Consolidated Financial Statements for further discussion of our environmental matters and the indemnification and reimbursement agreement entered into with Resideo.
FINANCIAL INSTRUMENTS
The Company uses derivative financial instruments to reduce our risks from interest and foreign currency exchange rate fluctuations. Derivative financial instruments are not used for trading or other speculative purposes and we do not use leveraged derivative financial instruments.
The following table illustrates the potential change in fair value for interest rate sensitive instruments based on a hypothetical immediate one percentage point increase in interest rates across all maturities and the potential change in fair value for foreign exchange rate sensitive instruments based on a 10% weakening of the U.S. Dollar versus local currency exchange rates across all maturities at December 31, 2020 and 2019.
| Face or Notional Amount | Carrying Value**(1)** | Fair Value**(1)** | Estimated Increase (Decrease) in Fair Value**(2)** | ||||||||||||||||||||
| December 31, 2020 | |||||||||||||||||||||||
| Interest Rate Sensitive Instruments | |||||||||||||||||||||||
| Long-term debt (including current maturities) | $ | 18,787 | $ | (18,787) | $ | (20,176) | $ | (1,063) | |||||||||||||||
| Interest rate swap agreements | 3,950 | 194 | 194 | (148) | |||||||||||||||||||
| Foreign Exchange Rate Sensitive Instruments | |||||||||||||||||||||||
| Foreign currency exchange contracts(3) | 16,123 | 52 | 52 | (334) | |||||||||||||||||||
| Cross currency swap agreements | 1,200 | (50) | (50) | (125) | |||||||||||||||||||
| December 31, 2019 | |||||||||||||||||||||||
| Interest Rate Sensitive Instruments | |||||||||||||||||||||||
| Long-term debt (including current maturities) | $ | 12,486 | $ | (12,486) | $ | (13,578) | $ | (677) | |||||||||||||||
| Interest rate swap agreements | 3,950 | 25 | 25 | (72) | |||||||||||||||||||
| Foreign Exchange Rate Sensitive Instruments | |||||||||||||||||||||||
| Foreign currency exchange contracts(3) | 12,746 | 270 | 270 | (676) | |||||||||||||||||||
| Cross currency swap agreements | 1,200 | 51 | 51 | (115) |
(1)Asset or (liability).
(2)A hypothetical immediate one percentage point decrease in interest rates across all maturities and a potential change in fair value of foreign exchange rate sensitive instruments based on a 10% strengthening of the U.S. dollar versus local currency exchange rates across all maturities will result in a change in fair value approximately equal to the inverse of the amount disclosed in the table.
(3)Changes in the fair value of foreign currency exchange contracts are offset by changes in the fair value, cash flows, or net investments of underlying hedged foreign currency transactions or foreign operations.
37 Honeywell International, Inc.
See Note 12 Derivative Instruments and Hedging Transactions to Consolidated Financial Statements for further discussion.
CRITICAL ACCOUNTING ESTIMATES
The preparation of our consolidated financial statements in accordance with generally accepted accounting principles is based on the selection and application of accounting policies that require us to make significant estimates and assumptions about the effects of matters that are inherently uncertain. Many estimates and assumptions involved in the application of accounting principles have a material impact on reported financial condition and operating performance and on the comparability of such reported information over different reporting periods. Critical accounting estimates or assumptions are those where the nature of the estimates or assumptions is material due to the levels of subjectivity and judgment necessary to account for highly uncertain matters or the susceptibility of such matters to change, and the impact of the estimates and assumptions on financial condition or operating performance is material. We consider the estimates and assumptions discussed below to be critical to the understanding of our financial statements. Actual results could differ from our estimates and assumptions, and any such differences could be material to our consolidated financial statements.
Sales Recognition on Long-Term Contracts—We recognize sales for long-term contracts with performance obligations satisfied over time using either an input or output method. We recognize revenue over time as we perform on these contracts based on the continuous transfer of control to the customer. With control transferring over time, revenue is recognized based on the extent of progress towards completion of the performance obligation. We generally use the cost-to-cost input method of progress for our contracts because it best depicts the transfer of control to the customer that occurs as we incur costs. Under the cost-to-cost method, the extent of progress towards completion is measured based on the proportion of costs incurred to date to the total estimated costs at completion of the performance obligation. Due to the nature of the work required to be performed on many of our performance obligations, the estimation of total revenue and cost at completion requires judgment. Contract revenues are largely determined by negotiated contract prices and quantities, modified by our assumptions regarding contract options, change orders, incentive and award provisions associated with technical performance and price adjustment clauses (such as inflation or index-based clauses). Cost estimates are largely based on negotiated or estimated purchase contract terms, historical performance trends and other economic projections. Significant factors that influence these estimates include inflationary trends, technical and schedule risk, internal and subcontractor performance trends, business volume assumptions, asset utilization, and anticipated labor agreements. Revenue and cost estimates are regularly monitored and revised based on changes in circumstances. Impacts from changes in estimates of net sales and cost of sales are recognized on a cumulative catch-up basis, which recognizes in the current period the cumulative effect of the changes on current and prior periods based on a performance obligation’s percentage of completion. Anticipated losses on long-term contracts are recognized when such losses become evident. We maintain financial controls over the customer qualification, contract pricing and estimation processes to reduce the risk of contract losses.
Income Taxes—On a recurring basis, we assess the need for a valuation allowance against our deferred tax assets by considering all available positive and negative evidence, such as past operating results, projections of future taxable income, enacted tax law changes and the feasibility and impact of tax planning initiatives. Our projections of future taxable income include a number of estimates and assumptions regarding our volume, pricing and costs, as well as the timing and amount of reversals of taxable temporary differences.
We recognize tax benefits from uncertain tax positions only if it is more likely than not that the tax position will be sustained on examination by the taxing authorities, including resolution of any related appeals and litigation. We assess our income tax positions based upon our evaluation of the facts, circumstances and information available at the reporting date. The tax benefits recognized in the financial statements from such positions are then measured based on the largest benefit that has a greater than 50% likelihood of being realized upon ultimate settlement with a taxing authority that has full knowledge of all relevant information. For those income tax positions where it is not more likely than not that a tax benefit will be sustained, no tax benefit has been recognized in the financial statements.
For further discussion of additional income tax policies, see Note 1 Summary of Significant Accounting Policies of Notes to Consolidated Financial Statements.
38 Honeywell International, Inc.
Reimbursement Receivables—In conjunction with the Garrett and Resideo spin-offs, the Company entered into reimbursement agreements under which Honeywell receives cash payments as reimbursement primarily for asbestos related liability payments related to the Bendix business in the U.S. (Garrett) and for net spending for environmental matters at certain sites as defined in the agreement (Resideo). Accordingly, the Company recorded receivables based on estimates of the underlying reimbursable Honeywell asbestos and environmental spend, and we monitor the recoverability of such receivables, which are subject to the terms of applicable credit agreements and general ability to pay. For Garrett, the Company established an allowance based on the developments associated with Garrett's Chapter 11 bankruptcy filing. See Note 20 Commitments and Contingencies of Notes to Consolidated Financial Statements for a discussion of the recognition and measurement of our reimbursement receivables, including the allowance established for Garrett.
Goodwill and Indefinite-Lived Intangible Assets Impairment Testing—Goodwill and intangible assets deemed to have indefinite lives are not amortized, but are subject to annual, or more frequent if necessary, impairment testing. In testing goodwill and indefinite-lived intangible assets, the fair value is estimated utilizing a discounted cash flow approach utilizing cash flow forecasts, including strategic and annual operating plans, adjusted for terminal value assumptions. These impairment tests involve the use of accounting estimates and assumptions, changes in which could materially impact our financial condition or operating performance if actual results differ from such estimates and assumptions. To address this uncertainty, we perform sensitivity analyses on key estimates and assumptions. Once the fair value is determined, if the carrying amount exceeds the fair value, it is impaired. Any impairment is measured as the difference between the carrying amount and its fair value.
Finite-Lived Intangible Assets—The determination of useful lives (for depreciation/amortization purposes) and whether or not intangible assets are impaired involves the use of accounting estimates and assumptions, changes in which could materially impact our financial condition or operating performance if actual results differ from such estimates and assumptions. We evaluate the recoverability of the carrying amount of our finite-lived intangible assets whenever events or changes in circumstances indicate that the carrying amount of a finite-lived intangible asset group may not be fully recoverable. The principal factors in considering when to perform an impairment review are as follows:
-
Significant under-performance (i.e., declines in sales, earnings or cash flows) of a business or product line in relation to expectations;
-
Annual operating plans or strategic plan outlook that indicate an unfavorable trend in operating performance of a business or product line;
-
Significant negative industry or economic trends; or
-
Significant changes or planned changes in our use of the assets.
Once it is determined that an impairment review is necessary, recoverability of assets is measured by comparing the carrying amount of the asset grouping to the estimated future undiscounted cash flows. If the carrying amount exceeds the estimated future undiscounted cash flows, the asset grouping is considered to be impaired. The impairment is then measured as the difference between the carrying amount of the asset grouping and its fair value. We endeavor to utilize the best information available to measure fair value, which is usually either market prices (if available), level 1 or level 2 of the fair value hierarchy, or an estimate of the future discounted cash flow, level 3 of the fair value hierarchy. The key estimates in our discounted cash flow analysis include assumptions as to expected industry and business growth rates, sales volume, selling prices and costs, cash flows, and the discount rate selected. These estimates are subject to changes in the economic environment, including market interest rates and expected volatility. Management believes the estimates of future cash flows and fair values are reasonable; however, changes in estimates due to variance from assumptions could materially affect the valuations.
Defined Benefit Pension Plans—We sponsor both funded and unfunded U.S. and non-U.S. defined benefit pension plans. For financial reporting purposes, net periodic pension (income) expense is calculated annually based upon various actuarial assumptions, including a discount rate for plan obligations and an expected long-term rate of return on plan assets. Changes in the discount rate and expected long-term rate of return on plan assets could materially affect the annual pension (income) expense amount. Annual pension (income) expense is comprised of service and interest cost, assumed return on plan assets, prior service amortization (Pension Ongoing (Income) Expense) and a potential mark-to-market adjustment (MTM Adjustment).
39 Honeywell International, Inc.
The key assumptions used in developing our net periodic pension (income) expense for our U.S. plans included the following:
| 2020 | 2019 | 2018 | |||||||||||||||
| Discount Rate: | |||||||||||||||||
| Projected benefit obligation | 3.22 | % | 4.35 | % | 3.68 | % | |||||||||||
| Service cost | 3.33 | % | 4.47 | % | 3.77 | % | |||||||||||
| Interest cost | 2.76 | % | 3.94 | % | 3.27 | % | |||||||||||
| Assets: | |||||||||||||||||
| Expected rate of return | 6.15 | % | 6.75 | % | 7.75 | % | |||||||||||
| Actual rate of return | 13.8 | % | 21.2 | % | (1.8) | % | |||||||||||
| Actual 10 year average annual compounded rate of return | 10.6 | % | 11.1 | % | 11.0 | % |
The MTM Adjustment represents the recognition of net actuarial gains or losses in excess of 10% of the greater of the fair value of plan assets or the plans’ projected benefit obligation (the corridor). Net actuarial gains and losses occur when the actual experience differs from any of the various assumptions used to value our pension plans or when assumptions change. The primary factors contributing to actuarial gains and losses are changes in the discount rate used to value pension obligations as of the measurement date each year and the difference between expected and actual returns on plan assets. The mark-to-market accounting method results in the potential for volatile and difficult to forecast MTM Adjustments. MTM Adjustments were $44 million, $123 million and $37 million for the years ended December 31, 2020, 2019 and 2018.
We determine the expected long-term rate of return on plan assets utilizing historical plan asset returns over varying long-term periods combined with our expectations of future market conditions and asset mix considerations (see Note 21 Pension and Other Postretirement Benefits of Notes to Consolidated Financial Statements for details on the actual various asset classes and targeted asset allocation percentages for our pension plans). We plan to use an expected rate of return on plan assets of 6.15% for 2021, matching the assumption used for 2020.
The discount rate reflects the market rate on December 31 (measurement date) for high-quality fixed-income investments with maturities corresponding to our benefit obligations and is subject to change each year. The discount rate can be volatile from year to year as it is determined based upon prevailing interest rates as of the measurement date. We used a 2.50% discount rate to determine benefit obligations as of December 31, 2020, reflecting a decrease in the market interest rate environment since the prior year-end.
In addition to the potential for MTM Adjustments, changes in our expected rate of return on plan assets and discount rate resulting from economic events also affects future pension ongoing (income) expense. The following table highlights the sensitivity of our U.S. pension obligations and ongoing (income) expense to changes in these assumptions, assuming all other assumptions remain constant. These estimates exclude any potential MTM Adjustment:
| Change in Assumption | Impact on 2021 Pension Ongoing Expense | Impact on PBO | |||||||||
| 0.25 percentage point decrease in discount rate | Decrease $32 million | Increase $520 million | |||||||||
| 0.25 percentage point increase in discount rate | Increase $30 million | Decrease $500 million | |||||||||
| 0.25 percentage point decrease in expected rate of return on assets | Increase $50 million | — | |||||||||
| 0.25 percentage point increase in expected rate of return on assets | Decrease $50 million | — |
Pension ongoing income for our world-wide pension plans is expected to be approximately $1,046 million in 2021 compared with pension ongoing income of $785 million in 2020. The expected increase in pension income is primarily due to higher expected return on plan assets due to strong asset returns in our U.S. and UK plans in 2020, and lower interest cost from a decrease in discount rates in our U.S. and UK plans. Also, if required, a MTM Adjustment will be recorded in the fourth quarter of 2021 in accordance with our pension accounting method as previously described. It is difficult to reliably forecast or predict whether there will be a MTM Adjustment in 2021, and if one is required, what the magnitude of such adjustment will be. MTM Adjustments are primarily driven by events and circumstances beyond the control of the Company such as changes in interest rates and the performance of the financial markets.
40 Honeywell International, Inc.
Asbestos Related Liabilities and Insurance Recoveries—In connection with the recognition of liabilities for asbestos related matters, we record asbestos related insurance recoveries that are deemed probable. In assessing the probability of insurance recovery, we make judgments concerning insurance coverage that we believe are reasonable and consistent with our historical dealings and our knowledge of any pertinent solvency issues surrounding insurers. While the substantial majority of our insurance carriers are solvent, some of our individual carriers are insolvent, which has been considered in our analysis of probable recoveries. Projecting future events is subject to various uncertainties that could cause the insurance recovery on asbestos related liabilities to be higher or lower than that projected and recorded. Given the inherent uncertainty in making future projections, we reevaluate our projections concerning our probable insurance recoveries considering any changes to the projected liability, our recovery experience or other relevant factors that may impact future insurance recoveries.
Our involvement in asbestos related personal injury actions relates to two predecessor companies. Regarding North American Refractories Company (NARCO) asbestos related claims, we estimate our NARCO asbestos liability for the resolution of asserted Narco-related asbestos claims which qualify for payment under the NARCO Trust Distribution Procedures (Annual Contribution Claims) and for amounts owed pursuant to settlement agreements reached during the pendency of the NARCO bankruptcy proceedings that provide for the right to submit claims to the NARCO Trust subject to qualification under the terms of the settlement agreements and Trust Distribution Procedures (Pre-Established Unliquidated Claims) using average payment values for the relevant historical period. We estimate our NARCO asbestos liability for unasserted claims based on historic and anticipated claims filing experience and payment rates, disease classifications and type of claim, and average payment values by the NARCO Trust for the relevant historical period. Our estimate also includes all years of epidemiological disease projection through 2059. Regarding Bendix Friction Materials (Bendix) asbestos related claims, we accrued for the estimated value of pending claims using average resolution values for the previous five years. We also accrued for the estimated value of future claims related to Bendix over the full term of epidemiological disease projection through 2059 based on historic and anticipated claims filing experience and dismissal rates, disease classifications, and average resolution values in the tort system for the previous five years. We update our assumptions on average payment values and average resolution values in the fourth quarter of each year.
See Note 20 Commitments and Contingencies of Notes to Consolidated Financial Statements for a discussion of management’s judgments applied in the recognition and measurement of our asbestos related liabilities and related insurance recoveries.
Contingent Liabilities—We are subject to a number of lawsuits, investigations and claims (some of which involve substantial dollar amounts) that arise out of the conduct of our global business operations or those of previously owned entities, including matters relating to commercial transactions, government contracts, product liability (including asbestos), prior acquisitions and divestitures, employee benefit plans, intellectual property, legal and environmental, health and safety matters. We continually assess the likelihood of any adverse judgments or outcomes to our contingencies, as well as potential amounts or ranges of probable losses, and recognize a liability, if any, for these contingencies based on a thorough analysis of each matter with the assistance of outside legal counsel and, if applicable, other experts. Such analysis includes making judgments concerning matters such as the costs associated with environmental matters, the outcome of negotiations, the number and cost of pending and future asbestos claims, and the impact of evidentiary requirements. Because most contingencies are resolved over long periods of time, liabilities may change in the future due to new developments (including new discovery of facts, changes in legislation and outcomes of similar cases through the judicial system), changes in assumptions or changes in our settlement strategy. See Note 20 Commitments and Contingencies of Notes to Consolidated Financial Statements for a discussion of management’s judgment applied in the recognition and measurement of our environmental and asbestos liabilities which represent our most significant contingencies.
OTHER MATTERS
LITIGATION
See Note 20 Commitments and Contingencies of Notes to Consolidated Financial Statements for a discussion of environmental, asbestos and other litigation matters.
RECENT ACCOUNTING PRONOUNCEMENTS
See Note 1 Summary of Significant Accounting Policies of Notes to Consolidated Financial Statements for a discussion of recent accounting pronouncements.
41 Honeywell International, Inc.
INFORMATION ABOUT OUR EXECUTIVE OFFICERS
The executive officers of Honeywell, listed as follows, are elected annually by the Board of Directors. There are no family relationships among them.
| Name, Age, Year First Elected an Executive Officer | Business Experience | |||||||
| Darius Adamczyk, 55 2017(a) | Chairman of the Board and Chief Executive Officer since April 2018. President and Chief Executive Officer from April 2017 to April 2018. Chief Operating Officer from April 2016 to March 2017. President and Chief Executive Officer Performance Materials and Technologies from April 2014 to April 2016. President of Honeywell Process Solutions from April 2012 to April 2014. | |||||||
| Que Thanh Dallara, 47 2018 | President and Chief Executive Officer, Connected Enterprise since October 2018. Vice President and Chief Commercial Officer from January 2017 to October 2018. From 2007 to 2016, Ms. Dallara served in multiple leadership positions at TE Connectivity Ltd., most recently as Senior Vice President, Corporate Strategy and Analytics. | |||||||
| Rajeev Gautam, 68 2016 | President and Chief Executive Officer, Performance Materials and Technologies since April 2016. President of Honeywell UOP from January 2009 to April 2016. | |||||||
| Vimal Kapur, 55 2018 | President and Chief Executive Officer, Honeywell Building Technologies since May 2018. President of Honeywell Process Solutions from 2014 to May 2018. | |||||||
| Gregory P. Lewis, 53 2018 | Senior Vice President and Chief Financial Officer since August 2018. Vice President of Enterprise Information Management from October 2016 to April 2018, prior to being named Vice President, Corporate Finance in May 2018. Chief Financial Officer of Automation and Control Solutions from April 2013 to September 2016. | |||||||
| Anne T. Madden, 56 2017 | Senior Vice President and General Counsel since October 2017. Corporate Secretary from February 2018 to September 2019. Vice President of Corporate Development and Global Head of M&A from January 2002 to October 2017. | |||||||
| Michael R. Madsen, 57 2019 | President and Chief Executive Officer, Aerospace since October 2019. Vice President, Integrated Supply Chain of Aerospace from May 2015 to October 2019. President, Aerospace Defense and Space from October 2010 to May 2015. | |||||||
| Karen Mattimore, 54 2020 | Senior Vice President and Chief Human Resources Officer since June 2020. Vice President, Human Resources and Communications, Aerospace from February 2018 to June 2020. Vice President, Human Resources Services from April 2015 to February 2018. | |||||||
| John F. Waldron, 45 2016 | President and Chief Executive Officer, Safety and Productivity Solutions since July 2016. President of Sensing and Productivity Solutions from July 2015 to July 2016. President of Scanning and Mobility from April 2012 to July 2015. |
(a)Also a Director.
42 Honeywell International, Inc.
Item 1B. Unresolved Staff Comments
UNRESOLVED STAFF COMMENTS
None.
Item 2. Properties
PROPERTIES
We have approximately 834 locations, of which 226 are manufacturing sites. Our properties and equipment are in good operating condition and are adequate for our present needs. We do not anticipate difficulty in renewing existing leases as they expire or in finding alternative facilities.
Item 3. Legal Proceedings
LEGAL PROCEEDINGS
We are subject to a number of lawsuits, investigations and claims (some of which involve substantial amounts) arising out of the conduct of our business. See a discussion of environmental, asbestos and other litigation matters in Note 20 Commitments and Contingencies of Notes to Consolidated Financial Statements.
There were no matters requiring disclosure pursuant to the requirement to disclose certain environmental matters involving potential monetary sanctions in excess of $300,000.
Item 4. Mine Safety Disclosures
MINE SAFETY DISCLOSURES
One of our wholly-owned subsidiaries has a placer claim for and operates a chabazite ore surface mine in Arizona. Information concerning mine safety and other regulatory matters associated with this mine is required by Section 1503(a) of the Dodd-Frank Wall Street Reform and Consumer Protection Act and Item 104 of Regulation S-K and is included in Exhibit 95 to this Form 10-K.
43 Honeywell International, Inc.
Item 5. Market for Registrant’s Common Equity, Related Stockholder Matters and Issuer Purchases of Equity Securities
MARKET FOR REGISTRANT'S COMMON EQUITY, RELATED STOCKHOLDER MATTERS AND ISSUER PURCHASES OF EQUITY SECURITIES
Our common stock is listed on the New York Stock Exchange under the ticker symbol “HON”. Dividend information for Honeywell’s common stock is included in Note 26 Unaudited Quarterly Financial Information of Notes to Consolidated Financial Statements. We increased our quarterly dividend rate by 3% to $0.93 per share of common stock effective with the fourth quarter 2020 dividend. We intend to continue to pay quarterly dividends in 2021.
The number of record holders of our common stock at December 31, 2020 was 42,205.
Information regarding securities authorized for issuance under equity compensation plans is included the section titled Security Ownership of Certain Beneficial Owners and Management and Related Stockholder Matters under the caption “Equity Compensation Plans.”
We purchased 7,619,919 shares of our common stock, par value $1 per share, in the quarter ending December 31, 2020. On April 29, 2019, the Board of Directors authorized the repurchase of up to a total of $10 billion of Honeywell common stock, which included amounts remaining under, and replaced, the previously approved share repurchase program. As of December 31, 2020, $3.3 billion remained available for additional share repurchases. We expect to repurchase outstanding shares from time to time to generally offset the dilutive impact of employee stock-based compensation plans, including option exercises, restricted unit vesting and matching contributions under our savings plans. Additionally, we seek to reduce share count via share repurchases as and when attractive opportunities arise. The amount and timing of future repurchases may vary depending on market conditions and the level of our operating, financing and other investing activities.
The following table summarizes our purchases of Honeywell's common stock for the three months ended December 31, 2020:
| Issuer Purchases of Equity Securities | ||||||||||||||||||||||||||
| Period | Total Number of Shares Purchased | Average Price Paid per Share | Total Number of Shares Purchased as Part of Publicly Announced Plans or Programs | Approximate Dollar Value of Shares that May Yet be Purchased Under Plans or Programs (Dollars in millions) | ||||||||||||||||||||||
| October 1 - 31, 2020 | — | $ | — | — | $ | 4,841 | ||||||||||||||||||||
| November 1 - 30, 2020 | 2,430,000 | $ | 198.09 | 2,430,000 | $ | 4,360 | ||||||||||||||||||||
| December 1 - 31, 2020 | 5,189,919 | $ | 208.96 | 5,189,919 | $ | 3,275 |
44 Honeywell International, Inc.
PERFORMANCE GRAPH
The following graph compares the five-year cumulative total return on our common stock to the total returns on the Standard & Poor’s (S&P) 500 Stock Index and a composite of S&P’s Industrial Conglomerates and Aerospace and Defense indices, on a 55%/45% weighted basis (the Composite Index). The weighting of the components of the Composite Index are based on our segments’ relative contribution to total segment profit. The selection of the Industrial Conglomerates component of the Composite Index reflects the diverse and distinct range of non-aerospace businesses conducted by Honeywell. The annual changes for the five-year period shown in the graph are based on the assumption that $100 was invested in Honeywell stock and each index on December 31, 2015 and that all dividends were reinvested.

| Dec. 2015 | Dec. 2016 | Dec. 2017 | Dec. 2018 | Dec. 2019 | Dec. 2020 | |||||||||||||||||||||||||||||||||
| Honeywell | 100 | 114.98 | 155.34 | 142.57 | 194.89 | 239.66 | ||||||||||||||||||||||||||||||||
| S&P 500 Index | 100 | 111.96 | 136.40 | 130.42 | 171.49 | 203.04 | ||||||||||||||||||||||||||||||||
| Composite Index | 100 | 113.33 | 129.15 | 105.37 | 134.31 | 132.19 |
45 Honeywell International, Inc.
Item 8. Financial Statements and Supplementary Data
FINANCIAL STATEMENTS AND SUPPLEMENTARY DATA
HONEYWELL INTERNATIONAL INC.
CONSOLIDATED STATEMENT OF OPERATIONS
| Years Ended December 31, | |||||||||||||||||
| 2020 | 2019 | 2018 | |||||||||||||||
| (Dollars in millions, except per share amounts) | |||||||||||||||||
| Product sales | $ | 24,737 | $ | 27,629 | $ | 32,848 | |||||||||||
| Service sales | 7,900 | 9,080 | 8,954 | ||||||||||||||
| Net sales | 32,637 | 36,709 | 41,802 | ||||||||||||||
| Costs, expenses and other | |||||||||||||||||
| Cost of products sold | 17,638 | 19,269 | 23,634 | ||||||||||||||
| Cost of services sold | 4,531 | 5,070 | 5,412 | ||||||||||||||
| 22,169 | 24,339 | 29,046 | |||||||||||||||
| Selling, general and administrative expenses | 4,772 | 5,519 | 6,051 | ||||||||||||||
| Other (income) expense | (675) | (1,065) | (1,149) | ||||||||||||||
| Interest and other financial charges | 359 | 357 | 367 | ||||||||||||||
| 26,625 | 29,150 | 34,315 | |||||||||||||||
| Income before taxes | 6,012 | 7,559 | 7,487 | ||||||||||||||
| Tax expense | 1,147 | 1,329 | 659 | ||||||||||||||
| Net income | 4,865 | 6,230 | 6,828 | ||||||||||||||
| Less: Net income attributable to the noncontrolling interest | 86 | 87 | 63 | ||||||||||||||
| Net income attributable to Honeywell | $ | 4,779 | $ | 6,143 | $ | 6,765 | |||||||||||
| Earnings per share of common stock—basic | $ | 6.79 | $ | 8.52 | $ | 9.10 | |||||||||||
| Earnings per share of common stock—assuming dilution | $ | 6.72 | $ | 8.41 | $ | 8.98 |
The Notes to Consolidated Financial Statements are an integral part of this statement.
46 Honeywell International, Inc.
HONEYWELL INTERNATIONAL INC.
CONSOLIDATED STATEMENT OF COMPREHENSIVE INCOME
| Years Ended December 31, | |||||||||||||||||
| 2020 | 2019 | 2018 | |||||||||||||||
| (Dollars in millions) | |||||||||||||||||
| Net income | $ | 4,865 | $ | 6,230 | $ | 6,828 | |||||||||||
| Other comprehensive income (loss), net of tax | |||||||||||||||||
| Foreign exchange translation adjustment | (211) | 143 | (685) | ||||||||||||||
| Actuarial gains (losses) recognized | 91 | 162 | (602) | ||||||||||||||
| Prior service credit (cost) recognized | 47 | 1 | 2 | ||||||||||||||
| Prior service credit recognized during year | (82) | (79) | (74) | ||||||||||||||
| Actuarial (gains) losses recognized during year | 41 | 16 | 35 | ||||||||||||||
| Settlements and curtailments | — | — | 2 | ||||||||||||||
| Foreign exchange translation and other | (23) | (14) | 31 | ||||||||||||||
| Pensions and other postretirement benefit adjustments | 74 | 86 | (606) | ||||||||||||||
| Changes in fair value of available for sale investments | 4 | — | — | ||||||||||||||
| Cash flow hedges recognized in other comprehensive income | 10 | 103 | 89 | ||||||||||||||
| Less: Reclassification adjustment for gains (losses) included in net income | 54 | 92 | 4 | ||||||||||||||
| Changes in fair value of cash flow hedges | (44) | 11 | 85 | ||||||||||||||
| Other comprehensive income (loss), net of tax | (177) | 240 | (1,206) | ||||||||||||||
| Comprehensive income | 4,688 | 6,470 | 5,622 | ||||||||||||||
| Less: Comprehensive income attributable to the noncontrolling interest | 89 | 82 | 53 | ||||||||||||||
| Comprehensive income attributable to Honeywell | $ | 4,599 | $ | 6,388 | $ | 5,569 |
The Notes to Consolidated Financial Statements are an integral part of this statement.
47 Honeywell International, Inc.
HONEYWELL INTERNATIONAL INC.
CONSOLIDATED BALANCE SHEET
| December 31, | |||||||||||
| 2020 | 2019 | ||||||||||
| (Dollars in millions) | |||||||||||
| ASSETS | |||||||||||
| Current assets: | |||||||||||
| Cash and cash equivalents | $ | 14,275 | $ | 9,067 | |||||||
| Short-term investments | 945 | 1,349 | |||||||||
| Accounts receivable—net | 6,827 | 7,493 | |||||||||
| Inventories | 4,489 | 4,421 | |||||||||
| Other current assets | 1,639 | 1,973 | |||||||||
| Total current assets | 28,175 | 24,303 | |||||||||
| Investments and long-term receivables | 685 | 588 | |||||||||
| Property, plant and equipment—net | 5,570 | 5,325 | |||||||||
| Goodwill | 16,058 | 15,563 | |||||||||
| Other intangible assets—net | 3,560 | 3,734 | |||||||||
| Insurance recoveries for asbestos related liabilities | 366 | 392 | |||||||||
| Deferred income taxes | 760 | 86 | |||||||||
| Other assets | 9,412 | 8,688 | |||||||||
| Total assets | $ | 64,586 | $ | 58,679 | |||||||
| LIABILITIES | |||||||||||
| Current liabilities: | |||||||||||
| Accounts payable | $ | 5,750 | $ | 5,730 | |||||||
| Commercial paper and other short-term borrowings | 3,597 | 3,516 | |||||||||
| Current maturities of long-term debt | 2,445 | 1,376 | |||||||||
| Accrued liabilities | 7,405 | 7,476 | |||||||||
| Total current liabilities | 19,197 | 18,098 | |||||||||
| Long-term debt | 16,342 | 11,110 | |||||||||
| Deferred income taxes | 2,113 | 1,670 | |||||||||
| Postretirement benefit obligations other than pensions | 242 | 326 | |||||||||
| Asbestos related liabilities | 1,920 | 1,996 | |||||||||
| Other liabilities | 6,975 | 6,766 | |||||||||
| Redeemable noncontrolling interest | 7 | 7 | |||||||||
| SHAREOWNERS’ EQUITY | |||||||||||
| Capital—common stock issued | 958 | 958 | |||||||||
| —additional paid-in capital | 7,292 | 6,876 | |||||||||
| Common stock held in treasury, at cost | (27,229) | (23,836) | |||||||||
| Accumulated other comprehensive income (loss) | (3,377) | (3,197) | |||||||||
| Retained earnings | 39,905 | 37,693 | |||||||||
| Total Honeywell shareowners’ equity | 17,549 | 18,494 | |||||||||
| Noncontrolling interest | 241 | 212 | |||||||||
| Total shareowners’ equity |
Showing the first 8K of 277K characters. Open the full section
Item 9. Changes in and Disagreements with Accountants on Accounting and Financial Disclosure
CHANGES IN AND DISAGREEMENTS WITH ACCOUNTANTS ON ACCOUNTING AND FINANCIAL DISCLOSURE
Not Applicable.
Item 9A. Controls and Procedures
CONTROLS AND PROCEDURES
Honeywell management maintains disclosure controls and procedures designed to provide reasonable assurance that information required to be disclosed in reports filed under the Exchange Act is recorded, processed, summarized and reported within the specified time periods and accumulated and communicated to our management, including our principal executive officer and principal financial officer, as appropriate to allow timely decisions regarding required disclosure. There have been no changes that have materially affected, or are reasonably likely to materially affect, Honeywell’s internal control over financial reporting that have occurred during the quarter ended December 31, 2020.
Our management, with the participation of our CEO and CFO, evaluated the effectiveness of our disclosure controls and procedures (as defined in Rules 13a-15(e) or 15d-15(e) promulgated under the Exchange Act) as of December 31, 2020. Based on these evaluations, our CEO and CFO concluded that our disclosure controls and procedures were effective as of December 31, 2020.
MANAGEMENT'S REPORT ON INTERNAL CONTROL OVER FINANCIAL REPORTING
Honeywell management is responsible for establishing and maintaining adequate internal control over financial reporting and for its assessment of the effectiveness of internal control over financial reporting as defined in Rules 13a-15(f) or 15d-15(f) under the Exchange Act. Honeywell’s internal control over financial reporting is a process designed to provide reasonable assurance to our management and board of directors regarding the reliability of financial reporting and the preparation of financial statements for external purposes in accordance with generally accepted accounting principles.
Because of its inherent limitations, internal control over financial reporting may not prevent or detect misstatements.
Management assessed the effectiveness of Honeywell’s internal control over financial reporting as of December 31, 2020. In making this assessment, management used the criteria set forth by the Committee of Sponsoring Organizations of the Treadway Commission (COSO) in Internal Control—Integrated Framework (2013).
We have not experienced any material impact to our internal control over financial reporting during the COVID-19 pandemic. Most of our employees worked remotely during the year in which we prepared these financial statements due to the impact of COVID-19. We enhanced our oversight and monitoring during the close and reporting process, including investments in expanded VPN capabilities and higher scrutiny and monitoring of cybersecurity threats. Other than enhancing our oversight and monitoring processes, we did not alter or compromise our disclosure controls and procedures. We are continually monitoring and assessing the need to modify or enhance our disclosure controls to ensure disclosure controls and procedures continue to be effective.
Based on this assessment, management determined that Honeywell maintained effective internal control over financial reporting as of December 31, 2020. In conducting management's evaluation as described above, Rocky Research acquired October 7, 2020, and Sine Group acquired December 14, 2020, were excluded. The operations of Rocky Research and Sine Group, excluded from management's assessment of internal control over financial reporting, collectively represent less than 0.1% of the Company's total revenues and approximately 0.5% of total assets as of December 31, 2020.
The effectiveness of Honeywell’s internal control over financial reporting as of December 31, 2020 has been audited by Deloitte & Touche LLP, an independent registered public accounting firm, as stated in their report which is included in the section titled Financial Statements and Supplementary Data.
Item 9B. Other Information
OTHER INFORMATION
Not Applicable.
114 Honeywell International, Inc.
Item 10. Directors, Executive Officers and Corporate Governance
DIRECTORS, EXECUTIVE OFFICERS AND CORPORATE GOVERNANCE
Information relating to the Directors of Honeywell, as well as information relating to compliance with Section 16(a) of the Securities Exchange Act of 1934, will be contained in the Proxy Statement, which will be filed with the SEC pursuant to Regulation 14A not later than 120 days after December 31, 2020, and such information is incorporated herein by reference. Certain information relating to the Executive Officers of Honeywell appears in this Form 10-K under the heading titled Information about our Executive Officers.
The members of the Audit Committee of our Board of Directors are: George Paz (Chair), Kevin Burke, D. Scott Davis, Linnet F. Deily, Judd A. Gregg and Robin L. Washington. The Board has determined that Mr. Paz, Mr. Davis and Ms. Washington are audit committee financial experts as defined by applicable SEC rules and that Mr. Paz, Mr. Burke, Mr. Davis, Ms. Deily and Ms. Washington satisfy the accounting or related financial management expertise criteria established by the NYSE. All members of the Audit Committee are independent as that term is defined in applicable SEC rules and NYSE listing standards.
Honeywell’s corporate governance policies and procedures, including the Code of Business Conduct, Corporate Governance Guidelines and Charters of the Committees of the Board of Directors are available, free of charge, on our website (honeywell.com) under the heading Investors (see Corporate Governance), or by writing to Honeywell, 300 South Tryon Street, Charlotte, North Carolina 28202, c/o Vice President and Corporate Secretary. Honeywell’s Code of Business Conduct applies to all Honeywell directors, officers (including the Chief Executive Officer, Chief Financial Officer and Controller) and employees. Amendments to or waivers of the Code of Business Conduct granted to any of Honeywell’s directors or executive officers will be published on our website within four business days of such amendment or waiver.
Item 11. Executive Compensation
EXECUTIVE COMPENSATION
Information relating to executive compensation will be contained in the Proxy Statement, and such information is incorporated herein by reference.
Item 12. Security Ownership of Certain Beneficial Owners and Management and Related Stockholder Matters
SECURITY OWNERSHIP OF CERTAIN BENEFICIAL OWNERS AND MANAGEMENT AND RELATED STOCKHOLDER MATTERS
Information relating to security ownership of certain beneficial owners and management and related stockholder matters will be contained in the Proxy Statement, and such information is incorporated herein by reference.
EQUITY COMPENSATION PLANS
As of December 31, 2020, information about our equity compensation plans is as follows:
| Plan category | Number of Securities to be Issued Upon Exercise of Outstanding Options, Warrants and Rights | Weighted-Average Exercise Price of Outstanding Options, Warrants and Rights | Number of Securities Remaining Available for Future Issuance Under Equity Compensation Plans (Excluding Securities Reflected in Column (a)) | ||||||||||||||||||||||||||||||||
| (a) | (b) | (c) | |||||||||||||||||||||||||||||||||
| Equity compensation plans approved by security holders | 20,223,330 | (1) | $ | 125.60 | (2) | 36,673,110 | (3) | ||||||||||||||||||||||||||||
| Equity compensation plans not approved by security holders | 261,718 | (4) | N/A | (5) | N/A | (6) | |||||||||||||||||||||||||||||
| Total | 20,485,048 | $ | 125.60 | 36,673,110 |
(1)Equity compensation plans approved by shareowners which are included in column (a) of the table are the 2016 Stock Incentive Plan, the 2011 Stock Incentive Plan, and the 2006 Stock Incentive Plan (including 16,344,101 shares of Common Stock to be issued for options; 2,984,711 RSUs subject to continued employment; 196,542 RSUs at target level and subject to Company performance metrics and continued employment; and 471,395 deferred RSUs); and the 2016 Stock Plan for Non-Employee Directors and the 2006 Stock Plan for Non-
115 Honeywell International, Inc.
Employee Directors (including 210,822 shares of Common Stock to be issued for options; and 15,759 RSUs subject to continued services). RSUs included in column (a) of the table represent the full number of RSUs awarded and outstanding whereas the number of shares of Common Stock to be issued upon vesting will be lower than what is reflected on the table because the value of shares required to meet employee tax withholding requirements are not issued.
Because the number of future shares that may be distributed to employees participating in the Honeywell Global Stock Plan is unknown, no shares attributable to that plan are included in column (a) of the table above.
(2)Column (b) relates to stock options and does not include any exercise price for RSUs because an RSU’s value is dependent upon attainment of certain performance goals or continued employment or service and they are settled for shares of Common Stock on a one-for-one basis.
(3)The number of shares that may be issued under the 2016 Stock Incentive Plan as of December 31, 2020 is 34,104,522, which includes the following additional shares that may again be available for issuance: shares that are settled for cash, expire, are canceled, or under similar prior plans, are tendered as option exercise price or tax withholding obligations, are reacquired with cash option exercise price or with monies attributable to any tax deduction to Honeywell upon the exercise of an option, or are under any outstanding awards assumed under any equity compensation plan of an entity acquired by the Company. No securities are available for future issuance under the 2011 Stock Incentive Plan or the 2006 Stock Incentive Plan.
The number of shares that may be issued under the Honeywell Global Stock Plan as of December 31, 2020 is 1,736,279. This plan is an umbrella plan for three plans described below maintained solely for eligible employees of participating non-U.S. countries.
-
The UK Sharebuilder Plan allows an eligible UK employee to invest taxable earnings in Common Stock. The Company matches those shares and dividends paid are used to purchase additional shares of Common Stock. For the year ending December 31, 2020, 32,717 shares were credited to participants’ accounts under the UK Sharebuilder Plan.
-
The Honeywell Aerospace Ireland Share Participation Plan and the Honeywell Measurex (Ireland) Limited Group Employee Profit Sharing Plan allow eligible Irish employees to contribute a percentage of base pay and/or bonus that is invested in Common Stock. For the year ending December 31, 2020, 1,816 shares of Common Stock were credited to participants’ accounts under these plans.
The remaining 832,309 shares included in column (c) are shares remaining under the 2016 Stock Plan for Non-Employee Directors.
(4)Equity compensation plans not approved by shareowners included in the table refer to the Honeywell Excess Benefit Plan and Supplemental Savings Plan.
The Honeywell Excess Benefit Plan and Supplemental Savings Plan for highly compensated employees is an unfunded, non-tax qualified plan that provides benefits equal to the employee deferrals and Company matching allocations that would have been provided under Honeywell’s U.S. tax-qualified savings plan if the Internal Revenue Code limitations on compensation and contributions did not apply. The Company matching contribution is credited to participants’ accounts in the form of notional shares of Common Stock. The notional shares are distributed in the form of actual shares of Common Stock. The number of shares to be issued under this plan based on the value of the notional shares as of December 31, 2020 is 261,718.
(5)Column (b) does not include any exercise price for notional shares allocated to employees under Honeywell’s equity compensation plans not approved by shareowners because all of these shares are only settled for shares of Common Stock on a one-for-one basis.
(6)The amount of securities available for future issuance under the Honeywell Excess Benefit Plan and Supplemental Savings Plan is not determinable because the number of securities that may be issued under this plan depends upon the amount deferred to the plan by participants in future years.
116 Honeywell International, Inc.
Item 13. Certain Relationships and Related Transactions, and Director Independence
CERTAIN RELATIONSHIPS AND RELATED TRANSACTIONS, AND DIRECTOR INDEPENDENCE
Information relating to certain relationships and related transactions and director independence will be contained in the Proxy Statement, and such information is incorporated herein by reference.
Item 14. Principal Accounting Fees and Services
PRINCIPAL ACCOUNTING FEES AND SERVICES
Information relating to fees paid to and services performed by Deloitte & Touche LLP and our Audit Committee’s pre-approval policies and procedures with respect to non-audit services will be contained in the Proxy Statement, and such information is incorporated herein by reference.
Item 15. Exhibits and Financial Statement Schedules
EXHIBITS AND FINANCIAL STATEMENT SCHEDULES
| Page Number in Form 10-K | |||||
| (a)(1.) Consolidated Financial Statements: | |||||
| Consolidated Statement of Operations for the years ended December 31, 2020, 2019 and 2018 | 46 | ||||
| Consolidated Statement of Comprehensive Income for the years ended December 31, 2020, 2019 and 2018 | 47 | ||||
| Consolidated Balance Sheet at December 31, 2020 and 2019 | 48 | ||||
| Consolidated Statement of Cash Flows for the years ended December 31, 2020, 2019 and 2018 | 49 | ||||
| Consolidated Statement of Shareowners’ Equity for the years ended December 31, 2020, 2019 and 2018 | 50 | ||||
| Notes to Consolidated Financial Statements | 51 | ||||
| Report of Independent Registered Public Accounting Firm | 110 |
| Page Number in Form 10-K | |||||
| (a)(3.) Exhibits | |||||
| See the Exhibit Index of this Annual Report on Form 10-K | 118 |
Item 16. Form 10-K Summary
FORM 10-K SUMMARY
None.
117 Honeywell International, Inc.
EXHIBIT INDEX
118 Honeywell International, Inc.
119 Honeywell International, Inc.
120 Honeywell International, Inc.
121 Honeywell International, Inc.
The Exhibits identified above with an asterisk (*) are management contracts or compensatory plans or arrangements.
122 Honeywell International, Inc.
SIGNATURES
Pursuant to the requirements of Section 13 or 15(d) of the Securities Exchange Act of 1934, the registrant has duly caused this report to be signed on its behalf by the undersigned thereunto duly authorized.
| HONEYWELL INTERNATIONAL INC. | ||||||||||||||
| Date: February 12, 2021 | By: | /s/ Robert D. Mailloux | ||||||||||||
| Robert D. Mailloux Vice President and Controller (on behalf of the Registrant and as the Registrant’s Principal Accounting Officer) |
Pursuant to the requirements of the Securities Exchange Act of 1934, this annual report has been signed below by the following persons on behalf of the Registrant and in the capacities and on the date indicated:
| Name | Name | |||||||
| /s/ Darius E. Adamczyk | * | |||||||
| Darius E. Adamczyk Chairman and Chief Executive Officer (Principal Executive Officer) | Deborah Flint Director | |||||||
| * | * | |||||||
| Duncan B. Angove Director | Judd A. Gregg Director | |||||||
| * | * | |||||||
| William S. Ayer Director | Clive R. Hollick Director | |||||||
| * | * | |||||||
| Kevin Burke Director | Grace D. Lieblein Director | |||||||
| * | * | |||||||
| D. Scott Davis Director | Raymond T. Odierno Director | |||||||
| * | * | |||||||
| Linnet F. Deily Director | George Paz Director | |||||||
| * | ||||||||
| Robin L. Washington Director | ||||||||
| /s/ Gregory P. Lewis | /s/ Robert D. Mailloux | |||||||
| Gregory P. Lewis Senior Vice President and Chief Financial Officer (Principal Financial Officer) | Robert D. Mailloux Vice President and Controller (Principal Accounting Officer) |
| *By: | /s/ Gregory P. Lewis | |||||||||||||
| (Gregory P. Lewis Attorney-in-fact) |
February 12, 2021
123 Honeywell International, Inc.
FORM 10-K CROSS-REFERENCE INDEX
124 Honeywell International, Inc.