 filings.tools
Item 5. Market for Registrant's Common Equity, Related Stockholder Matters and Issuer Purchases of Equity Securities.
8K characters. Original on sec.gov · Markdown
Item 5. Market for Registrant's Common Equity, Related Stockholder Matters and Issuer Purchases of Equity Securities.
The common stock of Hewlett Packard Enterprise is listed on the New York Stock Exchange ("NYSE") with the ticker symbol "HPE". There were 56,291 stockholders of record of Hewlett Packard Enterprise common stock as of November 29, 2019. The high and low common stock sales prices per share for fiscal 2019 and 2018 were as follows:
| Market Price Per Share | ||||||||||||||||
| 2019 | 2018 | |||||||||||||||
| Fiscal Quarter | High | Low | High | Low | ||||||||||||
| First quarter | $ | 16.52 | $ | 12.09 | $ | 17.07 | $ | 12.82 | ||||||||
| Second quarter | $ | 16.97 | $ | 15.05 | $ | 19.48 | $ | 14.66 | ||||||||
| Third quarter | $ | 16.07 | $ | 13.55 | $ | 17.82 | $ | 14.46 | ||||||||
| Fourth quarter | $ | 16.55 | $ | 12.52 | $ | 17.59 | $ | 14.36 |
Dividends declared and paid per share by fiscal quarter in 2019 were as follows:
| 2019 | ||||||||||||||||
| Q1 | Q2 | Q3 | Q4 | |||||||||||||
| Dividends declared | $ | 0.1125 | $ | 0.1125 | $ | 0.1125 | $ | 0.1200 | ||||||||
| Dividends paid | $ | 0.1125 | $ | 0.1125 | $ | 0.1125 | $ | 0.1125 |
Dividends declared and paid per share by fiscal quarter in 2018 were as follows:
| 2018 | ||||||||||||||||
| Q1 | Q2 | Q3 | Q4 | |||||||||||||
| Dividends declared | $ | 0.1500 | $ | 0.1125 | $ | 0.1125 | $ | 0.1125 | ||||||||
| Dividends paid | $ | 0.0750 | $ | 0.0750 | $ | 0.1125 | $ | 0.1125 |
On October 23, 2019, the Company announced an increase to the regular quarterly dividend from $0.1125 per share to $0.1200 per share, which was effective in the fourth quarter of fiscal 2019. The payment of any dividends in the future, and the timing and amount thereof, is within the discretion of our Board of Directors. Our Board of Directors' decisions regarding the payment of dividends will depend on many factors, such as our financial condition, earnings, capital requirements, debt service obligations, restrictive covenants in our debt, industry practice, legal requirements, regulatory constraints, and other factors that our Board of Directors deems relevant. Our ability to pay dividends will depend on our ongoing ability to generate cash from operations and on our access to the capital markets. We cannot guarantee that we will continue to pay a dividend in any future period.
Issuer Purchases of Equity Securities
| Fourth Quarter of Fiscal 2019 | Total Number of Shares Purchased | Average Price Paid per Share | Total Number of Shares Purchased as Part of Publicly Announced Plans or Programs | Approximate Dollar Value of Shares that May Yet Be Purchased under the Plans or Programs | ||||||||||
| In thousands, except per share amounts | ||||||||||||||
| Month 1 (August 2019) | 7,601 | $ | 13.38 | 7,601 | $ | 2,647,056 | ||||||||
| Month 2 (September 2019) | 5,805 | $ | 14.57 | 5,805 | $ | 2,562,469 | ||||||||
| Month 3 (October 2019) | 6,448 | $ | 15.09 | 6,448 | $ | 2,465,162 | ||||||||
| Total | 19,854 | $ | 14.28 | 19,854 |
During the fiscal year ended October 31, 2019, the Company repurchased and settled 150 million shares of the Company's common stock, which included 2.4 million shares that were unsettled open market purchases as of October 31, 2018. Additionally, the Company had unsettled open market repurchases of 0.5 million shares as of October 31, 2019. Shares repurchased during fiscal 2019 were recorded as a $2.2 billion reduction to stockholders' equity. As of October 31, 2019, the Company had a remaining authorization of $2.5 billion for future share repurchases.
On October 13, 2015, the Company's Board of Directors approved a share repurchase program with a $3.0 billion authorization, which was refreshed with additional share repurchase authorizations of $3.0 billion, $5.0 billion and $2.5 billion on May 24, 2016, October 16, 2017 and February 21, 2018, respectively. The Company may choose to repurchase shares when sufficient liquidity exists and the shares are trading at a discount relative to estimated intrinsic value. This program, which does not have a specific expiration date, authorizes repurchases in the open market or in private transactions. Share repurchases settled in the fourth quarter of fiscal 2019 were open market repurchases.
Stock Performance Graph and Cumulative Total Return
The graph below shows the cumulative total stockholder return, the S&P 500 Index and the S&P Information Technology Index. This graph covers the period from November 2, 2015 (the first day HPE's common stock began trading "regular-way" on the NYSE) through October 31, 2019. This graph assumes the investment of $100 in the stock or the index on November 2, 2015 (and the reinvestment of dividends thereafter). On April 1, 2017, we completed the separation and merger of our Enterprise Services business with Computer Sciences Corporation (“CSC”) (collectively, the “Everett Transaction”). HPE stockholders received 0.085904 shares of common stock in the new company for every one share of HPE common stock held at the close of business on the record date. On September 1, 2017, we completed the separation and merger of our Software business segment with Micro Focus International plc (“Micro Focus”) (collectively, the “Seattle Transaction”). HPE stockholders received 0.13732611 American Depository Shares (“Micro Focus ADSs”) in the new company, each of which represents one ordinary share of Micro Focus, for every one share of HPE common stock held at the close of business on the record date. The effect of the Everett and Seattle Transactions are reflected in the cumulative total return as reinvested dividends. The comparisons in the graph below are based on historical data and are not indicative of, or intended to forecast, future performance of our common stock.
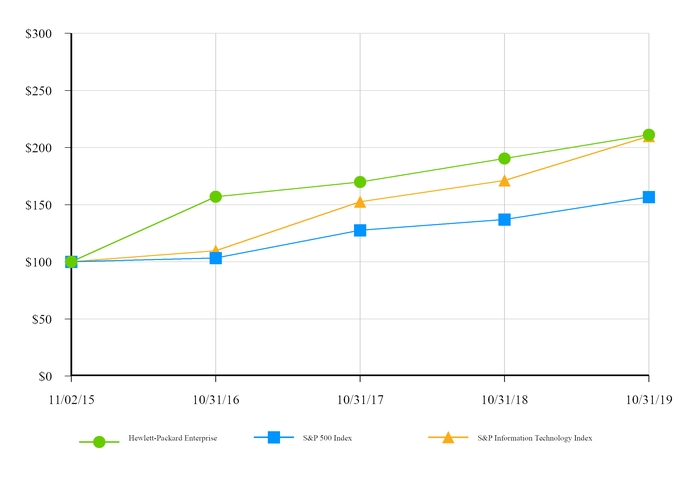
| 11/2015 | 10/2016 | 10/2017 | 10/2018 | 10/2019 | |||||||||||||||
| Hewlett Packard Enterprise | $ | 100.00 | $ | 157.00 | $ | 169.80 | $ | 190.36 | $ | 211.12 | |||||||||
| S&P 500 Index | $ | 100.00 | $ | 103.27 | $ | 127.67 | $ | 137.04 | $ | 156.66 | |||||||||
| S&P Information Technology Index | $ | 100.00 | $ | 109.74 | $ | 152.49 | $ | 171.25 | $ | 209.93 |
Previous: Item 4. Mine Safety Disclosures. · Next: Item 6. Selected Financial Data.