 filings.tools
Item 5. Market for Registrant’s Common Equity, Related Stockholder Matters and Issuer Purchases of Equity Securities.
5K characters. Original on sec.gov · Markdown
Item 5. Market for Registrant’s Common Equity, Related Stockholder Matters and Issuer Purchases of Equity Securities.
Our common stock is traded on the New York Stock Exchange under the symbol HPQ.
For information about dividends, see Item 6, “Selected Financial Data” and Note 12, “Stockholders’ Deficit” to the Consolidated Financial Statements in Item 8.
As of November 30, 2020, there were approximately 56,084 stockholders of record.
Recent Sales of Unregistered Securities
There were no unregistered sales of equity securities in fiscal year 2020.
Issuer Purchases of Equity Securities
| Total Number of Shares Purchased | Average Price Paid per Share | Total Number of Shares Purchased as Part of Publicly Announced Plans or Programs | Approximate Dollar Value of Shares that May Yet Be Purchased under the Plans or Programs | |||||||||||||||||
| In thousands, except per share amounts | ||||||||||||||||||||
| Period | ||||||||||||||||||||
| August 2020 | 18,993 | $ | 18.18 | 18,993 | $ | 13,673,430 | ||||||||||||||
| September 2020 | 24,274 | $ | 19.08 | 24,274 | $ | 13,210,200 | ||||||||||||||
| October 2020 | 27,767 | $ | 19.11 | 27,767 | $ | 12,679,450 | ||||||||||||||
| Total | 71,034 | 71,034 |
The Company’s share repurchase program, which does not have a specific expiration date, authorizes repurchases in the open market or in private transactions. On February 22, 2020, HP’s Board of Directors increased HP’s remaining share repurchase authorization to $15.0 billion in total. HP intends to repurchase shares opportunistically as part of a robust share repurchase program. HP expects to continue share repurchases at an elevated level of at least $1.0 billion per quarter in the coming quarters, unless higher return opportunities emerge. All share repurchases settled in the fourth quarter of fiscal year 2020 were open market transactions. As of October 31, 2020, HP had approximately $12.7 billion remaining under the share repurchase authorizations.
Stock Performance Graph and Cumulative Total Return
The graph below shows the cumulative total stockholder return assuming the investment of $100 at the market close on October 31, 2015 (and the reinvestment of dividends thereafter) in each of HP common stock, the S&P 500 Index, and the S&P Information Technology Index. The comparisons in the graph below are based on historical data and are not indicative of, or intended to forecast, future performance of our common stock.
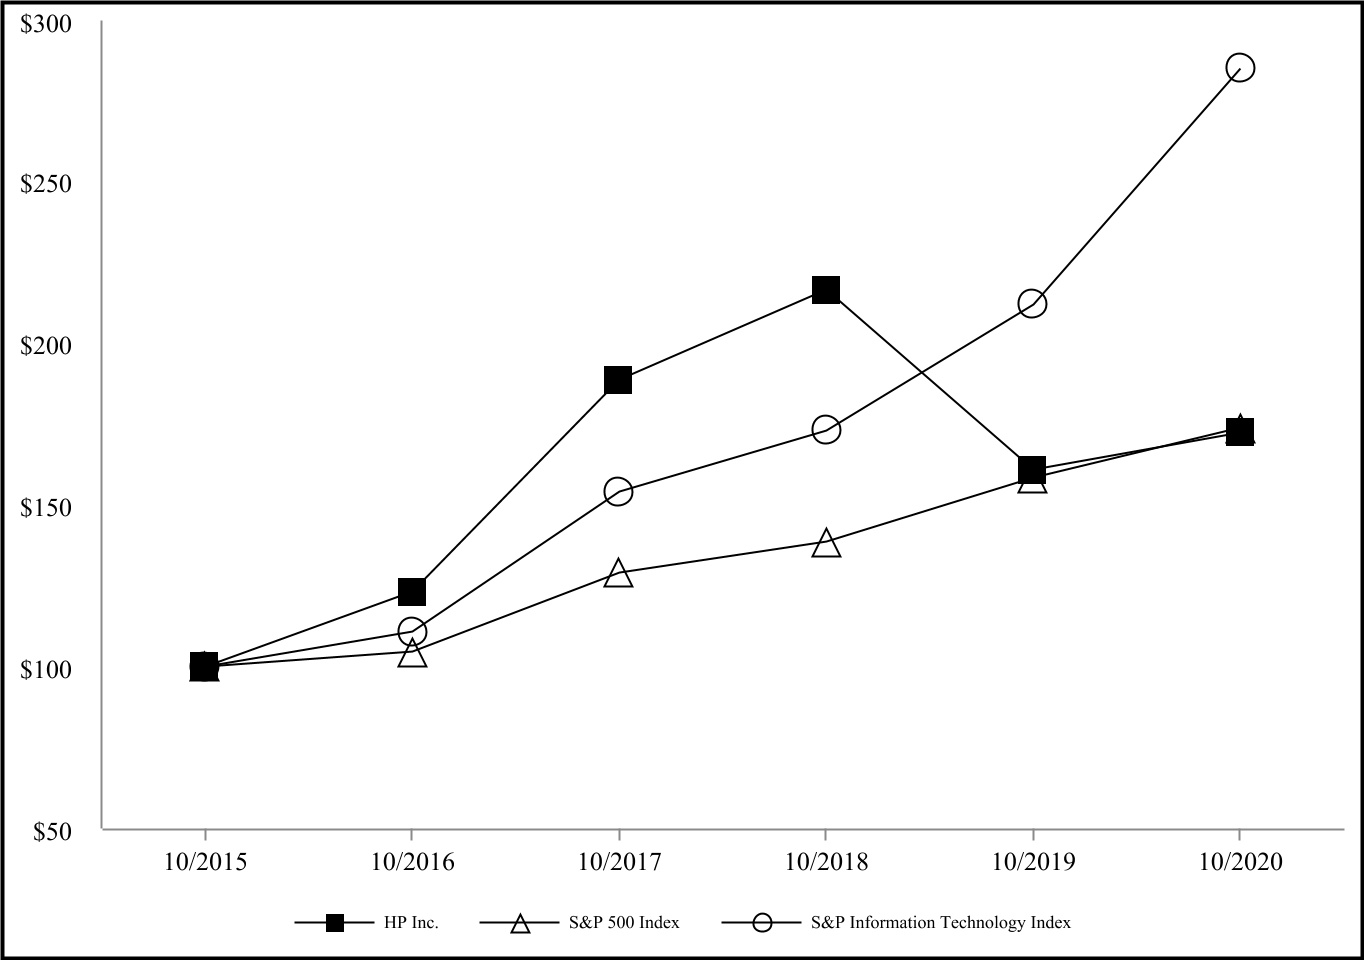
| 10/15 | 10/16 | 10/17 | 10/18 | 10/19 | 10/20 | |||||||||||||||||||||||||||||||||
| HP Inc.(1) | $ | 100.00 | $ | 123.10 | $ | 188.69 | $ | 216.50 | $ | 160.83 | $ | 172.49 | ||||||||||||||||||||||||||
| S&P 500 Index | $ | 100.00 | $ | 104.50 | $ | 129.19 | $ | 138.66 | $ | 158.52 | $ | 173.89 | ||||||||||||||||||||||||||
| S&P Information Technology Index | $ | 100.00 | $ | 110.83 | $ | 154.00 | $ | 172.95 | $ | 212.01 | $ | 285.12 |
(1) Historical stock prices of HP Inc. prior to the Separation, which occurred on November 1, 2015, have been adjusted to reflect the impact of the Separation. The adjustment was established using the conversion ratio based on the market value of stock on the Separation close at October 31, 2015.
Previous: Item 4. Mine Safety Disclosures. · Next: Item 6. Selected Financial Data.