 filings.tools
Interactive Brokers Group (IBKR) 10-K risk factor changes: FY2021 vs FY2020
The 2021-12-31 10-K against the 2020-12-31 one, compared heading by heading and sentence by sentence.
Item 1A20 rewritten19 added0 removed243 unchanged
All filing items953 rewritten311 added268 removed2,267 unchanged
Summary
counted, not written
- Item 1A lists 37 risk factor headings: 4 new, 0 reworded and 33 unchanged since FY2020. 0 headings from FY2020 no longer appear.
- Sentence by sentence, 311 added, 268 removed, 953 rewritten and 2,267 unchanged across 13 items that differ.
New Item 1A headings (4)
- We rely on a third party to provide our customers the ability to access cryptocurrency trading and custody services.
- A data breach at the CSP may result in irreversible losses, which would adversely affect our customers and our business.Cybersecurity
- We may encounter technical issues which would result in disruption or interruption of our customers’ access to their CSP accounts.
- Changes in laws and regulations regarding cryptocurrency may negatively impact our ability to enable our customers to buy, hold and sell cryptocurrencies in the future and may adversely affect our business.
Removed Item 1A headings (0)
Every FY2020 risk factor heading is still here, word for word or reworded.
A heading is new when no FY2020 heading matches it after ignoring case and punctuation, and reworded when it shares at least 60 percent of its words with one that went away. All current risk factor headings.
Sentences by item
20 items, with every count and a link to each item that changed
Underlined words on a shaded ground are new in FY2021; struck-through words were in FY2020. Sentences that are wholly new or wholly gone are labelled rather than marked.
Item 1A. RISK FACTORS
20 rewritten, 19 added, 0 removed, 243 unchanged
We currently have approximately [removed: 91] [added: 98] million outstanding shares of common stock.
divisions of our common stock, the offerings referred to above could result in the issuance by us of up to an additional approximately [removed: 326] [added: 320] million shares of common stock.
Mr. Thomas Peterffy, our founder and Chairman, and his affiliates beneficially own approximately [removed: 89.6%] [added: 90.5%] of the economic interests and all of the voting interests in Holdings, which owns all of our Class B common stock, representing approximately [removed: 78.2%] [added: 76.5%] of the combined voting power of all classes of our voting stock.
As a result, Mr. [removed: Thomas] Peterffy has the ability to elect all of the members of our board of directors and thereby to control our management and affairs, including determinations with respect to acquisitions, dispositions, material expansions or contractions of our business, entry into new lines of business, borrowings, issuances of common stock or other securities, and the declaration and payment of dividends on our common stock.
In addition, Mr. [removed: Thomas] Peterffy is able to determine the outcome of all matters requiring stockholder approval and will be able to cause or prevent a change of control of our company or a change in the composition of our board of directors and could preclude any unsolicited acquisition of our company.
Moreover, because of Mr. [removed: Thomas] Peterffy’s substantial ownership, we are eligible to be and are, treated as a “controlled company” for purposes of the Nasdaq Marketplace Rules.
Mr. [removed: Thomas] Peterffy’s membership on the Compensation Committee may give rise to conflicts of interests in that Mr. [removed: Thomas] Peterffy is able to influence all matters relating to executive compensation, including his own compensation.
We are a holding company and our primary assets are our approximately [removed: 21.8%] [added: 23.5%] equity interest in IBG LLC and our controlling interest and related rights as the sole managing member of IBG LLC and, as such, we operate and control all of the business and affairs of IBG LLC and are able to consolidate IBG LLC’s financial results into our financial statements.
As a result of the IPO and the Redemptions by Holdings, the increase in the tax basis attributable to our interest in IBG LLC is [removed: $1.6] [added: $1.8] billion.
Based on facts and assumptions as of December 31, [removed: 2020,] [added: 2021,] including that subsequent purchases of IBG LLC interests will occur in fully taxable transactions, the potential tax basis increase resulting from the historical and future purchases of the IBG LLC interests held by Holdings could be as much as [removed: $11.2] [added: $15.4] billion.
The tax basis increase of [removed: $11.2] [added: $15.4] billion assumes that (a) all remaining IBG LLC membership interests held by Holdings are purchased by us in one or more taxable transactions and (b) such purchases in the future are made at prices that reflect the closing share price as of December 31, [removed: 2020.][added: 2021.]
A weakness in [removed: equity] [added: securities] markets, such as a slowdown causing reduction in trading volume in U.S. or foreign securities and derivatives, has historically resulted in reduced transaction revenues and would have a material adverse effect on our business, financial condition and results of operations.
The pandemic [removed: affects] [added: has affected] all countries in which we operate.
A substantial portion of our employees have been impacted by local COVID-19 restrictions and [removed: have been working remotely.][added: continue to work remotely on a part-time basis.]
Regulatory bodies include, in the U.S., the SEC, FINRA, the Board of Governors of the Federal Reserve System, the Chicago Board Options Exchange, the [removed: Chicago Mercantile Exchange,] [added: CME,] the CFTC, and the NFA; in Canada, the IIROC and various Canadian securities commissions; in the United Kingdom, the FCA; in Ireland, the CBI; in Luxembourg, the CSSF; in Switzerland, the FINMA; in Hungary; the MNB; in India, the Securities and Exchange Board of India; in Hong Kong, the SFC; in Japan, the Financial Supervisory Agency and the Japan Securities Dealers Association; in Singapore, the MAS; and in Australia, the Australian Securities and Investment Commission.
prime brokers who, in an effort to satisfy the demands of their customers for hands\-on electronic trading facilities, universal access to markets, smart routing, better trading tools, lower commissions and financing rates, have embarked upon building such [removed: facilities and] [added: facilities,] product [added: and service] enhancements;
direct market access and online [added: equity brokers, and online] options and futures [removed: firms, and online equity brokers;][added: firms;]
During [removed: 2020,] [added: 2021,] approximately [removed: 29%] [added: 31%] of our net revenues were generated by our operating subsidiaries outside the U.S. We are exposed to risks and uncertainties inherent in doing business in international markets, particularly in the heavily regulated brokerage industry.
We rely on certain third\-party computer systems or third\-party service providers, including clearing systems, exchange systems, banking systems, [added: cryptocurrency systems,] Internet service, co-location facilities, communications facilities and other facilities.
If periods of decreased performance, outages or delays on the Internet occur frequently or other critical issues concerning the Internet are not resolved, overall Internet usage or usage of our [removed: web based] [added: web-based] products could increase more slowly or decline, which could have a material adverse effect on our business, financial condition and results of operations.
We rely on a third party to provide our customers the ability to access cryptocurrency trading and custody services.
We have entered into an agreement with a Cryptocurrency Service Provider (“CSP”), which provides (i) a cryptocurrency exchange platform and services whereby investors can buy and sell certain cryptocurrencies from or to other customers of the CSP or liquidity providers and (ii) custody services for certain cryptocurrencies (collectively, the “Exchange Services”), enabling our customers to trade and custody Bitcoin (BTC), Ethereum (ETH), Litecoin (LTC), Bitcoin Cash (BCH) and potentially other cryptocurrencies, (collectively, "Cryptocurrency Assets") via the CSP.
We provide only a platform and an interface for our customers to access the Exchange Services provided by the CSP.
We have no custody or control over the Cryptocurrency Assets our customers hold in their accounts at the CSP.
A disruption in our partnership with the CSP or in the Exchange Services provided by the CSP could have adverse effects on our customers’ confidence in our cryptocurrency offering through the CSP and on our business.
A data breach at the CSP may result in irreversible losses, which would adversely affect our customers and our business.
Access to the Cryptocurrency Assets is controllable only by the possessor of the unique private key relating to the digital wallet in which such Cryptocurrency Assets are held.
To the extent any of the CSP’s private keys are lost, destroyed, unable to be accessed by the CSP, or otherwise compromised and no backup of such private key is accessible, the CSP will be unable to access the Cryptocurrency Assets held in the respective wallets.
In addition, neither the CSP nor any cryptocurrency custodian can provide absolute assurance that any or all of the CSP’s wallets will not be hacked or compromised such that the private keys are obtained by a third-party or otherwise compromised in a manner such that Cryptocurrency Assets are sent to one or more addresses that the CSP does not control, which could result in the loss of some or all of the Cryptocurrency Assets that the CSP holds in custody on behalf of our customers.
The CSP’s failure to safeguard the Cryptocurrency Assets may result in losses to our customers which could have adverse effects on our customers’ confidence in our cryptocurrency offering through the CSP and on our business.
We may encounter technical issues which would result in disruption or interruption of our customers’ access to their CSP accounts.
Both we and the CSP rely on computer software, hardware and telecommunications infrastructure and networking to provide the respective services to our customers with respect to trading and custody of the Cryptocurrency Assets.
These computer-based systems and services are inherently vulnerable to disruption, delay, or failure, which may cause our customers to lose access to our trading platform and the Exchange Services provided by the CSP.
Any such disruption could have an adverse effect on our customers’ confidence in our cryptocurrency offering through the CSP and an adverse effect on our business.
Changes in laws and regulations regarding cryptocurrency may negatively impact our ability to enable our customers to buy, hold and sell cryptocurrencies in the future and may adversely affect our business.
Regulation of the cryptocurrency industry continues to evolve and is subject to change.
Securities and commodities laws and regulations and other bodies of laws can apply to certain cryptocurrency assets.
These laws and regulations are complex and the interpretations of them may be subject to challenge by the relevant regulators.
Future regulatory developments, including the treatment of certain cryptocurrency assets for U.S. federal income tax and foreign tax purposes, could have an adverse effect on our cryptocurrency offering through the CSP and on our business.
Item 7. MANAGEMENT’S DISCUSSION AND ANALYSIS OF FINANCIAL CONDITION AND RESULTS OF OPERATIONS
257 rewritten, 79 added, 91 removed, 359 unchanged
We specialize in routing orders and executing and processing trades in stocks, options, futures, forex, bonds, mutual [removed: funds] [added: funds, ETFs, metals] and [removed: ETFs] [added: cryptocurrencies] on more than [removed: 135] [added: 150] electronic exchanges and market centers in 33 countries and [removed: in] 25 currencies seamlessly around the world.
The [removed: emerging] [added: ever-growing] complexity of multiple market centers [removed: has provided] [added: across diverse geographies provides] us with [removed: the opportunity] [added: ongoing opportunities] to build and continuously adapt our order routing software to secure excellent execution prices.
The proliferation of electronic exchanges and market centers [removed: over] [added: since] the [removed: last three decades] [added: early 1990s] has allowed us to integrate our software with an increasing number of trading [removed: venues into] [added: venues, creating] one automatically functioning, computerized platform that requires minimal human intervention.
Currently, approximately [removed: 76%] [added: 77%] of our customers reside outside the U.S. in over 200 countries and territories, and over 50% of new customers come from outside the U.S. Approximately [removed: 64%] [added: 62%] of our customers’ equity is in institutional accounts such as hedge funds, financial advisors, proprietary trading desks and introducing brokers.
Specialized products and services that we have developed [removed: are] successfully [removed: attracting] [added: attract] these accounts.
For example, we offer prime brokerage services, including financing and securities [removed: lending] [added: lending,] to hedge funds; our model portfolio technology and automated share allocation and rebalancing tools are particularly attractive to financial advisors; and our trading platform, global access and low pricing attract introducing brokers.
The impact of the COVID-19 pandemic [removed: on the Company’s future financial results could be significant but currently cannot be quantified, as it] [added: going forward] will depend on numerous evolving factors that [removed: currently] cannot be accurately predicted, [removed: including, but not limited to,] [added: including] the duration and spread of the [removed: pandemic; its impact on our customers, employees and vendors;] [added: pandemic,] governmental [removed: actions] [added: regulations] in response to the [removed: pandemic;] [added: pandemic,] and the [removed: overall impact] [added: effectiveness] of [removed: the pandemic in the economy] [added: vaccinations] and [removed: society; among] other [removed: factors.][added: medical advancements.]
[removed: Among our customer base,] [added: In general, higher] volatility [removed: is highly correlated] [added: improves our performance because it correlates] with customer trading activity across product types.
The following is a summary of the key [removed: profit] [added: economic] drivers that affect our business and how they compared to [removed: 2019:][added: the prior year:]
See [removed: the] “Trading Volumes and [removed: Brokerage] [added: Customer] Statistics” [removed: section] below in this Item 7 for additional details regarding our trade volumes, contract and share volumes, and [removed: brokerage] [added: customer] statistics.
[removed: As] [added: Further,] our margin balances are tied to benchmark rates, [removed: declining] [added: with a minimum charge of 0.75% in] U.S. [added: dollars, so low] interest rates [removed: reduce] [added: limit] the interest we receive on [removed: our U.S. dollar customer] margin [removed: balances.][added: lending to our customers.]
[removed: Falling] [added: Low benchmark] rates also reduce the interest we earn on our segregated cash, the majority of which is invested in U.S. government securities and related instruments.
During [removed: 2020] [added: 2021] the value of the GLOBAL, as measured in U.S. dollars, [removed: increased 1.45%] [added: decreased 1.31%] compared to its value [removed: as of] [added: at] December 31, [removed: 2019.][added: 2020, which had a negative impact on our comprehensive earnings for the year.]
A discussion of our approach for managing foreign currency exposure is contained in Part [removed: II,] [added: I,] Item 7A of this [removed: Annual] [added: Quarterly] Report on Form [removed: 10\-K] [added: 10\-Q] entitled “Quantitative and Qualitative Disclosures about Market [removed: Risk.”][added: Risk.]
[removed: In the fourth quarter of 2019, we introduced the reporting of] [added: We report] non-GAAP financial measures, which [removed: excludes] [added: exclude] certain items that may not be indicative of our core operating results and business [removed: outlook.][added: outlook and may be useful in evaluating the operating performance of our business and provide a better comparison of our results in the current period to those in prior and future periods.]
Diluted earnings per share were [removed: $2.42] [added: $3.24] for the year ended December 31, [removed: 2020] [added: 2021] (“current year”), compared to [removed: diluted earnings per share of $2.10] [added: $2.42] for the year ended December 31, [removed: 2019] [added: 2020] (“prior year”).
Adjusted diluted earnings per share were [removed: $2.49] [added: $3.37] for the current year, compared to [removed: adjusted diluted earnings per share of $2.27] [added: $2.49] for the prior year.
For the current year, our net revenues were [removed: $2,218] [added: $2,714] million and income before income taxes was [removed: $1,256] [added: $1,787] million, compared to net revenues of [removed: $1,937] [added: $2,218] million and income before income taxes of [removed: $1,157] [added: $1,256] million in the prior year.
Adjusted net revenues were [removed: $2,204] [added: $2,780] million and adjusted income before income taxes was [removed: $1,346] [added: $1,853] million, compared to adjusted net revenues of [removed: $1,984] [added: $2,204] million and adjusted income before income taxes of [removed: $1,246] [added: $1,346] million in the prior year.
Other income [removed: increased $52] [added: decreased $61] million from the prior year.
This [removed: increase] [added: decrease] was mainly comprised of [removed: (1) $41 million related to our currency diversification strategy, which lost $19 million in the current year compared to a loss of $60 million in the prior year; (2) $35] [added: $75] million related to our strategic investment in [removed: Up Fintech Holding Limited (“Tiger Brokers”),] [added: Tiger Brokers,] which [removed: increased] [added: swung] to a [removed: $44] [added: $31] million mark-to-market [removed: gain] [added: loss] in the current year from a [removed: $9] [added: $44] million mark-to-market gain in the prior year; [removed: partially offset by (3) $16] [added: and $18] million related to our [removed: principal trading activities] [added: currency diversification strategy,] which [removed: gained $40] [added: lost $37] million in the current year compared to [removed: $56] [added: a loss of $19] million in the prior year; [removed: and (4)] [added: partially offset by the non-recurrence of] a $13 million impairment loss on our investment in OneChicago [removed: Exchange, as it ceased operations, during] [added: Exchange in] the [removed: current] [added: prior] year.
[removed: Pretax] [added: Pretax] profit margin was [removed: 57%] [added: 66%] for the current [removed: year, down from 60% in] [added: year and 57% for] the prior year.
Adjusted pretax profit margin [removed: for the current year] was [removed: 61%, down] [added: 67%, up] from [removed: 63%] [added: 61%] in the prior year.
In connection with our currency diversification strategy as of December 31, [removed: 2020,] [added: 2021,] approximately [removed: 27%] [added: 26%] of our equity was denominated in currencies other than the U.S. dollar.
In the current year, our currency diversification strategy [removed: increased] [added: decreased] our comprehensive earnings by [removed: $105] [added: $134] million (compared to [removed: a decrease] [added: an increase] of [removed: $36] [added: $105] million in the prior year), as the U.S. dollar value of the GLOBAL [removed: increased] [added: decreased] by approximately [removed: 1.45%,] [added: 1.31%,] compared to its value as of December 31, [removed: 2019.][added: 2020.]
The effects of our currency diversification strategy are reported as (1) a component of other income (loss of [removed: $19] [added: $37] million) in the consolidated statements of comprehensive income and (2) other comprehensive income (“OCI”) [removed: (gain] [added: (loss] of [removed: $124] [added: $97] million) in the consolidated statements of financial condition and the consolidated statements of comprehensive income.
As a result, the Company recognized an aggregate loss of approximately $104 [removed: million,] [added: million in the prior year,] of which $103 million is included in general and administrative expenses and $1 million in customer bad debt expense in the consolidated statements of comprehensive income.
Retail participation in the equity markets has fluctuated [removed: over] [added: in] the past [removed: few years] due to investor sentiment, market conditions and a variety of other factors.
[removed: Additional consolidation] [added: Consolidation] among market centers may adversely affect the value of our IB SmartRoutingSM software.
[removed: Scrutiny] [added: Scrutiny] of [removed: equity and options market makers, hedge funds, and soft dollar and] payment for order flow [added: and order routing] practices by regulatory and legislative authorities has increased.
[removed: New] [added: New] legislation or modifications to existing regulations and rules could occur in the future.
| | | [removed: 2020] [added: 2021] | | | [removed: 2019] [added: 2020] | | | [removed: 2018] [added: 2019] | |
| | | (in [removed: millions,] [added: dollars,] except share [removed: and per share] amounts) | | | | | | | |
| Commissions | | $ | [removed: 1,112] [added: 1,350] | | $ | [removed: 706] [added: 1,112] | | $ | [removed: 777] [added: 706] |
| Other fees and services | | | [removed: 175] [added: 218] | | | [removed: 141] [added: 175] | | | [removed: 148] [added: 141] |
| Other income [added: (loss)] | | | [removed: 59] [added: (2)] | | | [removed: 7] [added: 59] | | | [removed: 49] [added: 7] |
| Total non-interest income | | | [removed: 1,346] [added: 1,566] | | | [removed: 854] [added: 1,346] | | | [removed: 974] [added: 854] |
| Interest income | | | [removed: 1,133] [added: 1,372] | | | [removed: 1,726] [added: 1,133] | | | [removed: 1,392] [added: 1,726] |
| Interest expense | | | [removed: (261)] [added: (224)] | | | [removed: (643)] [added: (261)] | | | [removed: (463)] [added: (643)] |
| Total net interest income | | | [removed: 872] [added: 1,148] | | | [removed: 1,083] [added: 872] | | | [removed: 929] [added: 1,083] |
In 2021, world equities markets ended the year mixed.
While the U.S., the United Kingdom, Europe and Australia saw double-digit gains in their major equity market indexes, Asian markets either experienced small gains or fell.
Despite this varied backdrop, there continues to be worldwide interest in the financial markets.
Growing numbers of individuals, especially those newly attracted to investing, turned to the markets with increased awareness, due to the interconnectedness of investors to each other and to the markets, as they sought to earn higher yields on their assets in zero and negative-interest rate environments.
*Global trading volumes.* According to industry data, average daily volume in U.S. exchange\-listed equity\-based options increased by 34%, U.S. futures by 3%, and in U.S. listed cash equities volume by 5%.
These increases followed a very active 2020.
Volumes were impacted positively by large numbers of investors, particularly individuals, participating in securities markets throughout the year.
Market volatility decreased moderately over the course of 2021, while average volatility for the year was down substantially from a highly volatile, pandemic-impacted 2020.
Despite lower volatility, higher equities, futures and options volumes demonstrated the continuing impact of more participants in the financial markets and their increasing comfort with taking part in the investment arena.
Note that while U.S. options, futures and cash equities volumes are readily comparable measures, they reflect most but not all of the global volumes that generate our commission revenue.
*Volatility.* U.S. market volatility, as measured by the average Chicago Board Options Exchange Volatility Index (“VIX®”), fell markedly from 29 in 2020 to 20 in 2021.
While last year’s unusual COVID-19 pandemic-induced spike in market volatility to over 30 has moderated, it remains elevated compared to pre-pandemic levels.
Various market cross-currents led to mixed results across our major product types: customer options and stock volumes were up 46% and 131%, respectively, while futures and foreign exchange volumes declined 7% and 30%, respectively, compared to 2020.
Trading was active as investors continued to capitalize on the opportunities to participate in the markets, seeking higher yields on their investments in the zero or negative interest rate environments that existed globally in 2021.
These trends led to an influx of new accounts and increases in trading volume, particularly in equities.
*Interest Rates.* The U.S. Federal Reserve’s target federal funds rate range in the current quarter remained at zero to 0.25%, similar to rates in many other currencies, with the exception of those where rates are negative.
U.S. rates also continued to exhibit a relatively flat yield curve.
Both of these factors present us with fewer investment opportunities for interest-sensitive assets, and can lead to a narrower net interest margin.
We continue to offer among the lowest rates in the industry on margin lending, and we believe our low rates are an important factor that attracts customers to our platform.
As an offset, lower rates also reduce our interest expense.
For example, in U.S. dollars we pay interest to customers only when the federal funds effective rate is above 0.50%, and in currencies with negative rates we collect interest on a portion of customer cash balances.
As an indirect positive effect, we believe low and negative benchmark world interest rates have been a factor leading to the active trading we have experienced, as investors enter securities markets to achieve higher yields on their investments.
Net interest income increased compared to 2020 while the average federal funds effective rate decreased to 0.08% in 2021 from 0.38% in 2020.
The interest we pay on customer cash balances and earn on customer margin loans and investment of customer segregated funds results in spreads that are compressed at low benchmark rates.
Rising balances and a minimum margin loan interest rate have partially compensated for this reduction in net interest income.
Despite flat benchmark rates in 2021, a 58% increase in our average margin loan balances contributed to a 41% rise in margin loan interest over 2020.
Further, a strong inflow of new accounts drove average customer credit balances up 17% for the year.
Fueled by higher average balances and strong securities lending results, our net interest income grew 32% over 2020, and our overall net interest margin increased from 1.07% to 1.17%.
Commission revenue increased $238 million, or 21%, from the prior year on higher customer options and stock trading volumes.
Net interest income increased $276 million, or 32%, on strong securities lending activity and higher margin loan balances.
We continue to be exposed to the risks and uncertainties of doing business in international markets, particularly in the heavily regulated brokerage industry.
Such risks and uncertainties include political, economic and financial instability, and foreign policy changes.
For example, tensions between the U.S. and China have escalated recently, and changes in Chinese governmental oversight of Hong Kong and in the Chinese and Hong Kong capital markets could result in adverse effects on our business and loss of assets we hold in the region.
| | | | | | | | | | | | | | | | | | | |
| 2021 | | 871,319 | | 40% | | 78,276 | | 38% | | 32,621 | | 21% | | 982,216 | | 39% | | 3,905 |
| 2021 | | 887,849 | | 42% | | 154,866 | | (7%) | | 771,273,709 | | 128% |
| 2021 | | 852,169 | | 46% | | 152,787 | | (7%) | | 766,211,726 | | 131% |
| 2021 | | 773,284 | | 49% | | 151,715 | | (7%) | | 752,720,070 | | 135% |
| 2021 | | 35,680 | | (10%) | | 2,079 | | (18%) | | 5,061,983 | | (30%) |
| | | 2021 | | | 2020 | | | % Change |
COVID-19 Pandemic
In March 2020, the World Health Organization recognized the outbreak of the COVID-19 caused by a novel strain of the coronavirus as a pandemic.
The pandemic affects all countries in which we operate.
The response of governments and societies to the COVID-19 pandemic, which includes temporary closures of certain businesses; social distancing; travel restrictions, “shelter in place” and other governmental regulations; and reduced consumer spending due to job losses, has significantly impacted market volatility in the financial, commodities and energy markets, and general economic conditions.
The COVID-19 pandemic has precipitated unprecedented market conditions with equally unprecedented social and community challenges.
Amid these challenges:
The Company is committed to ensuring the highest levels of service to its customers so they can effectively manage their assets, portfolios and risks.
The Company’s technical infrastructure has withstood the challenges presented by the extraordinary volatility and increased market volume.
The Company can run its business from alternate office locations and/or remotely if a Company office must temporarily close due to the spread of the COVID-19 pandemic.
As announced on April 9, 2020, during the second quarter of 2020 the Company donated $5 million to assist efforts to provide food and support for people affected by the COVID-19 pandemic in the United States as well as to advance medical solutions.
The effects of the COVID-19 pandemic on the Company’s financial results for 2020 can be summarized as follows: (1) higher commission revenue due to increased trading activity and a higher rate of customer accounts opened during this period; and (2) lower net interest income resulting from lower benchmark interest rates.
Any of these events could have a materially adverse effect on the Company’s financial results.
2020 was a unique year, as the onset of the COVID-19 pandemic, together with unpredictable geopolitical events, created great uncertainty and volatility in the world’s financial markets.
U.S. market volatility rose in 2020 over the prior year, with particularly high volatility in the first half of the year as the pandemic took hold.
Fears about economic collapse were especially strong in the first quarter of 2020, as global markets fell and the S&P 500 declined 20%.
Central banks turned to monetary easing to buffer their national economies from a pandemic-induced downturn.
In March, the U.S. Federal Reserve adopted a near-zero interest rate policy and other countries maintained or reduced rates to zero and below.
Following on the heels of the initial panic was a worldwide surge of interest in financial markets, particularly equity markets, as people following stay-at-home guidelines opened brokerage accounts for investing and trading.
Equity market indices, which had fallen in the first quarter as the scope of the pandemic became known, responded to this surge in new participants and most indices rose over the remainder of the year.
North American and Asian markets recovered more strongly than those in Europe, which may have been negatively affected by the final negotiations around Brexit.
A more active trading environment worldwide coincided with higher volatility, with the average Chicago Board Options Exchange Volatility Index (“VIX®”) up 89% in the fourth quarter of 2020, compared to the year-ago quarter.
In 2020, higher volatility, in combination with strong customer account growth, led to significant increases in trading volume.
The resulting boost to commission revenues was tempered by a decline in net interest income.
Lower benchmark interest rates, though they reduced the rate of interest paid on customer cash to zero in most currencies, also reduced the rates we earned on margin lending and gave us fewer opportunities to earn net interest income on fully interest-sensitive balances.
In this environment, with near-zero interest rates and rising asset values in actively-trading markets, customer account growth was robust.
Total customer accounts increased 56% in 2020 to over 1.07 million.
Inflows from new and existing customers, combined with rising securities prices that generally lifted customers’ investment values, led to customer equity growth of 66% to $288.6 billion.
Institutional customers, such as hedge funds, mutual funds, introducing brokers, proprietary trading groups and financial advisors, comprised approximately 43% of total accounts and approximately 64% of total customer equity at the end of 2020.
Customers seek out our superior technology and execution capabilities, global market access, and low costs, as well as our securities finance services, including margin lending and short sale support.
*Global trading volumes.* According to data received from exchanges, volumes in exchange\-listed equity\-based options rose by approximately 93% in the U.S. for the year ended December 31, 2020, compared to 2019, while U.S. equities volumes increased by 103% and exchange-listed futures increased by 31%.
*Volatility.* Based on the VIX®, average U.S. market volatility rose to 29.2 in 2020, up 89% from the average of 15.4 in 2019.
Higher volatility tends to improve our electronic brokerage performance because it generally corresponds to stronger trading volumes.
In 2020, as the VIX maintained elevated levels for most of the year, we saw the impact on both customer trading activity, which more than doubled, and our commissions revenue, which rose 58%.
*Interest Rates.* The U.S. Federal Reserve reduced the target federal funds rate to near-zero in March of 2020, mirroring rates in most other currencies, which generally ranged from near-zero to negative.
Decreases in benchmark rates can lead to lower net interest income and a narrower net interest margin.
Partially offsetting these factors in 2020 were higher average customer credit balances, up 28%, higher average margin lending, up 9%, reduced interest expense due to lower rates, and strong securities lending activity and other financing activities.
In total, our net interest income fell 19% compared to 2019.
**
We believe these non-GAAP financial measures may be useful in evaluating the operating performance of our business and provide a better comparison of our results in the current period to those in prior and future periods.
Pursuant to the requirements of Financial Accounting Standards Board’s (“FASB”) Accounting Standards Codification (“ASC”) Topic 280, “Segment Reporting,” we performed a quantitative and a qualitative assessment of our business and determined that our remaining market making activities no longer support our reporting of separate business segments.
An excerpt. Shown here: 40 of 257 rewritten, 40 of 79 added and 40 of 91 removed. The counts are complete. For every sentence, read Item 7. MANAGEMENT’S DISCUSSION AND ANALYSIS OF FINANCIAL CONDITION AND RESULTS OF OPERATIONS in the FY2021 filing and the FY2020 filing.
Item 7A. QUANTITATIVE AND QUALITATIVE DISCLOSURES ABOUT MARKET RISK
39 rewritten, 9 added, 18 removed, 98 unchanged
Our model automatically rebalances our positions throughout each trading day to manage risk exposures on our options and futures positions and the underlying [removed: securities,] [added: securities] and will price the increased risk that a position would add to the overall portfolio into the bid and offer prices we post.
Although our remaining market making activities are completely automated, the trading process and our risk are monitored by a team of individuals who, in [removed: real time,] [added: real-time,] observe various risk parameters of our consolidated positions.
As a result of our international activities and accumulated earnings in our foreign subsidiaries, our income and net worth [removed: is] [added: are] exposed to fluctuations in foreign exchange rates.
For example, [removed: our European operations and] some of our [added: European and] Asian operations are conducted by our Swiss subsidiary, IBKRFS.
[removed: The majority of currency] [added: Currency] spot positions [removed: held] [added: entered into] as part of our currency diversification strategy are [removed: regularly transferred to] [added: held by] the parent holding company, IBG [removed: LLC, where they are held.][added: LLC.]
The U.S. dollar value of the GLOBAL [removed: increased 1.45%] [added: decreased 1.31%] as of December 31, [removed: 2020] [added: 2021] compared to December 31, [removed: 2019.][added: 2020.]
As of December 31, [removed: 2020,] [added: 2021,] approximately [removed: 27%] [added: 26%] of our equity was denominated in currencies other than the U.S. dollar.
| | | | | | GLOBAL in | | | | % of | Net Equity | | | [removed: New] | | [removed: |] GLOBAL in | | | | % of | Net Equity | | | CHANGE in | |
| Currency | | Composition | FX Rate | | USD Equiv. | | | | Comp. | (in USD millions) | | | [removed: Composition |] FX Rate | | USD Equiv. | | | | Comp. | (in USD millions) | | | % of Comp. | |
| USD | | [removed: 0.68] [added: 0.72] | | 1.0000 | | | [removed: 0.680] [added: 0.720] | | [removed: 70.3%] [added: 73.4%] | | $ | [removed: 5,586 | 0.72] [added: 6,610] | | 1.0000 | | | 0.720 | | [removed: 73.4%] [added: 74.4%] | | $ | [removed: 6,610] [added: 7,605] | | [removed: 3.1%] [added: 1.0%] |
| JPY | | [removed: 4.41 |] [added: 3.91] | [removed: 0.0092] | [added: 0.0097] | | [removed: 0.041] | [added: 0.038] | [removed: 4.2%] | [added: 3.9%] | | [removed: 333] | [removed: 3.91] [added: 348] | | [removed: 0.0097] [added: 0.0087] | | | [removed: 0.038] [added: 0.034] | | [removed: 3.9%] [added: 3.5%] | | | [removed: 348] [added: 359] | | \-0.3% |
| GBP | | 0.02 | | [removed: 1.3261] [added: 1.3666] | | | 0.027 | | [removed: 2.7% |] [added: 2.8%] | | [removed: 218] | [removed: 0.02] [added: 251] | | [removed: 1.3666] [added: 1.3527] | | | 0.027 | | 2.8% | | | [removed: 251] [added: 286] | | 0.0% |
| CHF | | 0.02 | | [removed: 1.0334 |] [added: 1.1298] | | [removed: 0.021] | [added: 0.023] | [removed: 2.1%] | [added: 2.3%] | | [removed: 170] | [removed: 0.02] [added: 208] | | [removed: 1.1298] [added: 1.0963] | | | [removed: 0.023] [added: 0.022] | | 2.3% | | | [removed: 208] [added: 232] | | [removed: 0.2%] [added: 0.0%] |
| INR | | 1.10 | | [removed: 0.0140] [added: 0.0137] | | | 0.015 | | [removed: 1.6% |] [added: 1.5%] | | [removed: 126] | [removed: 1.10] [added: 138] | | [removed: 0.0137] [added: 0.0134] | | | 0.015 | | 1.5% | | | [removed: 138] [added: 156] | | [removed: \-0.1%] [added: 0.0%] |
| CAD | | 0.02 | | [removed: 0.7699 |] [added: 0.7853] | | [removed: 0.015] | [added: 0.012] | [removed: 1.6%] | [added: 1.2%] | | [removed: 127] | [removed: 0.02] [added: 108] | | [removed: 0.7853] [added: 0.7912] | | | 0.012 | | 1.2% | | | [removed: 108] [added: 125] | | [removed: \-0.4%] [added: 0.0%] |
| AUD | | 0.02 | | [removed: 0.7017 |] [added: 0.7693] | | [removed: 0.014] | [added: 0.012] | [removed: 1.5%] | [added: 1.2%] | | [removed: 115] | [removed: 0.02] [added: 106] | | [removed: 0.7693] [added: 0.7266] | | | [removed: 0.012] [added: 0.011] | | [removed: 1.2%] [added: 1.1%] | | | [removed: 106] [added: 115] | | [removed: \-0.3%] [added: \-0.1%] |
| | | | | | | | [removed: 0.967] [added: 0.981] | | 100.0% | | $ | [removed: 7,940 |] [added: 9,003] | | | | | [removed: 0.981] [added: 0.968] | | 100.0% | | $ | [removed: 9,003] [added: 10,222] | | 0.0% |
We had no variable\-rate debt outstanding as of December 31, [removed: 2020.][added: 2021.]
If interest rates were to increase rapidly and substantially, our net interest income would not increase proportionally with the interest rates for the portion of the funds invested [removed: in the U.S. government securities with] [added: at] fixed yields.
[added: In addition, the mark-to-market changes in the value] of these fixed rate securities will be reflected in other income, instead of net interest income.
Based on customer balances and investments outstanding as of December 31, [removed: 2020,] [added: 2021,] and assuming reinvestment of maturing instruments in instruments of short-term duration, an unexpected increase of 0.25% over current U.S. dollar interest rate levels would increase our net interest income by approximately [removed: $98] [added: $165] million [added: both] over the first year and [removed: $103 million] on an annualized basis, assuming the full effect of reinvestment at higher rates.
Based on customer balances and investments outstanding as of December 31, [removed: 2020,] [added: 2021,] and assuming reinvestment of maturing instruments in instruments of short-term duration, an unexpected decrease in U.S. dollar interest rates of 0.25% would decrease our net interest income by approximately [removed: $54] [added: $28] million over the first year and [removed: $56] [added: $38] million on an annualized basis, assuming the full effect of reinvestment at lower rates.
We also face interest rate risk due to positions carried for our remaining market making activities to the extent that long or short stock positions may have been established for future or forward dates on options or futures contracts and the value of such positions [removed: are] [added: is] impacted by interest rates.
Because we indemnify and hold harmless our clearing houses and counterparties from certain liabilities or claims, the use of margin loans and short sales may expose us to significant off\-balance\-sheet risk [removed: in the event that] [added: if] collateral requirements are not sufficient to fully cover losses that customers may incur and those customers fail to satisfy their obligations.
As of December 31, [removed: 2020,] [added: 2021,] we had [removed: $39.3] [added: $54.9] billion in margin loans extended to our customers.
The amount of risk to which we are exposed from the margin loans we extend to our customers and from short sale transactions by our customers is unlimited and not quantifiable as the risk is dependent upon analysis of a [removed: potential] [added: potentially] significant and undeterminable rise or fall in stock prices.
Our credit exposure is to a great extent mitigated by our [removed: policy of] [added: real-time margining system, which] automatically [removed: evaluating] [added: evaluates] each account throughout the trading day and [removed: closing] [added: closes] out positions automatically for accounts that are found to be under\-margined.
We estimate VaR using [removed: an] [added: a] historical approach, which uses the historical daily price returns of underlying assets as well as estimates of the end of day implied volatility for options.
Our one\-day VaR is defined as the unrealized loss in portfolio value that, based on [added: historically observed market risk factors, would have been exceeded with a frequency of one percent, based on a calculation with a confidence interval of 99%.]
Among their benefits, VaR models permit [added: the] estimation of a portfolio’s aggregate market risk exposure, incorporating a range of varied market risks and portfolio assets.
The scenarios are shifts of +/−100, [removed: +/−200] [added: +/−200,] and +/−300 basis points.
| Market Risk Category | | | [removed: 2020] [added: 2021] | | | [removed: 2019] [added: 2020] | | | [removed: 2020] [added: 2021] | | | [removed: 2020] [added: 2021] |
| Equities and [removed: currencies] [added: Currencies] (2) | | $ | [removed: 7] [added: 8] | | $ | 7 | | $ | 8 | | $ | [removed: 9] [added: 10] |
| Trading [removed: total] [added: Total] | | $ | [removed: 7] [added: 8] | | $ | 7 | | $ | 8 | | $ | [removed: 9] [added: 10] |
| Equities and [removed: currencies] [added: Currencies] | | $ | [removed: 20] [added: 18] | | $ | [removed: 17] [added: 20] | | $ | [removed: 17] [added: 20] | | $ | [removed: 20] [added: 59] |
| Fixed [removed: income, other] [added: Income, Other] (4) | | | [removed: 2] [added: 7] | | | 2 | | | 3 | | | [removed: 3] [added: 7] |
| Non-Trading [removed: total] [added: Total] | | $ | [removed: 22] [added: 25] | | $ | [removed: 19] [added: 22] | | $ | [removed: 20] [added: 23] | | $ | [removed: 23] [added: 66] |
The average and high VaR amounts for equities and currencies are based on end of day calculations performed in [removed: 2020.][added: 2021.]
The fixed income stress amounts are based on the four quarter ending calculations performed in [removed: 2020.][added: 2021.]
| | | | | | | | | | | | | | | | | | | | | | | | | |
| --- | --- | --- | --- | --- | --- | --- | --- | --- | --- | --- | --- | --- | --- | --- | --- | --- | --- | --- | --- | --- | --- | --- | --- | --- |
| | | | | As of 12/31/2020 | | | | | | | | | | As of 12/31/2021 | | | | | | | | | | |
| EUR | | 0.09 | | 1.2216 | | | 0.110 | | 11.2% | | | 1,009 | | 1.1372 | | | 0.102 | | 10.6% | | | 1,081 | | \-0.6% |
| CNH | | 0.13 | | 0.1538 | | | 0.020 | | 2.0% | | | 184 | | 0.1572 | | | 0.020 | | 2.1% | | | 216 | | 0.1% |
| HKD | | 0.04 | | 0.1290 | | | 0.005 | | 0.5% | | | 41 | | 0.1283 | | | 0.004 | | 0.5% | | | 47 | | 0.0% |
In currencies with negative rates, we pass through the cost of holding certain cash balances to our customers; therefore, we charge our customers interest on these cash balances.
Our margin balances are priced to a benchmark rate plus a spread, with a minimum charge of 0.75% in U.S. dollars.
At negative or near-zero benchmark rates, our interest sensitivity to rate increases is limited to the extent that a higher benchmark rate plus a spread may still be below the minimum charge.
| | | | | | | | | | | | | | | | | | | | | | | | | | |
| --- | --- | --- | --- | --- | --- | --- | --- | --- | --- | --- | --- | --- | --- | --- | --- | --- | --- | --- | --- | --- | --- | --- | --- | --- | --- |
| | | | | As of 12/31/2019 | | | | | | | | | | | As of 12/31/2020 | | | | | | | | | | |
| EUR | | 0.09 | | 1.1213 | | | 0.101 | | 10.4% | | | 829 | 0.09 | | 1.2216 | | | 0.110 | | 11.2% | | | 1,009 | | 0.8% |
| CNH | | 0.10 | | 0.1437 | | | 0.014 | | 1.5% | | | 118 | 0.13 | | 0.1538 | | | 0.020 | | 2.0% | | | 184 | | 0.6% |
| HKD | | 0.14 | | 0.1284 | | | 0.018 | | 1.9% | | | 147 | 0.04 | | 0.1290 | | | 0.005 | | 0.5% | | | 41 | | \-1.4% |
| MXN | | 0.17 | | 0.0528 | | | 0.009 | | 0.9% | | | 74 | \- | | \- | | | \- | | 0.0% | | | \- | | \-0.9% |
| SEK | | 0.05 | | 0.1068 | | | 0.005 | | 0.6% | | | 44 | \- | | \- | | | \- | | 0.0% | | | \- | | \-0.6% |
| NOK | | 0.03 | | 0.1139 | | | 0.003 | | 0.4% | | | 28 | \- | | \- | | | \- | | 0.0% | | | \- | | \-0.4% |
| DKK | | 0.02 | | 0.1501 | | | 0.003 | | 0.3% | | | 25 | \- | | \- | | | \- | | 0.0% | | | \- | | \-0.3% |
Change in the Composition of the “GLOBAL”
As a result of a periodic assessment, we decided to reduce the number of currencies in the GLOBAL and realign the relative weights of each component to better reflect the global diversification of our business going forward.
We removed the Danish krone (DKK), the Mexican peso (MXN), the Norwegian krone (NOK), and the Swedish krona (SEK).
The new composition contains 10 currencies, down from 14 in the prior composition.
The new composition took effect as of the close of business on June 30, 2020 and the conversion to the new targeted currency holdings took place shortly thereafter.
In addition, the mark-to-market changes in the value
historically observed market risk factors, would have been exceeded with a frequency of one percent, based on a calculation with a confidence interval of 99%.
Item 1. BUSINESS
112 rewritten, 72 added, 21 removed, 332 unchanged
We custody and service accounts for hedge and mutual funds, [removed: exchange traded] [added: exchange-traded] funds (“ETFs”), registered investment advisors, proprietary trading groups, introducing brokers and individual investors.
We specialize in routing orders while striving to achieve best executions and processing trades in stocks, options, futures, foreign exchange instruments (“forex”), bonds, mutual [removed: funds] [added: funds, ETFs, metals] and [removed: ETFs] [added: cryptocurrencies] on more than [removed: 135] [added: 150] electronic exchanges and market centers around the world.
In the United States of America (“U.S.”), we conduct our business primarily from our headquarters in Greenwich, [removed: Connecticut,] [added: Connecticut] and from Chicago, Illinois.
Abroad, we conduct our business through offices located in Canada, the United Kingdom, Ireland, Luxembourg, Switzerland, Hungary, India, China (Hong Kong and Shanghai), Japan, [removed: Singapore,] [added: Singapore] and Australia.
As of December 31, [removed: 2020,] [added: 2021,] we had [removed: 2,033] [added: 2,571] employees worldwide.
IBG, Inc. is a holding company whose primary asset is the ownership of approximately [removed: 21.8%] [added: 23.5%] of the membership interests of IBG LLC, the current holding company for our businesses.
[removed: During that time, we] [added: We] have been a pioneer in developing and applying technology as a financial intermediary to increase liquidity and transparency in the capital markets in which we operate.
The proliferation of electronic exchanges [added: and market centers] since the early 1990s has [removed: provided] [added: allowed] us [removed: with the opportunity] to integrate our software with an increasing number of [removed: exchanges and market centers to create] [added: trading venues, creating] one automatically functioning, computerized platform that requires minimal human intervention.
Over four decades of developing our automated trading platforms and [removed: our automation of] [added: automating] many middle and back office functions have allowed us to become one of the lowest cost providers of broker\-dealer services and [added: to] significantly increase the volume of trades we handle.
We make available free of charge, on or through the investor relations section of our website, this Annual Report on Form 10\-K, Quarterly Reports on Form 10\-Q, Current Reports on Form 8\-K and amendments to those reports filed or furnished pursuant to Section 13(a) or 15(d) of the Securities Exchange Act of 1934, as well as proxy statements, registration statements, prospectus [removed: supplements,] [added: supplements] and Section 16 filings for our directors and officers, as soon as reasonably practicable after we electronically file such material with, or furnish it to, the U.S. Securities and Exchange Commission (“SEC”).
[removed: 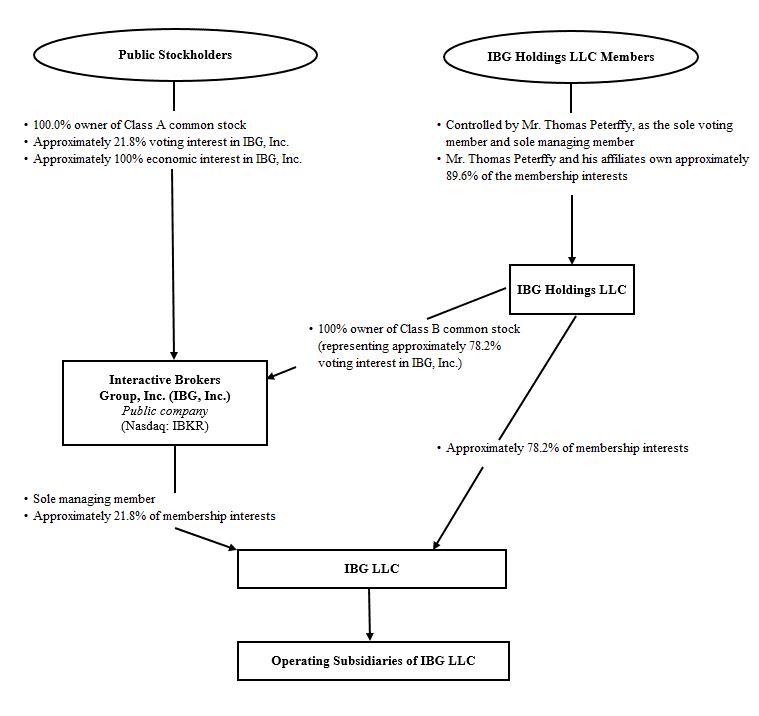][added: Description automatically generated](https://www.sec.gov/Archives/edgar/data/1381197/000138119722000010/ibkr-20211231x10kg001.jpg)]
Our primary assets are our ownership of approximately [removed: 21.8%] [added: 23.5%] of the membership interests of IBG LLC, the current holding company for our businesses, and our controlling interest and related contractual rights as the sole managing member of IBG LLC.
The remaining approximately [removed: 78.2%] [added: 76.5%] of IBG LLC membership interests are held by IBG Holdings LLC (“Holdings”), a holding company that is owned directly and indirectly by our founder and Chairman, Mr. Thomas Peterffy and his affiliates, management and other employees of IBG LLC, and certain other members.
The table below presents the amount of IBG LLC membership interests held by IBG, Inc. and Holdings as of December 31, [removed: 2020.][added: 2021.]
From 2011 through [removed: 2020,] [added: 2021,] the Company issued [removed: 28,127,765] [added: 34,207,307] shares of common stock (with a fair value of [removed: $1,115] [added: $1,491] million) to Holdings in exchange for an equivalent number of shares of member interests in IBG LLC.
We offer our customers access to all classes of tradable, primarily exchange\-listed products, including stocks, options, futures, forex, bonds, mutual [removed: funds] [added: funds, ETFs, metals] and [removed: ETFs] [added: cryptocurrencies] traded on more than [removed: 135] [added: 150] electronic exchanges and market centers in 33 countries and in 25 currencies seamlessly around the world.
The [removed: emerging] [added: ever-growing] complexity of multiple market centers has provided us with [removed: the opportunity] [added: opportunities] to build and [removed: continually] [added: continuously] adapt our order routing software to secure excellent [removed: trade] execution prices.
Since the launching of our electronic brokerage business in 1993, we have grown to [removed: over 1.07] [added: approximately 1.68] million institutional and individual brokerage customers.
No single customer represented more than [removed: 1%] [added: 1.5%] of our commissions in [removed: 2020.][added: 2021.]
*IBKR ProSM* is the [removed: traditional] [added: core] IBKR service designed for sophisticated investors.
IBKR ProSM offers the lowest cost access to stocks, options, futures, forex, bonds, mutual [removed: funds and ETFs on over 135 electronic exchanges] [added: funds, ETFs, metals] and [removed: market centers in 33 countries.][added: cryptocurrencies from a single integrated platform with no added spreads, ticket charges, account minimums or platform fees.]
*IBKR LiteSM* provides unlimited commission-free trades on U.S. exchange-listed stocks and ETFs as well as [removed: low cost] [added: low-cost] access to global markets without required account minimums or [removed: inactivity] [added: platform] fees to participating U.S. customers.
*IBKR Integrated Investment [removed: Account -*] [added: Account* –] From a single point of entry in one IBKR Integrated Investment Account our customers are able to transact in 25 currencies, across multiple classes of tradable, primarily exchange\-listed products traded on more than [removed: 135] [added: 150] electronic exchanges and market centers in 33 countries around the world seamlessly.
*Interactive Brokers Debit Mastercard®* [removed: \-] [added: *and] Interactive Brokers [added: Canada Prepaid Mastercard®* *Card* – Interactive Brokers] Debit Mastercard® [removed: allows] [added: and Interactive Brokers Canada Prepaid Mastercard® Card allow] customers to spend and borrow directly against their account at lower interest rates than credit cards, personal loans and home equity lines of credit, with no monthly minimum payments and no late fees.
Customers can use their card to make purchases and ATM withdrawals anywhere Debit Mastercard®1 [removed: is] [added: or Prepaid Mastercard®1is] accepted around the world.
1 Debit [removed: Mastercard is a trademark] [added: Mastercard® and Prepaid Mastercard® are trademarks] registered to Mastercard International Incorporated Corporation, Delaware, 2000 Purchase Street, Purchase, New York 10577-2405.
*Insured Bank Deposit Sweep Program* [removed: \-] [added: –] Our Insured Bank Deposit Sweep Program provides eligible customers with up to $2,500,000 of Federal Deposit Insurance Corporation (“FDIC”) insurance on their eligible cash balances in addition to the existing $250,000 Securities Investor Protection Corporation (“SIPC”) coverage for total coverage of $2,750,000.
*Investors’ MarketplaceSM* [removed: *-*] [added: –] The Investors’ MarketplaceSM is an expansion of our Money Manager Marketplace and our Hedge Fund Capital Introduction program.
*Mutual Fund Marketplace –* The Mutual Fund Marketplace offers our customers access to more than [removed: 37,000 no-load] [added: 45,000] mutual funds worldwide, including [removed: over 8,300] [added: more than 17,000] no-transaction-fee funds from [removed: more than 380] [added: over 480] fund families*.*
[removed: *Bonds] [added: *Bond] Marketplace* – The [removed: Bonds] [added: Bond] Marketplace allows customers to search for the best yields from a vast universe of bonds from issuers in the Americas, Europe and Asia.
*Low [removed: Costs -*] [added: Costs* –] We provide our customers with among the industry’s lowest overall transaction costs in two ways.
*Automated* *Risk [removed: Controls -*] [added: Controls* –] Throughout the trading day, we calculate margin requirements for each of our customers on a real\-time basis across all product classes and across all currencies.
*Flexible and Customizable [removed: System -*] [added: System* –] Our platform is designed to provide an efficient customer experience, beginning with a highly automated account opening process and ending with [removed: a] fast trade execution and reporting.
When away from their main workstations, customers [removed: are able to] [added: can] access their accounts through our IBKR Mobile platforms for a seamless experience.
*Securities Financing [removed: Services -*] [added: Services* –] We offer a suite of automated Stock Borrow and Lending tools, including our depth of availability, transparent rates, global reach and dedicated service representatives.
Our Stock Yield Enhancement Program allows our customers to lend their fully\-paid stock shares to us in exchange for cash [added: or U.S. Treasury securities] collateral.
We pay our customers [removed: a rebate] [added: interest] on the [removed: cash] collateral [added: value] generally equal to 50% of the income we earn from lending the shares.
*IBKR Campus –* IBKR Campus helps customers learn about the markets, [removed: products] [added: products,] and tools available through our platforms.
*IBKR Refer [removed: A] [added: a] Friend Program* – Under the Refer [removed: A] [added: a] Friend program, we [removed: allow] [added: encourage] existing customers to refer friends and family to IBKR.
*IB Risk NavigatorSM* – We offer [removed: free] to all customers our real\-time market risk management platform that unifies exposure across multiple asset classes around the globe.
![Diagram
| | Ownership % | 23.5% | | 76.5% | | 100.0% |
| | Membership interests | 98,230,127 | | 319,880,492 | | 418,110,619 |
*Request for Payment Service* – Through this new banking service, U.S. customers can make instant deposits, 24 hours a day, from their mobile banking app or other bank portal to fund their brokerage account with us.
Funds deposited via Request for Payment are immediately available for trading.
The service is available to customers with an account at J.P. Morgan Chase and, over time, other banks will be added.
*Cryptocurrency* – Customers, including both individuals and advisors, can trade Bitcoin (BTC), Ethereum (ETH), Litecoin (LTC) and Bitcoin Cash (BCH) through Paxos Trust Company, alongside other asset classes on a single integrated platform.
*U.S. Spot Gold* – Customers can trade U.S. Spot Gold alongside other asset classes from a single integrated account.
In addition, our customers have access to efficient pricing in quantities as small as one ounce and can request physical delivery of their U.S. Spot Gold position.
*No Transaction Fee Program for Exchange*\-*Traded Funds* – We offer a "fee waived" no transaction fee program for ETFs that reimburses IBKR ProSM customers and eligible non-U.S. customers for commissions paid on ETF shares held for at least 30 days.
*Block Trade Desk* – We offer broker\-assisted trading through our *Corporate Bond* and *Stock and Option* block order desks.
The desks help traders execute large or complex orders and monitor trades when customers are unable to do so.
The desks source liquidity, bring SPX color from the pit, offer price discovery services, and help customers calibrate and execute complex algo trading strategies.
In addition, we provide content to Coursera, an online provider of learning content, for a certificate program called *Practical Guide to Trading*.
*IBKR GlobalAnalystSM* *–* Our IBKR GlobalAnalystSM tool, designed for investors who are interested in international portfolio diversification, helps find new opportunities to diversify an investor’s portfolio and discover undervalued companies that may have greater growth potential.
The relative value of global stocks by region, country, industry or individually can be compared, and metrics displayed in one of 27 currencies.
IBKR GlobalAnalystSM can search across business sectors and allows for filtering by region, country and market capitalization.
*PortfolioAnalyst®* – Our PortfolioAnalyst® reporting tool is designed to allow customers to evaluate the performance of their complete financial portfolio.
The tool consolidates data from a customer’s investment, checking, savings, annuity, incentive plans and credit card accounts, calculates GIPS® verified time-weighted and money-weighted returns, and offers robust reporting and benchmarking capabilities.
*IMPACT by Interactive BrokersSM* *–* IMPACT by Interactive BrokersSM (“IMPACT App”) is a unique, simple and intuitive mobile app that helps customers easily align their portfolio with their values, with a goal to help shape the future they wish to see.
The IMPACT App allows customers to select their personal investment criteria from thirteen impact values and principles: Clean Air, Pure Water, Ocean Life, Land Health, Consumer Safety, Ethical Leadership, Gender Equality, Racial Equality, LGBTQ Inclusion, Company Transparency, Sustainable Product Lifecycle, Mindful Business Models and Fair Labor & Thriving Communities.
Customers can also exclude investments based on business practices they would like to avoid.
Based on these preferences, the IMPACT App will show customers how investment opportunities and their portfolio align with their beliefs.
*Charitable Giving –* IBKR GIVESM supports U.S. customers in making charitable donations directly from the IMPACT App.
Using a comprehensive directory of U.S. charities and non-profit organizations from GuideStarTM by Candid, IBKR GIVESM lets customers easily donate to a charity matching their values, or search for a non-profit of their choice.
*Socially Responsible Investing (SRI) Portfolios* – Interactive Advisors offers to customers a selection of thirteen value portfolios grouped into Better Planet, Social Justice and Responsible Management categories.
Interactive Advisors also offers an additional four portfolios grouped under the Smart Beta ESG category.
Customers can also customize any of their portfolios to exclude companies whose business practices concerns them.
In addition, customers can use the Allocation Order Tool to project, preview and allocate trades to take advantage of potential capital losses for all or some of an advisor’s invested customers.
Customers interested in developing programmatic trading utilize our API, which supports multiple programming languages.
In addition, our technical staff uses these displays to monitor the performance of our risk systems at all times across all open markets around the world.
Our model automatically rebalances our positions throughout each trading day to manage risk exposures.
Environmental, Social and Governance
The Company’s Environmental, Social and Governance (“ESG”) Committee, established in early 2020, is responsible for advising on the Company’s ESG strategy, including recommendations on the development of new products and services for our customers, tracking ESG initiatives throughout the Company, and providing training to the Company’s Board of Directors and employees on ESG topics.
*New ESG Tools and Features for our Customers*
Over the last two years we significantly expanded our suite of sustainable trading products by creating new tools and adding ESG features into existing ones.
Using these offerings, our customers can view their investments not just through a financial lens, but also through ESG and “impact” lenses.
These tools provide conscientious investors with a richer, personalized set of data to make more informed investment decisions.
These new tools and features include the IMPACT App, the Impact Dashboard, ESG Scores, Charitable Giving – IBKR GIVESM, and Socially Responsible Investing (SRI) Portfolios, as described above in this Item 1 in the “Nature of Operations” section.
*Social Initiatives*
| | Ownership % | 21.8% | | 78.2% | | 100.0% |
| | Membership interests | 90,780,444 | | 325,960,034 | | 416,740,478 |
*Trade Desk -* We offer broker\-assisted trading through our block trade desk, which is ideal when customers are away from their computer, and through our corporate bond desk, for times when large customer orders need access to more liquidity than is currently available electronically.
*PortfolioAnalyst* – Our PortfolioAnalyst reporting tool is designed to allow customers to evaluate the performance of their portfolio by creating and saving reports based on a set of measurement criteria and optionally comparing their data to selected industry benchmarks.
PortfolioAnalyst also allows customers to link their investment, checking, savings, annuity, incentive plans and credit card accounts to understand their consolidated financial state and plan for the future.
*Greenwich Compliance* – Greenwich Advisor Compliance Services (“Greenwich Compliance") offers direct expert registration and start-up compliance services, as well as answers to basic day-to-day compliance questions for experienced investors and traders looking to start their own investment advisor firms.
Greenwich Compliance professionals have regulatory and industry experience, and can help investment advisors trading on our brokerage platform meet their registration and compliance needs.
Customers interested in developing programmatic trading in Python, Java, C++, .NET (C#), ActiveX and Excel technologies utilize our API.
All new
The strategy of our remaining market making activities is to calculate quotes a few seconds ahead of the market and execute small trades at a tiny but favorable differential as a result.
Our model automatically rebalances our positions throughout each trading day to manage risk exposures on our options and futures positions and the underlying securities, and will price the increased risk that a position would add to the overall portfolio into the bid and offer prices we post.
Our assets and liabilities are marked\-to\-market daily for financial reporting purposes and re\-valued continuously throughout the trading day for risk management and asset/liability management purposes.
Software developed to interface with the accounting and market making systems performs daily profit and loss reconciliations, which provide tight financial controls over our remaining market making activities.
We believe that we fit neither within the definition of a traditional retail broker nor that of a traditional prime broker nor that of an investment advisor custodian.
Our primary competitors, both in the U.S. and abroad, include the prime brokerage and electronic brokerage arms of major commercial and investment banks and brokers, and large online retail brokers, whose offerings target professional and other active traders.
In contrast, the electronic brokerage activities of many of our competitors are relatively insignificant within the totality of their firms’ businesses.
| IB LLC | | $ | 5,122 | | $ | 674 | | $ | 4,448 |
| IBKRFS | | | 640 | | | 22 | | | 618 |
| IBHK | | | 632 | | | 243 | | | 389 |
| | | $ | 7,847 | | $ | 1,062 | | $ | 6,785 |
Before that Mr. Uhde was an analyst at Sloane Robinson, an emerging markets hedge fund.
An excerpt. Shown here: 40 of 112 rewritten, 40 of 72 added and all 21 removed. The counts are complete. For every sentence, read Item 1. BUSINESS in the FY2021 filing and the FY2020 filing.
Item 3. LEGAL PROCEEDINGS AND REGULATORY MATTERS
1 rewritten, 0 added, 0 removed, 22 unchanged
We are [removed: currently] [added: generally] the subject of regulatory inquiries regarding subjects including, but not limited to: audit trail reporting, trade reporting, best execution and order execution procedures, [added: display of market data,] short sales, margin lending, [added: exchange fees charged to customers,] anti\-money laundering or potentially manipulative trading by customers, procedures for accounts managed by independent financial advisors or referred by third parties, technology development practices, record-keeping, business continuity planning and other topics of recent regulatory interest.
Cover and table of contents
17 rewritten, 0 added, 0 removed, 86 unchanged
For the year ended December 31, [removed: 2020][added: 2021]
Indicate by check mark whether the registrant (1) has filed all reports required to be filed by Section 13 or 15(d) of the Securities Exchange Act of 1934 during the preceding 12 months (or for such shorter period that the registrant was required to file such [removed: reports),] [added: reports)] and (2) has been subject to such filing requirements for the past 90 days.
The aggregate market value of the voting and non\-voting common equity stock held by non\-affiliates of the registrant was approximately [removed: $3,155,276,668] [added: $5,475,738,797] computed by reference to the [removed: $41.77] [added: $65.73] closing sale price of the common stock on the Nasdaq Global Select Market, on June 30, [removed: 2020,] [added: 2021,] the last business day of the registrant’s most recently completed second fiscal quarter.
As of February [removed: 25, 2021,] [added: 22, 2022,] there were [removed: 90,780,441] [added: 98,227,883] shares of the issuer’s Class A common stock, par value $0.01 per share, outstanding and 100 shares of the issuer’s Class B common stock, par value $0.01 per share, outstanding.
Documents Incorporated by Reference: Portions of Registrant’s definitive proxy statement for its [removed: 2021] [added: 2022] annual meeting of shareholders are incorporated by reference in Part III of this Form 10\-K.
ANNUAL REPORT ON FORM 10\-K FOR THE YEAR ENDED DECEMBER 31, [removed: 2020][added: 2021]
| ITEM 1A | | [Risk Factors](#RiskFactors) | [removed: 16] [added: 18] |
| ITEM 1B | | [Unresolved Staff Comments](#UnresolvedStaffComments) | [removed: 25] [added: 27] |
| ITEM 2 | | [Properties](#Properties) | [removed: 26] [added: 28] |
| ITEM 3 | | [Legal Proceedings and Regulatory Matters](#LegalProceedings) | [removed: 27] [added: 29] |
| ITEM 4 | | [Mine Safety Disclosures](#MineSafety) | [removed: 27] [added: 29] |
| ITEM 5 | | [Market for Registrant’s Common Equity, Related Stockholder Matters and Issuer Purchases of Equity Securities](#MarketForCommonEquity) | [removed: 28] [added: 30] |
| ITEM 7 | | [Management’s Discussion and Analysis of Financial Condition and Results of Operations](#MDA) | [removed: 30] [added: 32] |
| ITEM 7A | | [Quantitative and Qualitative Disclosures about Market Risk](#MarketRisk) | [removed: 51] [added: 52] |
| ITEM 8 | | [Financial Statements and Supplementary Data](#FinancialStatements) | [removed: 56] [added: 57] |
We have included or incorporated by reference in this Annual Report on Form [removed: 10\-K,] [added: 10\-K] and from time to time our management may make statements that may constitute “forward\-looking statements” within the meaning of the safe harbor provisions of the Private Securities Litigation Reform Act of 1995.
These statements include statements other than historical information or statements of current condition and may relate to our future plans and objectives and results, among other [removed: things,] [added: things] and may also include our belief regarding the effect of various legal proceedings, as set forth under “Legal Proceedings and Regulatory Matters” in Part I, Item 3 of this Annual Report on Form 10\-K, as well as statements about the objectives and effectiveness of our liquidity policies, statements about trends in or growth opportunities for our businesses, included in “Management’s Discussion and Analysis of Financial Condition and Results of Operations” in Part II, Item 7 of this Annual Report on Form 10\-K.
Item 2. PROPERTIES
7 rewritten, 1 added, 0 removed, 17 unchanged
We lease office and data center facilities in [removed: 25] [added: 24] cities throughout the world where we conduct our operations as set forth below.
The table below presents certain information with respect to our leased facilities as of December 31, [removed: 2020.][added: 2021.]
| | Chicago, IL | [removed: 60,276] [added: 61,061] | | Office space and data center | | |
| | Other (9 locations) | [removed: 28,662] [added: 45,602] | | Office space and data center | | |
| | Other [removed: (5] [added: (3] locations) | [removed: 26,016] [added: 14,595] | | Office space | | |
| | Mumbai, India | [removed: 54,275] [added: 81,553] | | Office space | | |
| | Other (4 locations) | [removed: 13,113] [added: 18,969] | | Office space | | |
| | Budapest, Hungary | 22,402 | | Office space | | |
Item 5. MARKET FOR REGISTRANT’S COMMON EQUITY; RELATED STOCKHOLDER MATTERS AND ISSUER PURCHASES OF EQUITY SECURITIES
10 rewritten, 3 added, 5 removed, 26 unchanged
As of February [removed: 19, 2020,] [added: 18, 2022,] there were [removed: 23] [added: 24] holders of record, which does not reflect those shares held beneficially or those shares held in “street” name.
Accordingly, the number of beneficial owners of our common stock exceeds this [removed: number][added: number.]
The graph below compares cumulative total stockholder return on our common stock, the S&P 500 Index and the Nasdaq Financial\-100 Index from December 31, [removed: 2015] [added: 2016] to December 31, [removed: 2020.][added: 2021.]
[removed: 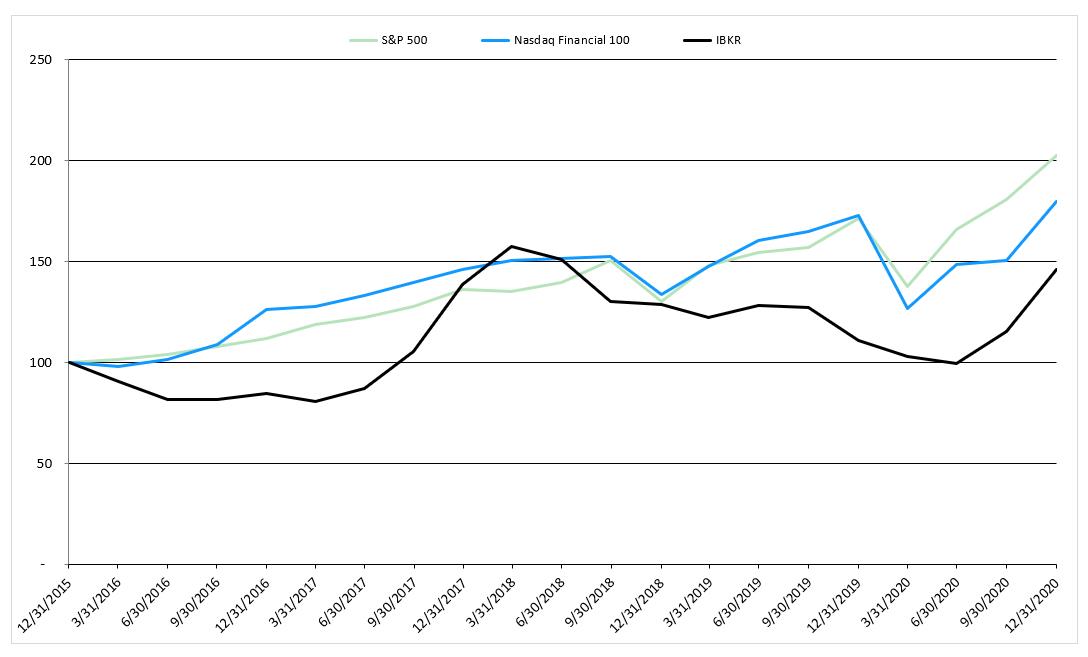][added: Description automatically generated](https://www.sec.gov/Archives/edgar/data/1381197/000138119722000010/ibkr-20211231x10kg002.jpg)]
On July 27, 2020, the Company filed a Prospectus Supplement on Form 424B (File Number 333-240121) with the SEC to [removed: register] [added: re-register] up to 990,000 shares of common stock, offering the opportunity for eligible persons to receive awards in the form of an offer to receive such shares by participating in one or more promotions that are designed to attract new customers to the Company’s brokerage platform, increase assets held with the Company’s brokerage business and enhance customer loyalty.
On [removed: August 20, 2020 and October] [added: July] 30, [removed: 2020,] [added: 2021,] the Company filed a Prospectus Supplement on Form 424B5 with the SEC to issue [removed: 1,000,000] [added: 6,079,542] shares [removed: and 11,710,608 shares, respectively,] of common stock (with a fair value of [removed: $52 million and $557 million, respectively)] [added: $376 million)] in exchange for an equivalent number of shares of member interests in IBG LLC.
As a consequence of these redemption transactions, and distribution of shares to employees, IBG, Inc.’s interest in IBG LLC has increased to approximately [removed: 21.8%,] [added: 23.5%,] with Holdings owning the remaining [removed: 78.2%] [added: 76.5%] as of December 31, [removed: 2020.][added: 2021.]
The redemptions also resulted in an increase in the Holdings interest held by Mr. Thomas Peterffy and his affiliates from approximately 84.6% at the IPO to approximately [removed: 89.6%] [added: 90.5%] as of December 31, [removed: 2020.][added: 2021.]
The table below presents information about shares of common stock available for future awards under all the Company’s equity compensation plans as of December 31, [removed: 2020.][added: 2021.]
| approved by security holders | N/A | | N/A | | [removed: 3,520,149] [added: 2,488,700] |
] [added: Firm (PCAOB ID No.](#Audit_Opinion) 34)] | [removed: 57] [added: 58] |
| [Consolidated Statements of Financial Condition as of December 31, [removed: 2020] [added: 2021] and [removed: 2019](#BalanceSheet)] [added: 2020](#BalanceSheet)] | [removed: 59] [added: 60] |
| [Consolidated Statements of Comprehensive Income for the years ended December 31, [added: 2021,] 2020, [removed: 2019,] and [removed: 20](#IS)18] [added: 20](#IS)19] | [removed: 60] [added: 61] |
| [Consolidated Statements of Cash Flows for the years ended December 31, [added: 2021,] 2020, [removed: 2019,] and [removed: 2018](#StatementOfCashFlows)] [added: 2019](#StatementOfCashFlows)] | [removed: 61] [added: 62] |
| [Consolidated Statements of Change in Equity for the years ended December 31, [added: 2021,] 2020, [removed: 2019,] and [removed: 201](#SSE)8] [added: 201](#SSE)9] | [removed: 62] [added: 63] |
| [Notes to Consolidated Financial Statements](#FinancialStatementNotes) | [removed: 63] [added: 64] |
We have audited the accompanying consolidated statements of financial condition of Interactive Brokers Group, Inc. and subsidiaries (the "Company") as of December 31, [removed: 2020] [added: 2021] and [removed: 2019,] [added: 2020,] the related consolidated statements of comprehensive income, changes in equity, and cash flows, for each of the three years in the period ended December 31, [removed: 2020,] [added: 2021,] and the related notes (collectively referred to as the "financial statements").
In our opinion, the financial statements present fairly, in all material respects, the financial position of the Company as of December 31, [removed: 2020] [added: 2021] and [removed: 2019,] [added: 2020,] and the results of its operations and its cash flows for each of the three years in the period ended December 31, [removed: 2020,] [added: 2021,] in conformity with accounting principles generally accepted in the United States of America.
We have also audited, in accordance with the standards of the Public Company Accounting Oversight Board (United States) (PCAOB), the Company's internal control over financial reporting as of December 31, [removed: 2020,] [added: 2021,] based on criteria established in *Internal Control — Integrated Framework (2013)* issued by the Committee of Sponsoring Organizations of the Treadway Commission and our report dated February [removed: 26, 2021,] [added: 25, 2022,] expressed an unqualified opinion on the Company's internal control over financial reporting.
| (in millions, except share [added: or per share] amounts) | | [added: 2021 | | |] 2020 | | | 2019 | |
| Cash and cash equivalents | | [removed: $] | [added: 2,395 | | |] 4,292 | | [removed: $] | 2,882 |
| Cash [removed: -] segregated for regulatory purposes | | | [added: 22,888 | | |] 15,903 | | | 9,400 |
| Securities - segregated for regulatory purposes | | | [removed: 27,821] [added: 15,121] | | | [removed: 17,824] [added: 27,821] |
| Securities borrowed | | | [removed: 4,956] [added: 3,912] | | | [removed: 3,916] [added: 4,956] |
| Securities purchased under agreements to resell | | | [removed: 792] [added: 4,380] | | | [removed: 3,111] [added: 792] |
| Financial instruments owned | | | [removed: 544] [added: 559] | | | [removed: 1,755] [added: 544] |
| Financial instruments owned and pledged as collateral | | | [removed: 86] [added: 114] | | | [removed: 161] [added: 86] |
| Total financial instruments owned, at fair value | | | [removed: 630] [added: 673] | | | [removed: 1,916] [added: 630] |
| Customers, less allowance for credit losses of [removed: $17] [added: $8] and [removed: $86] [added: $17] as of December 31, [removed: 2020] [added: 2021] and [removed: 2019] [added: 2020] | | | [removed: 39,333] [added: 54,935] | | | [removed: 31,304] [added: 39,333] |
| Brokers, dealers and clearing organizations | | | [removed: 1,254] [added: 3,771] | | | [removed: 685] [added: 1,254] |
| Interest | | | [removed: 104] [added: 127] | | | [removed: 158] [added: 104] |
| Total receivables | | | [removed: 40,691] [added: 58,833] | | | [removed: 32,147] [added: 40,691] |
| Other assets | | | [removed: 594] [added: 911] | | | [removed: 480] [added: 594] |
| Total assets | | $ | [removed: 95,679] [added: 109,113] | | $ | [removed: 71,676] [added: 95,679] |
| Short-term borrowings | | $ | [removed: 118] [added: 27] | | $ | [removed: 16] [added: 118] |
| Securities loaned | | | [removed: 9,838] [added: 11,769] | | | [removed: 4,410] [added: 9,838] |
| Securities sold under [removed: agreements] [added: agreement] to repurchase | | | — | | | [added: (1,909) | | |] 1,909 |
| Financial instruments sold, but not yet purchased, at fair value | | | [removed: 153] [added: 182] | | | [removed: 457] [added: 153] |
| Customers | | | [removed: 75,882] [added: 85,634] | | | [removed: 56,248] [added: 75,882] |
| Brokers, dealers and clearing organizations | | | [removed: 182] [added: 557] | | | [removed: 220] [added: 182] |
| Affiliate | | | [removed: 199] [added: 222] | | | [removed: 152] [added: 199] |
| Accounts payable, accrued expenses and other liabilities | | | [removed: 298] [added: 492] | | | [removed: 295] [added: 298] |
| Interest | | | [removed: 6] [added: 8] | | | [removed: 29] [added: 6] |
| Total payables | | | [removed: 76,567] [added: 86,913] | | | [removed: 56,944] [added: 76,567] |
| Total liabilities | | | [removed: 86,676] [added: 98,891] | | | [removed: 63,736] [added: 86,676] |
| Class A – Authorized - 1,000,000,000, Issued - [removed: 90,909,889] [added: 98,359,572] and [removed: 76,889,040] [added: 90,909,889] shares, Outstanding – [removed: 90,773,105] [added: 98,204,658] and [removed: 76,750,110] [added: 90,773,105] shares as of December 31, [removed: 2020] [added: 2021] and [removed: 2019] [added: 2020] | | | 1 | | | 1 |
| Class B – Authorized, Issued and Outstanding – 100 shares as of December 31, [removed: 2020] [added: 2021] and [removed: 2019] [added: 2020] | | | — | | | — |
| Additional paid-in capital | | | [removed: 1,244] [added: 1,442] | | | [removed: 934] [added: 1,244] |
| Retained earnings | | | [removed: 683] [added: 953] | | | [removed: 520] [added: 683] |
| Accumulated other comprehensive income, net of income taxes of $0 and $0 as of December 31, [removed: 2020] [added: 2021] and [removed: 2019] [added: 2020] | | | [removed: 26] [added: 4] | | | [removed: —] [added: 26] |
February 25, 2022
| Net income available for common stockholders | | $ | 308 | | $ | 195 | | $ | 161 |
| Shares distributed to customers under IBKR Promotions | | | 9 | | | — | | | — |
| Cash, cash equivalents and restricted cash at end of period | | $ | 25,283 | | $ | 20,195 | | $ | 12,282 |
| Issuance of common stock - Promotions | | 150,000 | | | | | | 3 | | | (11) | | | | | | | | | (8) | | | 8 | | | — |
| Net distribution of common stock - IBKR Promotion | | | | | | | | | | | 9 | | | | | | | | | 9 | | | | | | 9 |
| Comprehensive income | | | | | | | | | | | | | | 308 | | | (22) | | | 286 | | | 1,253 | | | 1,539 |
| Balance, December 31, 2021 | | 98,359,572 | | $ | 1 | | $ | 1,442 | | $ | (5) | | $ | 953 | | $ | 4 | | $ | 2,395 | | $ | 7,827 | | $ | 10,222 |
Precious metals are valued using an internal model, which incorporates the exchange-traded futures price of the underlying instruments, benchmark interest rates and estimated storage costs, and are classified as Level 2 of the fair value hierarchy since the significant inputs to their valuation are observable.
| | | $ | 15,121 | | $ | 27,821 |
Amounts receivable from customers that are
| | | 2021 | | | 2020 | |
The Company’s IBKR LiteSM offering provides commission-free trades on U.S. exchange-listed stocks and ETFs and generates no commission revenues from customers on these trades.
| Business Combinations (Topic 805) *Issued October 2021* | | Requires companies to recognize and measure contract assets and contract liabilities acquired in a business combination in accordance with Topic 606, “Revenue from Contracts with Customers”. At the acquisition date, an acquirer should account for the related revenue contracts as if it had originated the contracts. | | Effective date: January 1, 2023. The changes are not expected to have a material impact on the Company’s consolidated financial statements. |
| | Ownership % | 23.5% | | 76.5% | | 100.0% |
| | Membership interests | 98,230,127 | | 319,880,492 | | 418,110,619 |
platform, increase assets held with the Company’s brokerage business and enhance customer loyalty.
From 2019 through 2021, the Company issued 170,000 shares to IBG LLC for distribution to eligible customers of certain of its subsidiaries.
| Net income available for common stockholders | | $ | 308 | | $ | 195 | | $ | 161 |
| Net income available for common stockholders | | $ | 308 | | $ | 195 | | $ | 161 |
| Comprehensive income available for common stockholders | | $ | 286 | | $ | 221 | | $ | 165 |
| Basic | | | 94,167,572 | | | 79,939,289 | | | 76,121,570 |
| Diluted | | | 95,009,880 | | | 80,638,908 | | | 76,825,863 |
| Stocks | | | 548 | | | — | | | — | | | 548 |
| Precious metals | | | — | | | 10 | | | — | | | 10 |
| Stocks | | $ | 144 | | $ | — | | $ | — | | $ | 144 |
| Precious metals | | | — | | | 6 | | | — | | | 6 |
| Accounts payable, accrued expenses and other liabilities | | | 166 | | | — | | | — | | | 166 |
| | | December 31, 2021 | | | | | | | | | | | | | |
| Receivables from customers | | | 54,935 | | | 54,935 | | | — | | | 54,935 | | | — |
| Payables to customers | | | 85,634 | | | 85,634 | | | — | | | 85,634 | | | — |
| | | December 31, 2021 | | | | | | | | | | | | | | | |
| Securities borrowed | | | 3,912 | | | | — | | | | 3,912 | | | (3,642) | | | 270 |
| Options | | | 22 | | | | — | | | | 22 | | | (19) | | | 3 |
| Total | | $ | 18,745 | | | $ | — | | | $ | 18,745 | | $ | (18,433) | | $ | 312 |
| Securities loaned | | $ | 11,769 | | | $ | — | | | $ | 11,769 | | $ | (10,992) | | $ | 777 |
| Options | | | 22 | | | | — | | | | 22 | | | (19) | | | 3 |
| Total | | $ | 11,801 | | | $ | — | | | $ | 11,801 | | $ | (11,011) | | $ | 790 |
| | | December 31, 2021 | | | | | | | | | | | | | |
| Stocks | | $ | 11,715 | | $ | — | | $ | — | | $ | — | | $ | 11,715 |
February 26, 2021
| | | | | | | |
| --- | --- | --- | --- | --- | --- | --- |
Interactive Brokers Group, Inc. and Subsidiaries
| | | | | | | | | | |
| Securities sold under agreement to repurchase | | | (1,909) | | | 1,909 | | | (1,316) |
| Balance, December 31, 2017 | | 71,609,049 | | $ | 1 | | $ | 832 | | $ | (3) | | $ | 251 | | $ | 9 | | $ | 1,090 | | $ | 5,343 | | $ | 6,433 |
| Comprehensive income | | | | | | | | | | | | | | 169 | | | (13) | | | 156 | | | 890 | | | 1,046 |
Notes to Consolidated Financial Statements
In March 2020, the World Health Organization recognized the outbreak of the Coronavirus Disease 2019 (“COVID-19”) caused by a novel strain of the coronavirus as a pandemic.
The pandemic affects all countries in which the Company operates.
The response of governments and societies to the COVID-19 pandemic, which includes temporary closures of certain businesses; social distancing; travel restrictions, “shelter in place” and other governmental regulations; and reduced consumer spending due to job losses, has significantly impacted volatility in the financial, commodities and energy markets, and general economic conditions.
The effects of the COVID-19 pandemic on the Company’s financial results for 2020 can be summarized as follows: (1) higher commission revenue due to increased trading activity and a higher rate of customer accounts opened during this period; and (2) lower net interest income resulting from lower benchmark interest rates.
The impact of the COVID-19 pandemic on the Company’s future financial results could be significant but currently cannot be quantified, as it will depend on numerous evolving factors that currently cannot be accurately predicted, including, but not limited to, the duration and spread of the pandemic; its impact on the Company’s customers, employees and vendors; governmental actions in response to the pandemic; and the overall impact of the pandemic in the economy and society; among other factors.
Any of these events could have significant accounting and financial reporting implications (i.e., reassessing accounting estimates related to credit losses, valuation of certain investments, deferred tax assets and contingency reserves).
The Company has reviewed its assumptions related to the above estimates and have not made any adjustments.
Consolidated Statements of Comprehensive Income and Operating Business Segment Presentation Changes
As previously disclosed in the Company’s Form 10-Q for the quarter ended March 31, 2017 and in subsequent filings, the Company intended to eliminate the reporting of separate operating business segments upon its determination that the continued wind-down of the Company’s market making activities rendered it no longer reportable as a business segment.
Pursuant to the requirements of FASB ASC Topic 280, “Segment Reporting,” the Company performed a quantitative and a qualitative assessment of its business and determined that its remaining market making activities no longer support the Company’s reporting of separate business segments.
Accordingly, effective the first quarter of 2020 the Company discontinued the reporting of separate business segments.
Since the Company’s decision to wind down its market making activities, management has continued to shift its focus to growing and strengthening the Company’s electronic brokerage business.
The Company believes the elimination of segment reporting aligns its financial reporting with its business strategy and management’s focus on the electronic brokerage business.
For each of the eight quarters during 2018 and 2019, the market making segment’s contribution to the Company’s consolidated net revenues, income before income taxes, and total assets did not exceed 7%, 4%, and 6%, respectively.
As a result, effective the first quarter of 2020, the Company modified the presentation of its segment financial information with retrospective application to all prior periods presented.
In addition, effective the first quarter of 2020, the Company changed the presentation of its consolidated statements of comprehensive income to better align with its business strategy.
As a result, the Company made the following reclassifications to amounts reported in its consolidated statements of comprehensive income for the years ended December 31, 2019 and 2018:
*Other fees and services* – reclassified $141 million and $148 million for the years ended December 31, 2019 and 2018 respectively, previously reported as other income to other fees and services, which includes market data fees, account activity fees, risk exposure fees, order flow income from options exchange-mandated programs, and revenues from other fees and services.
These items have been historically reported as a component of other income.
*Other income* – reclassified $27 million and $39 million for the years ended December 31, 2019 and 2018 respectively, previously reported as trading gains to other income as a component of “principal transactions.” Other income includes gains (losses) from principal transactions; the impact of the currency diversification strategy; gains (losses) from equity method investments; and other revenues not directly attributable to the Company’s core business offerings.
Previously reported amounts in the consolidated statements of comprehensive income and notes to the consolidated financial statements have been adjusted to conform to the current presentation.
On January 1, 2020, the Company adopted FASB ASC Topic 326 – “Financial Instruments – Credit Losses” (“ASC Topic 326”) which replaces the incurred loss methodology with the current expected credit loss (“CECL”) methodology.
The Company adopted ASC Topic 326 using the modified retrospective approach for all in-scope assets, which did not result in an adjustment to the opening balance in retained earnings.
Results for reporting periods beginning after January 1, 2020 are presented under ASC Topic 326 while prior periods continue to be reported in accordance with previously applicable U.S. GAAP.
| | | $ | 27,821 | | $ | 17,824 |
Customer securities transactions are recorded on a settlement date basis and customer commodities transactions are recorded on a trade date basis.
comprehensive income.
equipment.
On January 1, 2019, the Company adopted FASB ASC Topic 842, “Leases,” (“ASC Topic 842”) which requires that a lessee recognize in the statement of financial condition a lease liability and a corresponding right-of-use asset, including for those leases that the Company had classified as operating leases.
The right-of-use asset and the lease liability were initially measured using the present value of the remaining lease payments.
An excerpt. Shown here: 40 of 420 rewritten, 40 of 120 added and 40 of 130 removed. The counts are complete. For every sentence, read Item 8. FINANCIAL STATEMENTS AND SUPPLEMENTARY DATA in the FY2021 filing and the FY2020 filing.
Item 9A. CONTROLS AND PROCEDURES
8 rewritten, 1 added, 1 removed, 36 unchanged
The APC is comprised of [removed: eight (8)] [added: six (6)] experienced subject matter experts from within the Company’s accounting and regulatory disciplines, and includes the CFO and the Chief Accounting Officer.
Management, including our CEO and our CFO, assessed the effectiveness of IBG, Inc.’s internal control over financial reporting as of December 31, [removed: 2020.][added: 2021.]
Based on management’s assessment and those criteria, management concluded that IBG, Inc. maintained effective internal control over financial reporting as of December 31, [removed: 2020.][added: 2021.]
The effectiveness of the Company’s internal control over financial reporting as of December 31, [removed: 2019,] [added: 2021,] has been audited by Deloitte & Touche LLP, an independent registered public accounting firm, as stated in their report, which appears herein.
No changes to our internal control over financial reporting for the year ended December 31, [removed: 2020] [added: 2021] have materially affected, or are reasonably likely to materially affect, our internal control over financial reporting.
We have audited the internal control over financial reporting of Interactive Brokers Group, Inc. and subsidiaries (the “Company”) as of December 31, [removed: 2019,] [added: 2021,] based on criteria established in *Internal Control — Integrated Framework (2013)* issued by the Committee of Sponsoring Organizations of the Treadway Commission (COSO).
In our opinion, the Company maintained, in all material respects, effective internal control over financial reporting as of December 31, [removed: 2020,] [added: 2021,] based on criteria established in *Internal Control — Integrated Framework (2013)* issued by COSO.
We have also audited, in accordance with the standards of the Public Company Accounting Oversight Board (United States) (PCAOB), the consolidated statements of financial condition as of December 31, [removed: 2020] [added: 2021] and [removed: 2019] [added: 2020] and the related consolidated statements of comprehensive income, cash flows, and changes in equity for each of the three years in the period [added: ended] December 31, [removed: 2020 ,] [added: 2021,] of the Company and our report dated February [removed: 26, 2021,] [added: 25, 2022,] expressed an unqualified opinion on those financial statements.
February 25, 2022
February 26, 2021
Item 14. PRINCIPAL ACCOUNTANT FEES AND SERVICES
1 rewritten, 0 added, 0 removed, 2 unchanged
- “Item [removed: 3] [added: 2] - Ratification of Appointment of Independent Registered Public Accounting Firm”
Item 15. EXHIBITS AND FINANCIAL STATEMENT SCHEDULES
12 rewritten, 0 added, 0 removed, 38 unchanged
| 4.1 | [Description of the Registrant’s [removed: Securities](https://www.sec.gov/Archives/edgar/data/1381197/000138119721000008/ibkr-20201231xex4_1.htm).] [added: Securities.](https://www.sec.gov/Archives/edgar/data/1381197/000138119722000010/ibkr-20211231xex4_1.htm)] |
| 21.1 | [Subsidiaries of the [removed: registrant](https://www.sec.gov/Archives/edgar/data/1381197/000138119721000008/ibkr-20201231xex21_1.htm).] [added: registrant.](https://www.sec.gov/Archives/edgar/data/1381197/000138119722000010/ibkr-20211231xex21_1.htm)] |
| 23.1 | [Consent of Independent Registered Public Accounting [removed: Firm](https://www.sec.gov/Archives/edgar/data/1381197/000138119721000008/ibkr-20201231xex23_1.htm).] [added: Firm.](https://www.sec.gov/Archives/edgar/data/1381197/000138119722000010/ibkr-20211231xex23_1.htm)] |
| 31.1 | [Certification of Chief Executive Officer, pursuant to Section 302 of the Sarbanes\-Oxley Act of [removed: 2002](https://www.sec.gov/Archives/edgar/data/1381197/000138119721000008/ibkr-20201231xex31_1.htm).] [added: 2002.](https://www.sec.gov/Archives/edgar/data/1381197/000138119722000010/ibkr-20211231xex31_1.htm)] |
| 31.2 | [Certification of Chief Financial Officer, pursuant to Section 302 of the Sarbanes\-Oxley Act of [removed: 2002](https://www.sec.gov/Archives/edgar/data/1381197/000138119721000008/ibkr-20201231xex31_2.htm).] [added: 2002.](https://www.sec.gov/Archives/edgar/data/1381197/000138119722000010/ibkr-20211231xex31_2.htm)] |
| 32.1 | [Certification of Chief Executive Officer, pursuant to Section 906 of the Sarbanes\-Oxley Act of [removed: 2002](https://www.sec.gov/Archives/edgar/data/1381197/000138119721000008/ibkr-20201231xex32_1.htm).] [added: 2002.](https://www.sec.gov/Archives/edgar/data/1381197/000138119722000010/ibkr-20211231xex32_1.htm)] |
| 32.2 | [Certification of Chief Financial Officer, pursuant to Section 906 of the Sarbanes\-Oxley Act of [removed: 2002](https://www.sec.gov/Archives/edgar/data/1381197/000138119721000008/ibkr-20201231xex32_2.htm).] [added: 2002.](https://www.sec.gov/Archives/edgar/data/1381197/000138119722000010/ibkr-20211231xex32_2.htm)] |
* Attached as Exhibit 101 to this Annual Report on Form 10\-K for the annual period ended December 31, [removed: 2020,] [added: 2021,] are the following materials formatted in iXBRL (Inline eXtensible Business Reporting Language) (i) the Consolidated Statements of Financial Condition, (ii) the Consolidated Statements of Comprehensive Income, (iii) the Consolidated Statements of Cash Flows, (iv) the Consolidated Statements of Changes in Stockholders’ Equity and (v) Notes to the Consolidated Financial Statements tagged in detail levels 1\-4.
| [Report of Independent Registered Public Accounting Firm](#PC_AuditOpinion) [added: (PCAOB ID No. 34)] | F - 1 |
| [Condensed Statements of Financial Condition as of December 31, [removed: 2020] [added: 2021] and [removed: 2019](#PC_Balance_Sheet)] [added: 2020](#PC_Balance_Sheet)] | F - 2 |
| [Condensed Statements of Comprehensive Income for the Years ended December 31, [added: 2021,] 2020, [removed: 2019,] and [removed: 2018](#PC_Income_Statement)] [added: 2019](#PC_Income_Statement)] | F - 3 |
| [Condensed Statements of Cash Flow for the Years ended December 31, [added: 2021,] 2020, [removed: 2019,] and [removed: 201](#PC_Cash_Flows)8] [added: 2019](#PC_Cash_Flows)] | F - 4 |
Item 16. 10-K SUMMARY
49 rewritten, 7 added, 2 removed, 106 unchanged
We have audited the consolidated financial statements of Interactive Brokers Group, Inc. and subsidiaries (the “Company”) as of December 31, [removed: 2020] [added: 2021] and [removed: 2019,] [added: 2020,] and for each of the three years in the period ended December 31, [removed: 2020,] [added: 2021,] and the Company’s internal control over financial reporting as of December 31, [removed: 2020,] [added: 2021,] and have issued our reports thereon dated February [removed: 26, 2021;] [added: 25, 2022;] such consolidated financial statements and reports are included elsewhere in this Form 10-K.
| (in millions, except share amounts) | | [removed: 2020] [added: 2021] | | | [removed: 2019] [added: 2020] | |
| Cash and cash equivalents | | $ | [removed: 4] [added: —] | | $ | [removed: 1] [added: 4] |
| Investments in subsidiaries, equity basis | | | [removed: 1,962] [added: 2,400] | | | [removed: 1,469] [added: 1,962] |
| Other assets | | | [removed: 205] [added: 236] | | | [removed: 143] [added: 205] |
| Total assets | | $ | [removed: 2,171] [added: 2,636] | | $ | [removed: 1,613] [added: 2,171] |
| Payable to affiliates | | $ | [removed: 199] [added: 222] | | $ | [removed: 152] [added: 199] |
| Accrued expenses and other liabilities | | | [removed: 21] [added: 19] | | | [removed: 9] [added: 21] |
| Class A – Authorized - 1,000,000,000, Issued - [removed: 90,909,889] [added: 98,359,572] and [removed: 76,889,040] [added: 90,909,889] shares, Outstanding – [removed: 90,773,105] [added: 98,204,658] and [removed: 76,750,110] [added: 90,773,105] shares as of December 31, [removed: 2020] [added: 2021] and [removed: 2019] [added: 2020] | | | 1 | | | 1 |
| Class B – Authorized, Issued and Outstanding – 100 shares as of December 31, [removed: 2020] [added: 2021] and [removed: 2019] [added: 2020] | | | — | | | — |
| Additional paid-in capital | | | [removed: 1,244] [added: 1,442] | | | [removed: 934] [added: 1,244] |
| Retained earnings | | | [removed: 683] [added: 953] | | | [removed: 520] [added: 683] |
| Accumulated other comprehensive income, net of income taxes of $0 and $0 as of December 31, [removed: 2020] [added: 2021] and [removed: 2019] [added: 2020] | | | [removed: 26] [added: 4] | | | [removed: —] [added: 26] |
| Treasury stock, at cost, [removed: 136,784] [added: 154,914] and [removed: 138,930] [added: 136,784] shares as of December 31, [removed: 2020] [added: 2021] and [removed: 2019] [added: 2020] | | | [removed: (3)] [added: (5)] | | | (3) |
| Total equity | | | [removed: 1,951] [added: 2,395] | | | [removed: 1,452] [added: 1,951] |
| Total liabilities and equity | | $ | [removed: 2,171] [added: 2,636] | | $ | [removed: 1,613] [added: 2,171] |
| (in millions) | | [removed: 2020] [added: 2021] | | | [removed: 2019] [added: 2020] | | | [removed: 2018] [added: 2019] | |
| Income (loss) before income from subsidiaries | | $ | [removed: (3)] [added: —] | | $ | [removed: (2)] [added: (3)] | | $ | [removed: 2] [added: (2)] |
| Undistributed gains of subsidiaries, net | | | [removed: 237] [added: 383] | | | [removed: 208] [added: 237] | | | [removed: 206] [added: 208] |
| Income tax expense | | | [removed: 39] [added: 75] | | | [removed: 45] [added: 39] | | | [removed: 39] [added: 45] |
| Net income | | $ | [removed: 195] [added: 308] | | $ | [removed: 161] [added: 195] | | $ | [removed: 169] [added: 161] |
| Net income available for common stockholders | | $ | [removed: 195] [added: 308] | | $ | [removed: 161] [added: 195] | | $ | [removed: 169] [added: 161] |
| Cumulative translation adjustment, net of tax | | | [removed: 26] [added: (22)] | | | [removed: 4] [added: 26] | | | [removed: (13)] [added: 4] |
| Comprehensive income available for common stockholders | | $ | [removed: 221] [added: 286] | | $ | [removed: 165] [added: 221] | | $ | [removed: 156] [added: 165] |
| Undistributed gains of subsidiaries, net | | | [removed: (237)] [added: (383)] | | | [removed: (208)] [added: (237)] | | | [removed: (206)] [added: (208)] |
| Deferred income taxes | | | [removed: 15] [added: 18] | | | [removed: 23] [added: 15] | | | 23 |
| (Gain) loss on remeasurement of Tax Receivable Agreement liability | | | [removed: 3] [added: (1)] | | | [removed: —] [added: 3] | | | [removed: (3)] [added: —] |
| Changes in operating assets and liabilities | | | [removed: (17)] [added: 21] | | | [removed: (1)] [added: (17)] | | | [removed: 15] [added: (1)] |
| Net cash used in operating activities | | | [removed: (41)] [added: (37)] | | | [removed: (25)] [added: (41)] | | | [removed: (2)] [added: (25)] |
| Cash flows provided by investing activities | | | [removed: 67] [added: 111] | | | [removed: 81] [added: 67] | | | [removed: 74] [added: 81] |
| Cash flows used in financing activities | | | [removed: (49)] [added: (56)] | | | [removed: (60)] [added: (49)] | | | [removed: (58)] [added: (60)] |
| Effect of exchange rate changes on cash and cash equivalents | | | [removed: 26] [added: (22)] | | | [removed: 4] [added: 26] | | | [removed: (13)] [added: 4] |
| Net increase in cash and cash equivalents | | | [removed: 3] [added: (4)] | | | [removed: —] [added: 3] | | | [removed: 1] [added: —] |
| Cash and cash equivalents at beginning of period | | | [removed: 1] [added: 4] | | | 1 | | | [removed: —] [added: 1] |
| Cash and cash equivalents at end of period | | $ | [removed: 4] [added: —] | | $ | [removed: 1] [added: 4] | | $ | 1 |
| Cash paid for interest | | $ | [removed: —] [added: 1] | | $ | [removed: 2] [added: —] | | $ | [removed: 1] [added: 2] |
| Cash paid for taxes, net | | $ | [removed: 16] [added: 57] | | $ | [removed: 20] [added: 16] | | $ | [removed: 14] [added: 20] |
| Non-cash distributions from subsidiaries | | $ | 1 | | $ | [removed: —] [added: 1] | | $ | [removed: 2] [added: —] |
IBG, Inc.’s primary asset is its ownership interest in IBG LLC, an automated global electronic broker specializing in executing and clearing trades in stocks, options, futures, foreign exchange instruments, bonds, mutual [removed: funds,] [added: funds] and [removed: exchange traded] [added: exchange-traded] funds (“ETFs”) on more than [removed: 135] [added: 150] electronic exchanges and market centers around the world and offering custody, prime brokerage, securities and margin lending services to customers.
As of December 31, [removed: 2020,] [added: 2021,] receivables from affiliates was immaterial and as of December 31, [removed: 2019,] [added: 2020,] there were no receivables from affiliates.
February 25, 2022
| | | | | | | |
| | | | 241 | | | 220 |
| (in millions) | | 2021 | | | 2020 | | | 2019 | |
| | | | | | | | | | |
| Net income | | $ | 308 | | $ | 195 | | $ | 161 |
| | | | | | | | | | |
February 26, 2021
| | | | 220 | | | 161 |
An excerpt. Shown here: 40 of 49 rewritten, all 7 added and all 2 removed. The counts are complete. For every sentence, read Item 16. 10-K SUMMARY in the FY2021 filing and the FY2020 filing.