 filings.tools
Item 7. MANAGEMENT’S DISCUSSION AND ANALYSIS OF FINANCIAL CONDITION AND RESULTS OF OPERATIONS.
101K characters. Original on sec.gov · Markdown
Item 7. MANAGEMENT’S DISCUSSION AND ANALYSIS OF FINANCIAL CONDITION AND RESULTS OF OPERATIONS.
(UNLESS INDICATED OTHERWISE, DOLLARS IN MILLIONS EXCEPT PER SHARE AMOUNTS)
Overview
Company background
We are a leading innovator of sensory experiences that move the world. Our creative capabilities, global footprint, regulatory and technological know-how provide us a competitive advantage in meeting the demands of our global, regional and local customers around the world. The 2018 acquisition of Frutarom solidified our position as an industry leader across an expanded portfolio of products, resulting in a broader customer base across small, mid-sized and large companies and an expansion to new adjacencies that provides a platform for significant cross-selling opportunities.
Beginning in the first quarter of fiscal year 2020, we are operating our business across two segments, Taste and Scent. As part of this new operating model, nearly all of the former Frutarom business segment was consolidated with the Taste segment. The financial results presented in this Form 10-K reflect the Taste, Scent and legacy Frutarom business segments prior to the realignment.
As a leading creator of flavor offerings, we help our customers deliver on the promise of delicious and healthy foods and drinks that appeal to consumers. While we are a global leader, our Taste business is more regional in nature, with different formulas that reflect local taste preferences. Consequently, we manage our Taste business geographically, creating products in our regional creative centers which allow us to satisfy local taste preferences, while also helping to ensure regulatory compliance and production standards. We develop thousands of different flavors and taste offerings for our customers, most of which are tailor-made. We continually develop new formulas to meet changing consumer preferences and customer needs.
Our global Scent business creates fragrance compounds and fragrance ingredients that are integral elements in the world’s finest perfumes and best-known household and personal care products. We believe our innovative technologies, consumer insight and customer intimacy make us a market leader in scent.
Pending Transaction with Nutrition & Biosciences, Inc.
On December 15, 2019, we entered into definitive agreements with DuPont de Nemours, Inc. (“DuPont”), including an Agreement and Plan of Merger, pursuant to which DuPont will transfer its nutrition and biosciences business (the “N&B Business”) to Nutrition & Biosciences, Inc., a Delaware corporation and wholly owned subsidiary of DuPont (“N&B”), and N&B will merge with and into a wholly owned subsidiary of IFF in exchange for a number of shares of IFF common stock, par value $0.125 per share (“IFF Common Stock”) (collectively, the “DuPont N&B Transaction”). In connection with the transaction, DuPont will receive a one-time $7.3 billion special cash payment (the “Special Cash Payment”), subject to certain adjustments. As a result of the DuPont N&B Transaction, holders of DuPont’s common stock will own approximately 55.4% of the outstanding shares of IFF on a fully diluted basis. We believe that the combination of IFF and the N&B Business will create a global leader in high-value ingredients and solutions in the global Food & Beverage, Home & Personal Care and Health & Wellness markets. We expect that the companies' complementary product portfolios will give the combined company leadership positions across key Taste, Texture, Scent, Nutrition, Enzymes, Cultures, Soy Proteins and Probiotics categories.
Completion of the DuPont N&B Transaction is subject to various closing conditions, including, among other things, (1) approval by IFF’s shareholders of the issuance of IFF Common Stock in connection with the transaction; (2) the effectiveness of the registration statements to be filed with the Securities and Exchange Commission pursuant to the Merger Agreement; and (3) the expiration of the applicable waiting period under the Hart-Scott-Rodino Antitrust Improvements Act of 1976, as amended, and obtaining certain other consents, authorizations, orders or approvals from governmental authorities. We expect that the transaction will close in early 2021.
2019 Financial Performance Overview
Sales
Sales in 2019 increased 29% on a reported basis and 32% on a currency neutral basis (which excludes the effects of changes in currency), with the effects of the Frutarom acquisition contributing approximately 28% to reported growth rates and 29% to currency neutral growth rates. Taste reported sales growth was flat but currency neutral sales grew 2%. Scent achieved sales growth of 2% on a reported basis and 4% on a currency neutral basis in 2019. The impact of an additional week of sales, or a 53rd week, in 2019 contributed approximately 1% to reported and currency neutral sales growth. Consolidated reported
and currency neutral sales growth was driven by additional sales from our acquisition of Frutarom, and to a lesser extent, new win performance (net of losses) in Scent.
From a geographic perspective, North America ("NOAM"), Europe, Africa and Middle East ("EAME"), Greater Asia ("GA") and Latin America ("LA") all delivered sales growth on a consolidated basis led by the Frutarom acquisition.
Exchange rate variations had an unfavorable impact on net sales for 2019 of 3%. The effect of exchange rates can vary by business and region, depending upon the mix of sales priced in U.S. dollars as compared to other currencies.
Our 25 largest customers accounted for 38% of total sales in 2019. In 2019, no customer accounted for more than 10% of sales. A key factor for commercial success is inclusion on our strategic customers’ core supplier lists, which provides opportunities to win new business. We are on the core supplier lists of a large majority of our global and strategic customers within taste and scent.
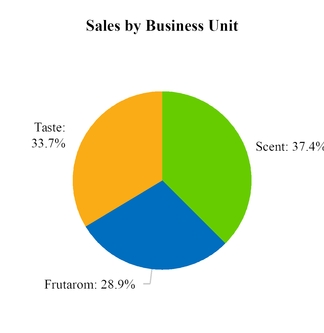
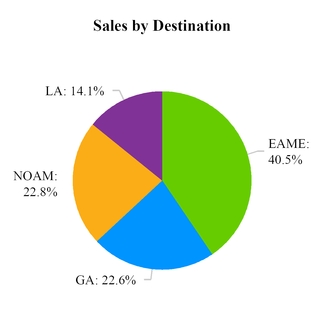
Gross Margin
Gross margin decreased 120 basis points ("bps") year-over-year, driven principally by lower margins in our Frutarom business unit and higher raw material costs, which were partially offset by cost savings and productivity initiatives.
Operating profit
Operating profit increased $81.4 million to $665.3 million (12.9% of sales) in 2019 compared to $583.9 million (14.7% of sales) in 2018. Included in 2019 were $127.8 million of charges related to operational improvement initiatives, integration related costs, restructuring and other charges, net, losses on sale of assets, FDA mandated product recall, compliance review costs, Frutarom acquisition related costs and N&B transaction related costs. The comparable period in 2018 included $93.5 million of charges related to operational improvement initiatives, integration related costs, restructuring and other charges, net, and Frutarom acquisition related costs, which were partially offset by acquisition related costs, gains on sale of assets and recoveries related to the FDA mandated product recall. Excluding these charges, adjusted operating profit was $793.1 million for 2019, an increase from $677.4 million for 2018, principally driven by the inclusion of Frutarom's operating profit for a full year in 2019 compared to one quarter in 2018, productivity initiatives, and volume increases on existing business, partially offset by price to input costs (including the net impact of the BASF supply chain disruption in 2018) and unfavorable foreign exchange rates.
Excluding the above charges, adjusted operating profit as a percentage of sales decreased to 15.4% for 2019 compared to 17.0% for 2018, principally driven by lower margins in our Frutarom business and price to input costs (including the net impact of the BASF supply chain disruption in 2018), partially offset by productivity initiatives. Foreign currency had a 2%
unfavorable impact on operating profit in the 2019 period compared to a 3% favorable impact on operating profit in the 2018 period.
Restructuring and Other Charges, net
Restructuring and other charges, net increased to $29.8 million in 2019 compared to $5.1 million in 2018. This increase was primarily driven by costs incurred in 2019 related to our Frutarom Integration Initiative and 2019 Severance Program, including severance costs related to outsourcing the IT function.
Cash Flows provided by Operating Activities
Cash flows provided by operations were $699.0 million or 13.6% of sales in 2019 as compared to cash flows provided by operations of $437.6 million, or 11.0% of sales, during 2018. The increase in operating cash flows from 2018 to 2019 was principally driven by higher earnings from inclusion of our Frutarom acquisition and lower net working capital (principally related to accounts receivable).
Our capital spend was $236.0 million (4.6% of sales) during 2019. In light of our requirement to relocate one of our Fragrance Ingredients facilities in China, the ongoing construction of new facilities in India and Indonesia, and capital requirements to integrate our recently acquired Frutarom business, we expect that capital spending in 2020 will be about 4-5% of sales (net of potential grants and other reimbursements from government authorities).
Results of Operations
| Year Ended December 31, | Change | ||||||||||||||||
| (DOLLARS IN THOUSANDS EXCEPT PER SHARE AMOUNTS) | 2019 | 2018 | 2017 | 2019 vs. 2018 | 2018 vs. 2017 | ||||||||||||
| Net sales | $ | 5,140,084 | $ | 3,977,539 | $ | 3,398,719 | 29.2 | % | 17.0 | % | |||||||
| Cost of goods sold | 3,027,336 | 2,294,832 | 1,926,256 | 31.9 | % | 19.1 | % | ||||||||||
| Gross profit | 2,112,748 | 1,682,707 | 1,472,463 | ||||||||||||||
| Research and development (R&D) expenses | 346,128 | 311,583 | 295,469 | 11.1 | % | 5.5 | % | ||||||||||
| Selling and administrative (S&A) expenses | 876,121 | 707,461 | 570,144 | 23.8 | % | 24.1 | % | ||||||||||
| Restructuring and other charges, net | 29,765 | 5,079 | 19,711 | NMF | (74.2 | )% | |||||||||||
| Amortization of acquisition-related intangibles | 193,097 | 75,879 | 34,693 | 154.5 | % | 118.7 | % | ||||||||||
| Losses (gains) on sale of assets | 2,367 | (1,177 | ) | (184 | ) | NMF | NMF | ||||||||||
| Operating profit | 665,270 | 583,882 | 552,630 | ||||||||||||||
| Interest expense | 138,221 | 132,558 | 65,363 | 4.3 | % | 102.8 | % | ||||||||||
| Loss on extinguishment of debt | — | 38,810 | — | (100.0 | )% | NMF | |||||||||||
| Other income, net | (30,403 | ) | (35,243 | ) | (49,778 | ) | (13.7 | )% | (29.2 | )% | |||||||
| Income before taxes | 557,452 | 447,757 | 537,045 | ||||||||||||||
| Taxes on income | 97,184 | 107,976 | 241,380 | (10.0 | )% | (55.3 | )% | ||||||||||
| Net income | $ | 460,268 | $ | 339,781 | $ | 295,665 | |||||||||||
| Net income attributable to noncontrolling interest | 4,395 | 2,479 | — | NMF | NMF | ||||||||||||
| Net income attributable to IFF stockholders | 455,873 | 337,302 | 295,665 | ||||||||||||||
| Net income per share — diluted | $ | 4.00 | $ | 3.79 | $ | 3.72 | 5.5 | % | 1.9 | % | |||||||
| Gross margin | 41.1 | % | 42.3 | % | 43.3 | % | (120.2 | ) | (101.9 | ) | |||||||
| R&D as a percentage of sales | 6.7 | % | 7.8 | % | 8.7 | % | (110.0 | ) | (86.0 | ) | |||||||
| S&A as a percentage of sales | 17.0 | % | 17.8 | % | 16.8 | % | (74.2 | ) | 101.1 | ||||||||
| Operating margin | 12.9 | % | 14.7 | % | 16.3 | % | (173.7 | ) | (158.0 | ) | |||||||
| Adjusted operating margin (1) | 15.4 | % | 17.0 | % | 18.2 | % | (160.0 | ) | (117.2 | ) | |||||||
| Effective tax rate | 17.4 | % | 24.1 | % | 44.9 | % | NMF | NMF | |||||||||
| Segment net sales | |||||||||||||||||
| Taste | $ | 1,731,919 | $ | 1,737,349 | $ | 1,632,166 | (0.3 | )% | 6.4 | % | |||||||
| Scent | 1,922,717 | 1,880,630 | 1,766,553 | 2.2 | % | 6.5 | % | ||||||||||
| Frutarom | 1,485,448 | 359,560 | N/A | NMF | NMF | ||||||||||||
| Consolidated | $ | 5,140,084 | $ | 3,977,539 | $ | 3,398,719 |
NMF: Not meaningful
| (1) | Adjusted operating margin for the year ended December 31, 2019 excludes integration related costs of $55.2 million, restructuring and other charges of $29.8 million, N&B transaction related costs of $20.7 million, compliance review and legal defense costs of $11.3 million, Frutarom acquisition related costs of $5.9 million, and operational improvement initiatives of $2.3 million, losses on sale of assets of $2.4 million, and FDA mandated product recall of $0.3 million. |
Adjusted operating margin for the year ended December 31, 2018 excludes Frutarom acquisition related costs of $89.6 million, integration related costs of $7.2 million, restructuring and other charges of $4.1 million, and operational improvement initiatives of $2.2 million, partially offset by FDA mandated product recall of $7.1 million, acquisition related costs of $1.3 million, and gain on sale of assets of $1.2 million.
Adjusted operating margin for the year ended December 31, 2017 excludes net legal charges/credits of $1.0 million, acquisition related costs of $20.4 million, gain on sale of assets of $0.2 million, operational improvement initiative costs of $1.8 million, restructuring and other charges, net of $19.7 million, FDA mandated product recall costs of $11.0 million, UK pension settlement charge of $2.8 million, tax assessment of $5.3 million, and integration related costs of $4.2 million.
Cost of goods sold includes the cost of materials and manufacturing expenses; raw materials generally constitute approximately 50% of total inventory. R&D expenses relate to the development of new and improved molecules and technologies, technical product support and compliance with governmental regulations. S&A expenses include expenses necessary to support our commercial activities and administrative expenses principally associated with staff groups that support our overall operating activities.
2019 IN COMPARISON TO 2018
Sales
Sales for 2019 totaled $5.1 billion, an increase of 29% from the prior year on a reported basis and 32% on a currency neutral basis. The Frutarom acquisition contributed 28% on a reported basis and 29% on a currency neutral basis. The impact of an additional week of sales, or a 53rd week, in 2019 contributed approximately 1% to reported and currency neutral sales growth. Sales growth primarily reflected the additional sales from our acquisition of Frutarom, and to a lesser extent, new win performance (net of losses) in Scent.
Sales performance by segment was as follows:
| % Change in Sales - 2019 vs. 2018 | |||||
| Reported | Currency Neutral**(1)** | ||||
| Taste | 0 | % | 2 | % | |
| Scent | 2 | % | 4 | % | |
| Frutarom | — | % | — | % | |
| Total | 29 | % | 32 | % |
| (1) | Currency neutral sales growth is calculated by translating prior year sales at the exchange rates for the corresponding 2019 period. |
Taste
Taste sales in 2019 were flat on a reported basis and increased 2% on a currency neutral basis versus the prior year period. Currency neutral performance was driven by new wins (net of losses) which was partially offset by volume reductions on existing business. Currency neutral sales growth was primarily driven by GA new wins (net of losses) and volume increases on existing business.
Scent
Scent sales in 2019 increased 2% on a reported basis and 4% on a currency neutral basis. Reported and currency neutral sales growth primarily reflected new win performance (net of losses), which were partially offset by volume reductions on existing business.
Sales growth in the Scent business unit was led by Fine Fragrances and Consumer Fragrances, which both were primarily driven by new win performance (net of losses), partially offset by volume reductions on existing business.
Frutarom
Frutarom sales in 2019 were $1.5 billion, which included approximately $1.1 billion in sales of Flavor Compounds and approximately $367 million in sales of Ingredient product categories. We completed our acquisition of Frutarom on October 4, 2018 and therefore, the year over year sales growth has been excluded from the above table.
Reported and currency neutral sales for the fourth quarter of 2019 grew 4% and 6%, respectively, primarily driven by growth in the Flavor Compounds product category.
Cost of Goods Sold
Cost of goods sold, as a percentage of sales, increased 120 bps, to 58.9% in 2019 compared to 57.7% in 2018, principally driven by lower margins in our Frutarom business unit and unfavorable price versus input costs, which were partially offset by cost savings and productivity initiatives.
Research and Development (R&D)
Overall R&D expenses, as a percentage of sales, decreased to 6.7% in 2019 compared to 7.8% in 2018. The decrease as a percentage of sales in 2019 was principally due to lower R&D expenses in our Frutarom segment as a percentage of sales.
Selling and Administrative (S&A)
S&A expenses increased $168.7 million to $876.1 million, or 17.0% as a percentage of sales, in 2019 compared to $707.5 million, or 17.8% as a percentage of sales, in 2018.
Included in 2019 was integration related costs of $53.5 million, N&B transaction related costs of $20.7 million, compliance review and legal defense costs of $11.3 million and Frutarom acquisition related costs of $1.7 million, compared to Frutarom acquisition related costs of $66.1 million and integration related costs of $6.1 million, partially offset by acquisition related costs of $1.3 million in 2018. Excluding these costs, adjusted S&A expense increased by $152.3 million, but decreased to 15.3% of sales in 2019 compared to 16.0% of sales in 2018. The slight decrease as a percentage of sales was due to a decline in personnel related costs and the impact of our acquisition of Frutarom, partially offset by income related to certain Brazil tax credits.
During the fourth quarter of 2019, we recognized $8.0 million in income related to the expected recoveries of previously paid indirect taxes in Brazil from the period from 2011 to 2018 that have been subject to litigation between us and certain tax authorities. The amount has been recorded in Selling and administrative expense.
Restructuring and Other Charges
Frutarom Integration Initiative
In connection with the acquisition of Frutarom, we began to execute an integration plan that, among other initiatives, seeks to optimize its manufacturing network. As part of the Frutarom Integration Initiative, we expect to close approximately 35 manufacturing sites over the next two years with most of the closures targeted to occur before the end of fiscal 2020. During 2019, we announced the closure of 10 facilities, of which six facilities are in Europe, Africa and Middle East, two facilities in Latin America, and one facility in each North America and Greater Asia regions. Since the inception of the initiative, we have expensed $10.4 million. Total costs for the program are expected to be approximately $65 million including cash and non-cash items.
2019 Severance Charges
During 2019, the Company incurred severance charges related to approximately 330 headcount reductions. The headcount reductions primarily related to the Scent business unit and outsourcing of certain IT functions, with additional amounts related to headcount reductions in all business units associated with the establishment of a new shared service center in Europe. Since the inception of the program, the Company has expensed $21.3 million. Total costs for the program are expected to be approximately $25 million.
2017 Productivity Program
In connection with 2017 Productivity Program, we recorded $24.5 million of charges related to personnel costs and lease termination costs since the program's inception. Total costs for the program are expected to be approximately $25 million.
Amortization of Acquisition-Related Intangibles
Amortization expenses increased to $193.1 million in 2019 compared to $75.9 million in 2018. The increase of $117.2 million was principally driven by the impact of the Frutarom acquisition in 2018.
Operating Results by Business Unit
We evaluate the performance of business units based on segment profit which is defined as operating profit before Restructuring and certain non-recurring items, Interest expense, Other expense, net and Taxes on income. See Note 15 to our Consolidated Financial Statements for the reconciliation to Income before taxes.
| For the Year Ended December 31, | |||||||
| (DOLLARS IN THOUSANDS) | 2019 | 2018 | |||||
| Segment profit: | |||||||
| Taste | $ | 382,590 | $ | 395,190 | |||
| Scent | 333,522 | 329,548 | |||||
| Frutarom | 126,804 | 27,358 | |||||
| Global Expenses | (49,836 | ) | (74,730 | ) | |||
| Operational Improvement Initiatives | (2,267 | ) | (2,169 | ) | |||
| Acquisition Related Costs | — | 1,289 | |||||
| Integration Related Costs | (55,160 | ) | (7,188 | ) | |||
| Restructuring and Other Charges, net | (29,765 | ) | (4,086 | ) | |||
| (Losses) gains on Sale of Assets | (2,367 | ) | 1,177 | ||||
| FDA Mandated Product Recall | (250 | ) | 7,125 | ||||
| Frutarom Acquisition Related Costs | (5,940 | ) | (89,632 | ) | |||
| Compliance Review & Legal Defense Costs | (11,314 | ) | — | ||||
| N&B Transaction Related Costs | (20,747 | ) | — | ||||
| Operating Profit | $ | 665,270 | $ | 583,882 | |||
| Profit margin | |||||||
| Taste | 22.1 | % | 22.7 | % | |||
| Scent | 17.3 | % | 17.5 | % | |||
| Frutarom | 8.5 | % | 7.6 | % | |||
| Consolidated | 12.9 | % | 14.7 | % |
Taste Business Unit
Taste segment profit decreased $12.6 million to $382.6 million (22.1% of segment sales) in 2019 from $395.2 million (22.7% of segment sales) in the comparable 2018 period. The decrease in segment profit principally reflected
higher raw material costs, and unfavorable manufacturing variances, partially offset by the benefit of cost savings and productivity initiatives.
Scent Business Unit
Scent segment profit increased $4.0 million to $333.5 million (17.3% of segment sales) in 2019, compared to $329.5 million (17.5% of segment sales) reported in 2018. Segment profit as a percentage of sales included the impact of unfavorable price versus input costs partially offset by the benefit of cost savings and productivity initiatives.
Frutarom Business Unit
Frutarom segment profit was $126.8 million for 2019 (8.5% of segment sales), compared to $27.4 million for 2018 (7.6% of segment sales). Frutarom segment profit was $32.0 million for the fourth quarter of 2019 (8.5% of segment sales), compared to $27.4 million for the fourth quarter of 2018 (7.6% of segment sales).
Global Expenses
Global expenses represent corporate and headquarter-related expenses which include legal, finance, human resources and R&D and other administrative expenses that are not allocated to an individual business unit. In 2019, Global expenses were $49.8 million compared to $74.7 million during 2018. The decrease was principally driven by higher gains from our currency hedging program in the current year and lower incentive compensation expense in 2019.
Interest Expense
In 2019, interest expense increased $5.7 million to $138.2 million, compared to $132.6 million in 2018 primarily driven by a full year of interest expense in 2019 related to the September 2018 debt issuances, partially offset by $47.1 million of fees and interest incurred in the third quarter of 2018 in connection with the acquisition of Frutarom. Average cost of debt was 3.0% for the 2019 period compared to 4.3% in 2018.
Loss on extinguishment of debt
Loss on extinguishment of debt was $38.8 million in 2018, driven by $34.9 million make whole payment on the Senior Notes - 2007 and $3.9 million realized loss on the termination of a fair value hedge.
Other (Income) Expense, Net
Other income, net, decreased approximately $4.8 million to $30.4 million of income in 2019 versus $35.2 million of income in 2018. The decrease was primarily driven by higher losses on foreign exchange and higher pension related expenses, offset by higher investment income in 2019 as well as income related to the realization of a deferred gain on the government imposed relocation of a site in China.
Income Taxes
The effective tax rate was 17.4% in 2019 as compared to 24.1% in 2018. The year-over-year decrease was largely due to a more favorable mix of earnings, and the absence of the $32.8 million charge in 2018 associated with a change in our assertion under APB 23, partially offset by loss provisions, the establishment of a valuation allowance against certain U.S. state deferred taxes, and the absence of the reversal of certain valuation allowances on U.S. state deferred taxes that benefited 2018.
Excluding the $26.2 million tax benefit associated with the pre-tax operational improvement initiatives, integration related costs, restructuring and other charges, net, losses on sale of assets, FDA mandated product recall, Frutarom acquisition related costs, compliance review & legal defense costs, and N&B transaction related costs, the adjusted effective tax rate for 2019 was 18.1%. For 2018, the adjusted effective tax rate was 18.4% excluding the $4.0 million tax benefit associated with the pre-tax restructuring, operational improvement initiatives, integration related costs and Frutarom acquisition related costs, which were partially offset by the tax charge associated with acquisition-related costs, gains on sales of fixed assets, FDA mandated product recall costs and the impact of the U.S. tax reform. The year-over-year decrease was largely due to a more favorable mix of earnings, partially offset by loss provisions and the establishment of a valuation allowance on U.S. state deferred taxes.
2018 IN COMPARISON TO 2017
For a comparison of our results of operations for the fiscal years ended December 31, 2018 and December 31, 2017, see “Part II, Item 7. Management’s Discussion and Analysis of Financial Condition and Results of Operations” of our Form 10-K for the fiscal year ended December 31, 2018, filed with the SEC on February 26, 2019.
Liquidity and Capital Resources
Cash and Cash Equivalents
We had cash and cash equivalents of $606.8 million at December 31, 2019 compared to $634.9 million at December 31, 2018, of which $578.7 million of the balance at December 31, 2019 was held outside the United States. Cash balances held in foreign jurisdictions are, in most circumstances, available to be repatriated to the United States.
Effective utilization of the cash generated by our international operations is a critical component of our strategy. We regularly repatriate cash from our non-U.S. subsidiaries to fund financial obligations in the U.S. As we repatriate these funds to the U.S. we will be required to pay income taxes in certain U.S. states and applicable foreign withholding taxes during the period when such repatriation occurs. Accordingly, as of December 31, 2019, we have a deferred tax liability of $46.1 million for the effect of repatriating the funds to the U.S.
Restricted Cash
As discussed in Note 3 to the Consolidated Financial Statements, restricted cash relates to amounts escrowed related to certain payments to be made to former Frutarom option holders in future periods. At December 31, 2019 we had a balance of $17.1 million compared to $13.6 million at December 31, 2018.
Cash Flows from Operating Activities
Operating cash flows in 2019 were $699.0 million compared to $437.6 million in 2018 and $390.8 million in 2017. The increase in operating cash flows from 2018 to 2019 was principally driven by higher earnings from inclusion of our Frutarom acquisition and lower net working capital (principally related to accounts receivable). The increase in operating cash flows from 2017 to 2018 was principally driven by lower litigation settlement and pension payments and higher net income, offset by higher net working capital (principally related to inventories).
Working capital (current assets less current liabilities) totaled $1.39 billion at year-end 2019 compared to $1.81 billion at December 31, 2018. This decrease in working capital of $423.2 million primarily reflected decreases in accounts receivable and increases in accounts payable, current portion of long-term debt and other current liabilities, offset by increases in inventories, prepaid expenses and other current assets as compared to the prior year.
We entered into certain factoring agreements in the U.S. and The Netherlands under which we can factor up to approximately $100 million in receivables. The new factoring agreements supplement our existing factoring programs that are sponsored by certain customers. Under all of the arrangements, we sell the receivables on a non-recourse basis to unrelated financial institutions and account for the transactions as a sale of receivables. The applicable receivables are removed from our Consolidated Balance Sheet when the cash proceeds are received by us. As of December 31, 2019, 2018 and 2017, we had sold receivables pursuant to these factoring programs of approximately $205.7 million, $168.3 million and $160.1 million, respectively. Participation in the various programs increased cash provided by operations by approximately $37.7 million, $13.6 million and $15.0 million in 2019, 2018 and 2017, respectively. The cost of participating in these programs was approximately $7.1 million, $3.4 million, and $3.0 million in 2019, 2018, and 2017, respectively.
Cash Flows Used in Investing Activities
Net investing activities in 2019 utilized $225.9 million compared to $5,013.2 million and $299.9 million in 2018 and 2017, respectively. The decrease in cash paid for investing activities was primarily driven by higher payments for acquisitions in the prior year. In 2019, we acquired certain companies as described in Note 3 for approximately $49.1 million, net of cash acquired. In 2018, we acquired Frutarom for approximately $7 billion (net of cash acquired) of which $4.9 billion was paid in cash.
Additions to property, plant and equipment were $236.0 million, $170.1 million and $129.0 million in 2019, 2018 and 2017, respectively (net of grants and other reimbursements from government authorities). These investments largely arise from our ongoing focus to align our manufacturing facilities with customer demand, primarily in emerging markets, and new technology consistent with our strategy.
The decrease in cash used in investing activities from 2019 compared to 2018, primarily driven by the items above, were partially offset by proceeds from the disposal of assets and proceeds from the termination of existing cross currency swap instruments during the current year.
In light of our requirement to relocate one of our Fragrance Ingredients facilities in China, the ongoing construction of new facilities in India and Indonesia, and capital requirements to integrate our recently acquired Frutarom business, we expect that capital spending in 2020 will be about 4-5% of sales (net of potential grants and other reimbursements from government authorities).
Frutarom Integration Initiative
We expect to incur costs related to the Frutarom Integration Initiative. Integration projects are primarily focused on driving cost synergies in the manufacturing and creative networks, procurement and overhead functions. Restructuring costs associated with these initiatives are expected to include employee-related cash costs, including severance, retirement and other termination benefits, fixed asset write-downs and contract termination and other costs. In addition, other costs associated with the Frutarom Integration Initiative are expected to include advisory and personnel costs for managing and implementing integration projects.
Total restructuring costs for the program are expected to be approximately $65 million including cash and non-cash items. During 2019, we incurred $10.4 million in costs related to the closure of 10 sites. We expect to close approximately 35 manufacturing sites over the next two years with most of the closures targeted to occur before the end of fiscal 2020. The costs principally related to severance and fixed asset write-downs, with the remainder comprising costs such as contract termination and relocation.
Additionally, during 2019, we recorded $55.2 million in advisory services, retention bonuses and performance stock awards costs related to the integration of the Frutarom acquisition.
We expect to achieve $145 million of synergy targets and have realized approximately $50 million of cost synergies in 2019.
Cash Flows Used in Financing Activities
Net cash used in financing activities in 2019 was $505.1 million, compared to cash provided by financing activities of $4,870.7 million in 2018 and cash used in financing activities of $42.6 million in 2017, respectively. The decrease in 2019 versus 2018 was principally driven by Frutarom related financing activities in 2018, partially offset by higher dividend payments in the current year.
The increase in 2018 versus 2017 was principally driven by Frutarom related financing activities where we issued $3.3 billion of debt, including €1.1 billion aggregate principal amount of the 2018 Euro Senior Notes, $1.5 billion aggregate principal amount of the 2018 USD Senior Notes, $139.5 million aggregate principal amount of the Amortizing Note portion of the TEUs and $350 million aggregate principal amount of the Term Loan, as compared to $493.9 million of 2047 Notes issued in 2017. We also issued $2.3 billion of equity in the third quarter of 2018 to finance the Frutarom acquisition, including $1.6 billion of our common stock and $685.5 million of the stock purchase contract portion ("SPC") of the TEUs. Additionally, in 2018 we repaid $288.8 million of our Senior notes - 2007, including the loss on extinguishment of debt of $38.8 million.
At December 31, 2019, we had $4,382.4 million of debt outstanding compared to $4,553.1 million outstanding at December 31, 2018.
We paid dividends totaling $313.5 million, $230.2 million and $206.1 million in 2019, 2018 and 2017, respectively. The cash dividend declared per share in 2019, 2018 and 2017 was $2.96, $2.84 and $2.66, respectively.
Our capital allocation strategy is primarily focused on debt repayment to maintain our investment grade rating. We will also prioritize capital investment in our businesses to support the strategic long term plans. We are also committed to maintaining our history of paying a dividend to investors determined by our Board of Directors at its discretion based on various factors.
In December 2012, the Board of Directors authorized a $250.0 million share repurchase program, which commenced in the first quarter of 2013. In August 2015, the Board of Directors approved an additional $250.0 million share repurchase authorization and extension through December 31, 2017. Based on the total remaining amount of $56.1 million available under the amended repurchase program as of October 31, 2017, the Board of Directors re-approved on November 1, 2017 a $250.0 million share repurchase authorization and extension for a total value of $300.0 million available under the program, which expires on November 1, 2022. Based on the total remaining amount of $279.7 million available under the repurchase program, approximately 2.2 million shares, or 2.0% of shares outstanding (based on the market price and shares outstanding as of December 31, 2019) could be repurchased under the program as of December 31, 2019. As of May 7, 2018, we have suspended our share repurchases.
Capital Resources
Operating cash flow provides the primary source of funds for capital investment needs, dividends paid to shareholders and debt service repayments. We anticipate that cash flows from operations and availability under our existing credit facilities will be sufficient to meet our investing and financing needs. We regularly assess our capital structure, including both current and long-term debt instruments, as compared to our cash generation and investment needs in order to provide ample flexibility and to optimize our leverage ratios. We believe our existing cash balances are sufficient to meet our debt service requirements.
Pending Transaction with Nutrition & Biosciences, Inc.
In conjunction with the DuPont N&B Transaction, IFF and N&B have engaged Morgan Stanley Senior Funding, Inc. and Credit Suisse Loan Funding LLC as joint lead arrangers and bookrunners to structure, arrange and syndicate the financings that will be required to close the transaction. Specifically, N&B will be the initial borrower under a $1.25 billion 3-year/5-year senior unsecured term loan facility and, to the extent necessary, a $6.25 billion tranche of the 364-Day senior unsecured bridge facility, which will be used to finance the Special Cash Payment to DuPont in connection with the separation and to pay related fees and expenses. N&B may access the bond markets in advance of closing the merger to pre-fund the transaction and replace all or a portion of the Bridge Facility. Following the consummation of the DuPont N&B Transaction, all obligations of N&B will be guaranteed by IFF, or at the election of N&B and IFF, assumed by IFF.
Upon completion of our combination with N&B, DuPont shareholders will own approximately 55.4% of the shares of IFF, and existing IFF shareholders will own approximately 44.6% of the shares of IFF. A proxy statement is expected to be filed with the SEC pursuant to which IFF shareholders will be asked to approve the share issuance required to effect the N&B Transaction.
On January 17, 2020, IFF and certain of our subsidiaries entered into an amendment to our Credit Facility and Term Loan to facilitate the N&B transaction and the related guarantee or assumption by IFF of indebtedness to be incurred by N&B, in connection with the pending transaction with N&B by, among other things, providing that after the closing date of the transaction, our maximum permitted ratio of Net Debt to Consolidated EBITDA shall be 4.50 to 1.0, stepping down to 3.50 to 1.0 over time (with a step-up if we consummate certain qualified acquisitions) for each of the Credit Facility and Term Loan.
Commercial Paper
We supplement short-term liquidity with access to capital markets, mainly through bank credit facilities. The Credit Facility is used as a backstop for our commercial paper program.
Commercial paper issued by us generally has terms of 90 days or less. As of December 31, 2019, and 2018, there was no commercial paper outstanding. The Credit Facility is used as a backstop for our commercial paper program. We did not draw any commercial paper nor the Credit Facility during 2019.
Credit Facility and Term Loan
On May 21, 2018, June 6, 2018 and July 13, 2018, IFF and certain of its subsidiaries amended and restated our existing amended and restated credit agreement with Citibank, N.A., as administrative agent (as amended, the “Credit Facility”) in connection with the acquisition of Frutarom, to, among other things (i) extend the maturity date of the Credit Facility until June 6, 2023, (ii) increase the maximum ratio of net debt to EBITDA on and after the closing date of the acquisition and (iii) increase the drawn down capacity to $1 billion, consisting of a $585 million tranche A revolving credit facility (which provides for borrowings available in U.S. dollars, euros, Swiss francs, Japanese yen and/or British pounds sterling, with a sublimit of $25 million for swing line borrowings) (“Tranche A”) and a $415 million tranche B revolving credit facility (which provides for borrowings available in U.S. dollars, euros, Swiss francs, Japanese yen and/or British pounds sterling, with sublimits of €50 million and $25 million for swing line borrowings) (“Tranche B” and, together with Tranche A, the “Revolving Facility”). The interest rate on the Revolving Facility will be, at the applicable borrower’s option, a per annum rate equal to either (x) an adjusted LIBOR rate plus an applicable margin varying from 0.75% to 1.75% or (y) a base rate plus an applicable margin varying from 0.00% to 0.750%, in each case depending on the public debt ratings for non-credit enhanced long-term senior unsecured debt issued by us. Other terms and covenants under the Credit Facility remain substantially unchanged. The Credit Facility is available for general corporate purposes of each borrower and its subsidiaries. The obligations under the Credit Facility are unsecured and we have guaranteed the obligations of each other borrower under the Credit Facility. We pay a commitment fee on the aggregate unused commitments; such fee is not material.
On June 6, 2018 and amended on July 13, 2018, we entered into a term loan credit agreement to replace a portion of the bridge loan facility, reducing the amount of the bridge loan commitments by $350 million. Under the term loan credit agreement, the lenders thereunder committed to provide, subject to certain conditions, a senior unsecured term loan facility (as amended, "Term Loan") in an original aggregate principal amount of up to $350.0 million, maturing three years after the funding date thereunder. The proceeds from the term loan were received on October 3, 2018.
The Term Loan bears interest, at our option, at a per annum rate equal to either (x) an adjusted LIBOR rate plus an applicable margin varying from 0.75% to 2.00% or (y) a base rate plus an applicable margin varying from 0.00% to 1.00%, in each case depending on the public debt ratings for non-credit enhanced long-term senior unsecured debt issued by us. Loans under the Term Loan will amortize quarterly at a per annum rate of 10.0% of the aggregate principal amount of the loans made under the Term Loan on the funding date, commencing December 31, 2018, with the balance payable on October 3, 2021. We may voluntarily prepay the term loans without premium or penalty.
During the year ended December 31, 2019, we made payments of $110 million on the Term Loan.
The Credit Facility and Term Loan contain various covenants, limitations and events of default customary for similar facilities for similarly rated borrowers, including the requirement for us to maintain, at the end of each fiscal quarter, a ratio of net debt for borrowed money to adjusted EBITDA in respect of the previous 12-month period, including the pro forma effect of the acquisition of Frutarom, of not more than 4.5 to 1.0, which shall be reduced to 4.25 to 1.0 as of the end of September 30, 2019, 4.0 to 1.0 as of the end of March 31, 2020 and to 3.5 to 1.0 as of the end of March 31, 2021.
As of December 31, 2019, we had no outstanding borrowings under our $1 billion Credit Facility and $240 million outstanding for the Term Loan. The amount that we are able to draw down under the Credit Facility is limited by financial covenants as described in more detail below. As of December 31, 2019, our draw down capacity was $1 billion under the Credit Facility.
At December 31, 2019 and 2018 we were in compliance with all financial and other covenants, including the net debt to adjusted EBITDA ratio. At December 31, 2019 our Net Debt/adjusted EBITDA(1) ratio was 3.22 to 1 as defined by the credit facility agreements, well below the financial covenants of existing outstanding debt. Failure to comply with the financial and other covenants under our debt agreements would constitute default and would allow the lenders to accelerate the maturity of all indebtedness under the related agreement. If such acceleration were to occur, we would not have sufficient liquidity available to repay the indebtedness. We would likely have to seek amendments under the agreements for relief from the financial covenants or repay the debt with proceeds from the issuance of new debt or equity, and/or asset sales, if necessary. We
may be unable to amend the agreements or raise sufficient capital to repay such obligations in the event the maturities are accelerated.
| (1) | Adjusted EBITDA and Net Debt, which are non-GAAP measures used for these covenants, are calculated in accordance with the definition in the debt agreements. In this context, these measures are used solely to provide information on the extent to which we are in compliance with debt covenants and may not be comparable to adjusted EBITDA and Net Debt used by other companies. Reconciliations of adjusted EBITDA to net income and net debt to total debt are as follows: |
| (DOLLARS IN MILLIONS) | Year Ended December 31, 2019 | ||
| Net income | $ | 455.9 | |
| Interest expense | 138.2 | ||
| Income taxes | 97.2 | ||
| Depreciation and amortization | 323.3 | ||
| Specified items**(1)** | 122.1 | ||
| Non-cash items**(2)** | 36.9 | ||
| Adjusted EBITDA | $ | 1,173.6 |
| (1) | Specified items for the 12 months ended December 31, 2019 of $122.1 million consist of acquisition related costs, operational improvement initiatives, integration related costs, restructuring and other charges, net, FDA mandated product recall, Frutarom acquisition related costs, compliance review and legal defense costs and N&B transaction related costs. |
| (2) | Non-cash items represent all other adjustments to reconcile net income to net cash provided by operations as presented on the Statement of Cash Flows, including stock-based compensation and gain on sale of assets. |
| (DOLLARS IN MILLIONS) | December 31, 2019 | ||
| Total debt | $ | 4,382.4 | |
| Adjustments: | |||
| Cash and cash equivalents | (606.8 | ) | |
| Net debt | $ | 3,775.6 |
Senior Notes
As of December 31, 2019, we had $4.09 billion aggregate principal amount outstanding in senior unsecured notes, with $1.79 billion principal amount denominated in EUR and $2.30 billion principal amount denominated in USD. The notes bear interest ranging from 0.50% per year to 5.00% per year, with maturities from September 2020 to September 2048. Of these notes, $300 million in aggregate principal amount of our 3.40% senior notes will mature in September 2020. See Note 9 to the Consolidated Financial Statements for further information on our senior notes.
Tangible Equity Units - Senior Unsecured Amortizing Notes
On September 17, 2018, in connection with the issuance of the TEUs, we issued $139.5 million aggregate principal amount of Amortizing Notes. There are no covenants or provisions in the indenture related to the TEUs that would afford the holders of the amortizing notes protection in the event of a highly leveraged transaction, reorganization, restructuring, merger or similar transaction involving us that may adversely affect such holders. If a fundamental change occurs, or if we elect to settle the SPCs early, then the holders of the Amortizing Notes will have the right to require us to repurchase the Amortizing Notes at a repurchase price equal to the principal amount of the Amortizing Notes as of the repurchase date plus accrued and unpaid interest. The indenture also contains customary events of default which would permit the holders of the Amortizing Notes to declare the notes to be immediately due and payable if not cured within applicable grace periods, including the failure to make timely installment payments on the notes or other material indebtedness, failure to give notice of a fundamental change and specified events of bankruptcy and insolvency. See Note 8 for further information on the TEUs.
Other Contingencies
Pending Transaction with Nutrition & Biosciences, Inc.
The Merger Agreement governing the DuPont N&B Transaction, subjects IFF to various contingent payments to the extent that the transaction is not consummated. Specifically, the Merger Agreement provides DuPont the right to receive a termination fee of $521.5 million, in certain circumstances, including if the agreement is terminated due to the IFF Board
changing its recommendation and to reimburse DuPont’s transaction-related expenses in an amount up to $75 million if the Merger Agreement is terminated because IFF’s shareholders do not approve the issuance of IFF Common Stock in connection with the transaction.
Brazil Tax Credits
In 2017 the Brazilian Supreme Court (“BSC”) ruled that Brazilian tax authorities should not include a value added tax known as "ICMS" in the calculation of certain indirect taxes ("PIS/COFINS"). By removing the ICMS from the calculation of the indirect tax base, the Court effectively eliminated a “tax on tax”. The Brazilian tax authorities filed an appeal seeking clarification of certain matters, including the amount of ICMS to which taxpayers would be entitled in order to reduce their indirect tax base (i.e. the gross rate or the net rate.)
In light of the BSC's decision, in November 2017, we filed suit consistent with the BSC decision to require that ICMS be excluded from the PIS/COFINS calculation and received a favorable preliminary decision that was confirmed by the BSC in September 2018. This preliminary ruling granted us the right to prospectively exclude ICMS amounts from the PIS/COFINS calculation, but left open the issue of whether the Company could recover the gross or net amount of ICMS amounts paid on PIS/COFINS for the period from November 2011 to December 2018.
In early January 2020, we were informed that a favorable decision was reached, confirming that we were entitled to recover the ICMS overpayments on PIS/COFINS for the period from November 2011 to December 2018, plus interest on that amount. The ruling did not, however, settle the question of whether the Company is eligible to recover based on the gross or the net amount of ICMS amounts paid on PIS/COFINS. A final ruling on the gross versus net amount issued is expected to be rendered in mid-2020.
Based on currently available information, the Company recognized $8.0 million as a recovery in the fourth quarter of 2019 as a component of Selling and administrative expenses. Additional amounts may be recorded in 2020 upon completion of the final claim and subject to the satisfactory outcome of the final ruling on the use of the gross method of calculation.
Other Commitments
Compliance with existing governmental requirements regulating the discharge of materials into the environment has not materially affected our operations, earnings or competitive position. In 2019 and 2018, we spent $4.5 million and $6.2 million on capital projects and $26.0 million and $21.7 million, respectively, in operating expenses and governmental charges for the purpose of complying with such regulations. Expenditures for these purposes will continue for the foreseeable future. In addition, we are party to a number of proceedings brought under the Comprehensive Environmental Response, Compensation and Liability Act or similar state statutes. It is expected that the impact of any judgments in or voluntary settlements of such proceedings will not be material to our financial condition, results of operations or liquidity.
Contractual Obligations
At December 31, 2019, we had contractual payment obligations due within the time periods as specified in the following table:
| Payments Due by Period | |||||||||||||||||||
| Total | Less than 1 Year | 1-3 Years | 3-5 Years | More than 5 Years | |||||||||||||||
| (DOLLARS IN MILLIONS) | 2020 | 2021 - 2022 | 2023 - 2024 | 2025 and thereafter | |||||||||||||||
| Borrowings(1) | $ | 4,417 | $ | 382 | $ | 578 | $ | 860 | $ | 2,597 | |||||||||
| Interest on borrowings(1) | 2,131 | 131 | 231 | 215 | 1,554 | ||||||||||||||
| Leases(2) | 374 | 51 | 84 | 61 | 178 | ||||||||||||||
| Pension funding obligations(3) | 76 | 25 | 51 | — | — | ||||||||||||||
| Postretirement obligations(4) | 64 | 4 | 8 | 8 | 44 | ||||||||||||||
| Purchase commitments(5) | 129 | 90 | 39 | — | — | ||||||||||||||
| U.S. tax reform toll-charge(6) | 48 | 5 | 9 | 20 | 14 | ||||||||||||||
| Total | $ | 7,239 | $ | 688 | $ | 1,000 | $ | 1,164 | $ | 4,387 |
| (1) | The rate assumed for the variable interest component of the contractual interest obligation was the rate in effect at December 31, 2019. See Note 9 to the Consolidated Financial Statements for a further discussion of our various borrowing facilities. |
| (2) | Leases include facility and other lease commitments executed in the normal course of the business included in Note 7 of the Notes to the Consolidated Financial Statements. |
| (3) | See Note 16 of the Notes to the Consolidated Financial Statements for a further discussion of our retirement plans. Anticipated funding obligations are based on current actuarial assumptions. The projected contributions beyond fiscal year 2022 are not currently determinable. |
| (4) | Amounts represent expected future benefit payments for our postretirement benefit plans. |
| (5) | Purchase commitments include agreements for raw material procurement and contractual capital expenditures. Amounts for purchase commitments represent only those items which are based on agreements that are enforceable and legally binding. |
| (6) | This amount represents the cash portion of the “toll charge” that is payable in installments over eight years beginning in 2018. This amount represents the six remaining installments. |
The table above does not include $68.3 million of the total unrecognized tax benefits for uncertain tax positions and approximately $14 million of associated accrued interest, and $46.1 million associated with the deferred tax liability on deemed repatriation. Due to the high degree of uncertainty regarding the timing of potential cash flows, we are unable to make a reasonable estimate of the amount and period in which the remaining liabilities might be paid.
Critical Accounting Policies and Use of Estimates
Our significant accounting policies are more fully described in Note 1 to the Consolidated Financial Statements. As disclosed in Note 1, the preparation of financial statements in conformity with U.S. generally accepted accounting principles (“GAAP”) requires management to make estimates and assumptions that affect reported amounts and accompanying disclosures. These estimates are based on management’s best judgment of current events and actions that we may undertake in the future. Actual results may ultimately differ from these estimates.
Those areas requiring the greatest degree of management judgment or deemed most critical to our financial reporting involve:
Business Combinations. From time to time we enter into strategic acquisitions in an effort to better service existing customers and to attain new customers. When we acquire a controlling financial interest in an entity or group of assets that are determined to meet the definition of a business, we apply the acquisition method described in ASC Topic 805, Business Combinations. In accordance with GAAP, the results of the acquisitions we have completed are reflected in our financial statements from the date of acquisition forward.
We allocate the purchase consideration paid to acquire the business to the assets acquired and liabilities assumed based on estimated fair values at the acquisition date, with the excess of purchase price over the estimated fair value of the net assets acquired recorded as goodwill. If during the measurement period (a period not to exceed twelve months from the acquisition date) we receive additional information that existed as of the acquisition date but at the time of the original allocation described above was unknown to us, we make the appropriate adjustments to the purchase price allocation in the reporting period in which the amounts are determined.
Significant judgment is required to estimate the intangibles and fair value of fixed assets and in assigning their respective useful lives. Accordingly, we typically engage third-party valuation specialists, who work under the direction of management, to assist in valuing significant tangible and intangible assets acquired.
The fair value estimates are based on available historical information, future expectations and assumptions deemed reasonable by management, but are inherently uncertain.
We typically use an income method to estimate the fair value of intangible assets, which is based on forecasts of the expected future cash flows attributable to the respective assets. Significant estimates and assumptions inherent in the valuations reflect a consideration of other marketplace participants, and include the amount and timing of future cash flows (including expected growth rates, discount rate and profitability), royalty rates used in the relief of royalty method, customer attrition rates, product obsolescence factors, a brand’s relative market position and the discount rate applied to the cash flows. Unanticipated market or macroeconomic events and circumstances may occur, which could affect the accuracy or validity of the estimates and assumptions.
Determining the useful life of an intangible asset also requires significant judgment. All of our acquired intangible assets (e.g., trademarks, product formulas, non-compete agreements and customer relationships) are expected to have finite useful lives. Our estimates of the useful lives of finite-lived intangible assets are based on a number of factors including competitive environment, market share, brand history, operating plans and the macroeconomic environment of the regions in which the brands are sold.
The costs of finite-lived intangible assets are amortized through expense over their estimated lives. The value of residual goodwill is not amortized, but is tested at least annually for impairment as described in the following note. For acquired intangible assets, the remaining useful life of the trade names and trademarks, product formulas, and customer relationships was estimated at the point at which substantially all of the present value of cumulative cash flows have been earned.
The periodic assessment of potential impairment of goodwill. We currently have goodwill of $5.5 billion, of which $4.3 billion relates to our acquisition of Frutarom. We test goodwill for impairment at the reporting unit level as of November 30 every year or more frequently if events or changes in circumstances indicate the asset might be impaired. A reporting unit is an operating segment or one level below an operating segment (referred to as a component) to which goodwill is assigned when initially recorded.
We identify our reporting units by assessing whether the components of our operating segments constitute businesses for which discrete financial information is available and management of each operating segment regularly reviews the operating results of those components. We have identified nine reporting units under the Taste, Scent and Frutarom Segments: (1) Flavor Compounds, (2) Fragrance Compounds, (3) Fragrance Ingredients, (4) Cosmetic Actives Ingredients, (collectively, the "IFF Legacy Reporting Units"), (5) Taste, (6) Savory, (7) Natural Product Solutions, (8) Frutarom Fragrance and Fine Ingredients and (9) Inclusions, (collectively, the "Frutarom Reporting Units").
When testing goodwill for impairment, we have the option of first performing a qualitative assessment to determine whether it is more likely than not that the fair value of a reporting unit is less than the carrying amount. If we elect to bypass the qualitative assessment for any reporting units, or if a qualitative assessment indicates it is more likely than not that the estimated carrying value of a reporting unit exceeds its fair value, we perform a quantitative goodwill impairment test.
Under the quantitative goodwill impairment test, if a reporting unit’s carrying amount exceeds its fair value, we will record an impairment charge based on that difference and the impairment charge will be limited to the amount of goodwill allocated to that reporting unit.
These factors may affect individual reporting units disproportionately, relative to the Company as a whole. As a result, the performance of one or more of the reporting units could decline, resulting in an impairment of goodwill or intangible assets.
For the annual impairment test performed as of November 30, 2019, we did not utilize the optional qualitative test and performed an annual goodwill impairment test for all nine of our reporting units by performing the quantitative test.
Determining the fair value of our reporting units for goodwill requires significant estimates and judgments by management. We assessed the fair value of the reporting units using an income approach. Under the income approach, we determine the fair value by using a discounted cash flow method at a rate of return that reflects the relative risk of the cash flows, projecting future cash flows of each reporting unit, as well as a terminal value. We use the most current actual and forecasted operating data available and key estimates and assumptions used in these valuations include revenue growth rates and profit margins based on our internal forecasts, our relevant weighted-average cost of capital used to discount future cash flows, market assumptions and our historical operating trends.
In order to further validate the reasonableness of the estimated fair values of the reporting units as of the valuation date, a reconciliation of the aggregate fair values of all reporting units to market capitalization was performed using a reasonable control premium.
There was no impairment of goodwill at any one of our nine reporting units in 2019. Based on the annual impairment test performed at November 30, 2019, we determined that IFF Legacy Reporting Units fair values exceeded their respective carrying values by over 200%, with the exception of one reporting unit that had 80% excess fair value over carrying value. In the analysis performed for the Frutarom Reporting Units, there was less than 10% excess fair value over carrying value for two reporting units. The fair values of the remaining Frutarom Reporting Units exceeded their respective carrying values by a range of approximately 10% to 55%.
For the reporting units with less than 10% excess fair value, the Savory reporting unit had excess fair value over carrying value of 8.3% and the Taste reporting unit had excess fair value over carrying value of 7.5%. While management believes that the assumptions used in the impairment test were reasonable, changes in key assumptions, including, lower revenue growth, lower operating margin, lower terminal growth rates or increasing discount rates could result in a future impairment.
If current long-term projections for these reporting units are not realized or materially decrease, we may be required to write-off all or a portion of the goodwill. Such charge could have a material effect on the Consolidated Statements of Operations and Balance Sheets.
Using the income approach and holding other assumptions constant, the following table provides the impact on the headroom by hypothetically changing key assumptions on a standalone basis for the Company's Savory and Taste reporting units as of November 30, 2019:
| Goodwill | Key Assumptions | Existing Headroom | Resulting Headroom | |||||||||||||||
| (DOLLARS IN MILLIONS) | Discount Rate | Terminal Growth | 50 bps Increase in Discount Rate | 50 bps Decline in Terminal Growth | ||||||||||||||
| Savory | $ | 1,205 | 7.5 | % | 3.0 | % | 8.3 | % | (3.4 | )% | (0.3 | )% | ||||||
| Taste | 1,662 | 7.5 | % | 3.0 | % | 7.5 | % | (3.6 | )% | (0.9 | )% |
The periodic assessment of potential impairment of long-lived assets. We review long-lived assets for impairment when events or changes in business conditions indicate that their full carrying value may not be recovered. An estimate of undiscounted future cash flows produced by an asset or group of assets is compared to the carrying value to determine whether impairment exists. If assets are determined to be impaired, the loss is measured based on an estimate of fair value using various valuation techniques, including a discounted estimate of future cash flows.
The analysis and evaluation of income taxes. We account for taxes under the asset and liability method. Under this method, deferred income taxes are recognized for temporary differences between the financial statement and tax return bases of assets and liabilities. A valuation allowance is recognized if, based on the weight of available evidence, it is more likely than not that some portion or all of the deferred tax asset will not be realized. The assessment of the need for a valuation allowance requires management to make estimates and assumptions about future earnings, reversal of existing temporary differences and available tax planning strategies. If actual experience differs from these estimates and assumptions, the recorded deferred tax asset may not be fully realized resulting in an increase to income tax expense in our results of operations.
We are subject to income taxes in the U.S. and numerous foreign jurisdictions. Significant judgment is required in evaluating our uncertain tax positions and determining our provision for income taxes. We first determine whether it is “more likely than not” that we would sustain our tax position if the relevant tax authority were to audit the position with full knowledge of all the relevant facts and other information. For those tax positions that meet this threshold, we measure the amount of tax benefit based on the largest amount of tax benefit that we have a greater than 50% chance of realizing in a final settlement with the relevant authority. Those tax positions failing to qualify for initial recognition are recognized in the first interim period in which they meet the more likely than not standard. This evaluation is made at the time that we adopt a tax position and whenever there is new information and is based upon management’s evaluation of the facts, circumstances and information available at the reporting date. We maintain a cumulative risk portfolio relating to all of our uncertainties in income taxes in order to perform this analysis, but the evaluation of our tax positions requires significant judgment and estimation in part because, in certain cases, tax law is subject to varied interpretation, and whether a tax position will ultimately be sustained may be uncertain. We do not currently believe that any of our pending tax assessments, even if ultimately resolved against us, would have a material impact on our results of operations and cash flows.
Determination of the various assumptions employed in the valuation of pension and retiree health care expense and associated obligations. Amounts recognized in the Consolidated Financial Statements related to pension and other postretirement benefits are determined from actuarial valuations. Inherent in such valuations are assumptions including expected return on plan assets, discount rates at which the liabilities could be settled, rates of increase in future compensation levels, mortality rates and health care cost trend rates. These assumptions are updated annually and are disclosed in Note 16 to the Consolidated Financial Statements. In accordance with GAAP, actual results that differ from the assumptions are accumulated and amortized over future periods and, therefore, affect expense recognized and obligations recorded in future periods.
We consider a number of factors in determining and selecting assumptions for the overall expected long-term rate of return on plan assets. We consider the historical long-term return experience of our assets, the current and expected allocation of our plan assets, and expected long-term rates of return. We derive these expected long-term rates of return with the assistance of our investment advisors. We base our expected allocation of plan assets on a diversified portfolio consisting of domestic and international equity securities, fixed income, real estate, and alternative asset classes.
We consider a variety of factors in determining and selecting our assumptions for the discount rate at December 31. For the U.S. plans, the discount rate was based on the internal rate of return for a portfolio of high quality bonds rated Aa or higher by either Moody’s or Standard & Poor's with maturities that are consistent with the projected future benefit payment obligations of the plan. For the Non-U.S. Plans, the discount rates were determined by region and are based on high quality long-term corporate bonds. Consideration has been given to the duration of the liabilities in each plan when selecting the bonds
to be used in determining the discount rate. The rate of compensation increase for all plans and the medical cost trend rate for the applicable U.S. plans are based on plan experience.
With respect to the U.S. plans, the expected rate of return on plan assets was determined based on an asset allocation model using the current target allocation, real rates of return by asset class and an anticipated inflation rate. The target asset allocation consists of approximately: 20% in equity securities and 80% in fixed income securities. The plan has achieved a compounded annual rate of return of 5.0% over the previous 20 years. At December 31, 2019, the actual asset allocation for the U.S. plan was: 1% cash and cash equivalents, 13% in equity securities and 86% in fixed income securities.
The expected rate of return for the non-U.S. plans employs a similar set of criteria adapted for local investments, inflation rates and in certain cases specific government requirements. The target asset allocation, for the non-U.S. plans, consists of approximately: 35% in fixed income securities; 35% in alternative investments; 15% in equity securities; and 15% in real estate. At December 31, 2019, the actual asset allocation for the non-U.S. plan was: 37% in fixed income investments; 14% in equity investments; 8% in real estate investments, 1% in cash and cash equivalents and 40% in alternative investments.
Changes in pension and associated expenses may occur in the future due to changes in these assumptions. The impact that a 0.25% decrease in the discount rate or long-term rate of return would have on our pension expense is as follows:
| Sensitivity of Disclosures to Changes in Selected Assumptions | |||||||||||||||
| 25 BP Decrease in Discount Rate | 25 BP Decrease in Discount Rate | 25 BP Decrease in Long-Term Rate of Return | |||||||||||||
| (DOLLARS IN THOUSANDS) | Change in PBO | Change in ABO | Change in pension expense | Change in pension expense | |||||||||||
| U.S. Pension Plans | $ | 14,613 | $ | 14,534 | $ | (102 | ) | $ | 1,248 | ||||||
| Non-U.S. Pension Plans | 55,415 | 55,374 | 2,687 | 1,935 |
The ongoing assessment of the valuation of inventory, given the large number of natural ingredients employed, the quality of which may be diminished over time. We hold a majority of our inventory as raw materials, providing the greatest degree of flexibility in manufacture and use. As of December 31, 2019, we maintained 50% of our inventory as raw materials. Materials are evaluated based on shelf life, known uses and anticipated demand based on forecasted customer order activity and changes in product/sales mix. Management policy provides for an ongoing assessment of inventory with adjustments recorded when an item is deemed to be slow moving or obsolete.
Accounting for Redeemable Noncontrolling Interest. The non-controlling interests that are reflected as redeemable non-controlling interests in our consolidated financial statements consist of those owners, including us, who have certain redemption rights, whether currently exercisable or not, and which currently, or in the future, require that we purchase or the owner sell the non-controlling interest held by the owner, if certain conditions are met and the owners request the purchase. We also have a call right which could be exercised when such conditions are met. We assumed these interests through some of our subsidiaries. Such noncontrolling interests are reported in the Consolidated Balance Sheet between liabilities and equity, as redeemable noncontrolling interest. We adjust the redeemable noncontrolling interests when the redemption value exceeds the carrying value with changes recognized as an adjustment to additional paid-in capital. Accounting for redeemable non-controlling interest involve judgment and complexity, specifically on the classification of the non-controlling interest in our consolidated balance sheet. Further, there is significant judgment involved in determining whether an equity instrument is currently redeemable or not currently redeemable but probable that the equity instrument will become redeemable. Estimating the redemption value of the redeemable non-controlling interests requires the use of significant assumptions and estimates. Changes in these assumptions and estimates can have a significant impact on the calculation of the redemption value.
Overall, we believe that we have considered relevant circumstances that we may be currently subject to, and the financial statements accurately reflect our best estimate of the impact of these items in our results of operations, financial condition and cash flows for the years presented. We have discussed the decision process and selection of these critical accounting policies with the Audit Committee of the Board of Directors.
New Accounting Standards
Please refer to Note 1 to the Consolidated Financial Statements for a discussion of recent accounting pronouncements.
Non-GAAP Financial Measures
We use non-GAAP financial measures in this Form 10-K, including: (i) currency neutral metrics, (ii) adjusted gross margin, (iii) adjusted operating profit and adjusted operating margin, (iv) adjusted selling and administrative expenses, and
(v) adjusted effective tax rate. We also provide the non-GAAP measures adjusted EBITDA and net debt solely for the purpose of providing information on the extent to which we are in compliance with debt covenants contained in its debt agreements. Our non-GAAP financial measures are defined below.
These non-GAAP financial measures are intended to provide additional information regarding our underlying operating results and comparable year-over-year performance. Such information is supplemental to information presented in accordance with GAAP and is not intended to represent a presentation in accordance with GAAP. In discussing our historical and expected future results and financial condition, we believe it is meaningful for investors to be made aware of and to be assisted in a better understanding of, on a period-to-period comparable basis, financial amounts both including and excluding these identified items, as well as the impact of exchange rate fluctuations. These non-GAAP measures should not be considered in isolation or as substitutes for analysis of our results under GAAP and may not be comparable to other companies’ calculation of such metrics.
Currency neutral metrics eliminate the effects that result from translating international currency to U.S. dollars. We calculate currency neutral numbers by comparing current year results to the prior year results restated at exchange rates in effect for the current year based on the currency of the underlying transaction.
Adjusted gross margin excludes operational improvement initiatives, integration related costs, FDA mandated product recall and Frutarom acquisition related costs.
Adjusted operating profit and adjusted operating margin excludes operational improvement initiatives, acquisition related costs, integration related costs, restructuring and other charges, net, losses (gains) on sale of assets, FDA mandated product recall, Frutarom acquisition related costs, compliance review & legal defense costs and N&B transaction related costs.
Adjusted selling and administrative expenses excludes acquisition related costs, integration related costs, Frutarom acquisition related costs, compliance review & legal defense costs and N&B transaction related costs.
Adjusted effective tax rate excludes operational improvement initiatives, acquisition related costs, integration related costs, restructuring and other charges, net, losses (gains) on sale of assets, FDA mandated product recall, U.S. tax reform, Frutarom acquisition related costs, compliance review & legal defense costs, N&B merger related costs and redemption value adjustment to EPS.
Net Debt to Combined Adjusted EBITDA is the leverage ratio used in our credit agreement and defined as Net Debt (which is long-term debt less cash and cash equivalents) divided by Combined Adjusted EBITDA. However, as Adjusted EBITDA for these purposes was calculated in accordance with the provisions of the credit agreement, it may differ from the calculation used for other purposes.
A. Reconciliation of Non-GAAP Metrics
| Reconciliation of Gross Profit | |||||||
| Year Ended December 31, | |||||||
| (DOLLARS IN THOUSANDS) | 2019 | 2018 | |||||
| Reported (GAAP) | $ | 2,112,748 | $ | 1,682,707 | |||
| Operational Improvement Initiatives (a) | 2,267 | 1,650 | |||||
| Integration Related Costs (c) | 730 | 102 | |||||
| FDA Mandated Product Recall (e) | 250 | (7,125 | ) | ||||
| Frutarom Acquisition Related Costs (g) | 4,247 | 23,550 | |||||
| Adjusted (Non-GAAP) | $ | 2,120,242 | $ | 1,700,884 |
| Reconciliation of Selling and Administrative Expenses | |||||||
| Year Ended December 31, | |||||||
| (DOLLARS IN THOUSANDS) | 2019 | 2018 | |||||
| Reported (GAAP) | $ | 876,121 | $ | 707,461 | |||
| Acquisition Related Costs (b) | — | 1,289 | |||||
| Integration Related Costs (c) | (53,481 | ) | (6,060 | ) | |||
| Frutarom Acquisition Related Costs (g) | (1,693 | ) | (66,082 | ) | |||
| Compliance Review & Legal Defense Costs (h) | (11,314 | ) | — | ||||
| N&B Transaction Related Costs (i) | (20,747 | ) | — | ||||
| Adjusted (Non-GAAP) | $ | 788,886 | $ | 636,608 |
| Reconciliation of Operating Profit | |||||||
| Year Ended December 31, | |||||||
| (DOLLARS IN THOUSANDS) | 2019 | 2018 | |||||
| Reported (GAAP) | $ | 665,270 | $ | 583,882 | |||
| Operational Improvement Initiatives (a) | 2,267 | 2,169 | |||||
| Acquisition Related Costs (b) | — | (1,289 | ) | ||||
| Integration Related Costs (c) | 55,160 | 7,188 | |||||
| Restructuring and Other Charges, net (d) | 29,765 | 4,086 | |||||
| Losses (Gains) on Sale of Assets | 2,367 | (1,177 | ) | ||||
| FDA Mandated Product Recall (e) | 250 | (7,125 | ) | ||||
| Frutarom Acquisition Related Costs (g) | 5,940 | 89,632 | |||||
| Compliance Review & Legal Defense Costs (h) | 11,314 | — | |||||
| N&B Transaction Related Costs (i) | 20,747 | — | |||||
| Adjusted (Non-GAAP) | $ | 793,080 | $ | 677,366 |
| Reconciliation of Net Income and EPS | |||||||||||||||||||||||||||||||
| Year Ended December 31, | |||||||||||||||||||||||||||||||
| 2019 | 2018 | ||||||||||||||||||||||||||||||
| (DOLLARS IN THOUSANDS) | Income before taxes | Taxes on income (k) | Net Income Attributable to IFF (l) | Diluted EPS (m) | Income before taxes | Taxes on income (k) | Net Income Attributable to IFF (l) | Diluted EPS (m) | |||||||||||||||||||||||
| Reported (GAAP) | $ | 557,452 | $ | 97,184 | $ | 455,873 | $ | 4.00 | $ | 447,757 | $ | 107,976 | $ | 337,302 | $ | 3.79 | |||||||||||||||
| Operational Improvement Initiatives (a) | 2,267 | 610 | 1,657 | 0.01 | 2,169 | 694 | 1,475 | 0.02 | |||||||||||||||||||||||
| Acquisition Related Costs (b) | (3,371 | ) | — | (3,371 | ) | (0.03 | ) | (1,289 | ) | (311 | ) | (978 | ) | (0.01 | ) | ||||||||||||||||
| Integration Related Costs (c) | 55,160 | 12,461 | 42,699 | 0.38 | 7,188 | 1,397 | 5,791 | 0.07 | |||||||||||||||||||||||
| Restructuring and Other Charges, net (d) | 29,765 | 6,797 | 22,968 | 0.20 | 4,086 | 1,020 | 3,066 | 0.03 | |||||||||||||||||||||||
| Losses (Gains) on Sale of Assets | 2,367 | 572 | 1,795 | 0.02 | (1,177 | ) | (352 | ) | (825 | ) | (0.01 | ) | |||||||||||||||||||
| FDA Mandated Product Recall (e) | 250 | 57 | 193 | — | (7,125 | ) | (1,601 | ) | (5,524 | ) | (0.06 | ) | |||||||||||||||||||
| U.S. Tax Reform (f) | — | — | — | — | — | (25,345 | ) | 25,345 | 0.29 | ||||||||||||||||||||||
| Frutarom Acquisition Related Costs (g) | 5,940 | 794 | 5,146 | 0.05 | 155,569 | 28,490 | 127,079 | 1.44 | |||||||||||||||||||||||
| Compliance Review & Legal Defense Costs (h) | 11,314 | 2,522 | 8,792 | 0.08 | — | — | — | — | |||||||||||||||||||||||
| N&B Transaction Related Costs (i) | 20,747 | 2,354 | 18,393 | 0.16 | — | — | — | — | |||||||||||||||||||||||
| Redemption value adjustment to EPS (j) | — | — | — | 0.02 | — | — | — | 0.03 | |||||||||||||||||||||||
| Adjusted (Non-GAAP) | $ | 681,891 | $ | 123,351 | $ | 554,145 | $ | 4.88 | $ | 607,178 | $ | 111,968 | $ | 492,731 | $ | 5.58 |
| (a) | For 2019, represents accelerated depreciation related to plant relocations in India and China. For 2018, represents accelerated depreciation in India and Taiwan asset write off. | ||||||||||||||
| (b) | For 2019, represents adjustments to the fair value for an equity method investment in Canada which we began consolidating in the second quarter. For 2018, represents adjustments to the contingent consideration payable for PowderPure, and transaction costs related to Fragrance Resources and PowderPure within Selling and administrative expenses. | ||||||||||||||
| (c) | Represents costs related to the integration of the Frutarom acquisition, principally advisory services. | ||||||||||||||
| (d) | For 2019, represents costs primarily related to the Frutarom Integration Initiative and the 2019 Severance Program, including severance related to outsourcing the IT function. For 2018, represents severance costs related to the 2017 Productivity Program and costs associated with the termination of agent relationships in a subsidiary. | ||||||||||||||
| (e) | For 2019, represents additional claims that management will pay to co-packers. For 2018, principally represents recoveries from the supplier for the third and fourth quarter, partially offset by final payments to the customer made for the effected product in the first quarter. | ||||||||||||||
| (f) | Represents charges incurred related to enactment of certain U.S tax legislation changes in December 2017. | ||||||||||||||
| (g) | Represents transaction-related costs and expenses related to the acquisition of Frutarom. For 2019, amount primarily includes amortization for inventory "step-up" costs and transaction costs. For 2018, amount primarily includes $23.5 million of amortization for inventory "step-up" costs, $39.4 million of bridge loan commitment fees included in Interest expense; $34.9 million make whole payment on the Senior Notes - 2007 and $3.9 million realized loss on a fair value hedge included in Loss on extinguishment of debt; $12.5 million realized gain on a foreign currency derivative included in Other income; and $66.0 million of transaction costs included in Selling and administrative expenses. | ||||||||||||||
| (h) | Costs related to reviewing the nature of inappropriate payments and review of compliance in certain other countries. In addition, includes legal costs for related shareholder lawsuits. | ||||||||||||||
| (i) | Represents costs and expenses related to the pending transaction with Nutrition & Biosciences Inc. | ||||||||||||||
| (j) | Represents the adjustment to EPS related to the excess of the redemption value of certain redeemable noncontrolling interests over their existing carrying value. |
| (k) | The income tax expense (benefit) on non-GAAP adjustments is computed in accordance with ASC 740 using the same methodology as the GAAP provision of income taxes. Income tax effects of non-GAAP adjustments are calculated based on the applicable statutory tax rate for each jurisdiction in which such charges were incurred, except for those items which are non-taxable for which the tax expense (benefit) was calculated at 0%. For fiscal year 2019, these non-GAAP adjustments were not subject to foreign tax credits or valuation allowances, but to the extent that such factors are applicable to any future non-GAAP adjustments we will take such factors into consideration in calculating the tax expense (benefit). | ||||||||||||||
| (l) | For 2019 and 2018, net income is reduced by income attributable to noncontrolling interest of $4.4M and $2.5M, respectively. | ||||||||||||||
| (m) | The sum of these items does not foot due to rounding. |
B. Foreign Currency Reconciliation
| Operating Profit | |||
| Year Ended December 31, | |||
| 2019 | 2018 | ||
| % Change - Reported (GAAP) | 14% | 6% | |
| Items impacting comparability (1) | 3% | 4% | |
| % Change - Adjusted (Non-GAAP) | 17% | 10% | |
| Currency Impact | 2% | (3)% | |
| % Change Year-over-Year - Currency Neutral Adjusted (Non-GAAP)****(2)****** | 20% | 7% |
(1) Includes items impacting comparability of $127.8 million for the year ended December 31, 2019 and includes $93.5 million of items impacting comparability for the year ended December 31, 2018.
(2) 2019 item does not foot due to rounding.
** Currency neutral amount is calculated by translating prior year amounts at the exchange rates used for the corresponding 2019 period. Currency neutral operating profit also eliminates the year-over-year impact of cash flow hedging.
Cautionary Statement Under the Private Securities Litigation Reform Act of 1995
Statements in this Form 10-K, which are not historical facts or information, are “forward-looking statements” within the meaning of The Private Securities Litigation Reform Act of 1995. Such forward-looking statements are based on management’s current assumptions, estimates and expectations and include statements concerning (i) our ability to achieve the anticipated benefits of the Frutarom acquisition, including $145 million of expected synergies; (ii) our ability to achieve our Vision 2021 strategy of accelerated revenue and profitability growth, (iii) the growth potential of the markets in which we operate, including the emerging markets, (iv) expected capital expenditures in 2020, (v) expectations regarding our 2017 Productivity Program; (vi) expectations regarding the Frutarom Integration Initiative, (vii) the expected costs and benefits of our ongoing optimization of our manufacturing operations, including the expected number of closings, (viii) our pending combination with Dupont’s Nutrition and Biosciences business, including the expected closing date of the transaction, and (ix) our ability to innovate and execute on specific consumer trends and demands. These forward-looking statements should be evaluated with consideration given to the many risks and uncertainties inherent in our business that could cause actual results and events to differ materially from those in the forward-looking statements. Certain of such forward-looking information may be identified by such terms as “expect”, “anticipate”, “believe”, “intend”, “outlook”, “may”, “estimate”, “should”, “predict” and similar terms or variations thereof. Such forward-looking statements are based on a series of expectations, assumptions, estimates and projections about the Company, are not guarantees of future results or performance, and involve significant risks, uncertainties and other factors, including assumptions and projections, for all forward periods. Our actual results may differ materially from any future results expressed or implied by such forward-looking statements. Such risks, uncertainties and other factors include, among others, the following:
| • | risks related to the integration of the Frutarom business, including whether we will realize the benefits anticipated from the acquisition in the expected time frame; |
| • | unanticipated costs, liabilities, charges or expenses resulting from the Frutarom acquisition; |
| • | our ability to realize expected cost savings and increased efficiencies of the Frutarom integration and our ongoing optimization of our manufacturing facilities; |
| • | the increase in our leverage resulting from the additional debt incurred to pay a portion of the consideration for Frutarom and its impact on our liquidity and ability to return capital to our shareholders; |
| • | our ability to successfully establish and manage acquisitions, collaborations, joint ventures or partnership; |
| • | our ability to successfully market to our expanded and diverse Taste customer base; |
| • | our ability to effectively compete in our market and develop and introduce new products that meet customers’ needs; |
| • | our ability to retain key employees; |
| • | changes in demand from large multi-national customers due to increased competition and our ability to maintain “core list” status with customers; |
| • | our ability to successfully develop innovative and cost-effective products that allow customers to achieve their own profitability expectations; |
| • | disruption in the development, manufacture, distribution or sale of our products from natural disasters, public health crises (such as the recent Coronavirus outbreak), international conflicts, terrorist acts, labor strikes, political crisis, accidents and similar events; |
| • | the impact of a disruption in our supply chain, including the inability to obtain ingredients and raw materials from third parties; |
| • | volatility and increases in the price of raw materials, energy and transportation; |
| • | the impact of a significant data breach or other disruption in our information technology systems, and our ability to comply with data protection laws in the U.S. and abroad; |
| • | our ability to comply with, and the costs associated with compliance with, regulatory requirements and industry standards, including regarding product safety, quality, efficacy and environmental impact; |
| • | our ability to react in a timely and cost-effective manner to changes in consumer preferences and demands, including increased awareness of health and wellness; |
| • | our ability to meet consumer, customer and regulatory sustainability standards; |
| • | our ability to benefit from our investments and expansion in emerging markets; |
| • | the impact of currency fluctuations or devaluations in the principal foreign markets in which we operate; |
| • | economic, regulatory and political risks associated with our international operations; |
| • | the impact of global economic uncertainty on demand for consumer products; |
| • | our ability to comply with, and the costs associated with compliance with, U.S. and foreign environmental protection laws; |
| • | our ability to successfully manage our working capital and inventory balances; |
| • | the impact of the failure to comply with U.S. or foreign anti-corruption and anti-bribery laws and regulations, including the U.S. Foreign Corrupt Practices Act; |
| • | any impairment on our tangible or intangible long-lived assets, including goodwill associated with the acquisition of Frutarom; |
| • | our ability to protect our intellectual property rights; |
| • | the impact of the outcome of legal claims, regulatory investigations and litigation; |
| • | changes in market conditions or governmental regulations relating to our pension and postretirement obligations; |
| • | the impact of changes in federal, state, local and international tax legislation or policies, including the Tax Cuts and Jobs Act, with respect to transfer pricing and state aid, and adverse results of tax audits, assessments, or disputes; |
| • | the impact of the United Kingdom’s departure from the European Union; |
| • | the impact of the phase out of the London Interbank Office Rate (LIBOR) on interest expense; |
| • | risks associated with our pending combination with N&B, including business uncertainties and contractual restrictions while the transaction is pending, costs incurred in connection with the transaction, our ability to pursue alternative transactions, and the impact if we fail to complete the transaction; and |
| • | risks associated with the integration of N&B if we are successful in completing the transaction, including whether we will realize the anticipated synergies and other benefits of the transaction. |
The foregoing list of important factors does not include all such factors, nor necessarily present them in order of importance. In addition, you should consult other disclosures made by the Company (such as in our other filings with the
Securities and Exchange Commission (“SEC”) or in company press releases) for other factors that may cause actual results to differ materially from those projected by the Company. Please refer to Part I. Item 1A., Risk Factors, of this Form 10-K for additional information regarding factors that could affect our results of operations, financial condition and liquidity.
We intend our forward-looking statements to speak only as of the time of such statements and do not undertake or plan to update or revise them as more information becomes available or to reflect changes in expectations, assumptions or results. We can give no assurance that such expectations or forward-looking statements will prove to be correct. An occurrence of, or any material adverse change in, one or more of the risk factors or risks and uncertainties referred to in this report or included in our other periodic reports filed with the SEC could materially and adversely impact our operations and our future financial results.
Any public statements or disclosures made by us following this report that modify or impact any of the forward-looking statements contained in or accompanying this report will be deemed to modify or supersede such outlook or other forward-looking statements in or accompanying this report.
Previous: Item 6. SELECTED FINANCIAL DATA. · Next: Item 7A. QUANTITATIVE AND QUALITATIVE DISCLOSURES ABOUT MARKET RISK.