 filings.tools
Item 1. Legal Proceedings
118K characters. Original on sec.gov ·
Item 1. Legal Proceedings
| Note 14 : | Contingencies |
Legal Proceedings
We are regularly party to various ongoing claims, litigation, and other proceedings, including those noted in this section. We have accrued a charge of $1.0 billion related to litigation involving VLSI (see VLSI Technology LLC v. Intel below), and a charge of $401 million related to an EC-imposed fine (see European Commission Competition Matter below). Excluding the VLSI claims, management at present believes that the ultimate outcome of these proceedings, individually and in the aggregate, will not materially harm our financial position, results of operations, cash flows, or overall trends; however, legal proceedings and related government investigations are subject to inherent uncertainties, and unfavorable rulings, excessive verdicts, or other events could occur. Unfavorable resolutions could include substantial monetary damages, fines, or penalties. Certain of these outstanding matters include speculative, substantial, or indeterminate monetary awards. In addition, in matters for which injunctive relief or other conduct remedies are sought, unfavorable resolutions could include an injunction or other order prohibiting us from selling one or more products at all or in particular ways, precluding particular business practices, or requiring other remedies. An unfavorable outcome may result in a material adverse impact on our business, results of operations, financial position, and overall trends. We might also conclude that settling one or more such matters is in the best interests of our stockholders, employees, and customers, and any such settlement could include substantial payments. Unless specifically described below, we have not concluded that settlement of any of the legal proceedings noted in this section is appropriate at this time.
In addition, in the second quarter of 2024, we accrued a charge of $780 million related to three separate confidential settlement agreements with R2, Third Point, and TRGP that we entered into in the third quarter of 2024 (see R2 Semiconductor Patent Litigation below).
 | Financial Statements | Notes to Financial Statements | 22 |
European Commission Competition Matter
In 2009, the EC found that we had used unfair business practices to persuade customers to buy microprocessors in violation of Article 82 of the EC Treaty (later renumbered Article 102) and Article 54 of the European Economic Area Agreement. In general, the EC found that we violated Article 82 by offering alleged “conditional rebates and payments” that required customers to purchase all or most of their x86 microprocessors from us and by making alleged “payments to prevent sales of specific rival products.” The EC ordered us to end the alleged infringement referred to in its decision and imposed a €1.1 billion fine, which we paid in the third quarter of 2009.
We appealed the EC decision to the European Court of Justice in 2014, after the General Court (then called the Court of First Instance) rejected our appeal of the EC decision in its entirety. In September 2017, the Court of Justice sent the case back to the General Court to examine whether the rebates at issue were capable of restricting competition. In January 2022, the General Court annulled the EC’s 2009 findings against us regarding rebates, as well as the €1.1 billion fine imposed on Intel, which was returned to us in February 2022. The General Court’s January 2022 decision did not annul the EC’s 2009 finding that we made payments to prevent sales of specific rival products.
In April 2022 the EC appealed the General Court’s findings regarding rebates to the Court of Justice. In October 2024 the Court of Justice dismissed the EC’s appeal, upholding the judgment of the General Court.
In September 2023 the EC imposed a €376 million ($401 million) fine against us based on its 2009 finding that we made payments to prevent sales of specific rival products. We have appealed the EC’s decision. We have accrued a charge for the fine and are unable to make a reasonable estimate of the potential loss or range of losses in excess of this amount given the procedural posture and the nature of these proceedings.
In a related matter, in April 2022 we filed applications with the General Court seeking an order requiring the EC to pay us approximately €593 million in default interest on the original €1.1 billion fine that was held by the EC for 12 years, which applications were stayed pending the EC’s appeal of the General Court’s January 2022 decision.
Litigation Related to Security Vulnerabilities
In June 2017, a Google research team notified Intel and other companies that it had identified security vulnerabilities, the first variants of which are now commonly referred to as “Spectre” and “Meltdown,” that affect many types of microprocessors, including our products. As is standard when findings like these are presented, we worked together with other companies in the industry to verify the research and develop and validate software and firmware updates for impacted technologies. In January 2018, information on the security vulnerabilities was publicly reported, before software and firmware updates to address the vulnerabilities were made widely available.
Consumer class action lawsuits against us were pending in the US and Canada. The plaintiffs, who purport to represent various classes of purchasers of our products, generally claim to have been harmed by our actions and/or omissions in connection with Spectre, Meltdown, and other variants of this class of security vulnerabilities that have been identified since 2018, and assert a variety of common law and statutory claims seeking monetary damages and equitable relief. In the US, class action suits filed in various jurisdictions between 2018 and 2021 were consolidated for all pretrial proceedings in the US District Court for the District of Oregon, which entered final judgment in favor of Intel in July 2022 based on plaintiffs’ failure to plead a viable claim. The Ninth Circuit Court of Appeals affirmed the district court’s judgment in November 2023, ending the litigation. In November 2023, new plaintiffs filed a consumer class action complaint in the US District Court for the Northern District of California with respect to a further vulnerability variant disclosed in August 2023 and commonly referred to as “Downfall.” In August 2024, the district court dismissed plaintiffs’ complaint for failure to plead a viable claim. Plaintiffs filed an amended complaint in September 2024, which we moved to dismiss in October 2024. In Canada, an initial status conference has not yet been scheduled in one case relating to Spectre and Meltdown pending in the Superior Court of Justice of Ontario, and a stay of a second case pending in the Superior Court of Justice of Quebec is in effect. Additional lawsuits and claims may be asserted seeking monetary damages or other related relief. Given the procedural posture and the nature of these cases, including that the pending proceedings are in the early stages, that alleged damages have not been specified, that uncertainty exists as to the likelihood of a class or classes being certified or the ultimate size of any class or classes if certified, and that there are significant factual and legal issues to be resolved, we are unable to make a reasonable estimate of the potential loss or range of losses, if any, that might arise from these matters.
Litigation Related to Segment Reporting and Internal Foundry Model
A securities class action lawsuit was filed in the US District Court for the Northern District of California in May 2024 against us and certain officers following the modification of our segment reporting in the first quarter of 2024 to align to our new internal foundry operating model. The plaintiff seeks monetary damages on behalf of all persons and entities that purchased or otherwise acquired our common stock from January 25, 2024 through April 25, 2024, and generally alleges that defendants violated the federal securities laws by making false or misleading statements about the growth and prospects of the Foundry business. In August 2024, the court ordered the case consolidated with a second, similar lawsuit in which the plaintiff seeks monetary damages on behalf of all purchasers of our common stock from January 25, 2024 through August 1, 2024. In September 2024, the court appointed co-lead counsel for the consolidated lawsuit and ordered them to file an amended consolidated complaint by the end of October 2024. Given the procedural posture and the nature of the case, including that it is in the early stages, that alleged damages have not been specified, that uncertainty exists as to the likelihood of a class being certified or the ultimate size of any class if certified, and that there are significant factual and legal issues to be resolved, we are unable to make a reasonable estimate of the potential loss or range of losses, if any, that might arise from the matter.
| Financial Statements | Notes to Financial Statements | 23 |
Several stockholder derivative lawsuits were filed in the Delaware state and federal courts since the filing of the securities class action lawsuit, alleging that our directors and certain officers breached their fiduciary duties and violated the federal securities laws by making or allowing the statements that are challenged in the securities class action lawsuit. The complaints seek to recover damages from the defendants on behalf of Intel. By stipulation of the parties, the courts have ordered the derivative lawsuits stayed pending certain developments in the securities class action lawsuit.
Litigation Related to Patent and IP Claims
We have had IP infringement lawsuits filed against us, including but not limited to those discussed below. Most involve claims that certain of our products, services, and technologies infringe others' IP rights. Adverse results in these lawsuits may include awards of substantial fines and penalties, costly royalty or licensing agreements, or orders preventing us from offering certain features, functionalities, products, or services. As a result, we may have to change our business practices, and develop non-infringing products or technologies, which could result in a loss of revenue for us and otherwise harm our business. In addition, certain agreements with our customers require us to indemnify them against certain IP infringement claims, which can increase our costs as a result of defending such claims, and may require that we pay significant damages, accept product returns, or supply our customers with non-infringing products if there were an adverse ruling in any such claims. In addition, our customers and partners may discontinue the use of our products, services, and technologies, as a result of injunctions or otherwise, which could result in loss of revenue and adversely affect our business.
VLSI Technology LLC v. Intel
In October 2017, VLSI Technology LLC (VLSI) filed a complaint against us in the US District Court for the Northern District of California alleging that various Intel FPGA and processor products infringe eight patents VLSI acquired from NXP Semiconductors, N.V. (NXP). VLSI sought damages, attorneys’ fees, costs and interest. Intel prevailed on all eight patents and the court entered final judgment in April 2024. In April 2019, VLSI filed three infringement suits against us in the US District Court for the Western District of Texas accusing various of our processors of infringement of eight additional patents it had acquired from NXP:
▪The first Texas case went to trial in February 2021, and the jury awarded VLSI $1.5 billion for literal infringement of one patent and $675 million for infringement of another patent under the doctrine of equivalents. In April 2022, the court entered final judgment, awarding VLSI $2.2 billion in damages and approximately $162 million in pre-judgment and post-judgment interest. We appealed the judgment to the Federal Circuit Court of Appeals, including the court’s rejection of Intel’s claim to have a license from Fortress Investment Group’s acquisition of Finjan. The Federal Circuit Court heard oral argument in October 2023. In December 2023, the Federal Circuit reversed the finding of infringement as to the patent for which VLSI was awarded $675 million. The Federal Circuit affirmed the finding of infringement as to the patent for which VLSI had been awarded $1.5 billion, but vacated the damages award and sent the case back to the trial court for further damages proceedings on that patent. The Federal Circuit also ruled that Intel can advance the defense that it is licensed to VLSI’s patents. In December 2021 and January 2022 the Patent Trial and Appeal Board (PTAB) instituted Inter Partes Reviews (IPR) on the claims found to have been infringed in the first Texas case, and in May and June 2023 found all of those claims unpatentable; VLSI has appealed the PTAB’s decisions. In April 2024, Intel moved to add the defense that it is licensed to VLSI’s patents. No trial dates have been set.
▪The second Texas case went to trial in April 2021, and the jury found that we do not infringe the asserted patents. VLSI had sought approximately $3.0 billion for alleged infringement, plus enhanced damages for willful infringement. In September 2024, the court denied VLSI’s motion for a new trial. Other post-trial motions remain pending, and the court has not yet entered final judgment.
▪The third Texas case went to trial in November 2022, with VLSI asserting one remaining patent. The jury found the patent valid and infringed, and awarded VLSI approximately $949 million in damages, plus interest and a running royalty. The court has not yet entered final judgment. In February 2023, we filed motions for a new trial and for judgment as a matter of law notwithstanding the verdict on various grounds. Further appeals are possible. In April 2024, Intel moved to add the defense that it is licensed to VLSI’s patents, and the court granted Intel’s motion that same month.
In May 2019, VLSI filed a case in Shenzhen Intermediate People’s Court against Intel, Intel (China) Co., Ltd., Intel Trading (Shanghai) Co., Ltd., and Intel Products (Chengdu) Co., Ltd. VLSI asserted one patent against certain Intel Core processors. Defendants filed an invalidation petition in October 2019 with the China National Intellectual Property Administration (CNIPA) which held a hearing in September 2021. The Shenzhen court held trial proceedings in July 2021, and September 2023. VLSI sought an injunction as well as RMB 1.3 million in costs and expenses, but no damages. In September 2023, the CNIPA invalidated every claim of the asserted patent. In November 2023, the trial court dismissed VLSI’s case.
In May 2019, VLSI filed a case in Shanghai Intellectual Property Court against Intel (China) Co., Ltd., Intel Trading (Shanghai) Co., Ltd., and Intel Products (Chengdu) Co., Ltd. asserting one patent against certain Intel core processors. The court held a trial hearing in December 2020, where VLSI requested expenses (RMB 300 thousand) and an injunction. In December 2022, we filed a petition to invalidate the patent at issue. The court held a second trial hearing in May 2022, and in October 2023, issued a decision finding no infringement and dismissing all claims. In November 2023, VLSI appealed the finding of non-infringement to the Supreme People’s Court. The Supreme People’s Court has set an evidentiary hearing in October 2024.
| Financial Statements | Notes to Financial Statements | 24 |
In July 2024, Intel filed suit against VLSI in U.S. District Court for the District of Delaware requesting the court find Intel is licensed to VLSI’s patents. In September 2024, VLSI filed motions requesting that Intel’s complaint be dismissed, transferred, or stayed.
As of September 28, 2024, we have accrued a charge of approximately $1.0 billion related to the VLSI litigation. While we dispute VLSI’s claims and intend to vigorously defend against them, we are unable to make a reasonable estimate of losses in excess of recorded amounts given recent developments and future proceedings.
R2 Semiconductor Patent Litigation
In November 2022, R2 Semiconductor, Inc. (R2) filed a lawsuit in the High Court of Justice in the UK against Intel Corporation (UK) Limited and Intel Corporation, and a lawsuit in the Dusseldorf Regional Court in Germany against Intel Deutschland GmbH and certain Intel customers. R2 asserts one European patent is infringed by Intel’s Ice Lake, Tiger Lake, Alder Lake and Ice Lake Server (Xeon) processors (the accused products), and customer servers and laptops that contain those processors. In July 2024, the UK High Court of Justice found the UK part of R2’s European patent invalid. In February 2024, the Dusseldorf court found Intel’s processors infringe and issued an injunction and recall order against Intel and its customers. In March 2024, R2 asserted the same patent against Fujitsu and Amazon Web Services in Dusseldorf Regional Court, accusing Ice Lake and Sapphire Rapids in the AWS suit; and Tiger Lake, Ice Lake, Alder Lake, Raptor Lake, and Sapphire Rapids in the Fujitsu suit. R2 seeks an injunction, recall and damages. Intel is indemnifying and defending its customers. In March 2024, Intel Corporation Italia S.P.A. filed an action in the Tribunale di Milano seeking an order that Intel processors do not infringe R2’s patent. In May 2024, R2 filed suit in Milan against Intel Corporation Italia S.P.A. and Italian affiliates of customers Dell, HP, and HPE, accusing Intel’s Ice Lake (server and client), Tiger Lake, Alder Lake, and Raptor Lake processors of infringing its patent, and requesting that its suit be consolidated with Intel Corporation Italia S.P.A.’s suit. R2 is requesting an injunction and damages. In April 2024, R2 filed an action against Intel and its customers Dell, HP, and HPE for patent infringement before the Tribunal Judiciaire of Paris. Intel and its customers filed a nullity action against the patent in France.
In light of the potential disruption to Intel’s and its customers’ businesses in Europe were the Dusseldorf Regional Court’s injunction and recall order to be enforced before a decision by the appeals court was expected, the significant delay expected before a decision by the appeals court, and the additional ongoing and potential litigation across other jurisdictions and with respect to other Intel processors and customers, in August 2024 Intel entered into three separate confidential agreements with R2, Third Point (the controlling shareholder) and TRGP Capital (a third-party organization funding the lawsuits) to resolve the injunction enforcement risk and related pending litigation, and provide for broad-based litigation peace with these entities, which included rights to other technology and services to Intel. Across the three agreements, Intel will pay an aggregate amount of $780 million.
| Financial Statements | Notes to Financial Statements | 25 |
| Key Terms | |||||
We use terms throughout our document that are specific to Intel or that are abbreviations that may not be commonly known or used. Below is a list of these terms used in our document.
| Term | Definition | |||||||||||||
| 2024 Restructuring Plan | Cost and capital reduction initiatives approved by management, the board of directors or the Audit & Finance Committee of the board of directors designed to adjust spending to current business trends and achieve objectives announced in Q3 2024 with respect to reducing operating expenses, reducing capital expenditures and reducing cost of sales while enabling Intel's new operating model and continuing to fund investments in Intel's core strategy. | |||||||||||||
| 5G | The fifth-generation mobile network, which brings dramatic improvements in network speeds and latency, and which we view as a transformative technology and opportunity for many industries | |||||||||||||
| AI | Artificial intelligence | |||||||||||||
| ASC | Accounting Standards Codification | |||||||||||||
| ASP | Average selling price | |||||||||||||
| Back end services | Includes assembly, test and packaging services | |||||||||||||
| CCG | Client Computing Group operating segment | |||||||||||||
| CODM | Chief operating decision maker | |||||||||||||
| CPU | Processor or central processing unit | |||||||||||||
| CPLD | Complex programmable logic device | |||||||||||||
| DCAI | Data Center and Artificial Intelligence operating segment | |||||||||||||
| EC | European Commission | |||||||||||||
| EPS | Earnings per share | |||||||||||||
| 2023 Form 10-K | Annual Report on Form 10-K for the year ended December 30, 2023 | |||||||||||||
| Form 10-Q | Quarterly Report on Form 10-Q for the quarter ended June 29, 2024 | |||||||||||||
| FPGA | Field-programmable gate array | |||||||||||||
| HPC | High performance computing | |||||||||||||
| IDM 2.0 | Evolution of our IDM model that combines our internal factory network, strategic use of foundry capacity and our IFS business to position us to drive technology and product leadership | |||||||||||||
| IP | Intellectual property | |||||||||||||
| IPO | Initial public offering | |||||||||||||
| MD&A | Management's Discussion and Analysis | |||||||||||||
| MG&A | Marketing, general, and administrative | |||||||||||||
| NAND | NAND flash memory | |||||||||||||
| NEX | Networking and Edge operating segment | |||||||||||||
| R&D | Research and development | |||||||||||||
| RSU | Restricted stock unit | |||||||||||||
| SCIP | Semiconductor Co-Investment Program | |||||||||||||
| SEC | US Securities and Exchange Commission | |||||||||||||
| Smart Capital | Our Smart Capital approach accelerates progress on our IDM 2.0 strategy. This approach is designed to enable us to adjust quickly to opportunities in the market, while managing our margin structure and capital spending. The elements of Smart Capital include capacity investments, government incentives, customer commitments, continued use of external foundries. | |||||||||||||
| SoC | A system on a chip, which integrates most of the components of a computer or other electronic system into a single silicon chip. We offer a range of SoC products in CCG, DCAI, and NEX. Our DCAI and NEX businesses offer SoCs across many market segments for a variety of applications, including products targeted for 5G base stations and network infrastructure | |||||||||||||
| US | United States | |||||||||||||
| US GAAP | US Generally Accepted Accounting Principles | |||||||||||||
| VIE | Variable interest entity | |||||||||||||
| Financial Statements | Notes to Financial Statements | 26 |
| Management's Discussion and Analysis | |||||
This report should be read in conjunction with our 2023 Form 10-K where we include additional information on our business, operating segments, risk factors, critical accounting estimates, policies, and the methods and assumptions used in our estimates, among other important information.
In Q3 2024, we announced our intention to implement a series of cost and capital reduction initiatives designed to adjust our spending to current business trends while enabling our new operating model and continuing to fund investments in our core strategy - returning to process leadership. These initiatives include reducing headcount by approximately 16,500 employees as of Q3 2024, consolidating and reducing our global real estate footprint, conducting portfolio reviews of our businesses under a 'clean sheet' view, rationalizing capital investments and deployments based upon demand signals and capacity requirements, and reducing our overall operating expenses. We expect the total impact from headcount reduction initiatives to exceed 15% of our core Intel workforce by year end. As a result of initiating and deploying our 2024 Restructuring Plan, we recognized restructuring charges of $2.8 billion in Q3 2024 as follows:
▪cash-based employee severance and related employee exit charges of $2.2 billion;
▪non-cash charges directly resulting from our decision to exit manufacturing capabilities for internal-use test hardware, resulting in the impairment of certain construction in progress assets of $442 million; and
▪non-cash charges associated with real estate consolidation and exits that resulted in the impairment of certain operating leased assets and related leasehold improvements of $86 million.
In Q3 2024, our consolidated results of operations were also materially impacted by the following:
▪$3.1 billion of charges, substantially all of which were recorded to cost of sales, related to non-cash impairments and the acceleration of depreciation for certain manufacturing assets, a substantial majority of which related to our Intel 7 process node;
▪$2.9 billion of non-cash charges, all of which were recorded as other charges in the restructuring and other line as presented in our Consolidated Condensed Statements of Income, which were associated with the impairment of goodwill for certain of our reporting units as well as certain acquired intangible assets (combined with the restructuring charges associated with the 2024 Restructuring Plan, our restructuring and other charges totaled $5.6 billion in Q3 2024 — see "Note 6: Restructuring and Other Charges" within Notes to Consolidated Condensed Financial Statements); and
▪$9.9 billion of non-cash charges recorded to provision for (benefit from) income taxes that substantially related to valuation allowances recorded to our net deferred tax assets (see "Note 7: Income Taxes" within Notes to Consolidated Condensed Financial Statements).
Our discussion regarding our segments' results of operations presented below excludes the $5.6 billion of restructuring and other charges and $9.9 billion of charges resulting from valuation allowances recorded against our net deferred tax assets, in addition to certain other items, as our chief operating decision maker receives, views and uses information for decision making purposes based upon segment results that exclude such items.
"Note 2: Operating Segments" within Notes to Consolidated Condensed Financial Statements of this Form 10-Q provides additional information about our operating segments, including the nature of segment revenues and expenses, and reconciles our segment revenues presented below to our total consolidated net revenues and our segment operating income (loss) presented below to our total consolidated operating income (loss) for each of the periods presented.
Separately, during and following Q3 2024, there has been a significant escalation in hostilities in Israel and the surrounding region. We continue to monitor the impact the geopolitical conflict could have on our operations in Israel, including potential disruption of our wafer fabrication facility and our product development centers. To date, while we have had a substantial number of our employees called for active military duty, we have not had a material interruption in either our manufacturing operations or our product development centers. As a significant portion of our revenues are generated from products on Intel 7 manufactured at our fabrication facility in Israel and we are not insured for business interruptions, a disruption of that facility could have a significant adverse impact on our business. Additionally, our property, plant, and equipment assets in Israel are self-insured and could be impacted from the conflict.
For additional key highlights of our results of operations, see "A Quarter in Review."
| MD&A | 27 |
| Operating Segment Trends and Results |
Intel Products
Intel Products consists substantially of the design, development, marketing, sale, support, and servicing of CPUs and related solutions for third party customers. Intel Products is comprised of three operating segments: CCG, DCAI, and NEX.
Financial Performance
| Intel Products Operating Segments Revenue $B | Intel Products Segments Operating Income $B |
| Operating Segments Revenue and Segments Operating Income Summary |
| Q3 2024 vs. Q3 2023 |
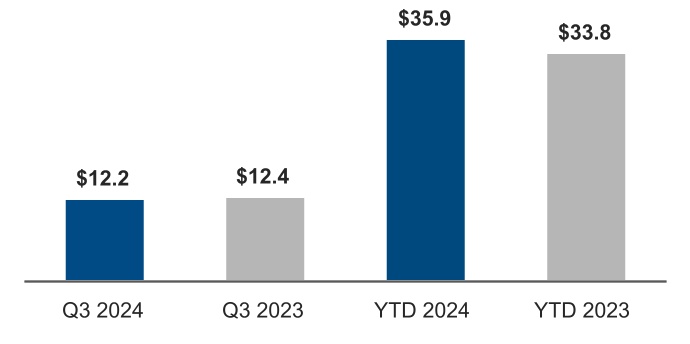
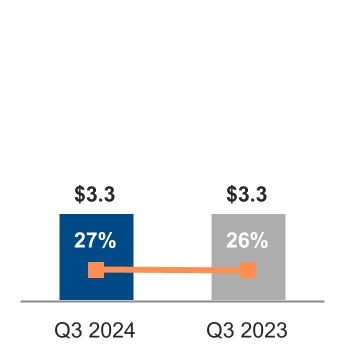
Total Intel Products revenue was $12.2 billion in Q3 2024 and $12.4 billion in Q3 2023. Revenue decreased in Q3 2024 due to our CCG operating segment. Total Intel Products operating income was $3.3 billion in Q3 2024, roughly flat with Q3 2023.
| YTD 2024 vs. YTD 2023 |
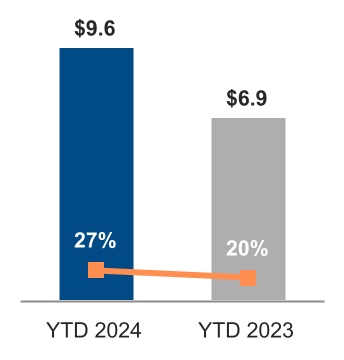
Total Intel Products revenue was $35.9 billion in YTD 2024 and $33.8 billion in YTD 2023. Revenue increased in YTD 2024 due to our CCG and DCAI operating segments. Total Intel Products operating income increased to $9.6 billion, or 27% operating margin for YTD 2024 from $6.9 billion, or 20% operating margin in YTD 2023. This YTD 2024 operating margin increase is primarily due to higher YTD 2024 CCG revenue, lower YTD 2024 period charges across each of the Intel Products' operating segments due to the sell-through of previously reserved inventory and lower reserves taken, partially offset by higher YTD 2024 unit costs in CCG and DCAI.
| MD&A | 28 |
Client Computing Group
We are committed to advancing PC experiences by delivering an annual cadence of leadership products and deepening our relationships with industry partners to co-engineer and deliver leading platform innovation. We engage in an intentional effort to bring together the operating system, system architecture, hardware, and software application integration to enable industry-leading PC experiences. We embrace these opportunities by focusing our roadmap, delivering innovative PC capabilities, and designing advanced PC experiences. By doing this, we believe we help continue to fuel innovation across the industry, providing a solid source of IP, scale, and cash flow for Intel.
Financial Performance
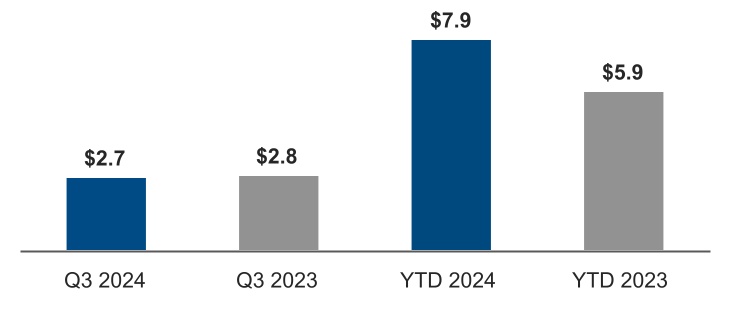
| CCG Operating Segment Revenue $B | CCG Segment Operating Income $B |
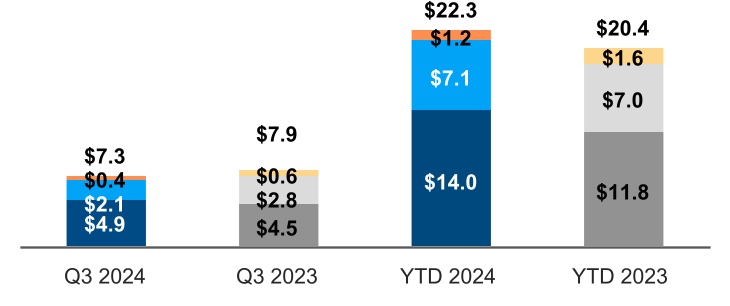
| ■ | ■ Notebook | ■ | ■ Desktop | ■ | ■ Other |
| Operating Segment Revenue Summary |
| Q3 2024 vs. Q3 2023 |
**▪**Notebook revenue was $4.9 billion, up $385 million from Q3 2023. Notebook volume increased 6% in Q3 2024 as customer inventory levels improved compared to Q3 2023. Notebook ASPs increased 3% in Q3 2024 primarily driven by the ramp of newly introduced products based upon Intel 4 process technology and higher ASPs on older generation products, partially offset by a higher mix of small core products.
**▪**Desktop revenue was $2.1 billion, down $683 million from Q3 2023. Desktop volume decreased 26% in Q3 2024 primarily due to customers tempering purchases to reduce existing inventories and lower demand compared to Q3 2023. Desktop ASPs in Q3 2024 were roughly flat with Q3 2023.
**▪**Other revenue was $372 million, down $239 million from Q3 2023 primarily driven by the exit of legacy businesses.
| YTD 2024 vs. YTD 2023 |
**▪**Notebook revenue was $14.0 billion, up $2.2 billion from YTD 2023. Notebook volume increased 17% in YTD 2024 as customer inventory levels improved compared to higher levels in YTD 2023. Notebook ASPs increased 2% in YTD 2024 primarily driven by the ramp of newly introduced products based upon Intel 4 process technology, partially offset by a higher mix of small core products.
**▪**Desktop revenue was $7.1 billion, up $56 million from YTD 2023. Desktop volume and ASPs were roughly flat with YTD 2023.
**▪**Other revenue was $1.2 billion, down $440 million from YTD 2023 primarily driven by the exit of legacy businesses.
| MD&A | 29 |
| Segment Operating Income Summary |
Operating income decreased 2% from Q3 2023, with an operating margin of 37% in Q3 2024.
Operating income increased 32% from YTD 2023, with an operating margin of 35% in YTD 2024.
| (In Millions) | ||||||||||||||
| $ | 2,722 | Q3 2024 Operating Income | ||||||||||||
| (389) | Lower product profit primarily from lower desktop revenue | |||||||||||||
| 260 | Higher product profit primarily from higher notebook revenue | |||||||||||||
| 71 | Other | |||||||||||||
| $ | 2,780 | Q3 2023 Operating Income | ||||||||||||
| $ | 7,864 | YTD 2024 Operating Income | ||||||||||||
| 1,305 | Higher product profit primarily from higher notebook and desktop revenue | |||||||||||||
| 413 | Lower other period charges primarily driven by lower inventory reserves taken, higher sell-through of previously reserved inventory and lower samples | |||||||||||||
| (150) | Higher unit cost primarily from increased mix of Intel 4 and Intel 7 products | |||||||||||||
| 350 | Other | |||||||||||||
| $ | 5,946 | YTD 2023 Operating Income |
| MD&A | 30 |
Data Center and AI
DCAI delivers cutting-edge workload-optimized solutions to cloud service providers and enterprises, along with silicon devices for communications service providers, network and edge, and HPC customers. Our unique capabilities enable us to help solve our customers' most complex challenges with the depth and breadth of our hardware and software portfolio, advanced packaging, and at-scale manufacturing made possible through a resilient, global supply chain. Our global customers and partners encompass cloud hyperscalers, multinational corporations, small-and medium-sized enterprises, independent software vendors, systems integrators, communications service providers, and governments.
Financial Performance
| DCAI Operating Segment Revenue $B | DCAI Segment Operating Income $B |
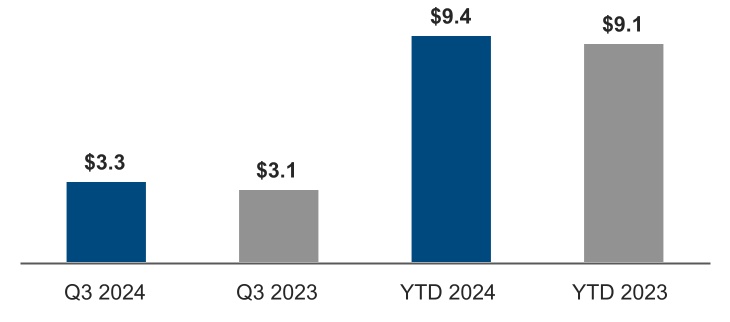
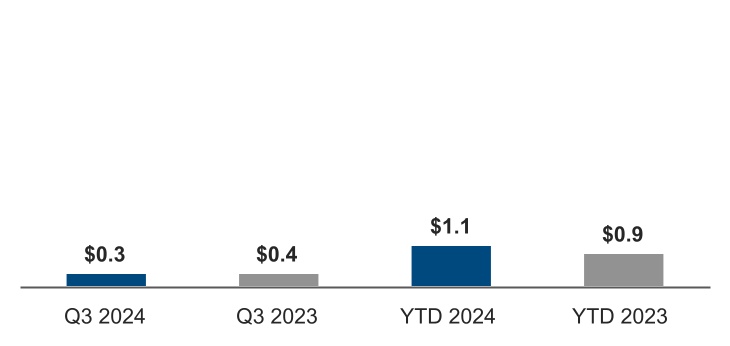
| Operating Segment Revenue Summary |
| Q3 2024 vs. Q3 2023 |
Revenue was $3.3 billion, up $273 million from Q3 2023, primarily driven by an increase in server revenue. Server volume increased 6% in Q3 2024 due to increased hyperscale customer-related demand. Server ASPs in Q3 2024 were roughly flat with Q3 2023.
| YTD 2024 vs. YTD 2023 |
Revenue was $9.4 billion, up $298 million from YTD 2023, driven by an increase in server revenue. Server ASPs increased 16% in YTD 2024 primarily due to a higher mix of high core count products. Server volume decreased 11% in YTD 2024 due to lower demand in a competitive environment and a higher mix of high core count products.
| MD&A | 31 |
| Segment Operating Income Summary |
Operating income decreased 11% from Q3 2023, with an operating margin of 10% in Q3 2024.
Operating income increased 25% from YTD 2023, with an operating margin of 12% in YTD 2024.
| (In Millions) | ||||||||||||||
| $ | 347 | Q3 2024 Operating Income | ||||||||||||
| (313) | Higher period charges due to higher accelerator inventory reserves taken and other direct spending charges incurred | |||||||||||||
| (192) | Higher server unit cost primarily driven by an increased mix of Intel 7 products | |||||||||||||
| 249 | Lower period charges primarily driven by the sell-through of previously reserved inventory and lower non-accelerator inventory reserves taken | |||||||||||||
| 116 | Higher product profit primarily from higher server revenue | |||||||||||||
| 96 | Other | |||||||||||||
| $ | 391 | Q3 2023 Operating Income | ||||||||||||
| $ | 1,105 | YTD 2024 Operating Income | ||||||||||||
| 752 | Lower period charges primarily driven by the sell-through of previously reserved inventory and lower non-accelerator inventory reserves taken | |||||||||||||
| 573 | Higher product profit on higher ASPs, net of reduced profit on lower volumes | |||||||||||||
| (788) | Higher server unit cost primarily driven by an increased mix of Intel 7 products | |||||||||||||
| (313) | Higher period charges due to higher accelerator inventory reserves taken and other direct spending charges incurred | |||||||||||||
| (240) | Higher operating expenses primarily driven by increased product development costs | |||||||||||||
| 239 | Other | |||||||||||||
| $ | 882 | YTD 2023 Operating Income |
| MD&A | 32 |
Network & Edge
NEX lifts the world's networks and edge compute systems from inflexible fixed-function hardware to general-purpose compute, acceleration, and networking devices running cloud native software on programmable hardware. We work with partners and customers to deliver and deploy intelligent edge platforms that allow software developers to achieve agility and to drive automation using AI for efficient operations while securing the integrity of their data at the edge. We have a broad portfolio of hardware and software platforms, tools, and ecosystem partnerships for the rapid digital transformation happening from the cloud to the edge. We are leveraging our core strengths in process, software, and manufacturing at scale to grow traditional markets and to accelerate entry into emerging ones.
Financial Performance
| NEX Operating Segment Revenue $B | NEX Segment Operating Income $B |
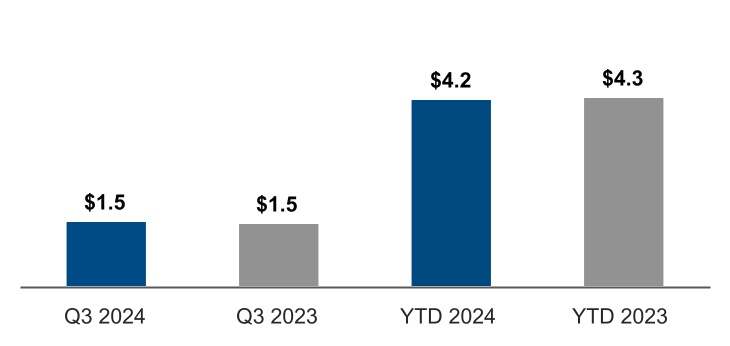
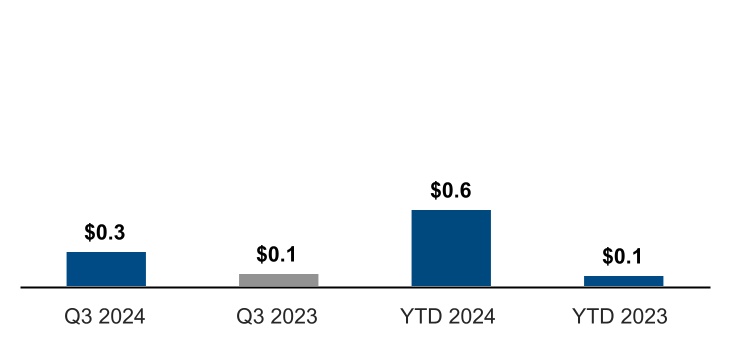
| Operating Segment Revenue Summary |
| Q3 2024 vs. Q3 2023 and YTD 2024 vs. YTD 2023 |
Revenue was $1.5 billion, up $61 million from Q3 2023. YTD 2024 revenue was $4.2 billion, down $84 million from YTD 2023, primarily due to 5G customers tempering purchases to reduce existing inventories, partially offset by higher Edge and Network revenue.
| Segment Operating Income Summary |
Operating income increased 168% from Q3 2023, with an operating margin of 18% in Q3 2024.
Operating income increased $496 million from YTD 2023, with an operating margin of 14% in YTD 2024.
| (In Millions) | ||||||||||||||
| $ | 268 | Q3 2024 Operating Income | ||||||||||||
| 116 | Lower period charges primarily driven by the sell-through of previously reserved inventory and lower reserves taken | |||||||||||||
| 52 | Other | |||||||||||||
| $ | 100 | Q3 2023 Operating Income | ||||||||||||
| $ | 591 | YTD 2024 Operating Income | ||||||||||||
| 371 | Lower period charges primarily driven by the sell-through of previously reserved inventory and lower reserves taken | |||||||||||||
| 125 | Other | |||||||||||||
| $ | 95 | YTD 2023 Operating Income |
| MD&A | 33 |
Intel Foundry
Intel Foundry, comprising our Foundry Technology Development, Foundry Manufacturing and Supply Chain, and Foundry Services organizations, is on a mission to deliver the best systems foundry capabilities to our customers and reshape the world’s semiconductor industry. As the stewards of Moore’s law, we continually innovate and advance world-class silicon process and advanced packaging technologies for customers. Our systems foundry offerings are strengthened by a robust design ecosystem with key industry partners, our systems of chips capabilities, and our secure, resilient and more sustainable supply chain. Our systems foundry is built on the foundation of our silicon process and advanced packaging technology offerings and enables co-optimized solutions for our customers in the AI era. We are strengthening the resilience of the global semiconductor supply chain for leading-edge and mature node semiconductor products by investing in geographically balanced and more sustainable manufacturing capacity. As a systems foundry for the AI era, Intel Foundry brings together these critical components to help our global customers drive the next phase of technology innovation.
Financial Performance
| Intel Foundry Operating Segment Revenue $B | Intel Foundry Segment Operating Loss $B |
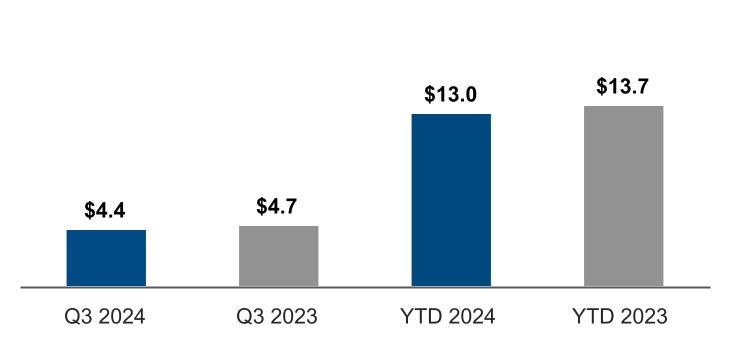
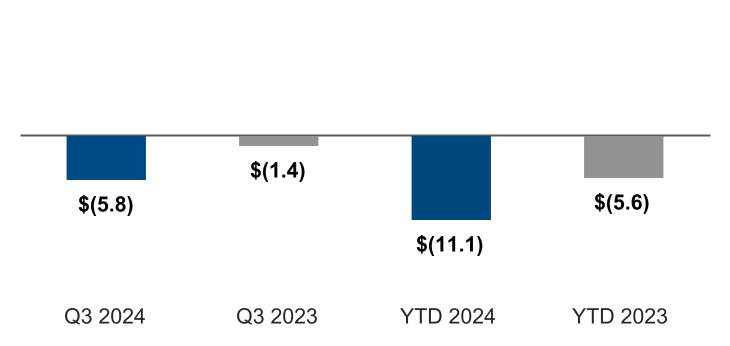
| Operating Segment Revenue Summary |
| Q3 2024 vs. Q3 2023 |
Revenue was $4.4 billion, down $380 million from Q3 2023. Intersegment revenue was $4.3 billion, down $135 million from Q3 2023 driven by lower intersegment ASPs and lower back end services revenue, partially offset by higher intersegment revenue from higher wafer volume primarily from Intel 3, Intel 4, and Intel 7 process nodes, and higher advanced packaging revenue. External revenue was $67 million, down $245 million from Q3 2023 driven by lower traditional packaging services and lower equipment sales.
| YTD 2024 vs. YTD 2023 |
Revenue was $13.0 billion, down $694 million from YTD 2023. Intersegment revenue was $12.9 billion, down $204 million from YTD 2023 driven by lower intersegment ASPs, lower back end services revenue, and higher intersegment credits in YTD 2024. These intersegment revenue decreases were partially offset by higher intersegment revenue from higher wafer volume primarily from Intel 3, Intel 4, and Intel 7 process nodes, and higher advanced packaging revenue. External revenue was $171 million, down $490 million from YTD 2023, driven by lower traditional packaging services and lower equipment sales.
| MD&A | 34 |
| Segment Operating Loss Summary |
Operating loss was $5.8 billion in Q3 2024, compared to an operating loss of $1.4 billion in Q3 2023.
Operating loss was $11.1 billion in YTD 2024, compared to an operating loss of $5.6 billion in YTD 2023.
| (In Millions) | ||||||||||||||
| $ | (5,844) | Q3 2024 Operating Loss | ||||||||||||
| (3,095) | Higher period charges related to non-cash impairments and the acceleration of depreciation for certain manufacturing assets, a substantial majority of which related to our Intel 7 process node | |||||||||||||
| (976) | Lower intersegment product and services profit primarily due to lower intersegment ASPs, lower intersegment samples, and lower external revenue | |||||||||||||
| (297) | Higher operating expenses primarily driven by increased investments in process technology | |||||||||||||
| (136) | Higher period charges primarily related to factory start-up costs | |||||||||||||
| 67 | Other | |||||||||||||
| $ | (1,407) | Q3 2023 Operating Loss | ||||||||||||
| $ | (11,148) | YTD 2024 Operating Loss | ||||||||||||
| (3,262) | Higher period charges related to non-cash impairments and the acceleration of depreciation for certain manufacturing assets, a substantial majority of which related to our Intel 7 process node | |||||||||||||
| (1,855) | Lower intersegment product and services profit primarily due to lower intersegment ASPs, higher intersegment credits, lower intersegment samples, and lower external revenue | |||||||||||||
| (684) | Higher operating expenses primarily driven by increased investments in process technology | |||||||||||||
| (530) | Higher period charges primarily related to factory start-up costs | |||||||||||||
| 610 | Lower period charges related to excess capacity charges | |||||||||||||
| 209 | Lower period charges driven by lower intersegment inventory reserves taken | |||||||||||||
| $ | (5,636) | YTD 2023 Operating Loss |
| MD&A | 35 |
All Other
Our "all other" category includes results of operations from our Altera and Mobileye businesses, from "other" non-reportable segments not otherwise presented, from start-up businesses that support our initiatives, and historical results of operations from divested businesses. Altera offers programmable semiconductors, primarily FPGAs, CPLDs, acceleration platforms, software, IP, and related products, for a broad range of applications across our embedded, communications, cloud, and enterprise market segments. Mobileye is a global leader in driving assistance and self-driving solutions, with a product portfolio designed to encompass the entire stack required for assisted and autonomous driving, including compute platforms, computer vision, and machine learning-based perception, mapping and localization, driving policy, and active sensors in development.
Financial Performance
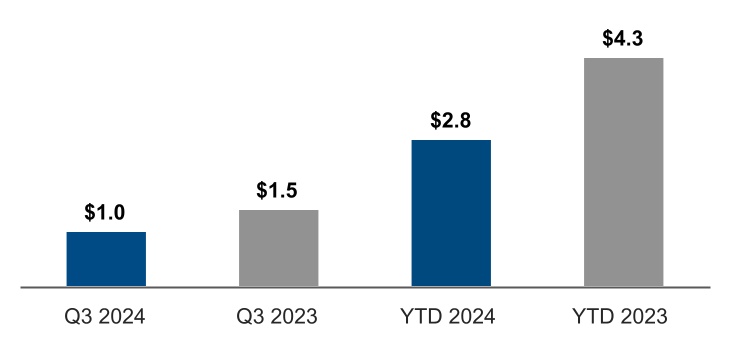
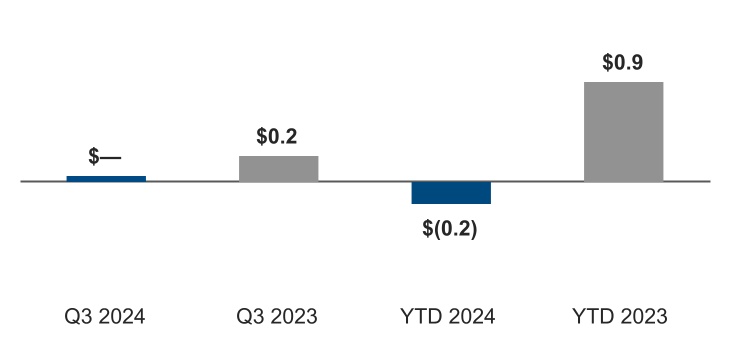
| All Other Operating Segments Revenue $B | All Other Segments Operating Income (Loss) $B |
| Operating Segments Revenue and Segments Operating Income (Loss) Summary |
| Q3 2024 vs. Q3 2023 |
All other revenue was $1.0 billion, down $413 million from Q3 2023. Altera revenue decreased $323 million from Q3 2023, as customers tempered purchases to reduce existing inventories across all product lines. Mobileye revenue decreased $45 million from Q3 2023. All other operating income was $45 million, down $190 million from Q3 2023, primarily due to lower Altera Q3 2024 revenue.
| YTD 2024 vs. YTD 2023 |
All other revenue was $2.8 billion, down $1.5 billion from YTD 2023. Altera revenue decreased $1.3 billion from YTD 2023, as customers tempered purchases to reduce existing inventories across all product lines. Mobileye revenue decreased $278 million from YTD 2023, as customers tempered purchases to reduce existing inventories of EyeQ™ products. All other operating loss was $202 million compared to operating income of $937 million in YTD 2023 primarily due to lower Altera and Mobileye YTD 2024 revenue.
| MD&A | 36 |
| Consolidated Condensed Results of Operations | |||||
| Three Months Ended | Nine Months Ended | |||||||||||||||||||||||||||||||||||||||||||||||||
| Q3 2024 | Q3 2023 | YTD 2024 | YTD 2023 | |||||||||||||||||||||||||||||||||||||||||||||||
| (In Millions, Except Per Share Amounts) | Amount | % of Net Revenue | Amount | % of Net Revenue | Amount | % of Net Revenue | Amount | % of Net Revenue | ||||||||||||||||||||||||||||||||||||||||||
| Net revenue | $ | 13,284 | 100.0 | % | $ | 14,158 | 100.0 | % | $ | 38,841 | 100.0 | % | $ | 38,822 | 100.0 | % | ||||||||||||||||||||||||||||||||||
| Cost of sales | 11,287 | 85.0 | % | 8,140 | 57.5 | % | 27,080 | 69.7 | % | 24,158 | 62.2 | % | ||||||||||||||||||||||||||||||||||||||
| Gross margin | 1,997 | 15.0 | % | 6,018 | 42.5 | % | 11,761 | 30.3 | % | 14,664 | 37.8 | % | ||||||||||||||||||||||||||||||||||||||
| Research and development | 4,049 | 30.5 | % | 3,870 | 27.3 | % | 12,670 | 32.6 | % | 12,059 | 31.1 | % | ||||||||||||||||||||||||||||||||||||||
| Marketing, general, and administrative | 1,383 | 10.4 | % | 1,340 | 9.5 | % | 4,268 | 11.0 | % | 4,017 | 10.3 | % | ||||||||||||||||||||||||||||||||||||||
| Restructuring and other charges | 5,622 | 42.3 | % | 816 | 5.8 | % | 6,913 | 17.8 | % | 1,080 | 2.8 | % | ||||||||||||||||||||||||||||||||||||||
| Operating income (loss) | (9,057) | (68.2) | % | (8) | (0.1) | % | (12,090) | (31.1) | % | (2,492) | (6.4) | % | ||||||||||||||||||||||||||||||||||||||
| Gains (losses) on equity investments, net | (159) | (1.2) | % | (191) | (1.3) | % | (74) | (0.2) | % | (46) | (0.1) | % | ||||||||||||||||||||||||||||||||||||||
| Interest and other, net | 130 | 1.0 | % | 147 | 1.0 | % | 355 | 0.9 | % | 512 | 1.3 | % | ||||||||||||||||||||||||||||||||||||||
| Income (loss) before taxes | (9,086) | (68.4) | % | (52) | (0.4) | % | (11,809) | (30.4) | % | (2,026) | (5.2) | % | ||||||||||||||||||||||||||||||||||||||
| Provision for (benefit from) taxes | 7,903 | 59.5 | % | (362) | (2.6) | % | 7,271 | 18.7 | % | (1,041) | (2.7) | % | ||||||||||||||||||||||||||||||||||||||
| Net income (loss) | (16,989) | (127.9) | % | 310 | 2.2 | % | (19,080) | (49.1) | % | (985) | (2.5) | % | ||||||||||||||||||||||||||||||||||||||
| Less: net income (loss) attributable to non-controlling interests | (350) | (2.6) | % | 13 | 0.1 | % | (450) | (1.2) | % | (5) | — | % | ||||||||||||||||||||||||||||||||||||||
| Net income (loss) attributable to Intel | $ | (16,639) | (125.3) | % | $ | 297 | 2.1 | % | $ | (18,630) | (48.0) | % | $ | (980) | (2.5) | % | ||||||||||||||||||||||||||||||||||
| Earnings (loss) per share attributable to Intel—diluted | $ | (3.88) | $ | 0.07 | $ | (4.37) | $ | (0.23) | ||||||||||||||||||||||||||||||||||||||||||
| MD&A | 37 |
Consolidated Revenue
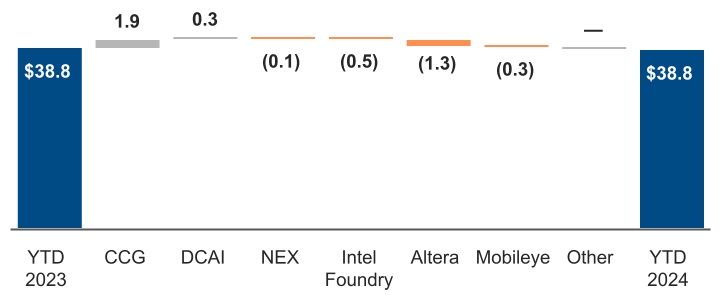
| Consolidated Revenue Walk $B1 | |||||||||||

| Q3 2024 vs. Q3 2023 |
Our Q3 2024 revenue was $13.3 billion, down $874 million from Q3 2023. CCG revenue decreased 7% from Q3 2023 primarily due to lower desktop volume from customers tempering purchases to reduce existing inventories and lower demand compared to Q3 2023. CCG other revenue decreased from Q3 2023 due to the exit of legacy businesses. These Q3 2024 CCG revenue decreases were partially offset by higher notebook revenues in Q3 2024 due to higher volume as customer inventory levels improved compared to Q3 2023 and higher notebook ASPs. DCAI revenue increased 9% from Q3 2023 primarily due to increased hyperscale customer-related demand. Intel Foundry external revenue decreased 79% from Q3 2023 due to lower traditional packaging services and lower equipment sales. Altera revenue decreased 44% from Q3 2023 due to customers tempering purchases to reduce existing inventories across all product lines.
| YTD 2024 vs. YTD 2023 |
Our YTD 2024 revenue was $38.8 billion, roughly flat with YTD 2023. CCG revenue increased 9% from YTD 2023 primarily due to higher notebook revenue resulting from higher volume and higher ASPs compared to YTD 2023. Other CCG revenue decreased from YTD 2023 due to the exit of legacy businesses. DCAI revenue increased 3% from YTD 2023 driven by an increase in server revenue primarily from high core count products, which increased ASPs and lowered volume compared to YTD 2023. Intel Foundry external revenue decreased 74% from YTD 2023 due to lower equipment sales and lower traditional packaging services. Altera revenue decreased 54% from YTD 2023 as customers tempered purchases to reduce existing inventories across all product lines. Mobileye revenue decreased 19% from YTD 2023 as customers tempered purchases to reduce existing inventories of EyeQ products.
1 Excludes intersegment revenue; totals may not sum due to rounding
| MD&A | 38 |
Consolidated Gross Margin
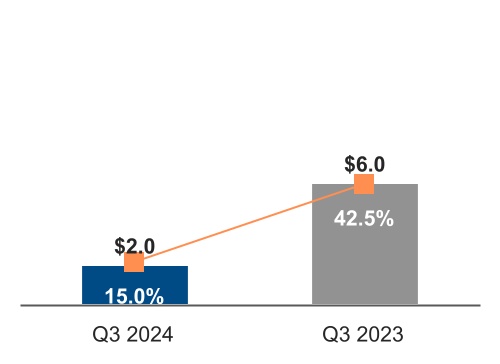
We derived a majority of our consolidated gross margin in Q3 2024 and in YTD 2024 from our Intel Products business sales through our CCG, DCAI, and NEX operating segments. Our consolidated gross margin dollars in Q3 2024 decreased by $4.0 billion, or 67%, compared to Q3 2023, and YTD 2024 decreased by $2.9 billion, or 20%, compared to YTD 2023. We regularly evaluate our process technology node capacities relative to projected market demand for our products and services. During Q3 2024, we concluded that our manufacturing asset portfolio, primarily for our Intel 7 process node, exceeded manufacturing capacity requirements. Upon concluding an asset re-use assessment, we impaired certain construction in progress assets and accelerated depreciation for certain in use manufacturing assets that resulted in $3.1 billion of charges in Q3 2024.
| Consolidated Gross Margin $B1 | ||
(Percentages in chart indicate gross margin as a percentage of total revenue)
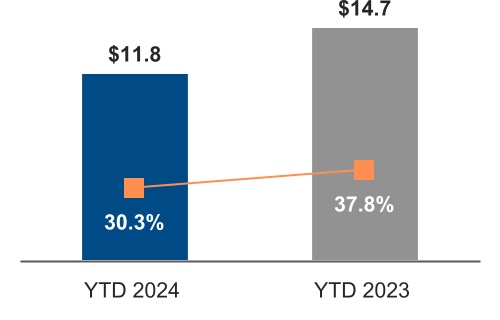
| (In Millions) | ||||||||
| $ | 1,997 | Q3 2024 Gross Margin | ||||||
| (3,030) | Higher period charges related to non-cash impairments and the acceleration of depreciation for certain manufacturing assets, a substantial majority of which related to our Intel 7 process node | |||||||
| (375) | Higher unit cost primarily from increased mix of Intel 4 and Intel 7 products | |||||||
| (320) | Lower product profit primarily from lower Intel Foundry revenue | |||||||
| (313) | Higher period charges due to higher accelerator inventory reserves taken and other direct spending charges incurred | |||||||
| (272) | Lower product profit primarily from lower Altera revenue | |||||||
| (209) | Lower product profit primarily from lower desktop revenue, partially offset by higher product profit from higher notebook revenue | |||||||
| (136) | Higher period charges primarily related to factory start-up costs | |||||||
| 280 | Lower period charges primarily driven by the sell-through of previously reserved inventory and lower non-accelerator reserves taken | |||||||
| 257 | Higher product profit primarily from higher server revenue | |||||||
| 97 | Other | |||||||
| $ | 6,018 | Q3 2023 Gross Margin | ||||||
| $ | 11,761 | YTD 2024 Gross Margin | ||||||
| (3,197) | Higher period charges related to non-cash impairments and the acceleration of depreciation for certain manufacturing assets, a substantial majority of which related to our Intel 7 process node | |||||||
| (1,389) | Higher unit cost primarily from increased mix of Intel 4 and Intel 7 products | |||||||
| (1,294) | Lower product profit primarily from lower Altera and Mobileye revenue | |||||||
| (545) | Higher period charges primarily related to factory start-up costs | |||||||
| (513) | Lower product profit primarily from lower Intel Foundry revenue | |||||||
| (313) | Higher period charges due to higher accelerator inventory reserves taken and other direct spending charges incurred | |||||||
| 1,355 | Higher product profit primarily due to higher notebook revenue | |||||||
| 1,223 | Lower period charges driven by the sell-through of previously reserved inventory and lower non-accelerator reserves taken | |||||||
| 827 | Higher product profit primarily due to higher server revenue | |||||||
| 610 | Lower period charges related to excess capacity charges | |||||||
| 333 | Other | |||||||
| $ | 14,664 | YTD 2023 Gross Margin |
1 Excludes intersegment activity
| MD&A | 39 |
Operating Expenses
Total R&D and MG&A expenses for Q3 2024 were $5.4 billion, up 4% from Q3 2023, and $16.9 billion for YTD 2024, up 5% from YTD 2023. These expenses represent 40.9% of revenue for Q3 2024 and 36.8% of revenue for Q3 2023, and 43.6% of revenue for YTD 2024 and 41.4% of revenue for YTD 2023. In support of our strategy, described in our 2023 Form 10-K, we continue to make significant investments to accelerate our process technology roadmap. This requires continued investments in R&D and focused efforts to attract and retain talent. As a result of our 2024 Restructuring Plan and related cost reduction measures, we expect a decrease in total R&D and MG&A expenses in future periods while creating capacity for sustained investment in technology and manufacturing leadership.
| Research and Development $B | Marketing, General, and Administrative $B | ||||||||||
(Percentages in chart indicate operating expenses as a percentage of total revenue)
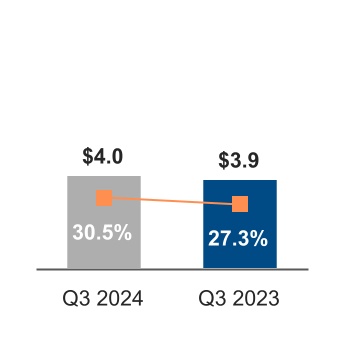
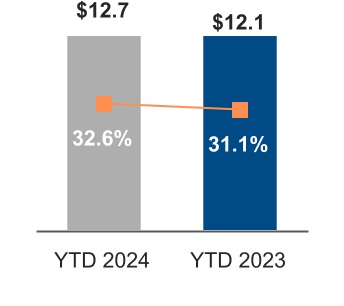
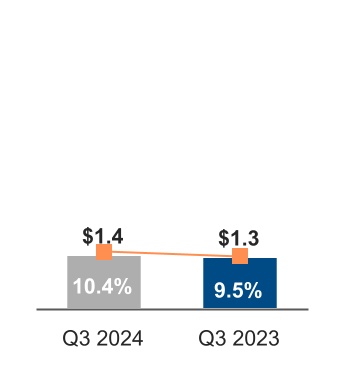
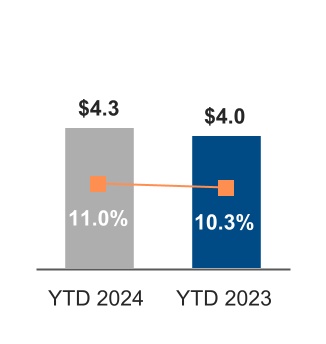
| Research and Development |
Q3 2024 vs. Q3 2023
| R&D increased by $179 million, or 5%, driven by the following: | |||||
| + | Investments in our process technology and leadership products | ||||
| - | Lower incentive-based cash compensation | ||||
YTD 2024 vs. YTD 2023
| R&D increased by $611 million, or 5%, driven by the following: | |||||||||||
| + | Investments in our process technology and leadership products | ||||||||||
| + | Higher share-based compensation | ||||||||||
| - | Lower incentive-based compensation | ||||||||||
| Marketing, General, and Administrative |
Q3 2024 vs. Q3 2023 and YTD 2024 vs. YTD 2023
Q3 2024 MG&A increased by $43 million, or 3%, and YTD 2024 MG&A increased by $251 million, or 6%, driven by the following:
| + | Higher corporate spending, primarily driven by our IDM 2.0 transformation | ||||||||||||||||
| - | Lower incentive-based cash compensation | ||||||||||||||||
| MD&A | 40 |
Restructuring and Other Charges
| (In Millions) | Q3 2024 | Q3 2023 | YTD 2024 | YTD 2023 | ||||||||||||||||||||||
| Employee severance and benefit arrangements | $ | 2,193 | $ | 59 | $ | 2,487 | $ | 191 | ||||||||||||||||||
| Litigation charges and other | 36 | 757 | 814 | 854 | ||||||||||||||||||||||
| Asset impairment charges | 3,393 | — | 3,612 | 35 | ||||||||||||||||||||||
| Total restructuring and other charges | $ | 5,622 | $ | 816 | $ | 6,913 | $ | 1,080 |
In Q3 2024, the 2024 Restructuring Plan was announced to implement cost-reduction measures, including reductions in employee headcount, other operating and non-operating expenditures and capital expenditures (see "Note 6: Restructuring and Other Charges" within Notes to Consolidated Condensed Financial Statements). We expect that our 2024 Restructuring Plan, in conjunction with other initiatives, will reduce our cost structure while we continue our investments to develop, manufacture, market, sell, and deliver process and product leadership initiatives in furtherance of our strategy. We expect actions pursuant to the 2024 Restructuring Plan to be substantially complete by the fourth quarter of 2025, but this is subject to change. Any changes to the estimates or timing will be reflected in our results of operations.
Employee severance and benefit arrangements includes charges of $2.2 billion in Q3 2024 relating to the 2024 Restructuring Plan. Charges relating to other actions taken to streamline operations and to reduce costs were $294 million in YTD 2024. The charges in Q3 2023 and YTD 2023 primarily related to the 2022 Restructuring Program, which was completed in Q1 2024.
Litigation charges and other includes a charge of $780 million that we recorded in YTD 2024 arising out of the R2 litigation. In Q3 2023, we recorded a $401 million charge for an EC-imposed fine. Refer to "Note 14: Contingencies" within Notes to Consolidated Condensed Financial Statements for information about these items. Also, in Q3 2023, we incurred a $353 million termination fee as we mutually agreed with Tower to terminate the agreement we entered into during 2022 to acquire Tower due to our inability to obtain required regulatory approvals in a timely manner.
Asset impairment charges in Q3 2024 primarily includes cash and non-cash charges associated with the 2024 Restructuring Plan, including $442 million of non-cash impairments of construction in progress assets associated with our decision to exit and outsource manufacturing capabilities for certain internal test hardware; and $86 million of non-cash impairments of operating leased assets and related leasehold improvements resulting from real estate consolidations and exits. Real estate consolidations and exits did not materially change our operating lease liabilities and may result in future cash outlays for facility restoration or the relocation of operations. In addition, we incurred non-cash impairments related to goodwill and acquired intangible assets of $2.9 billion and $3.1 billion in Q3 2024 and YTD 2024, respectively. Refer to "Note 10: Goodwill" and "Note 6: Restructuring and Other Charges" within Notes to Consolidated Condensed Financial Statements for further information about these items.
Gains (Losses) on Equity Investments and Interest and Other, Net
| (In Millions) | Q3 2024 | Q3 2023 | YTD 2024 | YTD 2023 | |||||||||||||||||||||||||||||||||||||
| Ongoing mark-to-market adjustments on marketable equity securities | $ | (51) | $ | (267) | $ | (185) | $ | (164) | |||||||||||||||||||||||||||||||||
| Observable price adjustments on non-marketable equity securities | — | 7 | 49 | 17 | |||||||||||||||||||||||||||||||||||||
| Impairment charges | (110) | (53) | (269) | (127) | |||||||||||||||||||||||||||||||||||||
| Sale of equity investments and other | 2 | 122 | 331 | 228 | |||||||||||||||||||||||||||||||||||||
| Total gains (losses) on equity investments, net | $ | (159) | $ | (191) | $ | (74) | $ | (46) | |||||||||||||||||||||||||||||||||
| Interest and other, net | $ | 130 | $ | 147 | $ | 355 | $ | 512 |
In Q3 2024 and YTD 2024, losses resulted primarily from impairment charges of non-marketable securities and on-going mark-to-market losses on marketable equity securities. For YTD 2024, we recognized a $336 million initial fair value adjustment within sale of equity investments and other upon Astera Labs, Inc. shares becoming marketable.
In Q3 2023 and YTD 2023, losses were primarily due to on-going mark to market losses on marketable equity securities.
| MD&A | 41 |
Provision for (Benefit from) Taxes
| ($ In Millions) | Q3 2024 | Q3 2023 | YTD 2024 | YTD 2023 | ||||||||||||||||||||||
| Income (loss) before taxes | $ | (9,086) | $ | (52) | $ | (11,809) | $ | (2,026) | ||||||||||||||||||
| Provision for (benefit from) taxes | $ | 7,903 | $ | (362) | $ | 7,271 | $ | (1,041) | ||||||||||||||||||
| Effective tax rate | (87.0) | % | 696.2 | % | (61.6) | % | 51.4 | % |
In Q3 2024, we established a valuation allowance of $9.9 billion as a discrete non-cash tax expense against our US deferred tax assets. We assess the recoverability of our deferred tax assets quarterly, weighing available positive and negative evidence. As a result of our assessment in Q3 2024, we determined it is more likely than not that the deferred tax assets will not be recoverable based upon our three-year cumulative historical loss position as of September 28, 2024, largely resulting from the asset impairment and restructuring and other charges incurred during the quarter.
Our provision for taxes increased in YTD 2024 compared to YTD 2023, primarily driven by the effects associated with the establishment of a valuation allowance against our US deferred tax assets in Q3 2024. Additionally, our YTD 2024 provision for taxes and YTD 2023 benefit from taxes included R&D tax credits, which provide a tax benefit based on our eligible R&D spending and are not dependent on income before taxes.
Our provision for, or benefit from, income taxes for all periods presented were determined using an actual annual effective tax rate, adjusted for discrete items, if any, as we were unable to make a reliable estimate of our annual effective tax rate as a result of fluctuations in forecasted annual income and the effects of being taxed in multiple tax jurisdictions.
| MD&A | 42 |
Liquidity and Capital Resources
We consider the following when assessing our liquidity and capital resources:
| (In Millions) | Sep 28, 2024 | Dec 30, 2023 | ||||||||||||
| Cash and cash equivalents | $ | 8,785 | $ | 7,079 | ||||||||||
| Short-term investments | 15,301 | 17,955 | ||||||||||||
| Total cash and short-term investments | $ | 24,086 | $ | 25,034 | ||||||||||
| Total debt | $ | 50,236 | $ | 49,266 |
We believe we have sufficient sources of funding to meet our business requirements for the next 12 months and in the longer term. Cash generated by operations, and total cash and short-term investments as shown in the preceding table, are our primary sources of liquidity for funding our strategic business requirements. These sources are further supplemented by our committed credit facilities and other borrowing capacity and certain other Smart Capital initiatives that we have undertaken, including our Ireland SCIP transaction that closed in the second quarter of 2024 that resulted in $11.0 billion of net cash inflows to us (see "Note 3: Non-Controlling Interests" within Notes to Consolidated Condensed Financial Statements). Our short-term funding requirements include capital expenditures for worldwide manufacturing and assembly and test, including investments in our process technology roadmap; working capital requirements including cash outlays associated with the 2024 Restructuring Plan; non-controlling interest distributions; and potential acquisitions and strategic investments. We expect reductions in operating expenditures, capital expenditures, and cost of sales after implementing our 2024 Restructuring Plan and related cost-reduction measures, including reductions in headcount, which are designed to enable further operational efficiency and agility and create capacity for sustained investment in technology and manufacturing leadership. Our long-term funding requirements incrementally contemplate investments in significant manufacturing expansion plans and investments to accelerate our process technology.
Our total cash and short-term investments and related cash flows may be affected by certain discretionary actions we may take with customers and suppliers to accelerate or delay certain cash receipts or payments to manage liquidity for our strategic business requirements. These actions can include, among others, negotiating with suppliers to optimize our payment terms and conditions, adjusting the timing of cash flows associated with customer sales programs and collections, managing inventory levels and purchasing practices, and selling certain of our accounts receivables on a non-recourse basis to third party financial institutions.
We expect to continue to benefit from government incentives. These incentives typically require that we make significant capital investments in new facilities or expand existing facilities, and our related workforce. To the extent we delay or cancel any such projects, such as the delays we announced during Q3 2024 to our projects in Germany, Poland and Malaysia, there may be a delay in our receipt of, or we may lose, the associated government incentives.
Recognizing the importance of prioritizing liquidity to support the investments needed to execute our strategy, on August 1, 2024, we announced our Board of Directors suspended the declaration of quarterly dividends on our common stock starting in Q4 2024. The Board of Directors reiterated our long-term commitment to a competitive dividend as cash flows improve to sustainably higher levels.
In YTD 2024, we issued a total of $2.6 billion aggregate principal amount of senior notes and remarketed $438 million aggregate principal amount of other bonds for general corporate purposes, including, but not limited to, refinancing of outstanding debt and funding for working capital and capital expenditures. In YTD 2024, we also expanded both our 5-year $5.0 billion revolving credit facility agreement and our 364-day $5.0 billion credit facility agreement, to $7.0 billion and $8.0 billion, respectively, and the maturity dates were extended to February 2029 and January 2025, respectively. We have other potential sources of liquidity including our commercial paper program and our automatic shelf registration statement on file with the SEC, pursuant to which we may offer an unspecified amount of debt, equity, and other securities. Under our commercial paper program, we have an ongoing authorization from our Board of Directors to borrow up to $10.0 billion. As of September 28, 2024, we had no commercial paper obligations outstanding and no outstanding borrowings on the revolving credit facilities. See "Note 11: Borrowings" within Notes to Consolidated Condensed Financial Statements for further information.
We maintain a diverse investment portfolio that we continually analyze based on issuer, industry, and country. Substantially all of our investments in debt instruments were in investment-grade securities.
Cash flows from operating, investing and financing activities were as follows:
| Nine Months Ended | ||||||||||||||
| (In Millions) | Sep 28, 2024 | Sep 30, 2023 | ||||||||||||
| Net cash provided by (used for) operating activities | $ | 5,123 | $ | 6,847 | ||||||||||
| Net cash provided by (used for) investing activities | (14,492) | (18,723) | ||||||||||||
| Net cash provided by (used for) financing activities | 11,075 | 8,353 | ||||||||||||
| Net increase (decrease) in cash and cash equivalents | $ | 1,706 | $ | (3,523) |
| MD&A | 43 |
Operating Activities
Operating cash flows consist of net income (loss) adjusted for certain non-cash items and changes in certain assets and liabilities.
Cash provided by operations in the first nine months of 2024 was lower compared to the first nine months of 2023 as we incurred a higher net loss that was partially offset by a higher amount of favorable operating cash flow adjustments, in each case in the first nine months of 2024 relative to the first nine months of 2023.
Investing Activities
Investing cash flows consist primarily of capital expenditures; investment purchases, sales, maturities, and disposals; and proceeds from capital-related government incentives.
Cash used for investing activities was lower in the first nine months of 2024 compared to the first nine months of 2023, primarily due to a reduction in cash flows used for the purchases of short-term investments, and lower capital additions, in each case during the first nine months of 2024 relative to the first nine months of 2023.
Financing Activities
Financing cash flows consist primarily of proceeds from strategic initiatives including partner contributions and equity-related issuances, issuance and repayment of short-term and long-term debt, and payment of dividends to stockholders.
Cash provided by financing activities was higher in the first nine months of 2024 compared to the first nine months of 2023, primarily due to higher SCIP partner contributions and reduced dividend payments. These cash favorable activities were partially offset by lower proceeds from debt issuances, net of repayments; the absence of proceeds from sales of subsidiary shares; and certain other cash unfavorable financing activities in the first nine months of 2024.
| MD&A | 44 |
Non-GAAP Financial Measures
In addition to disclosing financial results in accordance with US GAAP, this document contains references to the non-GAAP financial measures below. We believe these non-GAAP financial measures provide investors with useful supplemental information about our operating performance, enable comparison of financial trends and results between periods where certain items may vary independent of business performance, and allow for greater transparency with respect to key metrics used by management in operating our business and measuring our performance. These non-GAAP financial measures are used in our performance-based RSUs and our cash bonus plans.
Our non-GAAP financial measures reflect adjustments based on one or more of the following items, as well as the related effects to income taxes and net income (loss) attributable to non-controlling interests effects. Income tax effects are calculated using a fixed long-term projected tax rate of 13% across all adjustments. We project this long-term non-GAAP tax rate on at least an annual basis using a five-year non-GAAP financial projection that excludes the income tax effects of each adjustment. The projected non-GAAP tax rate also considers factors such as our tax structure, our tax positions in various jurisdictions, and key legislation in significant jurisdictions where we operate. This long-term non-GAAP tax rate may be subject to change for a variety of reasons, including the rapidly evolving global tax environment, significant changes in our geographic earnings mix, or changes to our strategy or business operations. Management uses this non-GAAP tax rate in managing internal short- and long-term operating plans and in evaluating our performance; we believe this approach facilitates comparison of our operating results and provides useful evaluation of our current operating performance. Non-GAAP adjustments attributable to non-controlling interests are calculated by adjusting for the minority stockholder portion of non-GAAP adjustments we make for relevant acquisition-related costs, share-based compensation, restructuring and other charges, and income tax effects, as applicable to each majority-owned subsidiary.
Our non-GAAP financial measures should not be considered a substitute for, or superior to, financial measures calculated in accordance with US GAAP, and the financial results calculated in accordance with US GAAP and reconciliations from these results should be carefully evaluated.
| Non-GAAP adjustment or measure | Definition | Usefulness to management and investors | ||||||
| Acquisition-related adjustments | Amortization of acquisition-related intangible assets consists of amortization of intangible assets such as developed technology, brands, and customer relationships acquired in connection with business combinations. Charges related to the amortization of these intangibles are recorded within both cost of sales and MG&A in our US GAAP financial statements. Amortization charges are recorded over the estimated useful life of the related acquired intangible asset, and thus are generally recorded over multiple years. | We exclude amortization charges for our acquisition-related intangible assets for purposes of calculating certain non-GAAP measures because these charges are inconsistent in size and are significantly impacted by the timing and valuation of our acquisitions. These adjustments facilitate a useful evaluation of our current operating performance and comparison to our past operating performance and provide investors with additional means to evaluate cost and expense trends. | ||||||
| Share-based compensation | Share-based compensation consists of charges related to our employee equity incentive plans. | We exclude charges related to share-based compensation for purposes of calculating certain non-GAAP measures because we believe these adjustments provide comparability to peer company results and because these charges are not viewed by management as part of our core operating performance. We believe these adjustments provide investors with a useful view, through the eyes of management, of our core business model, how management currently evaluates core operational performance, and additional means to evaluate expense trends, including in comparison to other peer companies. | ||||||
| MD&A | 45 |
| Restructuring and other charges | Restructuring charges are costs associated with a restructuring plan and are primarily related to employee severance and benefit arrangements. Q3 2024 includes charges associated with the 2024 Restructuring Plan primarily comprised of cash-based employee severance and benefit arrangements, and cash and non-cash charges related to real estate exits and consolidations, as well as non-cash construction in progress asset impairments resulting from business exit activities. Other charges include periodic goodwill and asset impairments, and other costs associated with certain non-core activities. Q3 2024 includes non-cash charges resulting from the impairment of goodwill and certain acquired intangible assets. Q3 2023 includes two legal related fees, which we do not expect to recur, relating to an EC-imposed fine and a termination fee relating to Tower. | We exclude restructuring and other charges, including any adjustments to charges recorded in prior periods, for purposes of calculating certain non-GAAP measures because these costs do not reflect our core operating performance. These adjustments facilitate a useful evaluation of our core operating performance and comparisons to past operating results and provide investors with additional means to evaluate expense trends. | ||||||
| (Gains) losses on equity investments, net | (Gains) losses on equity investments, net consists of ongoing mark-to-market adjustments on marketable equity securities, observable price adjustments on non-marketable equity securities, related impairment charges, and the gains (losses) from the sale of equity investments and other. | We exclude these non-operating gains and losses for purposes of calculating certain non-GAAP measures because it provides comparability between periods. The exclusion reflects how management evaluates the core operations of the business. | ||||||
| (Gains) losses from divestiture | (Gains) losses are recognized at the close of a divestiture, or over a specified deferral period when deferred consideration is received at the time of closing. Based on our ongoing obligation under the NAND wafer manufacturing and sale agreement entered into in connection with the first closing of the sale of our NAND memory business on December 29, 2021, a portion of the initial closing consideration was deferred and will be recognized between first and second closing. | We exclude gains or losses resulting from divestitures for purposes of calculating certain non-GAAP measures because they do not reflect our current operating performance. These adjustments facilitate a useful evaluation of our current operating performance and comparisons to past operating results. | ||||||
| Deferred tax assets valuation allowances | A non-cash charge recorded to provision for (benefit from) income taxes related to a discreet valuation allowance recorded against our US deferred tax assets. | We excluded a discrete non-cash charge in Q3 2024 related to a valuation allowance established against our US deferred tax assets due to a historical cumulative loss for GAAP purposes. We excluded the discreet valuation allowance when calculating certain non-GAAP measures as there is no such historical cumulative loss on a non-GAAP basis; and because of the size of the charge, the adjustment facilitates a useful evaluation of our core operating performance and comparisons to our past operating results. | ||||||
| Adjusted free cash flow | We reference a non-GAAP financial measure of adjusted free cash flow, which is used by management when assessing our sources of liquidity, capital resources, and quality of earnings. Adjusted free cash flow is operating cash flow adjusted for (1) purchases of property, plant, and equipment, including purchases where the vendor has extended payment terms to us, net of proceeds from capital-related government incentives and partner contributions, and (2) payments on finance leases. | This non-GAAP financial measure is helpful in understanding our capital requirements and sources of liquidity by providing an additional means to evaluate the cash flow trends of our business. |
| MD&A | 46 |
Following are the reconciliations of our most comparable US GAAP measures to our non-GAAP measures presented:
| Three Months Ended | ||||||||||||||||||||||||||
| Sep 28, 2024 | Sep 30, 2023 | |||||||||||||||||||||||||
| Gross margin percentage | 15.0 | % | 42.5 | % | ||||||||||||||||||||||
| Acquisition-related adjustments | 1.7 | % | 2.1 | % | ||||||||||||||||||||||
| Share-based compensation | 1.3 | % | 1.2 | % | ||||||||||||||||||||||
| Non-GAAP gross margin percentage | 18.0 | % | 45.8 | % | ||||||||||||||||||||||
| Earnings (loss) per share attributable to Intel—diluted | $ | (3.88) | $ | 0.07 | ||||||||||||||||||||||
| Acquisition-related adjustments | 0.06 | 0.08 | ||||||||||||||||||||||||
| Share-based compensation | 0.19 | 0.18 | ||||||||||||||||||||||||
| Restructuring and other charges | 1.31 | 0.19 | ||||||||||||||||||||||||
| (Gains) losses on equity investments, net | 0.04 | 0.05 | ||||||||||||||||||||||||
| (Gains) losses from divestiture | (0.01) | (0.01) | ||||||||||||||||||||||||
| Adjustments attributable to non-controlling interest | (0.08) | — | ||||||||||||||||||||||||
| Deferred tax assets valuation allowances | 2.31 | — | ||||||||||||||||||||||||
| Income tax effects | (0.40) | (0.15) | ||||||||||||||||||||||||
| Non-GAAP earnings per share attributable to Intel—diluted | $ | (0.46) | $ | 0.41 | ||||||||||||||||||||||
| Nine Months Ended | ||||||||||||||
| (In Millions) | Sep 28, 2024 | Sep 30, 2023 | ||||||||||||
| Net cash provided by (used for) operating activities | $ | 5,123 | $ | 6,847 | ||||||||||
| Net purchase of property, plant, and equipment | (5,848) | (17,299) | ||||||||||||
| Payments on finance leases | — | (96) | ||||||||||||
| Adjusted free cash flow | $ | (725) | $ | (10,548) | ||||||||||
| Net cash provided by (used for) investing activities | $ | (14,492) | $ | (18,723) | ||||||||||
| Net cash provided by (used for) financing activities | $ | 11,075 | $ | 8,353 | ||||||||||
| MD&A | 47 |
| Risk Factors and Other Key Information | |||||
Previous: Item 2. Management's Discussion and Analysis of Financial Condition and Results of Operations: · Next: Item 1A. Risk Factors