 filings.tools
IQVIA Holdings (IQV) 10-K risk factor changes: FY2017 vs FY2016
The 2017-12-31 10-K against the 2016-12-31 one, compared heading by heading and sentence by sentence. One of these filings carries no fiscal year tag, so its year is the calendar year of the period end.
Item 1A215 rewritten135 added191 removed353 unchanged
All filing items1,919 rewritten969 added1,542 removed1,451 unchanged
Summary
counted, not written
- Item 1A headings could not be compared: only 0 carried over between the two years, which usually means one filing was read wrongly, so none is reported as new or removed.
- Sentence by sentence, 969 added, 1,542 removed, 1,919 rewritten and 1,451 unchanged across 20 items that differ.
Sentences by item
22 items, with every count and a link to each item that changed
Underlined words on a shaded ground are new in FY2017; struck-through words were in FY2016. Sentences that are wholly new or wholly gone are labelled rather than marked.
Item 1A. Risk Factors
215 rewritten, 135 added, 191 removed, 353 unchanged
Read the full itemFY2017 item · filed February 16, 2018FY2016 item · filed February 16, 2017
[removed: RISK FACTORS][added: RISK FACTORS]
[removed: _We] [added: We] operate in a rapidly changing environment that involves a number of risks, some of which are beyond our control.
The occurrence of any of the following risks may materially and adversely affect our business, financial condition, results of operations and future [removed: prospects._][added: prospects.]
[removed: Risks] [added: Risks] Relating to Our [removed: Business][added: Business]
[removed: _The] [added: The] potential loss or delay of our large contracts or of multiple contracts could adversely affect our [removed: results._][added: results.]
| | • | [removed: |] decisions to forego or terminate a particular clinical trial; |
| | • | [removed: |] lack of available financing, budgetary limits or changing priorities; |
| | • | [removed: |] actions by regulatory authorities; |
| | • | [removed: |] production problems resulting in shortages of the drug being tested; |
| | • | [removed: |] failure of products being tested to satisfy safety requirements or efficacy criteria; |
| | • | [removed: |] unexpected or undesired clinical results for products; |
| | • | [removed: |] insufficient patient enrollment in a clinical trial; |
| | • | [removed: |] insufficient investigator recruitment; |
| | • | [removed: |] shift of business to a competitor or internal resources; |
| | • | [removed: |] product withdrawal following market launch; or |
| | • | [removed: |] shut down of manufacturing facilities. |
In addition, we [removed: may] [added: will] not realize the full benefits of our backlog of contractually committed services if our clients cancel, delay or reduce their commitments under our contracts with them, which may occur if, among other things, a client decides to shift its business to a competitor or revoke our status as a preferred provider.
[removed: _We] [added: We] depend on third parties for data and support services.
Our suppliers or providers might restrict our use of or refuse to license data or provide services, which could lead to our inability to access certain data or provide certain services and, as a result, materially and adversely affect our operating results and financial [removed: condition._][added: condition.]
[removed: _If] [added: If] we fail to perform our services in accordance with contractual requirements, regulatory standards and ethical considerations, we could be subject to significant costs or liability and our reputation could be [removed: harmed._][added: harmed.]
[removed: In connection with our Research & Development Solutions business, we] [added: We] contract with biopharmaceutical companies to perform a wide range of services to assist them in bringing new drugs to market.
[removed: _Improper performance of our services._] The performance of clinical development services is complex and time-consuming.
For example, we may make mistakes in conducting a clinical trial that could negatively impact [added: or obviate the usefulness of the clinical trial or cause the results of the clinical trial to be reported improperly.]
| | • | [removed: |] non-compliance generally could result in the termination of ongoing clinical trials or sales and marketing projects or the disqualification of data for submission to regulatory authorities; |
| | • | [removed: |] compromise of data from a particular clinical trial, such as failure to verify that informed consent was obtained from patients, could require us to repeat the clinical trial under the terms of our contract at no further cost to our client, but at a substantial cost to us; and |
| | • | [removed: |] breach of a contractual term could result in liability for damages or termination of the contract. |
[removed: _Investigation of clients._] From time to time, one or more of our clients are audited or investigated by regulatory authorities or enforcement agencies with respect to regulatory compliance of their clinical trials, programs or the marketing and sale of their drugs.
[removed: _Insufficient client funding to complete a clinical trial._] As noted above, clinical trials can cost hundreds of millions of dollars.
[removed: _Security] [added: Security] breaches and unauthorized use of our IT systems and information, or the IT systems or information in the possession of our vendors, could expose us, our clients, our data suppliers or others to risk of [removed: loss._][added: loss.]
To the extent that any disruption or security breach results in a loss or damage to our data, an inappropriate disclosure of proprietary or sensitive information, an inability to access data sources, or an inability to process data or provide our offerings to our clients, it could cause significant damage to our [added: reputation, affect our relationships with our data suppliers and clients (including loss of suppliers and clients), lead to claims against us and ultimately harm our business.]
[removed: _Failure] [added: Failure] to meet productivity objectives under our internal business transformation initiatives could adversely impact our competitiveness and harm our operating [removed: results._][added: results.]
For example, we [removed: hired and trained more than 500 people to form a center of excellence (“COE”) in Manila, The Philippines for standardizing and cleaning data received from data suppliers, developed updated tools for standardizing and cleaning data,] are moving local standardizing and cleaning from countries around the world to [removed: the Manila COE,] [added: Asia,] and [removed: retired] [added: retiring] local standardizing and cleaning systems.
[removed: _If] [added: If] we are unsuccessful at investing in growth opportunities, our business could be materially and adversely [removed: affected._][added: affected.]
[removed: _Data] [added: Data] protection, privacy and similar laws [added: in the United States and around the world] restrict access, use and disclosure of [added: personal] information, and failure to comply with or adapt to changes in these laws could materially and adversely harm our [removed: business._][added: business.]
[removed: Patient] [added: In general, patient] health information is among the most sensitive [added: (and highly regulated)] of personal information and [removed: it is critical] [added: laws and regulations around the United States and the world are designed to ensure] that information about an individual’s healthcare is properly protected from inappropriate access, use and disclosure.
Laws restricting access, use and disclosure of [removed: such] [added: patient health] information [added: also] include the [removed: Health Insurance Portability and Accountability Act of 1996 (“HIPAA”), the] European [removed: Union] [added: Union’s] (“EU”) [removed: Data Protection Directive (which will be superseded by the] General Data Protection [removed: Regulation),] [added: Regulation,] Canada’s Personal Information Protection and Electronic Documents Act and other data protection, [removed: privacy] [added: privacy, data security] and similar national, state/provincial and local laws.
We have established frameworks, models, processes and technologies to manage privacy [added: and security] for many data types, from a variety of sources, and under myriad privacy and data protection laws worldwide.
[removed: In addition,] [added: For example,] in July 2015, indictments were issued by the Seoul Central District Prosecutors’ Office in South Korea against IMS Korea and two of its employees, among others, alleging improper handling of sensitive health information in violation of applicable privacy laws.
[removed: Alleged or actual failure] [added: Failure] to comply with such [removed: laws] [added: laws, certain certification/registration and annual re-certification/registration provisions associated with these data protection and privacy regulations, and similar rules in various jurisdictions, or to resolve any serious privacy complaints,] may result in, among other things, [added: regulatory sanctions, criminal prosecution, civil liability,] negative publicity, damage to our reputation, [removed: civil and criminal liability,] [added: or] data being blocked from use or liability under contractual provisions.
[removed: Nevertheless,] [added: Additionally,] changes in these laws (including newly released interpretations of these laws by courts and regulatory bodies) may limit our data access, use and disclosure, and may require increased expenditures by us or may dictate that we not offer certain types of services.
| --- | --- | --- |
| --- | --- | --- |
| --- | --- | --- |
| --- | --- | --- |
| --- | --- | --- |
| --- | --- | --- |
| --- | --- | --- |
| --- | --- | --- |
| --- | --- | --- |
| --- | --- | --- |
| --- | --- | --- |
Improper performance of our services.
| --- | --- | --- |
| --- | --- | --- |
| --- | --- | --- |
Investigation of clients.
Insufficient client funding to complete a clinical trial.
Cyber threats are rapidly evolving and are becoming increasingly sophisticated.
Despite our efforts to ensure the integrity of our systems, as cyber threats evolve and become more difficult to detect and successfully defend against, one or more cyber threats might defeat the measures that we or our vendors take to anticipate, detect, avoid or mitigate such threats.
Certain techniques used to obtain unauthorized access, introduce malicious software, disable or degrade service, or sabotage systems may be designed to remain dormant until a triggering event and we may be unable to anticipate these techniques or implement adequate preventative measures since techniques change frequently or are not recognized until launched, and because cyberattacks can originate from a wide variety of sources.
For example, United States federal regulations under the Health Insurance Portability and Accountability Act of 1996 (“HIPAA”) create specific requirements for the protection of the privacy and security of individual health information.
These provisions apply to both “covered entities” (primarily health care providers and health insurers) and their “business associates” or service providers.
Under HIPAA’s enforcement scheme, we can be subject to significant penalties in connection with HIPAA violations, along with the potential for significant other expenditures related to these activities.
The laws and regulations related to the protection of personal health information in connection with research activities are under re-evaluation, particularly in the United States, and changes to these regulations could have a material adverse impact on our ability to provide some of our services in their current form or maintain our profitability.
See Item 3 “Legal Proceedings” for additional information.
For example, the definition of “personally identifiable information” and “personal data” continues to evolve and broaden and many new laws and regulations are being enacted.
In addition, certain long-established programs have been (or are at risk of being) declared invalid (such as the EU-U.S. Safe Harbor framework that operated for many years but was struck down by European courts in 2015), so that this area remains in a state of flux.
Changes to these programs may adversely impact our ability to provide services to our clients or develop new products or services.
| --- | --- | --- |
| | • | the percentage of full services versus functional services; |
| --- | --- | --- |
| --- | --- | --- |
| --- | --- | --- |
| --- | --- | --- |
| --- | --- | --- |
| --- | --- | --- |
| --- | --- | --- |
| --- | --- | --- |
| --- | --- | --- |
| --- | --- | --- |
| --- | --- | --- | --- |
| --- | --- | --- | --- |
| --- | --- | --- | --- |
| --- | --- | --- | --- |
| --- | --- | --- | --- |
| --- | --- | --- | --- |
| --- | --- | --- | --- |
| --- | --- | --- | --- |
| --- | --- | --- | --- |
| --- | --- | --- | --- |
| --- | --- | --- | --- |
##### [Table of Contents](#toc)
##### [Table of Contents](#toc)
or obviate the usefulness of the clinical trial or cause the results of the clinical trial to be reported improperly.
| --- | --- | --- | --- |
| --- | --- | --- | --- |
| --- | --- | --- | --- |
##### [Table of Contents](#toc)
reputation, affect our relationships with our data suppliers and clients (including loss of suppliers and clients), lead to claims against us and ultimately harm our business.
##### [Table of Contents](#toc)
For example, in February 2014, a group of individuals filed a civil lawsuit in Korea against IMS Health Korea Ltd., our wholly-owned subsidiary (“IMS Korea”), the Korean Pharmaceutical Association (“KPA”), and a KPA affiliate that supplies data to IMS Korea.
The lawsuit alleges the KPA affiliate collected plaintiffs’ personal information without the necessary consent in violation of applicable privacy laws and transferred such information to IMS Korea for sale to clients.
##### [Table of Contents](#toc)
_Current and proposed laws and regulations regarding the protection of personal data could result in increased risks of liability or increased cost to us or could limit our service offerings._
Under HIPAA’s enforcement scheme, we can be subject to up to $1.5 million in annual civil penalties for each HIPAA violation.
Failure to comply with certain certification/registration and annual re-certification/registration provisions associated with these data protection and privacy regulations and rules in various jurisdictions, or to resolve any serious privacy complaints, could subject us to regulatory sanctions, criminal prosecution or civil liability.
Additionally, if we violate applicable laws, regulations or duties relating to the use, privacy or security of personal data, we could be subject to civil liability or criminal prosecution, be forced to alter our business practices and suffer reputational harm.
##### [Table of Contents](#toc)
##### [Table of Contents](#toc)
| --- | --- | --- | --- |
| --- | --- | --- | --- |
| --- | --- | --- | --- |
Computing backlog on an “as-contracted basis” rather than an “as awarded” basis may result in additions to the backlog later in the sales cycle than using the “as awarded” basis and may result in different rates of conversion from backlog to revenue than experienced using the “as awarded” basis.
The revenue recognition on larger, more global projects could be slower than on smaller, less global projects for a variety of
##### [Table of Contents](#toc)
| --- | --- | --- | --- |
| --- | --- | --- | --- |
| --- | --- | --- | --- |
##### [Table of Contents](#toc)
##### [Table of Contents](#toc)
An excerpt. Shown here: 40 of 215 rewritten, 40 of 135 added and 40 of 191 removed. The counts are complete. For every sentence, read Item 1A. Risk Factors in the FY2017 filing and the FY2016 filing.
Item 7. Management’s Discussion and Analysis of Financial Condition and Results of Operations
281 rewritten, 110 added, 247 removed, 248 unchanged
Read the full itemFY2017 item · filed February 16, 2018FY2016 item · filed February 16, 2017
[removed: _You] [added: You] should read the following discussion and analysis of our financial condition and results of operations together with our consolidated financial statements and the related notes included elsewhere in this Annual Report on Form 10-K.
You should read the “Risk Factors” section of this Annual Report for a discussion of important factors that could cause actual results to differ materially from the results described in or implied by the forward-looking statements contained in the following discussion and [removed: analysis._][added: analysis.]
[removed: Overview][added: Overview]
For a description of our service offerings within our segments, refer to “Business” within Part I, Item 1, of this Annual Report [removed: of] [added: on] Form 10-K.
[removed: Industry Outlook][added: Industry Outlook]
[removed: Business Combinations][added: Business Combinations]
We have completed and will continue to consider strategic business combinations to enhance our capabilities and offerings in certain [removed: areas.][added: areas, including several individually immaterial acquisitions during the years ended December 31, 2017 and 2016.]
In October 2016, we completed the [removed: merger with IMS Health] [added: Merger] to better serve our clients across their entire product lifecycle by (i) [added: increasing the efficiency of healthcare companies’ commercial organizations through enhanced analytics and outsourcing services; (ii)] improving clinical trial design, recruitment, and execution; [removed: (ii)] [added: and (iii)] creating real-world information solutions based on the use of medicines by actual patients in normal [removed: situations; and (iii) increasing the efficiency of healthcare companies’ commercial organizations through enhanced analytics and outsourcing services.][added: situations.]
These transactions were accounted for as business combinations and the acquired results of operations are included in our consolidated financial information since the acquisition date with a non-controlling interest for [added: the portion that we do not own.]
[removed: Sources] [added: Sources] of [removed: Revenue][added: Revenue]
Our segment revenues expressed as a percent of [removed: 2016] [added: 2017] revenues (excluding reimbursed expense revenue) are as follows:
[removed: |] Commercial Solutions [removed: | | | 20.4 | % |]
[removed: |] Research & Development Solutions [removed: | | | 64.7 | % |]
[removed: |] Integrated Engagement Services [removed: | | | 14.9 | % |]
[removed: Costs] [added: Costs] and [removed: Expenses][added: Expenses]
Costs of revenue include compensation and benefits for billable employees and personnel involved in production, [added: trial monitoring,] data management and delivery, and the costs of acquiring and processing data for our information offerings; costs of staff directly involved with delivering technology-related services offerings and engagements, related accommodations and the costs of data purchased specifically for technology services engagements; and other expenses directly related to service contracts such as courier fees, laboratory supplies, professional services and travel expenses.
Selling, general and administrative expenses include costs related to sales, marketing, and administrative functions (including human resources, legal, [removed: finance] [added: finance, quality assurance, compliance] and general management) for compensation and benefits, travel, professional services, training and expenses for information technology (“IT”), facilities and depreciation and amortization.
[removed: _Foreign] [added: Foreign] Currency [removed: Translation_][added: Translation]
In [removed: 2016,] [added: 2017,] approximately [removed: 36%] [added: 41%] of our revenues were denominated in currencies other than the United States [removed: dollar.][added: dollar, which represents approximately 55 currencies.]
[added: As a result, we believe that providing the] impact of fluctuations in foreign currency rates on certain financial results can facilitate the analysis of period-to-period comparisons of business performance that excludes the effects of foreign currency rate fluctuations.
[removed: Consolidated] [added: Consolidated] Results of [removed: Operations][added: Operations]
[removed: _Year ended] [added: | | | Year Ended] December 31, [added: | | | | | | | | | | | | 2017 vs.] 2016 [removed: compared to the year ended December 31, 2015 and the year ended December 31,] [added: | | | | | | | | 2016 vs.] 2015 [removed: compared to the year ended December 31, 2014_][added: | | | | | | |]
[removed: _Summary] [added: Segment] Results of [removed: Operations_][added: Operations]
| | | [removed: Year] [added: Year] Ended December 31, [removed: 2015] | | | | [removed: Change] | | | | | | | | [removed: Year Ended December 31, 2016] [added: Change] | | | [added: | | | | | | | | | | | |]
| Costs of [removed: revenue | | | 2,705 |] [added: revenue, exclusive of depreciation and amortization] | | [added: $] | [removed: (35] [added: 4,622] | [removed: )] | | [added: $] | [removed: 566] [added: 3,236] | | | [added: $] | [removed: 3,236] [added: 2,705] | |
| Selling, general and administrative expenses | | [removed: | 815 | | |] [added: $] | [removed: (19] [added: 1,605] | [removed: )] | | [added: $] | [removed: 215] [added: 1,011] | | | [added: $] | [removed: 1,011] [added: 815] | |
| Depreciation and amortization | | [removed: | 128 | | |] [added: $] | [removed: (3] [added: 1,011] | [removed: )] | | [added: $] | [removed: 164] [added: 289] | | | [added: $] | [removed: 289] [added: 128] | |
[removed: |] Restructuring [removed: costs | | | 30 | | | | 1 | | | | 40 | | | | 71 | |][added: Costs]
[removed: |] Merger [removed: related costs | | | — | | | | (1 | ) | | | 88 | | | | 87 | |][added: Related Costs]
[removed: |] Impairment [removed: charges | | | 2 | | | | — | | | | 26 | | | | 28 | |][added: Charges]
| | | [removed: Year] [added: Year] Ended December 31, [removed: 2014] | | | | [removed: Change] | | | | | | | | [removed: Year Ended December 31, 2015] [added: Change] | | | [added: | | | | | | | | | | | |]
[removed: |] Selling, [removed: general] [added: General] and [removed: administrative expenses | | | 781 | | | | (37 | ) | | | 71 | | | | 815 | |][added: Administrative Expenses]
[removed: |] Depreciation and [removed: amortization | | | 121 | | | | (4 | ) | | | 11 | | | | 128 | |][added: Amortization]
| Restructuring costs | | [removed: | 9 | | |] [added: $] | [removed: (4] [added: 63] | [removed: )] | | [added: $] | [removed: 25] [added: 71] | | | [added: $] | 30 | |
| Impairment charges | | [removed: | — | | |] [added: $] | [removed: —] [added: 40] | | | [added: $] | [removed: 2] [added: 28] | | | [added: $] | 2 | |
[removed: _Revenues_][added: Revenues]
| | | | | | | | | | | | | | | [removed: Change] [added: Change] | | | | | | | | | | | | | | |
| | | [removed: Year] [added: Year] Ended December [removed: 31, | | | | | | | | | | | | 2016 vs. 2015 | | | |] [added: 31,] | | | | [removed: 2015 vs. 2014] | | | | | | |
| [removed: (dollars] [added: (dollars] in [removed: millions)] [added: millions)] | | [removed: 2016] [added: 2017] | | | | [removed: 2015] [added: 2016] | | | | [removed: 2014] [added: 2015] | | | | [removed: $] [added: $] | | | | [removed: %] [added: %] | | | | [removed: $] [added: $] | | | | [removed: %] [added: %] | | |
| Revenues | | [removed: $] [added: $] | [removed: 5,364] [added: 8,060] | | | $ | [removed: 4,326] [added: 5,364] | | | $ | [removed: 4,165] [added: 4,326] | | | [removed: $] [added: $] | [removed: 1,038] [added: 2,696] | | | | [removed: 24.0] [added: 50.3] | % | | [removed: $] [added: $] | [removed: 161] [added: 1,038] | | | | [removed: 3.9] [added: 24.0] | % |
We are a leading global provider of information, innovative technology solutions and contract research services focused on helping healthcare clients find better solutions for patients.
Formed through the Merger of IMS Health and Quintiles, we apply human data science – leveraging the analytic rigor and clarity of data science to the ever-expanding scope of human science – to enable companies to reimagine and develop new approaches to clinical development and commercialization, speed innovation, and accelerate improvements in healthcare outcomes.
Powered by the IQVIA CORE™, we deliver unique and actionable insights at the intersection of large scale analytics, transformative technology and extensive domain expertise, as well as execution capabilities to help biotech, medical device, and pharmaceutical companies, medical researchers, government agencies, payers and other healthcare stakeholders tap into a deeper understanding of diseases, human behaviors and scientific advances, in an effort to advance their path toward cures.
With more than 55,000 employees, we conduct operations in more than 100 countries.
The Company is managed through three reportable segments, Commercial Solutions, Research & Development Solutions and Integrated Engagement Services.
Commercial Solutions provides critical information, technology solutions and real-world insights and services to our life science clients.
Research & Development Solutions, which primarily serves biopharmaceutical clients, is engaged in research and development and provides clinical research and clinical trial services.
Integrated Engagement Services provides contract sales to both biopharmaceutical clients and the broader healthcare market.
See Note 1 to our audited consolidated financial statements included elsewhere in this Annual Report on Form 10-K for details regarding the new revenue recognition standard, which will be effective January 1, 2018.
In 2017, our revenues increased $2,696 million, or 50.3%, as compared to the same period in 2016.
The constant currency revenue growth was comprised of a $2,515 million increase in Commercial Solutions, which includes $2,557 million from the Merger, partially offset by lower revenue from Encore during the first half of 2017 and the sale of Encore at the beginning of the third quarter of 2017, a $172 million increase in Research & Development Solutions and a $9 million decrease in Integrated Engagement Services.
When compared to 2016, costs of revenue, exclusive of depreciation and amortization, in 2017 increased $1,386 million.
The constant currency growth was comprised of a $1,267 million increase in Commercial Solutions, which includes $1,302 million from the Merger, partially offset by lower costs from Encore during the first half of 2017 and the sale of Encore at the beginning of the third quarter of 2017, a $119 million increase in Research & Development Solutions and a $2 million increase in Integrated Engagement Services.
As a percent of revenues, costs of revenue declined in 2017 to 57.3% as compared to 60.3% in 2016.
This decline was primarily due to the fact that 2017 includes a lower proportion of revenues from the lower margin Integrated Engagement Services segment, primarily as a result of the Merger.
The constant currency growth primarily consisted of a $479 million increase in Commercial Solutions, primarily from the Merger and a $6 million increase in Research & Development Solutions.
The $722 million and $161 million increases in depreciation and amortization in 2017 and 2016, respectively, were primarily due to the approximately $6.4 billion of intangible assets acquired in the Merger.
Interest expense during 2017 was higher than 2016 due to an increase in the average debt outstanding, primarily as a result of the debt assumed in the Merger and the refinancing transaction in the fourth quarter of 2016 (approximately $4.5 billion), the February 2017 issuance of €1,425 million (approximately $1,522 million) of 3.25% senior notes, the September 2017 issuance of €420 million (approximately $501 million) of 2.875% senior notes and the incremental term B loan of $750 million.
See Note 11 to our audited consolidated financial statements included elsewhere in this Annual Report on Form 10-K for additional information with respect to these debt transactions.
During 2017, we recognized a $19 million loss on extinguishment of debt for fees and expenses incurred related to the refinancing of our senior notes and senior secured credit facilities, which includes a $16 million make-whole premium.
Other expense, net for 2017 primarily consisted of foreign currency net losses, partially offset by investment gains.
The foreign currency losses in 2017 were primarily the result of the combination of changes in intercompany loan balances from corporate legal entity integration and a weaker U.S. dollar.
On December 22, 2017, the U.S. government enacted the Tax Act.
The Tax Act is comprehensive legislation that includes provisions that lower the federal corporate income tax rate from 35% to 21% beginning in 2018 and impose a one-time transition tax on undistributed foreign earnings.
ASC 740 “Income Taxes” generally requires the effects of the tax law change to be recorded in the period of enactment.
However, the SEC staff issued Staff Accounting Bulletin No. 118 to address situations when a registrant does not have the necessary information available, prepared, or analyzed (including computations) in reasonable detail to complete the accounting for certain income tax effects of the Tax Act.
We have recognized the tax impacts related to the transition tax on undistributed foreign earnings and the impact to deferred tax assets and liabilities and included these amounts in our consolidated financial statements for the year ended December 31, 2017, on a provisional basis.
The ultimate impact may differ from these provisional amounts, possibly materially, due to, among other things, additional analysis, changes in interpretations and assumptions we have made, and additional interpretive regulatory guidance that may be issued.
The accounting is expected to be complete when the 2017 U.S. corporate income tax return is filed in 2018.
As a result of the Tax Act, we recorded a provisional deferred tax benefit of $977 million related to the revaluation of deferred taxes at the newly enacted 21% rate and the reversal of the deferred tax liability on undistributed foreign earnings net of the newly enacted transition tax.
We no longer consider any of our foreign earnings to be indefinitely reinvested.
Our effective income tax rate was also favorably impacted by a tax benefit of $261 million related to purchase accounting amortization of approximately $763 million as a result of the Merger.
Additionally, due to the adoption of the new stock\-based compensation accounting standard on January 1, 2017, our effective income tax rate was favorably impacted by $26 million of excess tax benefits on equity compensation.
See Note 4 to our audited consolidated financial statements included elsewhere in this Annual Report on Form 10-K for additional information with respect to these funds.
| --- | --- | --- | --- | --- | --- | --- | --- | --- | --- | --- | --- | --- | --- | --- | --- | --- | --- | --- | --- | --- | --- | --- | --- | --- |
| Commercial Solutions | | $ | 3,630 | | | $ | 1,089 | | | $ | 323 | | | $ | 1,010 | | | $ | 234 | | | $ | 19 | |
| Research & Development Solutions | | | 3,647 | | | | 3,478 | | | | 3,159 | | | | 997 | | | | 943 | | | | 824 | |
| Integrated Engagement Services | | | 783 | | | | 797 | | | | 844 | | | | 73 | | | | 76 | | | | 78 | |
Prior period segment results have been recast to conform to immaterial changes to management reporting in 2017.
The recast only impacts the fourth quarter of 2016 as the management reporting changes relate to IMS Health and these results are only reflected in our results since the date of the Merger on October 3, 2016.
Quintiles IMS Holdings, Inc. (“QuintilesIMS”, the “Company”, “we”, “our” and/or “us”) is a leading worldwide integrated information and technology-enabled healthcare service provider, dedicated to helping its clients improve their clinical, scientific and commercial results.
Formed through the merger (the “Merger”) of Quintiles Transnational Holdings Inc. (“Quintiles”) and IMS Health Holdings, Inc. (“IMS Health”) on October 3, 2016, QuintilesIMS’s more than 50,000 employees conduct operations in over 100 countries.
Companies seeking to improve real-world patient outcomes through treatment innovations, care provision and access can utilize our broad range of healthcare information, technology and service solutions to drive new insights and approaches.
Our solutions span clinical to commercial, bringing our clients an opportunity to realize the full potential of innovations and advanced healthcare outcomes.
Following the merger with IMS Health, we manage our business through three reportable segments, Commercial Solutions (substantially IMS Health’s legacy businesses plus Quintiles’ legacy Real-World Late Phase, Payer/Provider and Advisory businesses), Research & Development Solutions (substantially Quintiles’ legacy Product Development segment) and Integrated Engagement Services (substantially Quintiles’ legacy Integrated Healthcare Services segment).
Historical segment reporting has been revised to reflect these changes to the Company’s segment structure.
##### [Table of Contents](#toc)
the portion which we do not own.
| | | | | |
As a result, we believe that providing the
##### [Table of Contents](#toc)
The following tables present a summary of our results of operations:
| | | | | | | | | | | | | | | | | |
| --- | --- | --- | --- | --- | --- | --- | --- | --- | --- | --- | --- | --- | --- | --- | --- | --- |
| (in millions) | | | Currency Impact | | | | Constant Currency | | | | | | | | | |
| Revenues | | $ | 4,326 | | | $ | (6 | ) | | $ | 1,044 | | | $ | 5,364 | |
| | | | | | | | | | | | | | | | | |
| Income from operations | | $ | 646 | | | $ | 51 | | | $ | (55 | ) | | $ | 642 | |
| | | | | | | | | | | | | | | | | |
| | | | | | | | | | | | | | | | | |
| --- | --- | --- | --- | --- | --- | --- | --- | --- | --- | --- | --- | --- | --- | --- | --- | --- |
| (in millions) | | | Currency Impact | | | | Constant Currency | | | | | | | | | |
| Revenues | | $ | 4,165 | | | $ | (211 | ) | | $ | 372 | | | $ | 4,326 | |
| Costs of revenue | | | 2,664 | | | | (196 | ) | | | 237 | | | | 2,705 | |
| | | | | | | | | | | | | | | | | |
| Income from operations | | $ | 590 | | | $ | 30 | | | $ | 26 | | | $ | 646 | |
| | | | | | | | | | | | | | | | | |
##### [Table of Contents](#toc)
_Consolidated Results of Operations_
| | | | | | | | | | | | | | | | | | | | | | | | | | | | | |
In 2015, our revenues increased $161 million, or 3.9%, as compared to 2014.
| | | | | | | | | | | | | |
| Costs of revenue | | $ | 3,236 | | | $ | 2,705 | | | $ | 2,664 | |
##### [Table of Contents](#toc)
When compared to 2014, costs of revenue in 2015 increased $41 million.
The constant currency growth was comprised of a $71 million increase in Commercial Solutions, which included the impact from the Encore acquisition which closed in July 2014, a $146 million increase in Research & Development Solutions, which included the incremental impact from the businesses that Quest contributed to Q2 Solutions, and a $21 million increase in Integrated Engagement Services.
The decrease in costs of revenue as a percent of revenues for 2015 was primarily as a result of an improvement in constant currency profit margin in the Commercial Solutions, Research & Development Solutions and Integrated Engagement Services segments (as more fully described in the segment discussion later in this section).
For 2015, this constant currency profit margin expansion was partially offset by the effect from a higher proportion of consolidated revenues being contributed by our lower margin Integrated Engagement Services segment when compared to 2014 as well as a negative impact from foreign currency fluctuations.
| | | | | | | | | | | | | |
The constant currency growth was comprised of a $151 million increase in Commercial Solutions, which includes $158 million from the merger with IMS Health, partially offset by a decline in the legacy service offerings, a $32 million increase in Research & Development Solutions, which includes the incremental impact from the businesses that Quest contributed to Q2 Solutions, a $3 million increase in Integrated Engagement Services, and a $29 million increase in general corporate and unallocated expenses, which includes $37 million from the merger with IMS Health.
An excerpt. Shown here: 40 of 281 rewritten, 40 of 110 added and 40 of 247 removed. The counts are complete. For every sentence, read Item 7. Management’s Discussion and Analysis of Financial Condition and Results of Operations in the FY2017 filing and the FY2016 filing.
Item 7A. Quantitative and Qualitative Disclosures About Market Risk
20 rewritten, 0 added, 2 removed, 20 unchanged
Read the full itemFY2017 item · filed February 16, 2018FY2016 item · filed February 16, 2017
[removed: _Foreign] [added: Foreign] Currency Exchange [removed: Rates_][added: Rates]
We transact business in more than 100 countries and [added: approximately 55 currencies and] are subject to risks associated with fluctuating foreign currency exchange rates.
It is our policy to enter into foreign currency transactions only to the extent necessary to meet [removed: its] [added: our] objectives as stated above.
The contractual value of our foreign exchange derivative instruments, all of which were foreign exchange forward contracts, was approximately [removed: $489] [added: $282] million at December 31, [removed: 2016.][added: 2017.]
The potential loss in fair value for foreign exchange forward contracts based on a hypothetical 10% decrease in the value of the United States [removed: Dollar] [added: dollar] or, in the case of [removed: non-dollar-related] [added: non-United States dollar related] contracts, the currency being purchased, was [removed: $39] [added: $12] million at December 31, [removed: 2016.][added: 2017.]
However, the change in the fair value of the foreign exchange forward contracts would likely be offset by a change in the [removed: fair] value of the future service contract revenue, royalty or balance sheet exposure being [removed: hedged.][added: hedged caused by the currency exchange rate fluctuation.]
Excluding the impacts from any outstanding or future hedging transactions, a hypothetical 10% change in average exchange rates used to translate all foreign currencies to the United States [removed: Dollar] [added: dollar] would have impacted income before income taxes for [removed: 2016] [added: 2017] by approximately [removed: $65] [added: $112] million.
[removed: Additionally] [added: Additionally,] commencing in 2016, we designated a portion of our foreign currency denominated debt as a hedge of our net investment in foreign subsidiaries to reduce the volatility in stockholders’ equity caused by changes in the Euro exchange rate with respect to the United States [removed: Dollar.][added: dollar.]
As of December 31, [removed: 2016,] [added: 2017,] these borrowings (net of original issue discount) were [removed: €2,025] [added: €4,036] million [removed: ($2,131] [added: ($4,835] million).
A hypothetical 10% decrease in the value of the United States [removed: Dollar] [added: dollar] would lead to a potential loss in fair value of [removed: $213] [added: $484] million.
However, this change in fair value would be offset by the change in [removed: fair] value of the hedged portion of our net investment in foreign [removed: subsidiaries.][added: subsidiaries caused by the currency exchange rate fluctuation.]
[removed: _Interest Rates_][added: Interest Rates]
As of December 31, [removed: 2016,] [added: 2017,] we had approximately [removed: $4.4] [added: $5.5] billion of variable rate indebtedness and interest rate caps and swaps with a notional value of [removed: $1.9] [added: $1.6] billion.
Because we do not attempt to hedge all of our variable rate debt, we may incur higher interest costs for the portion of our variable rate debt [removed: which] [added: that] is not hedged.
[removed: Each] [added: Excluding debt covered by hedges, each] quarter-point increase or decrease in the [removed: variable] interest rate [added: on our variable rate debt] would result in our interest expense changing by approximately [removed: $6] [added: $10] million per [removed: year under our unhedged variable rate debt.][added: year.]
[removed: _Marketable Securities_][added: Marketable Securities]
At December 31, [removed: 2016,] [added: 2017,] we held investments in marketable equity securities.
These investments are classified as either trading securities or available-for-sale securities and are recorded at fair [removed: value in the financial statements.][added: value.]
As of December 31, [removed: 2016,] [added: 2017,] the fair value of these investments was [removed: $40] [added: $46] million based on the quoted market value of the securities.
The potential loss in fair value resulting from a hypothetical decrease of 10% in quoted market values was approximately [removed: $4] [added: $5] million at December 31, [removed: 2016.][added: 2017.]
##### [Table of Contents](#toc)
##### [Table of Contents](#toc)
Item 1. Business
102 rewritten, 51 added, 54 removed, 109 unchanged
Read the full itemFY2017 item · filed February 16, 2018FY2016 item · filed February 16, 2017
[removed: Our Company][added: Our Company]
[removed: Formed through the merger of Quintiles and IMS Health, QuintilesIMS’s over 50,000 employees] [added: With more than 55,000 employees, we] conduct operations in more than 100 countries.
[removed: Following the Merger, we] [added: We] have one of the largest and most comprehensive collections of healthcare information in the world, which includes more than 530 million comprehensive, longitudinal, [removed: anonymous] [added: non-identified] patient records spanning sales, prescription and promotional data, medical claims, electronic medical records and social media.
Our scaled and growing data set contains [removed: over 20] [added: approximately 30] petabytes of proprietary data sourced from more than [removed: 100,000] [added: 120,000] data suppliers and covering over [removed: 800,000] [added: 900,000] data feeds globally.
Based on this data, we deliver information and insights on over 85% of the world’s pharmaceuticals, as measured by [removed: 2015] [added: 2016] sales.
| | • | [removed: | _A] [added: A] leading healthcare-specific global IT [removed: infrastructure,_] [added: infrastructure,] representing what we believe is one of the largest and most sophisticated information technology infrastructures in healthcare. [removed: By processing] [added: We receive] over [removed: 65] [added: 70] billion healthcare [removed: transactions] [added: records] annually, our infrastructure [added: then] connects complex healthcare data while applying a wide range of privacy, security, operational, legal and contractual protections for data in response to local law, supplier requirements and industry leading practices; |
| | • | [removed: | _Data-enriched] [added: Analytics-driven] clinical [removed: development,_] [added: development,] which improves clinical trial design, site identification and patient recruitment by empowering therapeutic, scientific, and domain experts with expansive levels of information, including product level tracking in 90 markets, and information about treatments and outcomes on more than 530 million [removed: anonymous] [added: non-identified] patients; |
| | • | [removed: | _Robust] [added: Robust] real-world insights [removed: ecosystem,_] [added: ecosystem,] with sophisticated retrospective database analytics, prospective real-world data collection technology platforms and scientific expertise, which enables us to address critical healthcare issues of cost, value and patient outcomes; |
| | • | [removed: | _A] [added: A] growing set of proprietary [added: clinical and] commercial [removed: applications,_] [added: applications,] which [removed: support] [added: helps] our [removed: clients’] [added: clients increase their clinical operations performance and supports their] sales operations, sales management, multi-channel marketing and performance management; and |
| | • | [removed: | _A] [added: A] staff of more than [removed: 50,000 employees_] [added: 55,000 employees] across the globe, including approximately [removed: 16,000] [added: 19,000] Commercial Services employees, approximately [removed: 27,000] [added: 29,000] Research & Development Solutions employees and approximately 7,000 Integrated Engagement Services employees. |
[removed: ][added: ]
| [removed: • Market] [added: •Market] opportunity assessment | [removed: | • Drug] [added: •Drug] pricing optimization | [removed: | • Market] [added: •Market] access | [removed: | • Commercial] [added: •Commercial] operations |
| [removed: • Project] [added: •Project] management and clinical monitoring | [removed: | • Launch] [added: •Launch] readiness | [removed: | • Health] [added: •Health] technology assessment | [removed: | • Sales] [added: •Sales] force effectiveness |
| [removed: • Clinical] [added: •Clinical] trial support services | [removed: | • Commercial] [added: •Commercial] planning | [removed: | • Commercial] [added: •Commercial] readiness | [removed: | • Sales] [added: •Sales] force alignment |
| [removed: • Patient] [added: •Patient] recruitment | [removed: | • Brand] [added: •Brand] positioning | [removed: | • Forecasting |] [added: •Forecasting] | [removed: • Multi-channel] [added: •Multi-channel] marketing |
| [removed: • Clinical] [added: •Clinical] trial laboratory services | [removed: | • Message] [added: •Message] testing | [removed: | • Resource] [added: •Resource] allocation | [removed: | • Client] [added: •Client] relationship management |
| [removed: • Strategic] [added: •Strategic] clinical trial planning and design | [removed: | • Influence] [added: •Influence] networks | [removed: | • Contract] [added: •Contract] sales force | [removed: | • Lifecycle] [added: •Lifecycle] management |
| | [removed: | • Territory] [added: •Territory] design | [removed: | • Observational] [added: •Observational] studies | | [removed: |]
| | | [removed: | | • Stakeholder] [added: •Stakeholder] engagement | | [removed: |]
| [removed: User | | Illustrative Questions |] [added: User] | [added: Illustrative Questions] | | |
| Research & Development | [removed: |] Which study centers have the target patients? | [removed: |] Are there enough patients for my clinical trial? | [removed: |] How long will trial enrollment take to hit target patient volumes? |
| Sales | [removed: |] Which providers generate the highest return on representative visit? | [removed: |] Does my sales representative drive appropriate prescribing? | [removed: |] How much should I pay my sales representative next month? |
| Marketing | [removed: |] What share of patients is appropriately treated? | [removed: |] Which underserved patient populations will benefit most from my new drug? | [removed: |] Is my brand gaining market share quickly enough to hit revenue forecasts? |
| Real-World Evidence/Pharmacovigilance | [removed: |] What is the likely impact of new therapies on costs and outcomes? | [removed: |] Are new therapies performing better against existing standards of care in real-world settings? | [removed: |] Does real-world data indicate adverse events not detected in clinical trials? |
[removed: Our] [added: Our] Market [removed: Opportunity][added: Opportunity]
| | • | [removed: | _Outsourced] [added: Outsourced] research and [removed: development__:_] [added: development:] Biopharmaceutical spending on drug development totaled approximately $100 billion in [removed: 2016.] [added: 2017.] Of that amount, we estimate that our addressable [removed: market] [added: opportunity] (clinical development spending excluding preclinical spending) was approximately [removed: $56] [added: $59] billion. The portion of this addressable [removed: market] [added: opportunity] that was outsourced in [removed: 2016,] [added: 2017,] based on our estimates, was approximately [removed: $24] [added: $26] billion; |
| | • | [removed: | _Real-World] [added: Real-World] Evidence and connected [removed: health:_] [added: health:] Total addressable market of approximately $80 billion based on [removed: 2016] [added: 2017] sales that consists of two relatively equal parts. First, the market for Real-World Evidence of approximately $40 billion includes traditionally defined analytic platforms and implementation, medical and scientific analytic services, observation studies and market access. Second, the market for connected healthcare of approximately $40 billion includes areas such as revenue cycle management, payer analytics and clinical decision support services; and |
| | • | [removed: | _Technology] [added: Technology] enabled commercial [removed: operations:_] [added: operations:] Total addressable market of approximately $50 billion based on [removed: 2016] [added: 2017] sales that includes information, data warehousing, IT outsourcing, software applications and other services in the broader market for IT services. This addressable market also includes commercial services such as recruiting, training, deploying and managing global sales forces, channel management, patient engagement services, market access consulting, brand communication, advisory services, and health information analytics and technology consulting. |
In deriving estimates of the size of the various markets described above, we review third-party sources, which include estimates and forecasts of spending in various [removed: market] segments, in combination with internal [removed: QuintilesIMS] [added: IQVIA] research and analysis informed by our experience serving these [removed: market] segments, as well as projected growth rates for each of these segments.
[removed: _Growth and innovation in the life sciences industry._] The life sciences industry is a large and critical part of the global healthcare system, and, according to the latest information available from the [removed: QuintilesIMS] [added: IQVIA] Market Prognosis service, is estimated to have generated approximately $1.1 trillion in revenue in [removed: 2016.][added: 2017.]
According to our research, revenue growth in the life sciences industry globally is expected to range from [removed: 4%] [added: 3%] to [removed: 7%] [added: 6%] between [removed: 2017] [added: 2018] and [removed: 2021.][added: 2022.]
According to the [removed: QuintilesIMS] [added: IQVIA] Institute, it is estimated that spending on pharmaceuticals in emerging markets will expand at a [removed: 6-9%] [added: 6% to 9%] compound annual growth rate (“CAGR”) through [removed: 2021.][added: 2022.]
[removed: _Growth in Research and Development__._] Spending trends in research and development are impacted as a result of several factors, including major biopharmaceutical companies’ efforts to replenish revenues lost from the so-called “patent [removed: cliff” of recent years,] [added: cliff,”] increased access to capital by the small and midcap biotechnology industry, and recent increases in pharmaceutical approvals by regulatory authorities.
The [removed: QuintilesIMS] [added: IQVIA] Institute also estimates that [added: approximately] 225 new molecular entities (“NMEs”) are expected to be approved between [removed: 2017] [added: 2018] and [removed: 2021,] [added: 2022,] compared to [removed: 184] [added: 208] between [removed: 2011] [added: 2012] and [removed: 2015,] [added: 2016,] and [removed: 146] [added: 149] between [removed: 2006] [added: 2007] and [removed: 2010.][added: 2011.]
[removed: _Increased Complexity in Research and Development._] Biopharmaceutical companies face environments in which it has become increasingly difficult to operate.
[removed: _Financial pressures driving the need for increased efficiency._] Despite expected accelerating growth in the global life sciences market, we believe our clients will face increased operating margin pressure due to their changing product mix, pricing and reimbursement challenges, and rising costs of compliance.
We believe that the need for biopharmaceutical companies to maximize productivity and lower costs across their processes from research and development through commercial [added: operations will cause them to look to partners as they enter into outsourcing arrangements to improve efficiency.]
[removed: _Evolving need to integrate and structure expanding sources of data._] Over the past decade, many health systems around the world have focused on digitizing medical records.
Longitudinal studies require analysis of [removed: anonymous] [added: non-identified] patient diagnoses, treatments, procedures and laboratory test results to identify types of patients that will likely best respond to particular therapies.
Finally, manufacturers also require the ability to analyze social media activity to identify [removed: the specific] [added: unmet] patient [added: needs] and [removed: advocacy groups that influence the adoption of] [added: support for] new orphan drugs.
We are a leading global provider of information, innovative technology solutions and contract research services focused on helping healthcare clients find better solutions for patients.
Formed through the Merger of IMS Health and Quintiles, we apply human data science – leveraging the analytic rigor and clarity of data science to the ever-expanding scope of human science – to enable companies to reimagine and develop new approaches to clinical development and commercialization, speed innovation, and accelerate improvements in healthcare outcomes.
Powered by the IQVIA CORE™, we deliver unique and actionable insights at the intersection of large scale analytics, transformative technology and extensive domain expertise, as well as execution capabilities to help biotech, medical device, and pharmaceutical companies, medical researchers, government agencies, payers and other healthcare stakeholders tap into a deeper understanding of diseases, human behaviors and scientific advances, in an effort to advance their path toward cures.
| --- | --- | --- |
| --- | --- | --- |
| --- | --- | --- |
| --- | --- | --- |
| --- | --- | --- |
| | | | |
| | | | |
| | | | |
| | | | |
| | | | |
| | | | |
| | | | |
| | | | |
| | | | |
| | | | |
| | | | |
| | | | |
| | | | |
| --- | --- | --- |
| --- | --- | --- |
| --- | --- | --- |
See “Industry and Market Data” above.
Growth and innovation in the life sciences industry.
Growth in Research and Development.
Increased Complexity in Research and Development.
Financial pressures driving the need for increased efficiency.
Evolving need to integrate and structure expanding sources of data.
Need for demonstrated value in healthcare.
Continue to innovate by leveraging our information, advanced analytics, technology and domain expertise.
Build upon our extensive client relationships.
Expand portfolio through strategic acquisitions.
Expand the penetration of our offerings to the broader healthcare marketplace.
Technology solutions.
Real-World Insights.
Workflow analytics and consulting services.
National information offerings.
Sub-national information offerings.
We are a leading worldwide integrated information and technology-enabled healthcare service provider, dedicated to helping our clients improve their clinical, scientific and commercial results.
Our broad range of healthcare information, technology and service solutions span the entire product lifecycle, from clinical to commercial operations, bringing clients an opportunity to realize the full potential of innovations and advanced healthcare outcomes.
| --- | --- | --- | --- |
| --- | --- | --- | --- |
| --- | --- | --- | --- |
| --- | --- | --- | --- |
| --- | --- | --- | --- |
##### [Table of Contents](#toc)
| | | | | | | |
| --- | --- | --- | --- | --- | --- | --- |
| | | | | | | |
| | | | | | | |
| | | | | | | |
| | | | | | | |
| | | | | | | |
| | | | | | | |
| | | | | | | |
##### [Table of Contents](#toc)
| | | | | | | |
| --- | --- | --- | --- | --- | --- | --- |
| | | | | | | |
| | | | | | | |
| | | | | | | |
| | | | | | | |
| --- | --- | --- | --- |
##### [Table of Contents](#toc)
##### [Table of Contents](#toc)
operations will cause them to look to partners as they enter into outsourcing arrangements to improve efficiency.
_Continue to innovate by leveraging our information, technology and service capabilities._ As a leader in the development and commercialization of new pharmaceutical therapies, we can empower our therapeutic,
##### [Table of Contents](#toc)
##### [Table of Contents](#toc)
##### [Table of Contents](#toc)
Our Research & Development Solutions segment is the world’s largest provider of biopharmaceutical development services.
We are positioned at the intersection of business services and healthcare.
We use the breadth and depth of our service offerings, our global footprint and our therapeutic, scientific and analytics expertise to help biopharmaceutical companies, as well as other healthcare clients to be more successful in an increasingly complex healthcare environment.
Our Research & Development Solutions backlog was $9.5 billion at December 31, 2016 as compared to $8.9 billion at December 31, 2015.
We expect $2.9 billion of this to convert to revenue over the next 12 months.
See Part II, Item 7, “Management’s Discussion and Analysis of Financial Condition and Results of Operations – Backlog and Net New Business Reporting” for more detail.
Also, we compete with certain government agencies, private payers and other healthcare stakeholders that provide their data directly to others.
##### [Table of Contents](#toc)
An excerpt. Shown here: 40 of 102 rewritten, 40 of 51 added and 40 of 54 removed. The counts are complete. For every sentence, read Item 1. Business in the FY2017 filing and the FY2016 filing.
Item 3. Legal Proceedings
3 rewritten, 9 added, 2 removed, 23 unchanged
Read the full itemFY2017 item · filed February 16, 2018FY2016 item · filed February 16, 2017
We believe the [removed: lawsuit is] [added: counterclaims are] without merit, reject [removed: plaintiffs’ claims] [added: all counterclaims raised by Veeva] and intend to vigorously defend [added: IQVIA Parties’ position and pursue] our [removed: position.][added: claims against Veeva.]
We believe the indictment is without [removed: merit,] [added: merit] that we acted in compliance with all applicable laws at all times and intend to vigorously defend our position.
For additional information, see Note 13 to our audited consolidated financial statements included elsewhere in this Annual Report on Form [removed: 10-K and “Risk factors—Risks Related to our Business—Litigation or regulatory proceedings could have a material adverse effect on our operating results and financial condition.”][added: 10-K.]
On September 11, 2017, the District Court issued a final decision that the encryption in use by the defendants since June 2014 was adequate to meet the requirements of the Korean Personal Information Privacy Act (“PIPA”) and the sharing of non-identified information for market research purposes was allowed under PIPA.
The District Court also found an earlier version of encryption was insufficient to meet PIPA requirements, but no personal data had been leaked or re-identified.
The District Court did not award any damages to plaintiffs.
Approximately 280 medical doctors and 200 private individuals appealed the District Court decision.
The Company believes the appeal is without merit and intends to vigorously defend its position.
On January 10, 2017, IQVIA Inc., IMS Health Incorporated and IMS Software Services, Inc. (collectively “IQVIA Parties”) filed a lawsuit in the U.S. District Court for the District of New Jersey against Veeva Systems, Inc. (“Veeva”) alleging Veeva unlawfully used IQVIA Parties intellectual property to improve Veeva data offerings, to promote and market Veeva data offerings and to improve Veeva technology offerings.
IQVIA Parties seek injunctive relief, appointment of a monitor, the award of compensatory and punitive damages and reimbursement of all litigation expenses, including reasonable attorneys’ fees and costs.
On March 13, 2017, Veeva filed counterclaims alleging anticompetitive business practices in violation of the Sherman Act and state laws.
Veeva claims damages in excess of $200 million, and is seeking punitive damages and litigation costs, including attorneys’ fees.
The plaintiffs are claiming damages in the aggregate amount of approximately $6 million plus interest.
##### [Table of Contents](#toc)
Cover and table of contents
67 rewritten, 25 added, 23 removed, 39 unchanged
Read the full itemFY2017 item · filed February 16, 2018FY2016 item · filed February 16, 2017
[removed: 10-K 1 d321341d10k.htm] FORM 10-K
[removed: ##### [Table of Contents](#toc)][added: TABLE OF CONTENTS]
[removed: UNITED STATES][added: UNITED STATES]
[removed: SECURITIES] [added: SECURITIES] AND EXCHANGE [removed: COMMISSION][added: COMMISSION]
[removed: Washington,] [added: Washington,] D.C. [removed: 20549][added: 20549]
[removed: (Mark One)][added: (Mark One)]
| ☒ | [removed: ANNUAL] [added: ANNUAL] REPORT PURSUANT TO SECTION 13 OR 15(d) OF THE SECURITIES EXCHANGE ACT OF [removed: 1934] [added: 1934] |
[removed: For] [added: For] the fiscal year ended December 31, [removed: 2016][added: 2017]
| ☐ | [removed: TRANSITION] [added: TRANSITION] REPORT PURSUANT TO SECTION 13 OR 15(d) OF THE SECURITIES EXCHANGE ACT OF [removed: 1934] [added: 1934] |
[removed: For] [added: For] the transition period from to [removed: .][added: .]
[removed: Commission] [added: Commission] File Number: [removed: 001-35907][added: 001-35907]
[removed: QUINTILES IMS HOLDINGS, INC.][added: IQVIA HOLDINGS INC.]
[removed: (Exact] [added: (Exact] name of registrant as specified in its [removed: charter)][added: charter)]
| [removed: Delaware (State] [added: Delaware (State] or other jurisdiction of incorporation or [removed: organization) | | ] [added: organization)] | | [removed: 27-1341991 (I.R.S.] [added: 27-1341991 (I.R.S.] Employer Identification [removed: Number)] [added: Number)] |
[removed: 4820] [added: 4820] Emperor Blvd., Durham, North Carolina [removed: 27703][added: 27703]
[removed: and][added: and]
[removed: 83] [added: 83] Wooster Heights Road, Danbury, Connecticut [removed: 06810][added: 06810]
[removed: (Address] [added: (Address] of principal executive offices and Zip [removed: Code)][added: Code)]
[removed: (919)] [added: (919)] 998-2000 and (203) [removed: 448-4600][added: 448-4600]
[removed: (Registrant’s] [added: (Registrant’s] telephone number, including area [removed: code)][added: code)]
[removed: Securities] [added: Securities] registered pursuant to Section 12(b) of the [removed: Act:][added: Act:]
| [removed: Title] [added: Title] of Each [removed: Class: |] [added: Class:] | [removed: Name] [added: Name] of Each Exchange on which [removed: Registered] [added: Registered] |
| [removed: Common] [added: Common] Stock, par value $0.01 per [removed: share |] [added: share] | [removed: New] [added: New] York Stock [removed: Exchange] [added: Exchange] |
[removed: Securities] [added: Securities] registered pursuant to Section 12(g) of the Act: [removed: None][added: None]
Indicate by check mark whether the registrant is a large accelerated filer, an accelerated filer, a non-accelerated filer, [removed: or] a smaller reporting [added: company, or emerging growth] company.
See the definitions of “large accelerated filer,” “accelerated [removed: filer” and] [added: filer,”] “smaller reporting [added: company,” and “emerging growth] company” in Rule 12b-2 of the Exchange Act.
| Large accelerated filer | [removed: |] ☒ | | [removed: | |] Accelerated filer | [removed: |] ☐ |
| Non-accelerated filer | [removed: |] ☐ | [removed: |] (Do not check if a smaller reporting company) | [removed: |] Smaller reporting company | [removed: |] ☐ |
The aggregate market value of the voting and non-voting common stock held by non-affiliates of the registrant, based upon the closing sale price as reported on the New York Stock Exchange on June 30, [removed: 2016,] [added: 2017,] the last business day of the registrant’s most recently completed second quarter, was approximately [removed: $5,770,018,162, (which does not give effect to the business combination of Quintiles Transnational Holdings Inc. and IMS Health Holdings, Inc. completed on October 3, 2016).][added: $12,189,011,444.]
| Class | [removed: |] Number of Shares Outstanding |
| Common Stock $0.01 par value | [removed: | 235,719,111] [added: 208,251,468] shares outstanding as of February [removed: 9, 2017] [added: 12, 2018] |
Portions of the registrant’s Proxy Statement for the [removed: 2017] [added: 2018] Annual Meeting of Stockholders are incorporated herein by reference in Part III of this Annual Report on Form 10-K to the extent stated herein.
Such proxy statement will be filed with the Securities and Exchange Commission within 120 days of the registrant’s fiscal year ended December 31, [removed: 2016.][added: 2017.]
[removed: QUINTILES IMS HOLDINGS, INC.][added: IQVIA HOLDINGS INC.]
| [removed: Item | | | | Page] [added: Item] | | [added: Page] |
| [removed: [PART I](#tx321341_1) | | | |] [added: [PART II](#PART_II)] | | |
| 1A. | [removed: |] [Risk [removed: Factors](#tx321341_3) | | | 17] [added: Factors](#ITEM_1A_Risk_Factors)] | [added: 15] |
| 1B. | [removed: |] [Unresolved Staff [removed: Comments](#tx321341_4) | | | 44] [added: Comments](#ITEM_1B_UNRESOLVED_STAFF_COMMENTS)] | [added: 38] |
| 3. | [removed: |] [Legal [removed: Proceedings](#tx321341_6) | | | 45] [added: Proceedings](#ITEM_3_LEGAL_PROCEEDINGS)] | [added: 39] |
| 4. | [removed: |] [Mine Safety [removed: Disclosures](#tx321341_7) | | | 46] [added: Disclosures](#ITEM_4_MINE_SAFETY_DISCLOSURES)] | [added: 40] |
10-K 1 iqv-10k_20171231.htm 10-K
or

| | |
| --- | --- |
| | | | | |
| | | | | |
| | | | | |
| | | | Emerging growth company | ☐ |
If an emerging growth company, indicate by check mark if the registrant has elected not to use the extended transition period for complying with any new or revised financial accounting standards provided pursuant to Section 13(a) of the Exchange Act.
| | |
| --- | --- |
| 1. | [Business](#Item_1_Business) | 5 |
| 2. | [Properties](#ITEM_2_PROPERTIES) | 38 |
| 11. | [Executive Compensation](#ITEM_11_Exec_Comp) | 129 |
| 16. | [Form 10-K Summary](#ITEM_16_NEW) | 136 |
| [Signatures](#SIGNATURES) | | 137 |
These forward-looking statements are subject to a number of risks, uncertainties and assumptions, including those described in Part I, Item 1A, “Risk Factors.” If one or more of these risks or uncertainties materialize, or if underlying assumptions prove incorrect, our actual results may vary materially from those expected, estimated or projected or as otherwise suggested by the forward-looking statements that we make for a number of reasons.
Given these uncertainties, users of the information included or incorporated by reference in this Form 10-K, including investors and prospective investors, are cautioned not to place undue reliance on such forward-looking statements.
All forward-looking statements are made only as of the date hereof.
On November 6, 2017, IQVIA Holdings Inc. (the “Company”) filed a Certificate of Amendment to its Amended and Restated Certificate of Incorporation (the “Certificate of Amendment”) to effect a change of the Company’s name from “Quintiles IMS Holdings, Inc.” to “IQVIA Holdings Inc.,” effective as of November 6, 2017 (the “Name Change”).
On November 15, 2017, shares of the Company commenced trading under an updated New York Stock Exchange ticker symbol, “IQV,” and a new CUSIP number, 46266C 105.
All trademarks, trade names, product names, graphics and logos of QuintilesIMS, Quintiles, IMS Health or IQVIA contained herein are trademarks or registered trademarks of IQVIA Holdings Inc. or its subsidiaries, as applicable, in the United States and/or other countries.
All other party trademarks, trade names, product names, graphics and logos contained herein are the property of their respective owners.
The use or display of other parties’ trademarks, trade names, product names, graphics or logos is not intended to imply, and should not be construed to imply, a relationship with, or endorsement or sponsorship of IQVIA Inc. or its subsidiaries by such other party.
FORM 10-K
or
| | | |
| | | | | | | | | |
| --- | --- | --- | --- | --- | --- | --- | --- | --- |
| | | | | | | | | |
##### [Table of Contents](#toc)
TABLE OF CONTENTS
| | | | | | | |
| --- | --- | --- | --- | --- | --- | --- |
| 1. | | [Business](#tx321341_2) | | | 5 | |
| 2. | | [Properties](#tx321341_5) | | | 44 | |
| | | | | | | |
| | | | | | | |
| 11. | | [Executive Compensation](#tx321341_19) | | | 144 | |
| | | | | | | |
| 16. | | [Form 10-K Summary](#tx321341_25) | | | 145 | |
| [Signatures](#tx321341_26) | | | | | 146 | |
##### [Table of Contents](#toc)
##### [Table of Contents](#toc)
We own or have rights to trademarks and service marks that we use in connection with the operation of our business, including QuintilesIMS, Quintiles, the Quintiles logo, IMS Health, IMS, the IMS logo, IMS One, MIDAS, One Key, Xponent, DDD, MD360 Provider Performance Management and E360.
All other trademarks or service marks appearing in this annual report that are not identified as marks owned by us are the property of their respective owners.
##### [Table of Contents](#toc)
An excerpt. Shown here: 40 of 67 rewritten, all 25 added and all 23 removed. The counts are complete. For every sentence, read Cover and table of contents in the FY2017 filing and the FY2016 filing.
Item 2. Properties
2 rewritten, 0 added, 2 removed, 5 unchanged
Read the full itemFY2017 item · filed February 16, 2018FY2016 item · filed February 16, 2017
As of December 31, [removed: 2016,] [added: 2017,] we had approximately [removed: 273] [added: 282] offices located in approximately [removed: 82] [added: 83] countries.
[added: Our properties are] geographically distributed to meet our worldwide operating requirements, and none of our properties are individually material to our business operations.
Our properties are
##### [Table of Contents](#toc)
Item 4. Mine Safety Disclosures
1 rewritten, 0 added, 1 removed, 1 unchanged
Read the full itemFY2017 item · filed February 16, 2018FY2016 item · filed February 16, 2017
[removed: PART II][added: PART II]
##### [Table of Contents](#toc)
Item 5. Market for Registrant’s Common Equity, Related Stockholder Matters and Issuer Purchases of Equity Securities
33 rewritten, 18 added, 18 removed, 20 unchanged
Read the full itemFY2017 item · filed February 16, 2018FY2016 item · filed February 16, 2017
[removed: Market] [added: Market] Information for Common [removed: Stock][added: Stock]
Our common stock trades on the NYSE under the symbol [removed: “Q.”] [added: “IQV.”] The following table sets forth the high and low sales prices per share of our common stock as reported by the NYSE for the periods indicated.
| | | [removed: High] [added: High] | | | | [removed: Low] [added: Low] | | |
| [removed: Fiscal] [added: Fiscal] Year [removed: 2015] [added: 2016] | | | | | | | | |
| | | [removed: High] [added: High] | | | | [removed: Low] [added: Low] | | |
| [removed: Fiscal] [added: Fiscal] Year [removed: 2016] [added: 2017] | | | | | | | | |
[removed: Holders] [added: Holders] of [removed: Record][added: Record]
On February [removed: 9, 2017,] [added: 12, 2018,] we had approximately [removed: 60] [added: 46] stockholders of record as reported by our transfer agent.
[removed: Dividend Policy][added: Dividend Policy]
We do not currently intend to pay dividends on our common stock, and no dividends were declared or paid in [removed: 2016] [added: 2017] or [removed: 2015.][added: 2016.]
[removed: Recent] [added: Recent] Sales of Unregistered [removed: Securities][added: Securities]
We did not sell any unregistered equity securities in [removed: 2016.][added: 2017.]
[removed: Purchases] [added: Purchases] of Equity Securities by the [removed: Issuer][added: Issuer]
On October 30, 2013, our Board approved [removed: an equity] [added: the] repurchase program [removed: (“Repurchase Program”)] authorizing the repurchase of up to [removed: $125] [added: $125.0] million of either our common stock or vested in-the-money employee stock options, or a combination [removed: thereof.][added: thereof (the “Repurchase Program”).]
[removed: During 2015, our] [added: Our] Board increased the [removed: share] [added: stock] repurchase authorization under the Repurchase Program [added: with respect to the repurchase of our common stock] by [removed: $600] [added: $600.0] million, [added: $1.5 billion, $1.0 billion and $1.0 billion in 2015, November 2016, February 2017 and May 2017, respectively,] which increased the total amount that has been authorized under the Repurchase Program to [removed: $725 million.][added: $4.225 billion.]
The Repurchase Program does not obligate us to repurchase any particular amount of common stock or vested in-the-money employee stock options, and it [removed: could] [added: may] be modified, [removed: extended,] suspended or discontinued at any time.
The Repurchase Program for common stock does not have an [removed: end] [added: expiration] date.
From inception [added: of the Repurchase Program] through December 31, [removed: 2016,] [added: 2017,] we have repurchased a total of [removed: $1,678] [added: $4,043] million of our securities under the Repurchase [removed: Program,] [added: Program] consisting of $59 million of stock options and [removed: $1,619] [added: $3,984] million of common stock.
As of December 31, [removed: 2016,] [added: 2017,] we have remaining authorization to repurchase up to [removed: $547] [added: $182] million of our common stock under the Repurchase Program.
The following table summarizes the [added: monthly] equity repurchase program activity for the three months ended December 31, [removed: 2016] [added: 2017] and the approximate dollar value of shares that may yet be purchased pursuant to the Repurchase [removed: Program:][added: Program.]
| [removed: Period] [added: Period] | | [removed: Total] [added: Total] Number of [removed: Shares Purchased] [added: Shares Purchased(1)] | | | | [removed: Average Price Paid] [added: Average Price Paid] per [removed: Share] [added: Share] | | | | [removed: Total] [added: Total] Number of [removed: Shares Purchased] [added: Shares Purchased] as Part [removed: of Publicly Announced Plans] [added: of Publicly Announced Plans] or [removed: Programs] [added: Programs] | | | | [removed: Approximate] [added: Approximate] Dollar Value of Shares That May Yet Be Purchased Under [removed: the Plans] [added: the Plans] or [removed: Programs] [added: Programs] | | |
| | | [removed: (in] [added: (in] millions, except per share [removed: data)] [added: data)] | | | | | | | | | | | | | | |
[removed: During] [added: Since] the [removed: year ended December 31, 2016,] [added: Merger,] we repurchased [removed: 14.3] [added: 43.7] million shares of our common stock at an average market price per share of [removed: $76.57] [added: $82.76] for an aggregate purchase price of [removed: $1,098] [added: $3,620] million [added: both] under [added: and outside of] the Repurchase Program.
[removed: Stock] [added: Stock] Performance [removed: Graph][added: Graph]
This performance graph shall not be deemed “filed” for purposes of Section 18 of the Exchange Act, or incorporated by reference into any filing of [removed: Quintiles IMS Holdings,] [added: IQVIA Holdings] Inc. under the Exchange Act or under the Securities Act, except as shall be expressly set forth by specific reference in such filing.
The following graph shows a comparison from May 9, 2013 (the date our common stock commenced trading on the NYSE) through December 31, [removed: 2016] [added: 2017] of the cumulative total return for our common stock, the Standard & Poor’s 500 Stock Index (“S&P 500”) and a select peer group.
The peer group consists of Cerner Corporation, Charles River Laboratories, Inc., Dun & Bradstreet Corporation, Equifax Inc., ICON plc, IHS Markit Ltd., [removed: INC Research Holdings,] Laboratory Corporation of America Holdings, Nielsen N.V., [removed: Parexel International Corporation, Inc.,] PRA Health Sciences, Inc., [added: Syneos Health (formerly INC Research Holdings),] Thomson Reuters Corporation and Verisk Analytics, Inc. The companies in our peer group are publicly traded information services, information technology or contract research companies, and thus share similar business model characteristics to [removed: QuintilesIMS,] [added: IQVIA,] or provide services to similar customers as [removed: QuintilesIMS.][added: IQVIA.]
The graph assumes that $100 was invested in [removed: QuintilesIMS,] [added: IQVIA,] the S&P 500 and the peer group as of the close of market on May 9, 2013, assumes the reinvestments of dividends, if any.
[removed: ][added: 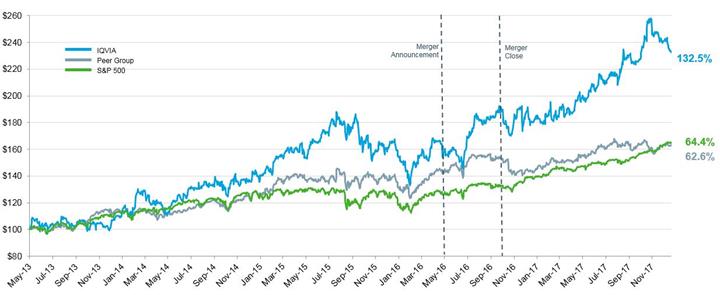]
| | | [removed: 5/9/2013] [added: 5/9/2013] | | | | [removed: 12/31/2013] [added: 12/31/2013] | | | | [removed: 12/31/2014] [added: 12/31/2014] | | | | [removed: 12/31/2015] [added: 12/31/2015] | | | | [removed: 12/31/2016] [added: 12/31/2016] | | | [added: | 12/31/2017 | | |]
| [removed: Q] [added: IQVIA] | | $ | 100 | | | $ | 110 | | | $ | 140 | | | $ | 163 | | | $ | 181 | | [added: | $ | 233 | |]
| Peer Group | | $ | 100 | | | $ | [removed: 116] [added: 115] | | | $ | [removed: 143] [added: 127] | | | $ | [removed: 151] [added: 139] | | | $ | 143 | | [added: | $ | 163 | |]
| S&P 500 | | $ | 100 | | | $ | 114 | | | $ | 127 | | | $ | 126 | | | $ | 138 | | [added: | $ | 164 | |]
| --- | --- | --- | --- | --- | --- | --- | --- | --- |
| First Quarter | | $ | 83.04 | | | $ | 74.80 | |
| Second Quarter | | $ | 91.81 | | | $ | 78.07 | |
| Third Quarter | | $ | 99.95 | | | $ | 87.45 | |
| Fourth Quarter | | $ | 110.67 | | | $ | 94.28 | |
These amounts include 9,677,420 shares of our common stock which we repurchased from certain of our principal stockholders in a private transaction for approximately $750 million and 10,071,003 shares of our common stock which we repurchased directly from underwriters in connection with three separate underwritten, secondary public offerings of shares of our common stock held by certain of our principal stockholders for approximately $935 million in the aggregate in May, September and November 2017.
On February 14, 2018, the Board authorized an increase in the post-merger share repurchase authorization by $1.5 billion to a total of $5.0 billion, with $1.7 billion authorization remaining.
In addition, the table includes shares repurchased outside the Repurchase Program and shares withheld from employees to satisfy certain tax obligations due in connection with grants of stock under the Quintiles IMS Holdings, Inc. 2017 Incentive and Stock Award Plan (“the Plan”).
The Plan provides for the withholding of shares to satisfy tax obligations.
It does not specify a maximum number of shares that can be withheld for this purpose.
The shares of common stock withheld to satisfy tax withholding obligations may be deemed to be “issuer purchases” of shares that are required to be disclosed pursuant to this Item.
| October 1, 2017 – October 31, 2017 | | | — | | | $ | — | | | | — | | | $ | 295 | |
| November 1, 2017 – November 30, 2017 | | | 3.6 | | | $ | 102.39 | | | | 1.1 | | | $ | 187 | |
| December 1, 2017 – December 31, 2017 | | | 0.1 | | | $ | 99.06 | | | | — | | | $ | 182 | |
| | | | 3.7 | | | | | | | | 1.1 | | | | | |
(1) During the three months ended December 31, 2017, the Company repurchased 2.5 million shares outside the Repurchase program which were retired and approximately 0.1 million shares were withheld from employees to satisfy certain tax obligations due in connection with grants of stock under the Plan.
During the year ended December 31, 2017, we repurchased 30.9 million shares of our common stock at an average market price per share of $84.80 for an aggregate purchase price of $2,620 million both under and outside of the Repurchase Program, which includes approximately 19.7 million shares from our sponsors.
| --- | --- | --- | --- | --- | --- | --- | --- | --- | --- | --- | --- | --- | --- | --- | --- | --- | --- | --- | --- | --- | --- | --- | --- | --- |
| | | | | | | | | |
| First Quarter | | $ | 69.97 | | | $ | 56.46 | |
| Second Quarter | | $ | 73.82 | | | $ | 63.63 | |
| Third Quarter | | $ | 80.45 | | | $ | 67.47 | |
| Fourth Quarter | | $ | 72.68 | | | $ | 63.62 | |
| | | | | | | | | |
##### [Table of Contents](#toc)
On November 1, 2016, our Board increased the stock repurchase authorization under the Repurchase Program by $1.5 billion, which increased the total amount that has been authorized under the Repurchase Program to $2.225 billion.
| | | | | | | | | | | | | | | | | |
| October 1, 2016 – October 31, 2016 | | | — | | | $ | — | | | | — | | | $ | 47 | |
| November 1, 2016 – November 30, 2016 | | | 7.4 | | | $ | 78.13 | | | | 7.4 | | | $ | 967 | |
| December 1, 2016 – December 31, 2016 | | | 5.4 | | | $ | 77.41 | | | | 5.4 | | | $ | 547 | |
| | | | | | | | | | | | | | | | | |
| | | | 12.8 | | | | | | | | 12.8 | | | | | |
| | | | | | | | | | | | | | | | | |
##### [Table of Contents](#toc)
| | | | | | | | | | | | | | | | | | | | | |
| --- | --- | --- | --- | --- | --- | --- | --- | --- | --- | --- | --- | --- | --- | --- | --- | --- | --- | --- | --- | --- |
Item 6. Selected Financial Data
57 rewritten, 2 added, 19 removed, 17 unchanged
Read the full itemFY2017 item · filed February 16, 2018FY2016 item · filed February 16, 2017
We have derived the following consolidated statements of income data for [removed: 2016, 2015] [added: 2017, 2016] and [removed: 2014] [added: 2015] and consolidated balance sheet data as of December 31, [removed: 2016] [added: 2017] and [removed: 2015] [added: 2016] from our audited consolidated financial [added: statements included elsewhere in this Annual Report on Form 10-K.]
We have derived the following consolidated statements of income data for [removed: 2013] [added: 2014] and [removed: 2012] [added: 2013] and consolidated balance sheet data as of December 31, [removed: 2014, 2013] [added: 2015, 2014] and [removed: 2012] [added: 2013] from our audited consolidated financial statements not included in this Annual Report on Form 10-K.
| | | [removed: Year] [added: Year] Ended December [removed: 31,] [added: 31,] | | | | | | | | | | | | | | | | | | |
| [removed: (in] [added: (in] millions, except per share [removed: data)] [added: data)] | | [removed: 2016(5)] [added: 2017] | | | | [removed: 2015] [added: 2016(4)] | | | | [removed: 2014] [added: 2015] | | | | [removed: 2013] [added: 2014] | | | | [removed: 2012] [added: 2013] | | |
| [removed: Statement] [added: Statement] of Income [removed: Data:] [added: Data:] | | | | | | | | | | | | | | | | | | | | |
| Revenues | | [removed: $] [added: $] | [removed: 5,364] [added: 8,060] | | | $ | [removed: 4,326] [added: 5,364] | | | $ | [removed: 4,165] [added: 4,326] | | | $ | [removed: 3,808] [added: 4,165] | | | $ | [removed: 3,692] [added: 3,808] | |
| Reimbursed expenses | | | [removed: 1,514] [added: 1,679] | | | | [removed: 1,411] [added: 1,514] | | | | [removed: 1,295] [added: 1,411] | | | | [removed: 1,291] [added: 1,295] | | | | [removed: 1,173] [added: 1,291] | |
| Total revenues | | | [removed: 6,878] [added: 9,739] | | | | [removed: 5,737] [added: 6,878] | | | | [removed: 5,460] [added: 5,737] | | | | [removed: 5,099] [added: 5,460] | | | | [removed: 4,865] [added: 5,099] | |
| Costs of revenue, exclusive of depreciation and amortization | | | [removed: 3,236] [added: 4,622] | | | | [removed: 2,705] [added: 3,236] | | | | [removed: 2,664] [added: 2,705] | | | | [removed: 2,452] [added: 2,664] | | | | [removed: 2,443] [added: 2,452] | |
| Costs of revenue, reimbursed expenses | | | [removed: 1,514] [added: 1,679] | | | | [removed: 1,411] [added: 1,514] | | | | [removed: 1,295] [added: 1,411] | | | | [removed: 1,291] [added: 1,295] | | | | [removed: 1,173] [added: 1,291] | |
| Selling, general and administrative expenses | | | [removed: 1,011] [added: 1,605] | | | | [removed: 815] [added: 1,011] | | | | [removed: 781] [added: 815] | | | | [removed: 772] [added: 781] | | | | [removed: 736] [added: 772] | |
| Depreciation and amortization | | | [removed: 289] [added: 1,011] | | | | [removed: 128] [added: 289] | | | | [removed: 121] [added: 128] | | | | [removed: 108] [added: 121] | | | | [removed: 98] [added: 108] | |
| Restructuring costs | | | [removed: 71] [added: 63] | | | | [removed: 30] [added: 71] | | | | [removed: 9] [added: 30] | | | | [removed: 14] [added: 9] | | | | [removed: 19] [added: 14] | |
| Merger related costs(1) | | | [removed: 87] [added: —] | | | | [removed: —] [added: 87] | | | | — | | | | — | | | | — | |
| Impairment charges(2) | | | [removed: 28] [added: 40] | | | | [removed: 2] [added: 28] | | | | [removed: —] [added: 2] | | | | — | | | | — | |
| Income from operations | | | [removed: 642] [added: 719] | | | | [removed: 646] [added: 642] | | | | [removed: 590] [added: 646] | | | | [removed: 462] [added: 590] | | | | [removed: 396] [added: 462] | |
| Interest expense, net | | | [removed: 140] [added: 339] | | | | [removed: 97] [added: 140] | | | | 97 | | | | [removed: 119] [added: 97] | | | | [removed: 132] [added: 119] | |
| Loss on extinguishment of debt | | | [removed: 31] [added: 19] | | | | [removed: 8] [added: 31] | | | | [removed: —] [added: 8] | | | | [removed: 20] [added: —] | | | | [removed: 1] [added: 20] | |
| Other [removed: (income) expense,] [added: expense (income),] net | | | [removed: (8] [added: 30] | [removed: )] | | | [removed: 2] [added: (8] | [added: )] | | | [removed: (8] [added: 2] | [removed: )] | | | [removed: —] [added: (8] | [added: )] | | | [removed: (4] [added: —] | [removed: )] |
| Income before income taxes and equity in earnings (losses) of unconsolidated affiliates | | | [removed: 479] [added: 331] | | | | [removed: 539] [added: 479] | | | | [removed: 501] [added: 539] | | | | [removed: 323] [added: 501] | | | | [removed: 267] [added: 323] | |
| Income tax [added: (benefit)] expense(3) | | | [removed: 345] [added: (987] | [added: )] | | | [removed: 159] [added: 345] | | | | [removed: 149] [added: 159] | | | | [removed: 96] [added: 149] | | | | [removed: 93] [added: 96] | |
| Income before equity in earnings (losses) of unconsolidated affiliates | | | [removed: 134] [added: 1,318] | | | | [removed: 380] [added: 134] | | | | [removed: 352] [added: 380] | | | | [removed: 227] [added: 352] | | | | [removed: 174] [added: 227] | |
| Equity in earnings (losses) of unconsolidated affiliates | | | [removed: (4] [added: 10] | [removed: )] | | | [removed: 8] [added: (4] | [added: )] | | | [removed: 5] [added: 8] | | | | [removed: (1] [added: 5] | [removed: )] | | | [removed: 3] [added: (1] | [added: )] |
| Net income | | | [removed: 130] [added: 1,328] | | | | [removed: 388] [added: 130] | | | | [removed: 357] [added: 388] | | | | [removed: 226] [added: 357] | | | | [removed: 177] [added: 226] | |
| Net (income) loss attributable to non-controlling interests | | | [removed: (15] [added: (19] | [removed: )] [added: )] | | | [removed: (1] [added: (15] | ) | | | [removed: —] [added: (1] | [added: )] | | | [removed: 1] [added: —] | | | | 1 | |
| Net income attributable to [removed: Quintiles IMS Holdings,] [added: IQVIA Holdings] Inc. | | [removed: $] [added: $] | [removed: 115] [added: 1,309] | | | $ | [removed: 387] [added: 115] | | | $ | [removed: 357] [added: 387] | | | $ | [removed: 227] [added: 357] | | | $ | [removed: 178] [added: 227] | |
| | | [removed: Year] [added: Year] Ended December [removed: 31,] [added: 31,] | | | | | | | | | | | | | | | | | | |
| [removed: (in] [added: (in] millions, except per share [removed: data)] [added: data)] | | [removed: 2016(5)] [added: 2017] | | | | [removed: 2015] [added: 2016(4)] | | | | [removed: 2014] [added: 2015] | | | | [removed: 2013] [added: 2014] | | | | [removed: 2012] [added: 2013] | | |
| Basic | | [removed: $] [added: $] | [removed: 0.77] [added: 6.01] | | | $ | [removed: 3.15] [added: 0.77] | | | $ | [removed: 2.78] [added: 3.15] | | | $ | [removed: 1.83] [added: 2.78] | | | $ | [removed: 1.53] [added: 1.83] | |
| Diluted | | [removed: $] [added: $] | [removed: 0.76] [added: 5.88] | | | $ | [removed: 3.08] [added: 0.76] | | | $ | [removed: 2.72] [added: 3.08] | | | $ | [removed: 1.77] [added: 2.72] | | | $ | [removed: 1.51] [added: 1.77] | |
| Cash dividends declared per common share | | [removed: $] [added: $] | [removed: —] [added: —] | | | $ | — | | | $ | — | | | $ | — | | | $ | [removed: 4.91] [added: —] | |
| Basic | | | [removed: 149.1] [added: 217.8] | | | | [removed: 123.0] [added: 149.1] | | | | [removed: 128.0] [added: 123.0] | | | | [removed: 124.1] [added: 128.0] | | | | [removed: 115.7] [added: 124.1] | |
| Diluted | | | [removed: 152.0] [added: 222.6] | | | | [removed: 125.6] [added: 152.0] | | | | [removed: 131.1] [added: 125.6] | | | | [removed: 127.9] [added: 131.1] | | | | [removed: 117.8] [added: 127.9] | |
| | | [removed: Year] [added: Year] Ended December [removed: 31,] [added: 31,] | | | | | | | | | | | | | | | | | | |
| [removed: (in millions)] [added: (in millions)] | | [removed: 2016(5)] [added: 2017] | | | | [removed: 2015] [added: 2016(4)] | | | | [removed: 2014] [added: 2015] | | | | [removed: 2013] [added: 2014] | | | | [removed: 2012] [added: 2013] | | |
| [removed: Statement] [added: Statement] of Cash Flow [removed: Data:] [added: Data:] | | | | | | | | | | | | | | | | | | | | |
| Operating activities | | [removed: $] [added: $] | [removed: 860] [added: 970] | | | $ | [removed: 476] [added: 860] | | | $ | [removed: 433] [added: 476] | | | $ | [removed: 393] [added: 433] | | | $ | [removed: 336] [added: 393] | |
| Investing activities | | | [removed: 1,731] [added: (1,190] | [added: )] | | | [removed: (67] [added: 1,731] | [removed: )] | | | [removed: (173] [added: (67] | ) | | | [removed: (236] [added: (173] | ) | | | [removed: (132] [added: (236] | ) |
| Financing activities | | | [removed: (2,284] [added: (72] | [removed: )] [added: )] | | | [removed: (249] [added: (2,284] | ) | | | [removed: (130] [added: (249] | ) | | | [removed: 71] [added: (130] | [added: )] | | | [removed: (147] [added: 71] | [removed: )] |
| [removed: Other] [added: Other] Financial [removed: Data:] [added: Data:] | | | | | | | | | | | | | | | | | | | | |
| --- | --- | --- | --- | --- | --- | --- | --- | --- | --- | --- | --- | --- | --- | --- | --- | --- | --- | --- | --- | --- |
| --- | --- | --- | --- | --- | --- | --- | --- | --- | --- | --- | --- | --- | --- | --- | --- | --- | --- | --- | --- | --- |
##### [Table of Contents](#toc)
statements included elsewhere in this Annual Report on Form 10-K.
| | | | | | | | | | | | | | | | | | | | | |
| | | | | | | | | | | | | | | | | | | | | |
| | | | | | | | | | | | | | | | | | | | | |
| | | | | | | | | | | | | | | | | | | | | |
| | | | | | | | | | | | | | | | | | | | | |
| | | | | | | | | | | | | | | | | | | | | |
| | | | | | | | | | | | | | | | | | | | | |
| | | | | | | | | | | | | | | | | | | | | |
##### [Table of Contents](#toc)
| | | | | | | | | | | | | | | | | | | | | |
| | | | | | | | | | | | | | | | | | | | | |
| | | | | | | | | | | | | | | | | | | | | |
| | | | | | | | | | | | | | | | | | | | | |
| | | | | | | | | | | | | | | | | | | | | |
| | | | | | | | | | | | | | | | | | | | | |
##### [Table of Contents](#toc)
##### [Table of Contents](#toc)
An excerpt. Shown here: 40 of 57 rewritten, all 2 added and all 19 removed. The counts are complete. For every sentence, read Item 6. Selected Financial Data in the FY2017 filing and the FY2016 filing.
Item 8. Financial Statements and Supplementary Data
1,001 rewritten, 302 added, 587 removed, 570 unchanged
Read the full itemFY2017 item · filed February 16, 2018FY2016 item · filed February 16, 2017
[removed: MANAGEMENT’S] [added: MANAGEMENT’S] REPORT ON INTERNAL CONTROL OVER FINANCIAL [removed: REPORTING][added: REPORTING]
The management of [removed: Quintiles IMS Holdings,] [added: IQVIA Holdings] Inc. (the “Company”) is responsible for establishing and maintaining adequate internal control over financial reporting.
Management assessed the effectiveness of the Company’s internal control over financial reporting as of December 31, [removed: 2016.][added: 2017.]
As a result of this assessment and based on the criteria in the COSO framework, management has concluded that, as of December 31, [removed: 2016,] [added: 2017,] the Company’s internal control over financial reporting was effective.
The effectiveness of the Company’s internal control over financial reporting as of December 31, [removed: 2016] [added: 2017] has been audited by PricewaterhouseCoopers LLP, an independent registered public accounting firm, as stated in their report which appears herein.
| /s/ Ari Bousbib | | [removed: | |] /s/ Michael R. McDonnell |
| Ari Bousbib [removed: _Chairman,] [added: Chairman,] Chief Executive Officer and [removed: President_] [added: President] (Principal Executive [removed: Officer_)_ | |] [added: Officer)] | | Michael R. McDonnell [removed: _Executive] [added: Executive] Vice President and Chief Financial [removed: Officer_] [added: Officer] (Principal Financial Officer) |
[removed: REPORT] [added: REPORT] OF INDEPENDENT REGISTERED PUBLIC ACCOUNTING [removed: FIRM][added: FIRM]
To the Board of Directors and Stockholders of [removed: Quintiles IMS Holdings, Inc.:][added: IQVIA Holdings Inc.]
In our opinion, the [removed: accompanying] consolidated [removed: balance sheets and the related consolidated] [added: financial] statements [removed: of income, comprehensive income, cash flows and stockholders’ equity (deficit),] [added: referred to above] present fairly, in all material respects, the financial position of [removed: Quintiles IMS Holdings, Inc. and its subsidiaries at] [added: the Company as of] December 31, [removed: 2016] [added: 2017] and [removed: 2015,] [added: 2016,] and the results of [removed: their] [added: its] operations and [removed: their] [added: its] cash flows for each of the three years in the period ended December 31, [removed: 2016] [added: 2017] in conformity with accounting principles generally accepted in the United States of America.
Also in our opinion, the Company maintained, in all material respects, effective internal control over financial reporting as of December 31, [removed: 2016,] [added: 2017,] based on criteria established in Internal [removed: Control—Integrated] [added: Control - Integrated] Framework (2013) issued by the [removed: Committee of Sponsoring Organizations of the Treadway Commission (COSO).][added: COSO.]
The Company’s management is responsible for these [removed: financial statements and] [added: consolidated] financial [removed: statement schedules,] [added: statements,] for maintaining effective internal control over financial [removed: reporting] [added: reporting,] and for its assessment of the effectiveness of internal control over financial reporting, included in the accompanying Management’s Report on Internal Control over Financial Reporting.
Our responsibility is to express opinions on [removed: these financial statements, on] the [added: Company’s consolidated] financial [removed: statement schedules,] [added: statements] and on the Company’s internal control over financial reporting based on our [removed: integrated] audits.
We conducted our audits in accordance with the standards of the [removed: Public Company Accounting Oversight Board (United States).][added: PCAOB.]
Those standards require that we plan and perform the audits to obtain reasonable assurance about whether the [added: consolidated] financial statements are free of material [removed: misstatement] [added: misstatement, whether due to error or fraud,] and whether effective internal control over financial reporting was maintained in all material respects.
Our audits [removed: of the financial statements] [added: also] included [removed: examining, on a test basis, evidence supporting the amounts and disclosures in the financial statements, assessing] [added: evaluating] the accounting principles used and significant estimates made by management, [removed: and] [added: as well as] evaluating the overall [added: presentation of the consolidated] financial [removed: statement presentation.][added: statements.]
[removed: QUINTILES IMS HOLDINGS,] [added: IQVIA HOLDINGS] INC. AND [removed: SUBSIDIARIES][added: SUBSIDIARIES]
[removed: CONSOLIDATED] [added: CONSOLIDATED] STATEMENTS OF [removed: INCOME][added: INCOME]
| | | [removed: Year] [added: Year] Ended December [removed: 31,] [added: 31,] | | | | | | | | | | |
| [removed: (in] [added: (in] millions, except per share [removed: data)] [added: data)] | | [removed: 2016] [added: 2017] | | | | [removed: 2015] [added: 2016] | | | | [removed: 2014] [added: 2015] | | |
| Revenues | | [removed: $] [added: $] | [removed: 5,364] [added: 8,060] | | | $ | [removed: 4,326] [added: 5,364] | | | $ | [removed: 4,165] [added: 4,326] | |
| Reimbursed expenses | | | [removed: 1,514] [added: 1,514] | | | | 1,411 | | [removed: | | 1,295 | |]
| Total revenues | | | [removed: 6,878] [added: 9,739] | | | | [removed: 5,737] [added: 6,878] | | | | [removed: 5,460] [added: 5,737] | |
| Costs of revenue, exclusive of depreciation and amortization | | | [removed: 3,236] [added: 4,622] | | | | [removed: 2,705] [added: 3,236] | | | | [removed: 2,664] [added: 2,705] | |
| Costs of revenue, reimbursed expenses | | | [removed: 1,514] [added: 1,679] | | | | [removed: 1,411] [added: 1,514] | | | | [removed: 1,295] [added: 1,411] | |
| Selling, general and administrative expenses | | | [removed: 1,011] [added: 1,605] | | | | [removed: 815] [added: 1,011] | | | | [removed: 781] [added: 815] | |
| Depreciation and amortization | | | [removed: 289] [added: 1,011] | | | | [removed: 128] [added: 289] | | | | [removed: 121] [added: 128] | |
| Restructuring costs | | | [removed: 71] [added: 63] | | | | [removed: 30] [added: 71] | | | | [removed: 9] [added: 30] | |
| Merger related costs | | | [removed: 87] [added: —] | | | | [removed: —] [added: 87] | | | | — | |
| Impairment charges | | | [removed: 28] [added: 40] | | | | [removed: 2] [added: 28] | | | | [removed: —] [added: 2] | |
| Income from operations | | | [removed: 642] [added: 719] | | | | [removed: 646] [added: 642] | | | | [removed: 590] [added: 646] | |
| Interest income | | | [removed: (4] [added: (7] | [removed: )] [added: )] | | | (4 | ) | | | (4 | ) |
| Interest expense | | | [removed: 144] [added: 346] | | | | [removed: 101] [added: 144] | | | | 101 | |
| Loss on extinguishment of debt | | | [removed: 31] [added: 19] | | | | [removed: 8] [added: 31] | | | | [removed: —] [added: 8] | |
| Other [removed: (income),] expense [added: (income),] net | | | [removed: (8] [added: 30] | [removed: )] | | | [removed: 2] [added: (8] | [added: )] | | | [removed: (8] [added: 2] | [removed: )] |
| Income before income taxes and equity in [removed: (losses)] earnings [added: (losses)] of unconsolidated affiliates | | | [removed: 479] [added: 331] | | | | [removed: 539] [added: 479] | | | | [removed: 501] [added: 539] | |
| Income tax [added: (benefit)] expense | | | [removed: 345] [added: (987] | [added: )] | | | [removed: 159] [added: 345] | | | | [removed: 149] [added: 159] | |
| Income before equity in [removed: (losses)] earnings [added: (losses)] of unconsolidated affiliates | | | [removed: 134] [added: 1,318] | | | | [removed: 380] [added: 134] | | | | [removed: 352] [added: 380] | |
| Equity in [removed: (losses)] earnings [added: (losses)] of unconsolidated affiliates | | | [removed: (4] [added: 10] | [removed: )] | | | [removed: 8] [added: (4] | [added: )] | | | [removed: 5] [added: 8] | |
| Net income | | | [removed: 130] [added: 1,328] | | | | [removed: 388] [added: 130] | | | | [removed: 357] [added: 388] | |
Opinions on the Financial Statements and Internal Control over Financial Reporting
We have audited the accompanying consolidated balance sheets of IQVIA Holdings Inc. and its subsidiaries as of December 31, 2017 and 2016, and the related consolidated statements of income, comprehensive income, cash flows and stockholders’ equity (deficit) for each of the three years in the period ended December 31, 2017, including the related notes and financial statement schedules listed in the index appearing under Item 15(a)(2) (collectively referred to as the “consolidated financial statements”).
We also have audited the Company’s internal control over financial reporting as of December 31, 2017, based on criteria established in Internal Control - Integrated Framework (2013) issued by the Committee of Sponsoring Organizations of the Treadway Commission (COSO).
Basis for Opinions
We are a public accounting firm registered with the Public Company Accounting Oversight Board (United States) (“PCAOB”) and are required to be independent with respect to the Company in accordance with the U.S. federal securities laws and the applicable rules and regulations of the Securities and Exchange Commission and the PCAOB.
Our audits of the consolidated financial statements included performing procedures to assess the risks of material misstatement of the consolidated financial statements, whether due to error or fraud, and performing procedures that respond to those risks.
Such procedures included examining, on a test basis, evidence regarding the amounts and disclosures in the consolidated financial statements.
Definition and Limitations of Internal Control over Financial Reporting
February 16, 2018
We have served as the Company’s auditor since 2002.
| Disposition of business, net of cash disposed | | | 12 | | | | — | | | | — | |
| Repurchase and retirement of common stock | | | (2.5 | ) | | | — | | | | — | | | | — | | | | (255 | ) | | | — | | | | — | | | | — | | | | (255 | ) |
| Stock-based compensation | | | — | | | | — | | | | — | | | | 180 | | | | — | | | | — | | | | — | | | | — | | | | 180 | |
| Distribution to non-controlling interest | | | — | | | | — | | | | — | | | | — | | | | — | | | | — | | | | — | | | | (4 | ) | | | (4 | ) |
| Balance, December 31, 2017 | | | 249.5 | | | | (41.4 | ) | | $ | 2 | | | $ | 10,780 | | | $ | 655 | | | $ | (3,374 | ) | | $ | 46 | | | $ | 249 | | | $ | 8,358 | |
1.
The Surviving Corporation changed its name to Quintiles IMS Holdings, Inc (“QuintilesIMS”).
On November 6, 2017, the Company filed a Certificate of Amendment to its Amended and Restated Certificate of Incorporation (the “Certificate of Amendment”) to effect a change of the Company’s name from “Quintiles IMS Holdings, Inc.” to “IQVIA Holdings Inc.” (the “Name Change”).
On November 15, 2017, shares of the Company commenced trading under an updated New York Stock Exchange ticker symbol, “IQV” (formerly the shares traded under the ticker symbol “Q”).
The foreign currency losses in 2017 were primarily the result of the combination of changes in intercompany loan balances from corporate legal entity integration and a weaker U.S. dollar.
Accrued Loyalty
The Company owns businesses that manage co-pay reimbursements on behalf of its pharmaceutical customers.
These customers prefund the reimbursements and the Company includes this cash on its balance sheet.
The Company draws on this cash to pay pharmacies as consumers use these programs.
Accrued loyalty was $143 million and $131 million, as of December 31, 2017 and 2016, respectively, and included within accrued expenses on the consolidated balance sheet.
| Transportation equipment | | 3 - 20 years |
The Company has provisionally recorded their U.S. deferred taxes based on the Federal corporate income tax rate of 21%.
We are continuing to analyze aspects of the Tax Act and, therefore, have not finalized our accounting policy with respect to whether to (1) recognize deferred taxes for basis differences expected to reverse as Global Low Taxed Intangible Income (“GILTI”) or (2) account for GILTI as period costs if and when incurred.
We have not recognized any deferred tax impacts related to GILTI or the Base Erosion Anti Abuse Tax (“BEAT”) on a provisional basis.
The Company accounts for its stock-based compensation for performance awards based on the closing market price of the Company’s common stock on the date of grant and upon the Monte Carlo simulation model.
In the absence of specific guidance, each separately identifiable cash source and use will be classified on the basis of the nature of the underlying cash flows.
The adoption of this new accounting guidance did not have a material effect on the Company’s consolidated financial statements.
In August 2017, the FASB issued new accounting guidance that will allow more financial and nonfinancial hedging strategies to be eligible for hedge accounting.
It also amends the presentation and disclosure requirements and changes how companies assess hedge effectiveness.
It is intended to more closely align hedge accounting with companies’ risk management strategies, simplify the application of hedge accounting, and increase transparency as to the scope and results of hedging programs.
The new accounting guidance will be effective for the Company on January 1, 2019.
In March 2017, the FASB issued new accounting guidance that requires the service cost component of net periodic benefit cost be presented in the same income statement line item as other employee compensation costs, and requires that the other components of net periodic benefit expense be recognized in the non-operating section of the income statement.
In addition, only the service cost component of net periodic benefit expense is eligible for capitalization when applicable.
The new standard requires retrospective application of the change in the income statement and prospective application for the capitalization of service cost in assets.
The new standard permits previously disclosed components of net benefit costs as an estimation basis for applying the retrospective presentation as a practical expedient.
| | | | | |
| --- | --- | --- | --- | --- |
| | | | | |
February 16, 2017
##### [Table of Contents](#toc)
In addition, in our opinion, the financial statement schedules listed in the index appearing under Item 15(a)(2) present fairly, in all material respects, the information set forth therein when read in conjunction with the related consolidated financial statements.
February 16, 2017
##### [Table of Contents](#toc)
| | | | | | | | | | | | | |
| --- | --- | --- | --- | --- | --- | --- | --- | --- | --- | --- | --- | --- |
| | | | | | | | | | | | | |
| | | | | | | | | | | | | |
| | | | | | | | | | | | | |
| | | | | | | | | | | | | |
| | | | | | | | | | | | | |
| | | | | | | | | | | | | |
| | | | | | | | | | | | | |
##### [Table of Contents](#toc)
| | | | | | | | | | | | | |
| --- | --- | --- | --- | --- | --- | --- | --- | --- | --- | --- | --- | --- |
| Unrealized (losses) gains on available-for-sale securities | | | — | | | | — | | | | (1 | ) |
| Gains on marketable securities included in net income, net of income taxes of $—, $— and ($2) | | | — | | | | — | | | | (3 | ) |
| | | | | | | | | | | | | |
| | | | | | | | | | | | | |
| | | | | | | | | | | | | |
##### [Table of Contents](#toc)
| | | | | | | | | |
| | | | | | | | | |
| | | | | | | | | |
| | | | | | | | | |
| | | | | | | | | |
| | | | | | | | | |
| | | | | | | | | |
| | | | | | | | | |
| | | | | | | | | |
| | | | | | | | | |
| | | | | | | | | |
| | | | | | | | | |
##### [Table of Contents](#toc)
| | | | | | | | | | | | | |
An excerpt. Shown here: 40 of 1,001 rewritten, 40 of 302 added and 40 of 587 removed. The counts are complete. For every sentence, read Item 8. Financial Statements and Supplementary Data in the FY2017 filing and the FY2016 filing.
Item 9A. Controls and Procedures
1 rewritten, 0 added, 0 removed, 8 unchanged
Read the full itemFY2017 item · filed February 16, 2018FY2016 item · filed February 16, 2017
There were no changes in our internal control over financial reporting during the quarter ended December 31, [removed: 2016] [added: 2017] that materially affected, or are reasonably likely to materially affect, our internal control over financial reporting.
Item 9B. Other Information
1 rewritten, 0 added, 1 removed, 1 unchanged
Read the full itemFY2017 item · filed February 16, 2018FY2016 item · filed February 16, 2017
[removed: PART III][added: PART III]
##### [Table of Contents](#toc)
Item 10. Directors, Executive Officers and Corporate Governance
1 rewritten, 49 added, 0 removed, 0 unchanged
Read the full itemFY2017 item · filed February 16, 2018FY2016 item · filed February 16, 2017
[removed: The information] [added: Information] required by this [removed: item is] [added: Item, other than the information regarding the executive officers of the Company] set forth [removed: under] [added: below, is incorporated by reference to] the [removed: headings “Election] [added: sections] of [added: our definitive Proxy Statement for our 2018 Annual Meeting of Stockholders (the “2018 Proxy Statement”) entitled “Proposal No. 1: Election of] Directors,” [removed: and] “Security Ownership of Certain Beneficial Owners and [removed: Management – \[Section] [added: Management—Section] 16(a) Beneficial Ownership Reporting [removed: Compliance\]” in our 2017 Proxy Statement to be filed with the SEC within 120 days after December 31, 2016 in connection with the solicitation of proxies for] [added: Compliance,” “The Company’s Corporate Governance—Documents Establishing] our [removed: 2017 annual meeting of stockholders (the “2017 Proxy Statement”)] [added: Corporate Governance”] and [removed: is incorporated herein by reference.][added: “The Company’s Corporate Governance—Committees of the Board.”]
The current executive officers of the Company are as follows:
| | | |
| --- | --- | --- |
| Name | Age | Position |
| Ari Bousbib | 56 | Chairman, Chief Executive Officer, and President |
| Michael R. McDonnell | 54 | Executive Vice President and Chief Financial Officer |
| W. Richard Staub, III | 55 | President, Research & Development Solutions |
| Kevin C. Knightly | 57 | President, Information & Technology Solutions |
| James H. Erlinger III | 59 | Executive Vice President, General Counsel and Secretary |
Ari Bousbib, Director, Chairman, Chief Executive Officer and President
Mr. Bousbib is Chairman, Chief Executive Officer and President of the Company.
He assumed this position in October 2016 following the Merger of Quintiles and IMS Health.
From 2010 until the Merger, Mr. Bousbib served as Chairman and CEO of IMS Health.
Prior to joining IMS Health, Mr. Bousbib spent 14 years at United Technologies Corporation (“UTC”), an aerospace, defense and building systems company.
From 2008 until 2010, he served as President of UTC’s Commercial Companies, with executive leadership responsibilities for the worldwide operations of Otis Elevator Company, Carrier Corporation, UTC Fire & Security and UTC Power Inc. From 2002 until 2008, Mr. Bousbib was President of Otis, and from 2000 to 2002, he served as its Chief Operating Officer.
Prior to joining UTC, Mr. Bousbib was a partner at Booz Allen Hamilton.
Mr. Bousbib currently serves on the board of directors of The Home Depot, Inc. and is a member of the Harvard Medical School Health Care Policy Advisory Council.
He previously served on the board of directors of Best Buy, Inc. and was appointed by the President of the United States to serve on the President’s Commission on White House Fellowships.
Mr. Bousbib holds a Master of Science Degree in Mathematics and Mechanical Engineering from the Ecole Superieure des Travaux Publics, Paris, and an M.B.A. from Columbia University.
Michael R.
McDonnell, Executive Vice President and Chief Financial Officer
Mr. McDonnell has served as Senior Vice President and Chief Financial Officer since December 2015.
Prior to joining the Company, Mr. McDonnell served as the Executive Vice President and Chief Financial Officer of Intelsat S.A., a leading global provider of satellite services, since July 2011 and as the Executive Vice President and Chief Financial Officer of its subsidiary, Intelsat Investments S.A., from November 2008 to May 2013.
He previously served as Executive Vice President, Chief Operating Officer, Chief Financial Officer and Treasurer of MCG Capital Corporation, a publicly-held commercial finance company, from August 2006 through October 2008, and as its Executive Vice President, Chief Financial Officer and Treasurer from September 2004 to October 2008.
Before joining MCG Capital Corporation, Mr. McDonnell served as Executive Vice President and Chief Financial Officer for EchoStar Communications Corporation (f/k/a DISH Network Corporation), a direct-to-home satellite television operator, from July 2004 to August 2004 and as its Senior Vice President and Chief Financial Officer from August 2000 to July 2004.
Mr. McDonnell spent 14 years at PricewaterhouseCoopers LLP, including four years as a partner.
He also served on the board of directors of Catalyst Health Solutions, Inc., a pharmacy benefit management company, from 2005 to 2012.
Mr. McDonnell has a Bachelor of Science degree in accounting from Georgetown University and is a certified public accountant.
W.
Richard Staub, III, President, Research & Development Solutions
Mr. Staub has served as President, Research & Development Solutions since December 2016.
Previously Mr. Staub served as President of Novella Clinical, a Quintiles company, since 2013.
Prior to Novella’s 2013 acquisition by Quintiles, Mr. Staub served as both president and CEO of Novella Clinical since 2008.
Before joining Novella Clinical in 2004, Mr. Staub was senior vice president of global business development for one of the world’s largest clinical research organizations.
Mr. Staub’s career in the pharmaceutical industry began at Zeneca Pharmaceuticals in 1989 where he had progressive responsibilities as a medical and hospital sales representative, cardiovascular portfolio analyst and marketing manager.
Mr. Staub has a Bachelor of Arts degree in Economics from the University of North Carolina at Chapel Hill.
Kevin C.
Knightly, President, Information & Technology Solutions
Mr. Knightly has served as President, Information & Technology Solutions since October 2016.
Previously Mr. Knightly served as Senior Vice President, Information Offerings at IMS Health from April 2015 to October 2016.
An excerpt. Shown here: all 1 rewritten, 40 of 49 added and all 0 removed. The counts are complete. For every sentence, read Item 10. Directors, Executive Officers and Corporate Governance in the FY2017 filing and the FY2016 filing.
Item 11. Executive Compensation
1 rewritten, 0 added, 0 removed, 0 unchanged
Read the full itemFY2017 item · filed February 16, 2018FY2016 item · filed February 16, 2017
The information required by this item is set forth under the headings “Director Compensation,” “Compensation Discussion and Analysis,” “Compensation Committee Report,” “Compensation of Named Executive Officers,” and “Compensation Committee Interlocks and Insider Participation” in the [removed: 2017] [added: 2018] Proxy Statement and is incorporated herein by reference.
Item 12. Security Ownership of Certain Beneficial Owners and Management and Related Stockholder Matters
1 rewritten, 14 added, 0 removed, 0 unchanged
Read the full itemFY2017 item · filed February 16, 2018FY2016 item · filed February 16, 2017
[removed: The information required by] [added: Information in response to] this [removed: item is set forth under the headings “Securities] [added: Item, other than Securities] Authorized for Issuance Under Equity Compensation [removed: Plan” and] [added: Plans, will be set forth in the section entitled] “Security Ownership of Certain Beneficial Owners and Management” in the [removed: 2017] [added: Company’s 2018] Proxy [removed: Statement and] [added: Statement, which information] is incorporated herein by reference.
Securities Authorized for Issuance Under Equity Compensation Plans
The following table provides certain information with respect to all of our equity compensation plans in effect as of December 31, 2017:
Equity Compensation Plan Information
| Plan Category | | Number of Securities to be issued Upon Exercise of Outstanding Options, Warrants and Rights (a) | | | | Weighted Average Exercise Price of Outstanding Options, Warrants and Rights (b) | | | | Number of Securities Remaining Available for Future Issuance Under Equity Compensation Plans (excluding securities reflected in column (a)) (c) | | | |
| --- | --- | --- | --- | --- | --- | --- | --- | --- | --- | --- | --- | --- | --- |
| Equity compensation plans approved by security holders | | | 8,503,068 | | (1) | $ | 50.04 | | (3) | | 13,412,549 | | (4) |
| Equity compensation plans not approved by security holders | | | 26,727 | | (2) | $ | — | | | | — | | |
| Total | | | 8,529,795 | | | $ | 50.04 | | (3) | | 13,412,549 | | |
| | | |
| --- | --- | --- |
| (1) | Consists of: (i) 7,005,402 shares of common stock issuable upon the exercise of outstanding time-based stock options and underlying outstanding time-based SARs; (ii) 1,097,708 shares of common stock issuable in settlement of outstanding restricted stock units awarded and (ii) 399,958 shares of common stock issuable in settlement of outstanding performance units awarded. Excludes (i) 440,151 shares of common stock subject to outstanding awards of restricted stock and (ii) 76,374 shares of common stock subject to outstanding awards of performance stock. | |
| (2) | Consists of outstanding awards issued to certain executives with supplemental pension benefits in accordance with their individual employment arrangements under the IMS Health DCERP. | |
| (3) | The weighted-average exercise price includes all outstanding stock options and SARs but does not include restricted stock units, restricted stock, performance units or performance stock or IMS Health DCERP awards, all of which do not have an exercise price. If restricted stock units, performance units and other awards that constitute “rights” were included in this calculation, treating such awards as having an exercise price of $0, the weighted average exercise price of outstanding options, warrants and rights would be $41.23. | |
| (4) | Consists of all securities remaining available under our equity compensation plans. All of these shares are available for delivery under stock options, SARs, restricted stock, restricted stock units, performance awards or other forms of equity award authorized by the plans. Does not include 2,251,704 shares that would have remained available under our Employee Stock Purchase Plan had it not been discontinued as of December 31, 2016. | |
Item 13. Certain Relationships and Related Transactions and Director Independence
1 rewritten, 0 added, 0 removed, 0 unchanged
Read the full itemFY2017 item · filed February 16, 2018FY2016 item · filed February 16, 2017
The information required by this item is set forth under the headings “The Company’s Corporate Governance,” and [removed: “Ratification of the Appointment of the Independent Registered Public Accounting Firm”] [added: “Certain Relationships and Related Party Transactions”] in the [removed: 2017] [added: 2018] Proxy Statement and is incorporated herein by reference.
Item 14. Principal Accountant Fees and Services
2 rewritten, 0 added, 1 removed, 0 unchanged
Read the full itemFY2017 item · filed February 16, 2018FY2016 item · filed February 16, 2017
The information required by this item is set forth under the headings “Proposal No. [removed: \[5\]:] [added: 2:] Ratification of the Appointment of the Independent Registered Public Accounting Firm—Fees Paid to Independent [removed: registered] [added: Registered] Public Accounting Firm” in the [removed: 2017] [added: 2018] Proxy Statement and is incorporated herein by reference.
[removed: PART IV][added: PART IV]
##### [Table of Contents](#toc)
Item 15. Exhibits and Financial Statement Schedules
17 rewritten, 224 added, 7 removed, 2 unchanged
Read the full itemFY2017 item · filed February 16, 2018FY2016 item · filed February 16, 2017
[removed: (a)] [added: (a)] The following documents are filed as part of this [removed: report:][added: report:]
[removed: | | (1) Financial | Statements |][added: (1) Financial Statements]
The following consolidated financial statements of [removed: Quintiles IMS Holdings,] [added: IQVIA Holdings] Inc. and its subsidiaries, and the independent registered public accounting firm’s report thereon, are included in Part II, Item 8 of this report:
| | [removed: | Page | |] [added: Page] |
| [Management’s Report on Internal Control over Financial [removed: Reporting](#tx321341_101) | | | 81] [added: Reporting](#MANAGEMENTS_REPORT_ON_INTERNAL_CONTROL)] | [added: 70] |
| [Report of Independent Registered Public Accounting [removed: Firm](#tx321341_102) | | | 82] [added: Firm](#REPORT_OF_INDEPENDENT_REGISTERED_PUBLIC_)] | [added: 71] |
| [Consolidated Statements of [removed: Income](#tx321341_103) | | | 83] [added: Income](#INCOME_STMT_NEWEST)] | [added: 73] |
| [Consolidated Statements of Comprehensive [removed: Income](#tx321341_104) | | | 84] [added: Income](#CONSOLIDATED_STATEDMENTS_OF_COMPREHENSIV)] | [added: 74] |
| [Consolidated Balance [removed: Sheets](#tx321341_105) | | | 85] [added: Sheets](#CONSOLIDATED_BALANCE_SHEETS)] | [added: 75] |
| [Consolidated Statements of Cash [removed: Flows](#tx321341_106) | | | 86] [added: Flows](#STMT_OF_CASH_FLOWS_NEW)] | [added: 76] |
| [Consolidated Statements of Stockholders’ Equity [removed: (Deficit)](#tx321341_107) | | | 87] [added: (Deficit)](#EQUITY_STMT_NEWEST)] | [added: 77] |
| [Notes to Consolidated Financial [removed: Statements](#tx321341_108) | | | 88] [added: Statements](#NOTES_NEW)] | [added: 78] |
| [removed: Schedule] [added: [Schedule] I—Condensed Financial Information of Registrant (Parent Company [removed: Only) | | | 148] [added: Only)](#SCHEDULE_I_CONDENSED_FINANCIAL)] | [added: 139] |
| [removed: Schedule] [added: [Schedule] II—Valuation and Qualifying [removed: Accounts | | | 153] [added: Accounts](#SCHEDULE_II_VALUATION_AND_QUALIFYING_ACC)] | [added: 144] |
| | [removed: (3) Exhibits] [added: (3) Exhibits] | |
The exhibits in the accompanying Exhibit Index [removed: following] [added: preceding] the signature page are filed or furnished as a part of this report and are incorporated herein by reference.
The Company agrees to furnish to the SEC, upon request, copies of any long-term debt instruments that authorize an amount of securities constituting 10% or less of the total assets of [removed: Quintiles IMS Holdings,] [added: IQVIA Holdings] Inc. and its subsidiaries on a consolidated basis.
| | |
| --- | --- |
(2) Financial Statement Schedules for the Years Ended December 31, 2017, 2016 and 2015
| | |
| --- | --- |
EXHIBIT INDEX
| | | | | | | |
| --- | --- | --- | --- | --- | --- | --- |
| | | | Incorporated by Reference | | | |
| Exhibit Number | Exhibit Description | Filed Herewith | Form | File No. | Exhibit | Filing Date |
| | | | | | | |
| 2.1* | [Agreement and Plan of Merger, dated as of May 3, 2016, by and between Quintiles Transnational Holdings Inc. and IMS Health Holdings, Inc. (which includes the Plan of Conversion dated as of May 3, 2016 as Exhibit A thereto).](http://www.sec.gov/Archives/edgar/data/1478242/000119312516574119/d161975dex21.htm) | | 8-K | 001-35907 | 2.1 | May 3, 2016 |
| | | | | | | |
| 3.1 | [Amended and Restated Certificate of Incorporation of IQVIA Holdings Inc., effective November 6, 2017 (as amended through November 6, 2017).](https://www.sec.gov/Archives/edgar/data/1478242/000156459018002340/iqv-ex31_1304.htm) | X | | | | |
| | | | | | | |
| 3.2 | [Amended and Restated Bylaws of IQVIA Holdings Inc., effective November 6, 2017](http://www.sec.gov/Archives/edgar/data/1478242/000119312517335879/d484556dex32.htm) | | 8-K | 001-35907 | 3.2 | November 7, 2017 |
| | | | | | | |
| 4.1 | [Specimen Common Stock Certificate of Quintiles Transnational Holdings Inc.](http://www.sec.gov/Archives/edgar/data/1478242/000119312513175430/d483912dex41.htm) | | S-1/A | 333-186708 | 4.1 | April 26, 2013 |
| | | | | | | |
| 4.2 | [Indenture dated as of May 12, 2015, among Quintiles Transnational Corp., the subsidiary guarantors listed therein and U.S. Bank National Association as trustee.](http://www.sec.gov/Archives/edgar/data/1478242/000119312515184386/d924624dex41.htm) | | 8-K | 001-35907 | 4.1 | May 13, 2015 |
| | | | | | | |
| 4.3 | [Form of 4.875% Rule 144A Senior Note due 2023 (incorporated by reference to Exhibit A to Exhibit 4.1 filed May 13, 2015).](http://www.sec.gov/Archives/edgar/data/1478242/000119312515184386/d924624dex41.htm) | | 8-K | 001-35907 | 4.2 | May 13, 2015 |
| | | | | | | |
| 4.4 | [Form of 4.875% Regulation S Senior Note due 2023 (incorporated by reference to Exhibit A to Exhibit 4.1 filed May 13, 2015).](http://www.sec.gov/Archives/edgar/data/1478242/000119312515184386/d924624dex41.htm) | | 8-K | 001-35907 | 4.3 | May 13, 2015 |
| | | | | | | |
| 4.5 | [Indenture, dated as of September 28, 2016, among Quintiles IMS Incorporated, the Guarantors listed therein and U.S. Bank National Association, as Trustee.](http://www.sec.gov/Archives/edgar/data/1478242/000119312516728752/d266940dex41.htm) | | 8-K | 001-35907 | 4.1 | October 3, 2016 |
| | | | | | | |
| 4.6 | [Senior Note Indenture, dated as of October 24, 2012, among IMS Health Incorporated, as Issuer, the Guarantors party thereto, and Wells Fargo Bank, National Association, as Trustee.](http://www.sec.gov/Archives/edgar/data/1595262/000119312514000659/d628679dex49.htm) | | IMS Health S-1 | 333-193159 | 4.9 | January 2, 2014 |
| | | | | | | |
| 4.7 | [Senior Note Indenture, dated as of March 30, 2015, among IMS Health Incorporated, as Issuer, the Guarantors party thereto, and Deutsche Trustee Company Limited, as Trustee.](http://www.sec.gov/Archives/edgar/data/1595262/000156459015004341/ims-ex41_20150331402.htm) | | IMS Health 10-Q | 001-36381 | 4.1 | May 15, 2015 |
| | | | | | | |
| 4.8 | [Indenture, dated February 28, 2017, among Quintiles IMS Incorporated, as Issuer, U.S. Bank National Association, as trustee of the Notes, and certain subsidiaries of the Issuer as guarantors.](http://www.sec.gov/Archives/edgar/data/1478242/000119312517062687/d252015dex41.htm) | | 8-K | 001-35907 | 4.1 | February 28, 2017 |
| | | | | | | |
| 4.9 | [Indenture, dated September 14, 2017, among Quintiles IMS Incorporated, as Issuer, U.S. Bank National Association, as trustee of the Notes, and certain subsidiaries of the Issuer as guarantors.](http://www.sec.gov/Archives/edgar/data/1478242/000119312517288374/d457354dex41.htm) | | 8-K | 001-35907 | 4.1 | September 19, 2017 |
| | | | | | | |
| 10.1 | [Fourth Amended and Restated Credit Agreement, dated as of October 3, 2016, by and among Quintiles IMS Incorporated, Quintiles IMS Holdings, Inc., the Guarantors party thereto and the Lenders party thereto (Annex B to Exhibit 10.9 filed October 3, 2016).](http://www.sec.gov/Archives/edgar/data/1478242/000119312516728752/d266940dex109.htm) | | 8-K | 001-35907 | 10.9 | October 3, 2016 |
| | | | | | | |
| 10.2 | [Amendment No. 1, dated March 7, 2017, to Fourth Amended and Restated Credit Agreement, dated October 3, 2016 (and filed with the Securities and Exchange Commission as Annex B to Exhibit 10.9 on Form 8-K dated October 3, 2016), among Quintiles IMS Incorporated, Quintiles IMS Holdings, Inc., the Guarantors party thereto, Bank of America N.A., as Administrative Agent and Collateral Agent, the Incremental Term B-1 Euro Lenders party thereto and the other Lenders party thereto.](http://www.sec.gov/Archives/edgar/data/1478242/000119312517073946/d360626dex101.htm) | | 8-K | 001-35907 | 10.1 | March 8, 2017 |
| | | | | | | |
| 10.3 | [Amendment No. 2, dated September 18, 2017, to Fourth Amended and Restated Credit Agreement, by and among Quintiles IMS Incorporated, Quintiles IMS Holdings, Inc., the Guarantors party thereto and the Incremental Term B-2 Dollar Lenders party thereto.](http://www.sec.gov/Archives/edgar/data/1478242/000119312517288374/d457354dex101.htm) | | 8-K | 001-35907 | 10.1 | September 19, 2017 |
| --- | --- | --- |
| | | | | |
| --- | --- | --- | --- | --- |
| | (2) Financial | Statement Schedules |
| --- | --- | --- |
| | | | | |
| --- | --- | --- | --- | --- |
An excerpt. Shown here: all 17 rewritten, 40 of 224 added and all 7 removed. The counts are complete. For every sentence, read Item 15. Exhibits and Financial Statement Schedules in the FY2017 filing and the FY2016 filing.
Item 16. Form 10-K Summary
112 rewritten, 30 added, 387 removed, 33 unchanged
Read the full itemFY2017 item · filed February 16, 2018FY2016 item · filed February 16, 2017
[removed: SIGNATURES][added: SIGNATURES]
| [removed: QUINTILES IMS HOLDINGS, INC. |] [added: IQVIA HOLDINGS INC.] | |
| By: | [removed: |] /s/ Michael R. McDonnell |
| | [removed: |] Name: Michael R. McDonnell |
| | [removed: |] Title: Executive Vice President and Chief Financial Officer |
Date: February 16, [removed: 2017][added: 2018]
| [removed: Signature | | Title] [added: Signature] | [added: Title] | [removed: Date] [added: Date] |
| [removed: /S/ ARI BOUSBIB] [added: /s/] Ari Bousbib [removed: |] [added: Ari Bousbib] | Chairman, Chief Executive Officer and President; Director (Principal Executive Officer) | [removed: |] February 16, [removed: 2017] [added: 2018] |
| [removed: /S/ MICHAEL] [added: /s/ Michael] R. [removed: MCDONNELL] [added: McDonnell] Michael R. McDonnell | [removed: |] Executive Vice President and Chief Financial Officer (Principal Financial Officer) | [removed: |] February 16, [removed: 2017] [added: 2018] |
| [removed: /S/ CHARLES E. WILLIAMS Charles E. Williams |] [added: /s/ Robert Parks Robert Parks] | Senior Vice President, Corporate Controller (Principal Accounting Officer) | [removed: |] February 16, [removed: 2017] [added: 2018] |
| [removed: /S/ DR. DENNIS] [added: /s/ Dr. Dennis] B. [removed: GILLINGS,] [added: Gillings,] CBE Dr. Dennis B. Gillings, CBE | [removed: | Lead] Director | [removed: |] February 16, [removed: 2017] [added: 2018] |
| [removed: /S/ JOHN] [added: /s/ John] P. [removed: CONNAUGHTON] [added: Connaughton] John P. Connaughton | [removed: |] Director | [removed: |] February 16, [removed: 2017] [added: 2018] |
| [removed: /S/ JONATHAN] [added: /s/ Jonathan] J. [removed: COSLET] [added: Coslet] Jonathan J. Coslet | [removed: |] Director | [removed: |] February 16, [removed: 2017] [added: 2018] |
| [removed: /S/ JOHN] [added: /s/ John] G. [removed: DANHAKL] [added: Danhakl] John G. Danhakl | [removed: |] Director | [removed: |] February 16, [removed: 2017] [added: 2018] |
| [removed: /S/ MICHAEL] [added: /s/ Michael] J. [removed: EVANISKO] [added: Evanisko] Michael J. Evanisko | [removed: |] Director | [removed: |] February 16, [removed: 2017] [added: 2018] |
| [removed: /S/ JAMES] [added: /s/ James] A. [removed: FASANO] [added: Fasano] James A. Fasano | [removed: |] Director | [removed: |] February 16, [removed: 2017] [added: 2018] |
| [removed: Signature | | Title] [added: Signature] | [added: Title] | [removed: Date] [added: Date] |
| [removed: /S/ JACK] [added: /s/ Jack] M. [removed: GREENBERG] [added: Greenberg] Jack M. Greenberg | [removed: |] Director | [removed: |] February 16, [removed: 2017] [added: 2018] |
| [removed: /S/ JOHN] [added: /s/ John] M. [removed: LEONARD,] [added: Leonard,] M.D. John M. Leonard, M.D. | [removed: |] Director | [removed: |] February 16, [removed: 2017] [added: 2018] |
| [removed: /S/ RONALD] [added: /s/ Ronald] A. [removed: RITTENMEYER] [added: Rittenmeyer] Ronald A. Rittenmeyer | [removed: |] Director | [removed: |] February 16, [removed: 2017] [added: 2018] |
| [removed: /S/ TODD] [added: /s/ Todd] B. [removed: SISITSKY] [added: Sisitsky] Todd B. Sisitsky | [removed: |] Director | [removed: |] February 16, [removed: 2017] [added: 2018] |
[removed: (2)] [added: (2)] Financial Statement [removed: Schedules][added: Schedules]
[removed: Schedule] [added: Schedule] I—Condensed Financial Information of [removed: Registrant][added: Registrant]
[removed: QUINTILES IMS HOLDINGS,] [added: IQVIA HOLDINGS] INC. (PARENT COMPANY [removed: ONLY)][added: ONLY)]
[removed: CONDENSED] [added: CONDENSED] STATEMENTS OF [removed: INCOME][added: INCOME]
| | | [removed: Year] [added: Year] Ended December [removed: 31,] [added: 31,] | | | | | | | | | | |
| [removed: (in millions)] [added: (in millions)] | | [removed: 2016] [added: 2017] | | | | [removed: 2015] [added: 2016] | | | | [removed: 2014] [added: 2015] | | |
| Selling, general and administrative expenses | | [removed: $] [added: $] | [removed: —] [added: 1] | | | $ | [removed: 1] [added: —] | | | $ | [removed: 2] [added: 1] | |
| Merger related costs | | | [removed: 21] [added: —] | | | | [removed: —] [added: 21] | | | | — | |
| Loss from operations | | | [removed: (21] [added: (1] | [removed: )] [added: )] | | | [removed: (1] [added: (21] | ) | | | [removed: (2] [added: (1] | ) |
| Interest income | | | [removed: —] [added: —] | | | | — | | | | — | |
| Other expense, net | | | [removed: —] [added: —] | | | | — | | | | — | |
| Loss before income taxes and equity in earnings of subsidiary | | | [removed: (21] [added: (1] | [removed: )] [added: )] | | | [removed: (1] [added: (21] | ) | | | [removed: (2] [added: (1] | ) |
| Income tax benefit | | | [removed: (4] [added: (3] | [removed: )] [added: )] | | | [removed: (1] [added: (4] | ) | | | (1 | ) |
| [removed: Loss] [added: Income (loss)] before equity in earnings of subsidiary | | | [removed: (17] [added: 2] | [removed: )] | | | [removed: —] [added: (17] | [added: )] | | | [removed: (1] [added: —] | [removed: )] |
| Equity in earnings of subsidiary | | | [removed: 132] [added: 1,307] | | | | [removed: 387] [added: 132] | | | | [removed: 357] [added: 387] | |
| Net income | | [removed: $] [added: $] | [removed: 115] [added: 1,309] | | | $ | [removed: 387] [added: 115] | | | $ | [removed: 356] [added: 387] | |
[removed: QUINTILES IMS HOLDINGS,] [added: IQVIA HOLDINGS] INC. (PARENT COMPANY [removed: ONLY)][added: ONLY)]
[removed: CONDENSED] [added: CONDENSED] STATEMENTS OF COMPREHENSIVE [removed: INCOME][added: INCOME]
| | | [removed: Year] [added: Year] Ended December [removed: 31,] [added: 31,] | | | | | | | | | | |
| | |
| | |
| | |
| | | |
| | | |
| | | |
| | | |
| | | |
| | | |
| | | |
| | | |
| | | |
| --- | --- | --- |
| | | |
| /s/ Colleen A. Goggins Colleen A. Goggins | Director | February 16, 2018 |
| | | |
| | | |
| | | |
| | | |
| Income taxes payable | | | — | | | | — | |
| Accounts payable and accrued expenses | | | (3 | ) | | | — | | | | — | |
| Effect of foreign currency exchange rate changes on cash | | | (2 | ) | | | — | | | | — | |
| Paid in December 2017 | | $ | 22 | |
| Paid in November 2017 | | | 362 | |
| Paid in September 2017 | | | 373 | |
| Paid in August 2017 | | | 168 | |
| Paid in March 2017 | | | 1,237 | |
| Paid in February 2017 | | | 45 | |
| Total paid in 2017 | | $ | 2,566 | |
| December 31, 2017 | | $ | 153 | | | $ | 52 | | | $ | — | | | $ | (5 | ) | | $ | 200 | |
##### [Table of Contents](#toc)
| | | | | |
| --- | --- | --- | --- | --- |
| | | | | |
| | | | | |
| | | | | |
| | | | | |
| | | | | |
| | | | | |
| | | | | |
| | | | | |
| | | | | |
##### [Table of Contents](#toc)
| | | | | |
| --- | --- | --- | --- | --- |
| | | | | |
| | | | | |
| | | | | |
| | | | | |
##### [Table of Contents](#toc)
| | | | | | | | | | | | | |
| | | | | | | | | | | | | |
| | | | | | | | | | | | | |
| | | | | | | | | | | | | |
| | | | | | | | | | | | | |
| | | | | | | | | | | | | |
##### [Table of Contents](#toc)
| | | | | | | | | | | | | |
| Unrealized (losses) gains on available-for-sale securities, net of income taxes | | | — | | | | — | | | | (1 | ) |
| Gains on marketable securities included in net income, net of income taxes of $—, $— and ($2) | | | — | | | | — | | | | (3 | ) |
| | | | | | | | | | | | | |
| | | | | | | | | | | | | |
##### [Table of Contents](#toc)
| | | | | | | | | |
| | | | | | | | | |
| | | | | | | | | |
| | | | | | | | | |
| | | | | | | | | |
| | | | | | | | | |
| | | | | | | | | |
An excerpt. Shown here: 40 of 112 rewritten, all 30 added and 40 of 387 removed. The counts are complete. For every sentence, read Item 16. Form 10-K Summary in the FY2017 filing and the FY2016 filing.