 filings.tools
Item 5. MARKET FOR REGISTRANT’S COMMON EQUITY, RELATED STOCKHOLDER MATTERS AND ISSUER PURCHASES OF EQUITY SECURITIES
9K characters. Original on sec.gov · Markdown
Item 5. MARKET FOR REGISTRANT’S COMMON EQUITY, RELATED STOCKHOLDER MATTERS AND ISSUER PURCHASES OF EQUITY SECURITIES
COMMON STOCK
Our common stock is traded on The Nasdaq Global Select Market under the symbol “ISRG.”
As of January 15, 2021, there were 159 stockholders of record of our common stock, although we believe that there are a significantly larger number of beneficial owners of our common stock.
DIVIDENDS
We have never declared or paid any cash dividends on our common stock. We intend to retain earnings for use in the operation and expansion of our business.
SECURITIES AUTHORIZED FOR ISSUANCE UNDER EQUITY COMPENSATION PLANS
The following table contains information as of December 31, 2020, for two categories of equity compensation plans.
| Plan Category | Number of securities to be issued upon exercise of outstanding options, warrants and rights (a) | Weighted- average exercise price of outstanding options (2) | Number of securities remaining available for future issuance under equity compensation plans (excluding securities reflected in column (a)) | ||||||||||||||
| Equity compensation plans approved by security holders | 4,104,159 | $ | 315.57 | 9,139,869 | |||||||||||||
| Equity compensation plans not approved by security holders (1) | 371,711 | $ | 189.00 | — | |||||||||||||
| Total | 4,475,870 | $ | 305.07 | 9,139,869 |
(1)Represents options under the Amended and Restated 2009 Employment Commencement Incentive Plan, adopted by the Board in October 2009 and first used in 2010. Options are granted at an exercise price not less than the fair market value of the stock on the date of grant and have a term not to exceed ten years. This plan expired in October 2019 and, therefore, there are no shares reserved for future issuance. However, awards granted prior to the plan's expiration continue to remain outstanding until their original expiration date.
(2)The weighted-average exercise price is calculated based solely on the exercise prices of the outstanding options and does not reflect the shares that will be issued upon the vesting of outstanding awards of RSUs, which have no exercise price.
Material Features of the Amended and Restated 2009 Employment Commencement Incentive Plan
In October 2009, the Board adopted our Amended and Restated 2009 Employment Commencement Incentive Plan, or the 2009 Plan, pursuant to Rule 5653(c)(4) of the Nasdaq Global Market, which was subsequently amended by the Board in February 2011, July 2011, February 2012, July 2012, January 2013, May 2013, December 2013, and April 2015.
Awards granted under the 2009 Plan were intended to constitute “employment inducement awards” under Nasdaq Listing Rule 5635(c)(4) and, therefore, the 2009 Plan was intended to be exempt from the Nasdaq Listing Rules regarding stockholder approval of stock option and stock purchase plans. A total of 4,365,000 shares of our common stock were reserved for issuance under the 2009 Plan. The 2009 Plan provided for the grant of non-qualified stock options, restricted stock units, restricted stock awards, dividend equivalents, or stock appreciation rights. These awards may have been granted to individuals who were then new employees, or were commencing employment with us or one of our subsidiaries following a bona fide period of non-employment with us, and for whom such awards were granted as a material inducement to commencing employment with us or one of our subsidiaries. This plan expired in October 2019 and, therefore, there are no shares reserved for future issuance. However, awards granted prior to the plan's expiration continue to remain outstanding until their original expiration date.
The 2009 Plan is administered by the Compensation Committee or another committee of the Board. The plan administrator has broad discretion to take action under the 2009 Plan, as well as make adjustments to the terms and conditions of existing awards, in the event of certain transactions and events affecting our common stock, including a change in control, stock dividends, stock splits, mergers, acquisitions, consolidations, and other corporate transactions. In addition, in the event of certain non-reciprocal transactions with our stockholders known as “equity restructurings,” the plan administrator will make equitable adjustments to the 2009 Plan and outstanding awards.
The Board may amend, suspend, or terminate the 2009 Plan at any time, provided that no such action may impair any rights under any outstanding awards without the consent of the participant.
RECENT SALES OF UNREGISTERED SECURITIES
None.
ISSUER PURCHASES OF EQUITY SECURITIES
The table below summarizes our stock repurchase activity for the quarter ended December 31, 2020.
| Fiscal Period | Total Number of Shares Repurchased | Average Price Paid Per Share | Total Number of Shares Purchased As Part of a Publicly Announced Program | Approximate Dollar Amount of Shares That May Yet be Purchased Under the Program (1) | |||||||||||||||||||
| October 1 to October 31, 2020 | — | $ | — | — | $ | 1.6 | billion | ||||||||||||||||
| November 1 to November 30, 2020 | 51,914 | $ | 661.07 | 51,914 | $ | 1.6 | billion | ||||||||||||||||
| December 1 to December 31, 2020 | — | $ | — | — | $ | 1.6 | billion | ||||||||||||||||
| Total during quarter ended December 31, 2020 | 51,914 | $ | 661.07 | 51,914 |
(1) Since March 2009, we have had an active stock repurchase program. As of December 31, 2020, our Board of Directors (the “Board”) had authorized an aggregate amount of up to $7.5 billion for stock repurchases, of which the most recent authorization occurred in January 2019, when the Board increased the authorized amount available under our share repurchase program to $2.0 billion. The remaining $1.6 billion represents the amount available to repurchase shares under the authorized repurchase program as of December 31, 2020. The authorized stock repurchase program does not have an expiration date.
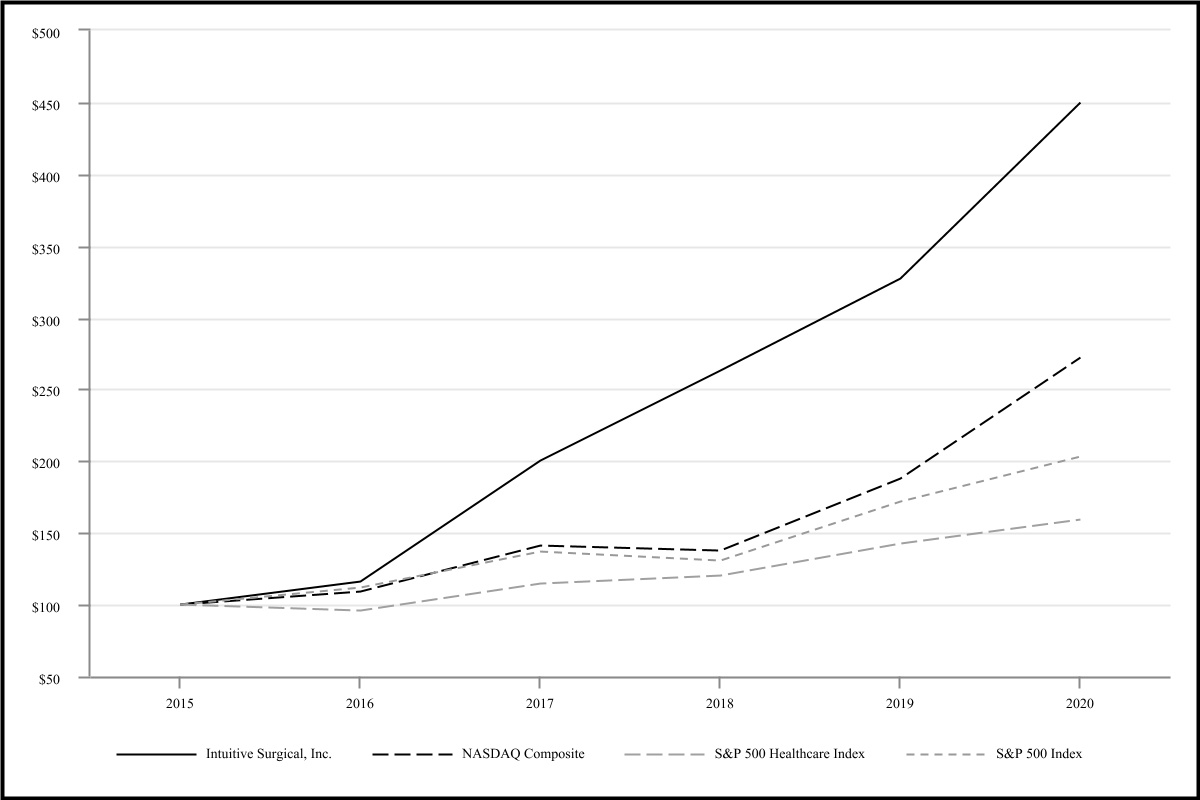
STOCK PERFORMANCE GRAPH
The graph set forth below compares the cumulative total stockholder return on our common stock between December 31, 2015, and December 31, 2020, with the cumulative total return of (i) the Nasdaq Composite Index, (ii) the S&P 500 Healthcare Index, and (iii) the S&P 500 Index over the same period. This graph assumes an investment of $100.00 on December 31, 2015 in our common stock, the Nasdaq Composite Index, the S&P Healthcare Index, and the S&P 500 Index and assumes the re-investment of dividends, if any.
The comparisons shown in the graph below are based upon historical data. We caution that the stock price performance shown in the graph below is not necessarily indicative of, nor is it intended to forecast, the potential future performance of our common stock.
| COMPARISON OF CUMULATIVE TOTAL RETURN AMONG INTUITIVE, NASDAQ COMPOSITE, S&P HEALTHCARE INDEX, AND S&P 500 INDEX |
| December 31, | |||||||||||||||||||||||||||||||||||
| 2015 | 2016 | 2017 | 2018 | 2019 | 2020 | ||||||||||||||||||||||||||||||
| Intuitive Surgical, Inc. | $ | 100.00 | $ | 116.11 | $ | 200.46 | $ | 263.07 | $ | 326.91 | $ | 449.37 | |||||||||||||||||||||||
| Nasdaq Composite | $ | 100.00 | $ | 108.87 | $ | 141.13 | $ | 137.12 | $ | 187.44 | $ | 271.64 | |||||||||||||||||||||||
| S&P 500 Healthcare Index | $ | 100.00 | $ | 95.64 | $ | 114.77 | $ | 120.16 | $ | 142.60 | $ | 158.90 | |||||||||||||||||||||||
| S&P 500 Index | $ | 100.00 | $ | 111.96 | $ | 136.40 | $ | 130.42 | $ | 171.49 | $ | 203.04 |
Previous: Item 4. MINE SAFETY DISCLOSURES · Next: Item 6. SELECTED FINANCIAL DATA