 filings.tools
Item 5. MARKET FOR REGISTRANT'S COMMON EQUITY, RELATED STOCKHOLDER MATTERS AND ISSUER PURCHASES OF EQUITY SECURITIES
9K characters. Original on sec.gov · Markdown
Item 5. MARKET FOR REGISTRANT'S COMMON EQUITY, RELATED STOCKHOLDER MATTERS AND ISSUER PURCHASES OF EQUITY SECURITIES
Market Information
Jacobs’ common stock is listed on the NYSE and trades under the symbol JEC. Beginning on December 10, 2019 Jacobs' common stock will trade on the NYSE under the symbol J. We provided to the NYSE, without qualification, the required annual certification of our Chief Executive Officer regarding compliance with the NYSE’s corporate governance listing standards. The following table sets forth the low and high sales prices of a share of our common stock during each of the fiscal quarters presented, based on the NYSE Composite Price History:
| Low Sales Price | High Sales Price | |||||||
| Fiscal 2019: | ||||||||
| First quarter | $ | 55.24 | $ | 80.92 | ||||
| Second quarter | $ | 57.30 | $ | 75.19 | ||||
| Third quarter | $ | 73.87 | $ | 84.39 | ||||
| Fourth quarter | $ | 79.67 | $ | 93.55 | ||||
| Fiscal 2018: | ||||||||
| First quarter | $ | 57.21 | $ | 69.35 | ||||
| Second quarter | $ | 55.42 | $ | 72.18 | ||||
| Third quarter | $ | 55.21 | $ | 66.72 | ||||
| Fourth quarter | $ | 62.79 | $ | 77.91 |
Shareholders
According to the records of our transfer agent, there were 3,437 shareholders of record as of November 11, 2019.
Share Repurchases
On July 23, 2015, the Board of Directors approved a program to repurchase up to $500.0 million of the Company’s common stock, to expire on July 31, 2018. On July 19, 2018, the Company's Board of Directors authorized the continuation of this share repurchase program for an additional three years, to expire on July 31, 2021. As of September 27, 2019, no authorized amounts remain outstanding under this program. The following table summarizes the activity under this program during fiscal 2019:
| Amount Authorized | Average Price Per Share (1) | Shares Repurchased | Total Shares Retired | ||
| $500,000,000 | $61.74 | 4,005,007 | 4,005,007 |
| (1) | Includes commissions paid and calculated at the average price per share. |
On January 17, 2019, the Company’s Board of Directors authorized an additional share repurchase program of up to $1.0 billion of the Company’s common stock, to expire on January 16, 2022. On February 19, 2019, the Company launched accelerated share repurchase programs by advancing $250 million to two financial institutions in privately negotiated transactions (collectively, the "First 2019 ASR Program"). The specific number of shares that the Company repurchased under the First 2019 ASR Program was determined based generally on a discount to the volume-weighted average price per share of the Company's common stock during a calculation period completed on June 5, 2019. The purchase was recorded as a share retirement for purposes of calculating earnings per share.
On August 21, 2019, the Company launched a second accelerated share repurchase program by advancing $250 million to a financial institution in a privately negotiated transaction (the "Second 2019 ASR Program"). The specific number of shares that the Company ultimately will repurchase under the Second 2019 ASR Program will be determined based generally on a discount to the volume-weighted average price per share of the Company's common
Page 40
stock during a calculation period to be completed no later than December 2019. The purchase will be recorded as a share retirement for purposes of calculating earnings per share.
Subsequent to the launch of the First 2019 ASR Program, the Second 2019 ASR Program and other share repurchases, the Company has $393.7 million remaining under its $1.0 billion share repurchase authorization. The following table summarizes the activity under this program during fiscal 2019:
| Amount Authorized | Average Price Per Share (1) | Shares Repurchased | Total Shares Retired | ||
| $1,000,000,000 | $86.43 | 7,014,633 | 7,014,633 |
| (1) | Includes commissions paid and calculated at the average price per share since the repurchase program authorization date. |
Share repurchases may be executed through various means including, without limitation, accelerated share repurchases, open market transactions, privately negotiated transactions, purchases pursuant to a Rule 10b5-1 plan or otherwise. The share repurchase program does not obligate the Company to purchase any shares. The authorization for the share repurchase program may be terminated, increased or decreased by the Company’s Board of Directors in its discretion at any time. The timing and amount of share repurchases may depend upon market conditions and economic circumstances, availability of investment opportunities, the availability and costs of financing, currency fluctuations, the market price of the Company's common stock, other uses of capital and other factors.
Dividends
On September 19, 2019, the Company’s Board of Directors declared a quarterly dividend of $0.17 per share of the Company’s common stock which was paid on November 1, 2019, to shareholders of record on the close of business on October 4, 2019. Future dividend declarations are subject to review and approval by the Company’s Board of Directors. Dividends paid through September 27, 2019 and the preceding fiscal year are as follows:
| Declaration Date | Record Date | Payment Date | Cash Amount (per share) | |||
| July 11, 2019 | July 26, 2019 | August 23, 2019 | $0.17 | |||
| May 2, 2019 | May 17, 2019 | June 14, 2019 | $0.17 | |||
| January 17, 2019 | February 15, 2019 | March 15, 2019 | $0.17 | |||
| September 11, 2018 | September 28, 2018 | October 26, 2018 | $0.15 | |||
| July 19, 2018 | August 3, 2018 | August 31, 2018 | $0.15 | |||
| May 3, 2018 | May 18, 2018 | June 15, 2018 | $0.15 | |||
| January 18, 2018 | February 16, 2018 | March 16, 2018 | $0.15 | |||
| September 27, 2017 | October 13, 2017 | November 10, 2017 | $0.15 |
Unregistered Sales of Equity Securities.
None.
Performance Graph
The following graph and table shows the changes over the five-year period ended September 27, 2019 in the value of $100 as of the close of market on September 30, 2014 in (1) the common stock of Jacobs Engineering Group Inc., (2) the Standard & Poor’s 500 Stock Index, (3) the Dow Jones US Heavy Construction Group Index (the "Dow Construction Index") and (4) the Standard & Poor's 1500 IT Consulting & Other Services Index.
In the Company's Annual Report on Form 10-K for the fiscal year ended September 27, 2018, the Company utilized the Dow Construction Index as the third index for the performance graph included in that Annual Report. As a result of the divestiture of the Company’s ECR business and the Company’s strategic shift toward being a more technology focused solutions company, the Company believes that comparisons to the Standard & Poor's 1500 IT Consulting & Other Services Index are more representative of the performance of the Company’s core business than comparisons to the Dow Construction Index. As required by SEC regulations, the performance graph below also includes the Dow Construction Index, but this index will not be included in future filings.
Page 41
The values of each investment are based on share price appreciation, with reinvestment of all dividends, provided any were paid. The investments are assumed to have occurred at the beginning of the period presented. The stock performance included in this graph is not necessarily indicative of future stock price performance.
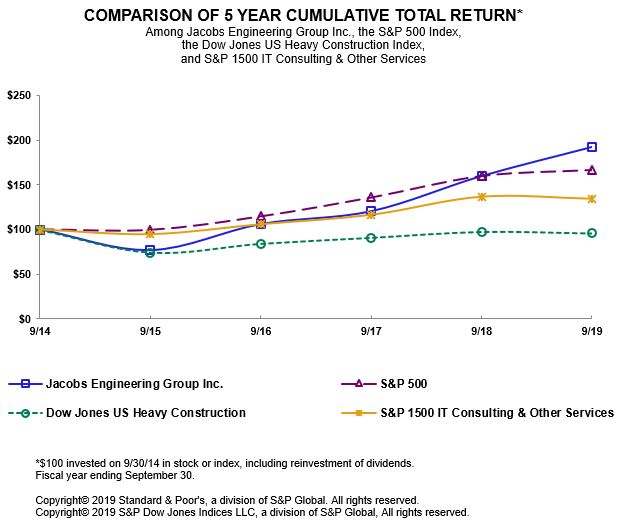
| 2014 | 2015 | 2016 | 2017 | 2018 | 2019 | ||||||||||||
| Jacobs Engineering Group Inc. | 100.00 | 76.67 | 105.94 | 120.35 | 159.82 | 192.44 | |||||||||||
| S&P 500 | 100.00 | 99.39 | 114.72 | 136.07 | 160.44 | 167.27 | |||||||||||
| Dow Jones US Heavy Construction | 100.00 | 74.27 | 84.25 | 91.06 | 97.75 | 96.03 | |||||||||||
| S&P 1500 IT Consulting & Other Services | 100.00 | 94.66 | 105.86 | 116.50 | 136.93 | 134.60 |
Previous: Item 4. MINE SAFETY DISCLOSURE · Next: Item 6. SELECTED FINANCIAL DATA