 filings.tools
J.B. Hunt Transport Services (JBHT) 10-K risk factor changes: FY2021 vs FY2020
The 2021-12-31 10-K against the 2020-12-31 one, compared heading by heading and sentence by sentence.
Item 1A17 rewritten4 added2 removed86 unchanged
All filing items595 rewritten226 added269 removed948 unchanged
Summary
counted, not written
- Item 1A lists 17 risk factor headings: 0 new, 1 reworded and 16 unchanged since FY2020. 0 headings from FY2020 no longer appear.
- Sentence by sentence, 226 added, 269 removed, 595 rewritten and 948 unchanged across 22 items that differ.
- New this year: Item 9C. Disclosure Regarding Foreign Jurisdictions That Prevent Inspections 27.
New Item 1A headings (0)
No risk factor heading in this filing is absent from FY2020.
Removed Item 1A headings (0)
Every FY2020 risk factor heading is still here, word for word or reworded.
Reworded Item 1A headings (1)
- We rely significantly on our information technology systems, a disruption, failure or security breach of which [added: or an inability to keep pace with technological advances] could have a material adverse effect on our business.
A heading is new when no FY2020 heading matches it after ignoring case and punctuation, and reworded when it shares at least 60 percent of its words with one that went away. All current risk factor headings.
Sentences by item
22 items, with every count and a link to each item that changed
Underlined words on a shaded ground are new in FY2021; struck-through words were in FY2020. Sentences that are wholly new or wholly gone are labelled rather than marked.
Item 1A. RISK FACTORS
17 rewritten, 4 added, 2 removed, 86 unchanged
[removed: Our business is] [added: Our business is] significantly impacted by economic conditions, customer business cycles and seasonal [removed: factors.][added: factors.]
The effects of [added: the] COVID-19 [added: pandemic] have and may continue to disrupt or restrict the freight shipping activities of some of our customers, on which our business is dependent.
Furthermore, the continuation [added: or resumption] of COVID-19 related social and economic disruptions may lead to other events which could negatively impact our operations including service limitations of our third-party purchased transportation providers, reduced availability of drivers and other key employees, disruptions in the procurement of revenue equipment, restrictions at U.S. ports of call, excess capacity or rate reductions within the intermodal or trucking industries, inability of suppliers to continue activities, or volatile financial credit markets.
The extent to which the COVID-19 outbreak [added: and any future resurgences] will impact general economic and business conditions is highly uncertain and unpredictable; however, any of these factors could have a significant adverse effect on our financial condition and results of operations.
Our operations [removed: are subject] [added: are subject] to various environmental laws and [removed: regulations, including] [added: regulations, including] legislative and regulatory responses to climate change.
Compliance with environmental requirements could result in significant expenditures [removed: and the] [added: and the] violation [removed: of these regulations could] [added: of these regulations could] result in substantial fines or penalties.
As of December 31, [removed: 2020,] [added: 2021,] we had no derivative financial instruments to reduce our exposure to fuel-price fluctuations.
[removed: Insurance] [added: Insurance] and claims expenses could significantly reduce our earnings.
We have policies in place for [removed: 2021] [added: 2022] with substantially the same terms as our [removed: 2020] [added: 2021] policies for personal injury, property damage, workers’ compensation, and cargo loss or damage.
[removed: _Risk__s] [added: _Risks] Related to Our Business_
For the calendar year ended December 31, [removed: 2020,] [added: 2021,] our top 10 customers, based on revenue, accounted for approximately [removed: 37%] [added: 39%] of our revenue.
One customer accounted for approximately [removed: 10%] [added: 12%] of our total revenue for the year ended December 31, [removed: 2020.][added: 2021.]
While our DCS [removed: segment business] [added: and FMS segments] may involve long-term written contracts, those contracts may contain cancellation clauses, and there is no assurance that our current customers will continue to utilize our services or continue at the same levels.
We may be subject to litigation [removed: claims that] [added: claims that] could result in significant [removed: expenditures.][added: expenditures.]
We rely [removed: significantly on] [added: significantly on] our [removed: information technology systems, a disruption,] [added: information technology systems, a disruption,] failure or security breach [removed: of which could] [added: of which or an inability to keep pace with technological advances could] have a material adverse effect on our business.
We have also invested significantly in the development of our Marketplace for J.B. Hunt [removed: 360°] [added: 360] online freight matching platform, through which we are generating an increasing amount of revenue.
Acquisitions or business [removed: combinations may] [added: combinations may] disrupt or have a material adverse effect on our operations or earnings.
_Risks Related to Our Industry_
ITEM 1B.
UNRESOLVED STAFF COMMENTS
None.
_Risk__s R__elated to Our Industry_
This virus has spread throughout multiple countries, including the United States, and in March 2020, the World Health Organization designated COVID-19 as a pandemic.
Item 7. MANAGEMENT’S DISCUSSION AND ANALYSIS OF FINANCIAL CONDITION AND RESULTS OF OPERATIONS
118 rewritten, 34 added, 56 removed, 180 unchanged
Please [removed: see “Forward-looking Statements” and “Risk Factors” for] [added: see_ “_Forward-looking Statements_” _and_ “_Risk Factors_” _for] a discussion of items, uncertainties, assumptions and risks associated with these statements._
[removed: Workers’ Compensation] [added: Workers’ Compensation] and Accident Costs
For [removed: 2018,] [added: 2019 through 2021,] we were self-insured for $500,000 per occurrence for personal injury and property damage and [removed: self-insured] [added: fully insured] for [removed: $100,000 per] workers’ compensation [removed: claim.][added: claims for nearly all states.]
We have policies in place for [removed: 2021] [added: 2022] with substantially the same terms as our [removed: 2020] [added: 2021] policies for personal injury, property damage, workers’ compensation, and cargo loss or damage.
Accordingly, we use an actuarial method to develop current claim information to derive an estimate of our ultimate [added: personal injury and property damage] claim liability.
This process involves the use of [added: expected loss rates,] loss-development factors based on our historical claims [removed: experience] [added: experience,] and [removed: includes a] contractual premium adjustment [removed: factor,] [added: factors,] if applicable.
At December 31, [removed: 2020,] [added: 2021,] we had an accrual of approximately [removed: $257] [added: $287] million for estimated claims.
At December 31, [removed: 2020,] [added: 2021,] we have recorded [removed: $304] [added: $311] million of expected reimbursement for covered excess claims, other insurance deposits, and prepaid insurance premiums.
We have not identified any impairment to our assets at December 31, [removed: 2020.][added: 2021.]
| | | [removed: 2020] [added: 2021] | | | | [removed: 2019] [added: 2020] | | | | [removed: 2018] [added: 2019] | | | | [removed: 2020] [added: 2021] vs. [removed: 2019] [added: 2020] | | | | [removed: 2019] [added: 2020] vs. [removed: 2018] [added: 2019] | | |
| Operating revenues | | | 100.0 | % | | | 100.0 | % | | | 100.0 | % | | | [removed: 5.1] [added: 26.3] | % | | | [removed: 6.4] [added: 5.1] | % |
| Rents and purchased transportation | | | [removed: 51.4] [added: 53.0] | | | | [removed: 49.4] [added: 51.4] | | | | [removed: 51.5] [added: 49.4] | | | | [removed: 9.4] [added: 30.2] | | | | [removed: 2.1] [added: 9.4] | |
| Salaries, wages and employee benefits | | | [removed: 24.4] [added: 22.7] | | | | [removed: 23.7] [added: 24.4] | | | | [removed: 22.4] [added: 23.7] | | | | [removed: 8.3] [added: 17.6] | | | | [removed: 12.5] [added: 8.3] | |
| Depreciation and amortization | | | [removed: 5.5] [added: 4.6] | | | | [removed: 5.4] [added: 5.5] | | | | [removed: 5.1] [added: 5.4] | | | | [removed: 5.7] [added: 5.6] | | | | [removed: 14.5] [added: 5.7] | |
| Fuel and fuel taxes | | | [removed: 3.7] [added: 4.4] | | | | [removed: 5.1] [added: 3.7] | | | | [removed: 5.3] [added: 5.1] | | | | [removed: (22.8] [added: 48.4] | [removed: )] | | | [removed: 0.9] [added: (22.8] | [added: )] |
| Operating supplies and expenses | | | [removed: 3.5] [added: 3.0] | | | | [removed: 3.6] [added: 3.5] | | | | [removed: 3.5] [added: 3.6] | | | | [removed: 0.4] [added: 10.5] | | | | [removed: 9.7] [added: 0.4] | |
| General and administrative expenses, net of asset dispositions | | | [removed: 1.8] [added: 1.5] | | | | [removed: 2.1] [added: 1.8] | | | | [removed: 1.8] [added: 2.1] | | | | [removed: (6.2] [added: 8.6] | [removed: )] | | | [removed: 17.6] [added: (6.2] | [added: )] |
| Insurance and claims | | | 1.4 | | | | [removed: 1.7] [added: 1.4] | | | | [removed: 1.5] [added: 1.7] | | | | [removed: (14.5] [added: 22.7] | [removed: )] | | | [removed: 21.5] [added: (14.5] | [added: )] |
| Operating taxes and licenses | | | [removed: 0.6] [added: 0.5] | | | | 0.6 | | | | 0.6 | | | | [removed: (1.8] [added: 9.4] | [removed: )] | | | [removed: 8.3] [added: (1.8] | [added: )] |
| Communication and utilities | | | 0.3 | | | | [removed: 0.4] [added: 0.3] | | | | 0.4 | | | | [removed: (3.7] [added: 4.0] | [removed: )] | | | [removed: 12.6] [added: (3.7] | [added: )] |
| Total operating expenses | | | [removed: 92.6] [added: 91.4] | | | | [removed: 92.0] [added: 92.6] | | | | [removed: 92.1] [added: 92.0] | | | | [removed: 5.8] [added: 24.6] | | | | [removed: 6.3] [added: 5.8] | |
| Operating income | | | [removed: 7.4] [added: 8.6] | | | | [removed: 8.0] [added: 7.4] | | | | [removed: 7.9] [added: 8.0] | | | | [removed: (2.8] [added: 46.6] | [removed: )] | | | [removed: 7.8] [added: (2.8] | [added: )] |
| Net interest expense | | | [removed: 0.5] [added: 0.4] | | | | [removed: 0.6] [added: 0.5] | | | | [removed: 0.5] [added: 0.6] | | | | [removed: (11.0] [added: (2.8] | ) | | | [removed: 31.7] [added: (11.0] | [added: )] |
| Earnings before income taxes | | | [removed: 6.9] [added: 8.2] | | | | [removed: 7.4] [added: 6.9] | | | | 7.4 | | | | [removed: (2.2] [added: 50.1] | [removed: )] | | | [removed: 6.3] [added: (2.2] | [added: )] |
| Income taxes | | | [removed: 1.6] [added: 1.9] | | | | [removed: 1.8] [added: 1.6] | | | | [removed: 1.7] [added: 1.8] | | | | [removed: (2.8] [added: 49.4] | [removed: )] | | | [removed: 8.8] [added: (2.8] | [added: )] |
| Net earnings | | | [removed: 5.3] [added: 6.3] | % | | | [removed: 5.6] [added: 5.3] | % | | | [removed: 5.7] [added: 5.6] | % | | | [removed: (2.0] [added: 50.3] | [removed: )%] [added: %] | | | [removed: 5.5] [added: (2.0] | [removed: %] [added: )%] |
[removed: 2020 Compared] [added: 2021 Compared] With [removed: 2019][added: 2020]
General and administrative expenses decreased 6.2% from 2019, primarily due to decreased professional fees, lower advertising costs, lower driver hiring expenses and, decreased net loss from the sale or disposal of assets, partially offset by increased technology spend on the J.B. Hunt [removed: 360°] [added: 360] platform and legacy system upgrades, higher bad debt expenses, and increased building rental expenses.
We operated five business segments during calendar year [removed: 2020.][added: 2021.]
| | | [removed: 2020] [added: 2021] | | | | [removed: 2019] [added: 2020] | | | | [removed: 2018] [added: 2019] | | |
| JBI | | $ | [removed: 4,675] [added: 5,454] | | | $ | [removed: 4,745] [added: 4,675] | | | $ | [removed: 4,717] [added: 4,745] | |
| DCS | | | [removed: 2,196] [added: 2,578] | | | | [removed: 2,128] [added: 2,196] | | | | [removed: 1,788] [added: 2,128] | |
| ICS | | | [removed: 1,658] [added: 2,538] | | | | [removed: 1,348] [added: 1,658] | | | | [removed: 1,335] [added: 1,348] | |
| FMS | | | [removed: 689] [added: 842] | | | | [removed: 567] [added: 689] | | | | [removed: 375] [added: 567] | |
| JBT | | | [removed: 463] [added: 796] | | | | [removed: 389] [added: 463] | | | | [removed: 417] [added: 389] | |
| Total segment revenues | | | [removed: 9,681] [added: 12,208] | | | | [removed: 9,177] [added: 9,681] | | | | [removed: 8,632] [added: 9,177] | |
| Intersegment eliminations | | | [removed: (44] [added: (40] | ) | | | [removed: (12] [added: (44] | ) | | | [removed: (17] [added: (12] | ) |
| Total | | $ | [removed: 9,637] [added: 12,168] | | | $ | [removed: 9,165] [added: 9,637] | | | $ | [removed: 8,615] [added: 9,165] | |
| JBI | | $ | [removed: 428] [added: 603] | | | $ | [removed: 447] [added: 428] | | | $ | [removed: 401] [added: 447] | |
| DCS | | | [removed: 314] [added: 304] | | | | [removed: 278] [added: 314] | | | | [removed: 195] [added: 278] | |
Our total consolidated operating revenues increased 26.3% to $12.17 billion in 2021, compared to $9.64 billion in 2020.
This increase was primarily due to increased ICS and JBT revenue, higher JBI revenue per load, increased average revenue producing trucks and fleet productivity within DCS, and increased FMS stops and revenue per stop.
Fuel surcharge revenues increased 65.5% to $1.25 billion in 2021, compared to $757 million in 2020.
Rents and purchased transportation costs increased 30.2% in 2021, primarily due to increased third-party rail and truck purchased transportation rates in JBI and ICS, increased ICS load volume, and an increase in the use of third-party truck carriers by JBT and FMS during 2021.
Depreciation and amortization expense increased 5.6% in 2021, primarily due to equipment purchases related to new DCS long-term customer contracts, the addition of trailing equipment and scheduled turnover of tractors within JBI, higher trailer counts in JBT, and increased capital investments in information technology.
Operating supplies and expenses increased 10.5% in 2021 compared with 2020, driven primarily by higher equipment maintenance costs, increased tire expense, increased tolls expense, higher travel and entertainment expense, and higher weather-related towing costs, partially offset by reduced operating supplies and building maintenance costs in response to COVID-19 compared to 2020.
General and administrative expenses increased 8.6% from 2020, primarily due to higher advertising costs, increased technology spend, and increased driver hiring expenses, partially offset by a $5.7 million benefit from the reduction of a contingent liability in the FMS segment.
Insurance and claims expense increased 22.7% in 2021, primarily due to higher incident volume and severity and increased insurance policy premium expenses, partially offset by a $3.2 million benefit from the net settlement of claims within the FMS segment.
Income tax expense increased 49.4% in 2021, due primarily to increased taxable earnings in 2021.
| | | 2021 | | | | 2020 | | | | 2019 | | |
| | | 2021 | | | | 2020 | | | | 2019 | | |
| --- | --- |
| --- | --- |
Benefits from increased revenue per load were partially offset by network inefficiencies caused by continued rail and customer fluidity challenges, higher rail and third-party dray purchased transportation expense, higher driver wages and recruiting costs, increased non-driver salary, wages, and incentive compensation, and higher equipment costs when compared to 2020.
DCS segment revenue increased 17% to $2.58 billion in 2021, from $2.20 billion in 2020.
The increase in productivity was primarily a result of contracted indexed-based price escalators and less unassigned idle equipment, partially offset by expected lower productivity within start-up accounts and an increase in open assigned trucks due to the tighter supply of qualified drivers and COVID-related labor disruptions.
Higher revenues during the current year were more than offset by increases in driver wage and recruiting costs, increased non-driver salary, wages, and incentive compensation, increased casualty insurance and claims costs, higher group medical benefits, and additional costs related to the implementation of new, long-term customer contracts.
Overall volumes increased 5%, with truckload volumes increasing 13% when compared to 2020.
The increase in operating income was primarily due to increased revenue and higher gross profit margins, partially offset by higher personnel incentive compensation, and increased technology costs.
Gross profit margin increased to 11.8% in the current year versus 9.9% last year.
FMS revenue increased 22% to $842 million in 2021 from $689 million in 2020, primarily due to the addition of multiple customer contracts implemented during the current year and 2020 including temporary suspension of operations at several customer sites as a result of the COVID-19 pandemic.
The increase in productivity was primarily due to a shift in the mix of business between asset and asset-light operations and the implementation of higher rates.
The increase in operating income was primarily due to increased revenues, a $5.7 million benefit from the reduction of a contingent liability, and a $3.2 million benefit from the net settlement of claims.
These items were partially offset by higher implementation costs related to new long-term contractual business, higher third-party contract carrier costs, lower volumes with certain customers related to product availability because of supply chain disruptions, and higher personnel salary, wages, and incentive compensation.
JBT segment revenue increased 72% to $796 million in 2021, from $463 million in 2020.
Excluding fuel surcharges, revenue for 2021 increased 70% compared to 2020, primarily due to a 10% increase in load volume and a 55% increase in revenue excluding fuel surcharge revenue per load compared to 2020.
The 2021 growth in load count was primarily due to the continued expansion of J.B. Hunt 360box which leverages the J.B. Hunt 360 platform to access drop trailer capacity for customers across our transportation network.
At the end of 2021, JBT operated 2,235 tractors and 11,172 trailers compared to 1,769 and 8,567 at the end of 2020.
The increase in operating income was driven primarily by increased load counts and revenue per load during 2021, which were partially offset by increases in purchased transportation expense, higher costs to attract and retain drivers, higher non-driver salary, wages, and incentive compensation, and additional costs from further investments in the trailer network and technology related to the continued expansion of J.B. Hunt 360box.
ICS’s carrier base increased 19%.
We paid a $0.26 per share quarterly dividend in 2019, a $0.27 per share quarterly dividend in 2020, a $0.28 per share quarterly dividend in the first quarter of 2021, and a $0.30 per share quarterly dividend in the last three quarters of 2021.
However, we do anticipate that the current challenges related to timely delivery of ordered equipment will continue due to supply chain challenges impacting production.
For our senior notes maturing in 2022, it is our intent to pay the entire outstanding balances in full, on or before the maturity dates, using our existing cash balance, senior revolving line of credit or other sources of long-term financing.
In addition, we do not anticipate the future international transitioning from LIBOR to alternative rates to have a material impact on our financial statements.
For 2019 and 2020, we were self-insured for $500,000 per occurrence for personal injury and property damage and fully insured for workers’ compensation claims for nearly all states.
| --- | --- | --- | --- | --- | --- | --- | --- | --- | --- | --- | --- | --- | --- | --- | --- | --- | --- | --- | --- | --- |
ICS’s carrier base increased 19%, and the employee count decreased 17% when compared to 2019.
Our total consolidated operating revenues increased 6.4% to $9.17 billion in 2019, compared to $8.61 billion in 2018, primarily due to increased revenue in DCS related to an increase in revenue producing trucks, higher truck productivity, defined as revenue per truck per week, and an acquisition in the first quarter 2019.
The increase in revenue was further attributable to increased load volumes in ICS and higher revenue per load in JBI, partially offset by a decrease in JBI load volumes and a reduction in rates per loaded mile and the number of operating tractors in JBT.
Fuel surcharge revenues decreased 1.4% to $1.04 billion in 2019, compared to $1.06 billion in 2018.
Rents and purchased transportation costs increased 2.1% in 2019, primarily due to increased rail and truck purchased transportation rates within JBI and ICS segments and JBI rail purchased transportation costs, including a $26.8 million charge in 2019, resulting from the issuance of an award regarding our arbitration with BNSF.
The current year increase in rents and purchased transportation costs was partially offset by a $152.3 million BNSF arbitration related charge recorded by JBI in 2018.
Depreciation and amortization expense increased 14.5% in 2019, primarily due to equipment purchased related to new DCS long-term customer contracts.
Operating supplies and expenses increased 9.7%, driven primarily by higher equipment maintenance and tire expenses due to increased equipment counts, increased toll costs, higher travel costs, and higher facility maintenance expenses.
General and administrative expenses increased 17.6% from 2018, primarily due to increased technology spend on the J.B. Hunt 360° platform and legacy system upgrades, higher FMS network facility costs, and increased advertising expenses.
Insurance and claims expense increased 21.5% in 2019, primarily due to 2019 including a $17.4 million reserve charge for arbitration related legal fees, costs and interest claimed by BNSF and the inclusion of a $20.0 million FMS claim charge within DCS, partially offset by 2018 including specific reserve charges for the settlement of lawsuits with current and former drivers.
The increase in 2019 was primarily due to a reduction in discreet tax benefits recognized related to share-based compensation vesting, partially offset by favorable settlements of state income tax audits during 2019.
Average length of haul increased 2% in 2019 when compared to 2018.
Benefits from customer rate increases and freight mix were partially offset by decreased volumes, which includes volume lost to rail rationalization, increased rail purchased transportation costs, higher equipment ownership and maintenance costs, increased technology modernization expenses, lower box turns, higher box repositioning costs and increased driver wages and recruiting costs.
Current year operating income was further impacted by a $26.8 million charge to rail purchase transportation expense resulting from the issuance of an award regarding our arbitration with BNSF and a $17.4 million charge to insurance and claims expense, for arbitration related legal fees, costs and interest claimed by BNSF.
JBI recorded $152.3 million of additional BNSF arbitration related charges in 2018.
Excluding these 2018 charges and the 2019 arbitration related charges of $44.2 million, operating income for 2019, decreased 11% when compared to 2018.
DCS segment revenue increased 19% to $2.13 billion in 2019, from $1.79 billion in 2018.
The increase in productivity was primarily a result of better integration of assets between customer accounts, customer rate increases, and increased customer supply chain fluidity during 2019 compared to 2018.
DCS ended 2019 with a net additional 850 revenue-producing trucks when compared to 2018.
Approximately 69% of these additions represent private fleet conversion.
The increase is primarily due to increased productivity and additional trucks under contract, partially offset by increased driver wages and recruiting costs, higher non-driver personnel costs, and higher equipment ownership costs compared to 2018.
Overall volumes increased 1%.
The decrease in operating income was primarily due to lower gross profit margins, increased expenses to expand capacity and functionality of the Marketplace for J.B. Hunt 360°, higher personnel costs, and increased digital marketing expenses.
Gross profit margin decreased to 13.1% in the current year versus 15.4% last year primarily due to weaker spot market activity and lower contractual rates on committed business compared to 2018.
FMS revenue increased 51% to $567 million in 2019 from $375 million in 2018, primarily due to the business acquisition completed in the first quarter of 2019 and an increase in new customer contracts throughout 2019.
The reduction in productivity was primarily due to a change in the mix of service methods to a more asset-light model resulting from the 2019 business acquisition.
The benefit of increased revenue was more than offset by higher insurance and claims costs, which included a $20 million insurance claim charge in 2019, higher costs from the expanded FMS network and additional non-cash amortization expense of $3.8 million compared to 2018.
JBT segment revenue decreased 7% to $389 million in 2019, from $417 million in 2018.
Excluding fuel surcharges, revenue for 2019 decreased 6% compared to 2018, primarily due to a 1% decrease in rates per loaded mile, a 3% decrease in length of haul and a 2% decrease in load volumes, compared to 2018.
At the end of 2019, JBT operated 1,831 tractors compared to 2,112 at the end of 2018.
The decrease in operating income was driven primarily by lower spot market activity, higher empty miles per load, increased driver wages and recruiting costs, and the reduction in overall load volumes.
In addition, net cash used in financing activities for 2019 included the full retirement of our $250 million of 2.40% senior notes that matured in March 2019, partially offset by our issuance of $700 million of 3.875% senior notes due March 2026.
We paid a $0.24 per share quarterly dividend in 2018, a $0.26 per share quarterly dividend in 2019, and a $0.27 per share quarterly dividend in 2020.
During 2020, we postponed a portion of our equipment purchases in order to increase our available cash in light of the economic disruption and uncertainty resulting from COVID-19.
During the fourth quarter of 2020, we completed a business acquisition.
See Note 12, Acquisition, in the Notes to Consolidated Financial Statements for further discussion.
We used our existing cash to finance this transaction and to provide any necessary liquidity for current and future operations.
Should COVID-19 related economic conditions warrant, we believe we have sufficient credit resources available to meet our near and long-term operating and capital needs.
An excerpt. Shown here: 40 of 118 rewritten, all 34 added and 40 of 56 removed. The counts are complete. For every sentence, read Item 7. MANAGEMENT’S DISCUSSION AND ANALYSIS OF FINANCIAL CONDITION AND RESULTS OF OPERATIONS in the FY2021 filing and the FY2020 filing.
Item 7A. QUANTITATIVE AND QUALITATIVE DISCLOSURES ABOUT MARKET RISK
2 rewritten, 0 added, 0 removed, 15 unchanged
Additionally, foreign currency transaction gains and losses were not material to our results of operations for the year ended December 31, [removed: 2020.][added: 2021.]
As of December 31, [removed: 2020,] [added: 2021,] we had no derivative financial instruments to reduce our exposure to fuel-price fluctuations.
Item 1. BUSINESS
38 rewritten, 9 added, 2 removed, 117 unchanged
These segments include Intermodal (JBI), Dedicated Contract Services® [removed: (DCS),] [added: (DCS®),] Integrated Capacity [removed: Solutions™] [added: Solutions] (ICS), Final Mile Services® (FMS) and Truckload (JBT).
In [removed: March] [added: the first quarter] 2020, we began our COVID-19 response activities which have been expanded and will continue as necessary until the risks related to COVID-19 dissipate.
[removed: Thus far throughout the pandemic, we] [added: We] have been pleased with the continued performance of our employees, particularly our drivers, who have [removed: been consistently available] [added: provided consistent service] to [removed: serve] our [removed: customers.][added: customers throughout the pandemic.]
JBI operates [removed: 98,689] [added: 104,973] pieces of company-owned trailing equipment systemwide.
We own and maintain our own chassis fleet, consisting of [removed: 83,259] [added: 85,649] units.
JBI also manages a fleet of [removed: 5,166] [added: 5,612] company-owned tractors, [removed: 497] [added: 582] independent contractor trucks, and [removed: 6,745] [added: 6,943] company drivers.
At December 31, [removed: 2020,] [added: 2021,] the total JBI employee count was [removed: 7,673.][added: 7,940.]
Revenue for the JBI segment in [removed: 2020] [added: 2021] was [removed: $4.68] [added: $5.45] billion.
At December 31, [removed: 2020,] [added: 2021,] this segment operated [removed: 9,408] [added: 1,272] company-owned trucks, [removed: 498] [added: 272] customer-owned trucks, and [removed: 5] [added: 19] independent contractor trucks.
DCS also operates [removed: 19,573] [added: 21,069] owned pieces of trailing equipment and [removed: 7,717] [added: 7,753] customer-owned trailers.
The DCS segment employed [removed: 12,785] [added: 14,709] people, including [removed: 11,039] [added: 12,632] drivers, at December 31, [removed: 2020.][added: 2021.]
DCS revenue for [removed: 2020] [added: 2021] was [removed: $2.20] [added: $2.58] billion.
ICS provides traditional freight brokerage and transportation logistics solutions to customers through relationships with thousands of third-party carriers and integration with our owned [removed: equipment.][added: equipment within other segments.]
Furthermore, we offer an online multimodal marketplace via J.B. Hunt [removed: 360°] [added: 360] that matches the right load with the right carrier and the best mode.
At December 31, [removed: 2020,] [added: 2021,] the ICS segment employed [removed: 1,011] [added: 975] people, with a carrier base of approximately [removed: 100,200.][added: 136,400.]
ICS revenue for [removed: 2020] [added: 2021] was [removed: $1.66] [added: $2.54] billion.
[removed: FMS Segment][added: FMS Segment]
FMS provides both asset and non-asset big and bulky delivery and installation services, as well as [removed: fulfilment] [added: fulfillment] and retail-pooling distributions services.
At December 31, [removed: 2020,] [added: 2021,] this segment operated [removed: 1,255] [added: 11,139] company-owned trucks, [removed: 265] [added: 544] customer-owned trucks, and [removed: 33] [added: 6] independent contractor trucks.
FMS also operates [removed: 963] [added: 1,036] owned pieces of trailing equipment and [removed: 159] [added: 185] customer-owned trailers.
The FMS segment employed [removed: 2,929] [added: 3,161] people, including [removed: 1,625] [added: 1,697] drivers and [removed: 207] [added: 189] delivery and material assistants, at December 31, [removed: 2020.][added: 2021.]
FMS revenue for [removed: 2020] [added: 2021] was [removed: $689] [added: $842] million.
We use our company-owned tractors and employee drivers or independent contractors [added: or third-party carriers] who agree to transport freight in our trailers.
At December 31, [removed: 2020,] [added: 2021,] the JBT segment operated [removed: 798] [added: 734] company-owned [removed: tractors] [added: tractors, 11,172 company-owned trailers,] and employed [removed: 1,049] [added: 1,139] people, [removed: 797] [added: 733] of whom were drivers.
At December 31, [removed: 2020,] [added: 2021,] we had [removed: 971] [added: 1,501] independent contractors operating in the JBT segment.
JBT revenue for [removed: 2020] [added: 2021] was [removed: $463] [added: $796] million.
In addition to our sales teams, J.B. Hunt [removed: 360°] [added: 360] offers instant access to a wide array of technology-driven solutions for customers and carriers.
Despite operating [removed: nearly 150,000] [added: over 166,000] pieces of transportation equipment, our single greatest asset and one of the factors differentiating us from our competitors is our service-oriented people.
As of December 31, [removed: 2020,] [added: 2021,] we had [removed: 30,309] [added: 33,045] employees, which consisted of [removed: 20,206] [added: 22,005] company drivers, [removed: 8,779] [added: 9,740] office personnel, [removed: 1,114] [added: 1,108] maintenance technicians, and [removed: 210] [added: 192] delivery and material assistants.
We also had arrangements with [removed: 1,506] [added: 2,108] independent contractors to transport freight in our trailing equipment.
We hold strongly to the principle that a qualified, [removed: diverse,] [added: diverse workforce,] and inclusive [removed: workforce] [added: workplace] helps us represent the broad cross-section of ideas, values, and beliefs of our employees, customers, suppliers, and communities.
In addition, the Company’s Employee Resource Groups [removed: (ERG)] [added: (ERGs)] offer opportunities for employee professional development, community engagement, and networking.
Since its inception in 1996, the program has awarded more than [removed: $31] [added: $33] million to over [removed: 3,900] [added: 4,100] drivers.
As of December 31, [removed: 2020,] [added: 2021,] our company-owned tractor and truck fleet consisted of [removed: 16,627] [added: 18,757] units.
In addition, we had [removed: 1,506] [added: 2,108] independent contractors who operate their own tractors but transport freight in our trailing equipment.
We believe operating with relatively newer revenue equipment provides better customer service, attracts quality drivers, [added: improved fuel efficiency] and lowers maintenance expense.
At December 31, [removed: 2020,] [added: 2021,] the average age of our combined tractor fleet was [removed: 2.3] [added: 2.5] years, while our containers averaged [removed: 7.7] [added: 8.2] years of age and our trailers averaged [removed: 6.7] [added: 6.6] years.
[removed: Competition and] [added: Competition and] the Industry
OVERVIEW
During 2021, we committed to providing incremental paid time off for employees to help offset any financial loss caused by their absence from work when receiving the COVID-19 vaccination.
We also continue to work with local healthcare organizations to provide vaccination assistance under applicable area guidelines and procedures to employees and their family members.
We continue to review and analyze both external and internal COVID-related data, including the effects of new variants, on a daily basis.
JBT also offers services though our J.B. Hunt 360box® program which utilizes our J.B. Hunt 360 platform to access capacity and offer efficient drop trailer solutions to our customers.
During 2021, we committed to providing incremental paid time off for employees to help offset any financial loss caused by their absence from work when receiving the COVID-19 vaccination.
On September 9, 2021, President Biden issued an executive order that, in conjunction with guidance issued pursuant to the order, requires all employers with U.S. Government contracts to require their U.S.-based employees, contractors, or subcontractors who work on or in support of certain U.S. Government contracts, to be fully vaccinated for COVID-19 by December 8, 2021, with limited exceptions for medical and religious reasons permitted.
Various states have challenged the mandate in multiple federal district courts resulting in the enforcement of this mandate to be currently enjoined nationwide.
We are awaiting final resolution of this matter, but do not anticipate a negative impact on our operations or productivity.
OVERVIEW
We are reviewing and analyzing both external and internal COVID-related data on a daily basis in anticipation of the full return to work phase of our COVID-19 response.
Item 3. LEGAL PROCEEDINGS
0 rewritten, 1 added, 11 removed, 4 unchanged
See Note 10, Commitments and Contingencies in our Consolidated Financial Statements for disclosures related to legal proceedings.
In January 2017 we exercised our right to utilize the arbitration process to review the division of revenue collected beginning May 1, 2016, as well as to clarify other issues, under our Joint Service Agreement with BNSF.
BNSF requested the same.
In October 2019 the arbitrators issued a Final Award and we recorded pretax charges in the third quarter 2019 of $26.8 million related to certain charges claimed by BNSF and $17.4 million for legal fees, cost and interest claimed by BNSF, for a total of $44.2 million.
On January 17, 2020, we filed under seal in the United States District Court for the Western District of Arkansas (the Arkansas Federal Court) a motion to confirm and enforce the Final Award, seeking the Court’s specific enforcement of certain confidential contractual rights the arbitrators decided in our favor.
BNSF moved to confirm the Final Award in the United States District Court for the District of Columbia, but that requested relief was ultimately denied and dismissed as moot.
During the first quarter 2020, we recorded an $8.2 million pretax charge resulting from an adjusted calculation of the revenue divisions owed to BNSF under the Final Award.
On July 21, 2020, the Arkansas Federal Court granted our motion in part, entering a judgment confirming the arbitration awards.
In a sealed opinion, the Court denied our request for additional enforcement relief but did not foreclose our right to pursue post-confirmation enforcement in court or in arbitration if warranted.
We have filed an appeal with the United States Court of Appeals for the Eighth Circuit seeking review of the Arkansas Federal Court’s denial.
We are involved in certain other claims and pending litigation arising from the normal conduct of business.
Based on present knowledge of the facts and, in certain cases, opinions of outside counsel, we believe the resolution of these claims and pending litigation will not have a material adverse effect on our financial condition, results of operations or liquidity.
Cover and table of contents
18 rewritten, 4 added, 7 removed, 38 unchanged
For [removed: the fiscal year] [added: the fiscal year] ended
December 31, [removed: 2020][added: 2021]
☐ TRANSITION REPORT PURSUANT TO SECTION 13 OR 15(D) OF THE SECURITIES EXCHANGE ACT OF 1934 FOR THE [removed: TRANSITION] [added: TRANSITION] PERIOD FROM _______ TO _______
| | Arkansas | 71-0335111 | | [removed: | |]
| | (State or other jurisdiction of | (I.R.S. Employer | | [removed: | |]
| | incorporation or organization) | Identification No.) | | [removed: | |]
| | 615 J.B. Hunt Corporate Drive | [removed: |] 72745-0130 | | [removed: |]
| | Lowell, Arkansas | (ZIP Code) | | [removed: | |]
| | (Address of principal executive offices) | | | [removed: | |]
Registrant’s telephone number, including area code: [removed: 479\-820-0000][added: 479-820-0000]
| Common [removed: Stock, $0.01] [added: Stock, $0.01] par value | JBHT | NASDAQ |
Indicate by check mark whether the registrant has submitted electronically every Interactive Data File required to be submitted pursuant to Rule 405 of Regulation S-T (§232.405 of this chapter) during the preceding 12 months (or for such shorter period that the registrant was required to submit [added: and post] such files).
The aggregate market value of [removed: 83,657,096] [added: 83,709,217] shares of the registrant’s $0.01 par value common stock held by non-affiliates as of June 30, [removed: 2020,] [added: 2021,] was [removed: $10.1] [added: $13.6] billion (based upon [removed: $120.34] [added: $162.95] per share).
As of February [removed: 16, 2021,] [added: 15, 2022,] the number of outstanding shares of the registrant’s common stock was [removed: 105,705,006.][added: 104,850,002.]
Certain portions of the Notice and Proxy Statement for the Annual Meeting of Stockholders, to be held April [removed: 22, 2021,] [added: 28, 2022,] are incorporated by reference in Part III of this Form 10-K.
For The Fiscal Year Ended December 31, [removed: 2020][added: 2021]
[removed: | | |] Page [removed: |]
Risk Factors [removed: 7][added: 8]
| --- | --- | --- | --- |
| | | |
| | | |
| | | |
| --- | --- | --- | --- | --- | --- |
Item 1B.
Unresolved Staff Comments 11
Item 2.
Properties 12
Item 3.
Legal Proceedings 12
Item 1B. Unresolved Staff Comments 12
0 rewritten, 7 added, 1 removed, 0 unchanged
| | | |
Item 2.
Properties 12
| | | |
Item 3.
Legal Proceedings 12
| | | |
None.
Item 4. Mine Safety Disclosures 12
0 rewritten, 2 added, 12 removed, 5 unchanged
| | | |
| | | |
Item 6.
Selected Financial Data 15
Item 7.
Management’s Discussion and Analysis of Financial Condition and Results of Operations 16
Item 7A.
Quantitative and Qualitative Disclosures About Market Risk 28
Item 8.
Financial Statements and Supplementary Data 28
Item 9.
Changes in and Disagreements with Accountants on Accounting and Financial Disclosure 28
Item 9A.
Controls and Procedures 29
Item 6. [Reserved] 14
0 rewritten, 10 added, 34 removed, 0 unchanged
| | | |
Item 7.
Management’s Discussion and Analysis of Financial Condition and Results of Operations 15
| | | |
Item 7A.
Quantitative and Qualitative Disclosures About Market Risk 25
| | | |
Item 8.
Financial Statements and Supplementary Data 26
| | | |
The following selected financial data should be read in conjunction with the Consolidated Financial Statements and notes thereto, Management’s Discussion and Analysis of Financial Condition and Results of Operations, and other financial data included elsewhere in this annual report.
(Dollars in millions, except per share amounts)
| Earnings data for the years ended December 31, | | 2020 | | | | 2019 | | | | 2018 | | | | 2017 | | | | 2016 | | |
| --- | --- | --- | --- | --- | --- | --- | --- | --- | --- | --- | --- | --- | --- | --- | --- | --- | --- | --- | --- | --- |
| Operating revenues | | $ | 9,637 | | | $ | 9,165 | | | $ | 8,615 | | | $ | 7,190 | | | $ | 6,555 | |
| Operating income | | | 713 | | | | 734 | | | | 681 | | | | 624 | | | | 721 | |
| Net earnings | | | 506 | | | | 516 | | | | 490 | | | | 686 | | | | 432 | |
| Basic earnings per share | | | 4.79 | | | | 4.81 | | | | 4.48 | | | | 6.24 | | | | 3.84 | |
| Diluted earnings per share | | | 4.74 | | | | 4.77 | | | | 4.43 | | | | 6.18 | | | | 3.81 | |
| Cash dividends per share | | | 1.08 | | | | 1.04 | | | | 0.96 | | | | 0.92 | | | | 0.88 | |
| Operating expenses as a percentage of operating revenues: | | | | | | | | | | | | | | | | | | | | |
| Rents and purchased transportation | | | 51.4 | % | | | 49.4 | % | | | 51.5 | % | | | 50.8 | % | | | 49.7 | % |
| Salaries, wages and employee benefits | | | 24.4 | | | | 23.7 | | | | 22.4 | | | | 22.4 | | | | 22.4 | |
| Depreciation and amortization | | | 5.5 | | | | 5.4 | | | | 5.1 | | | | 5.3 | | | | 5.5 | |
| Fuel and fuel taxes | | | 3.7 | | | | 5.1 | | | | 5.3 | | | | 4.8 | | | | 4.3 | |
| Operating supplies and expenses | | | 3.5 | | | | 3.6 | | | | 3.5 | | | | 3.6 | | | | 3.6 | |
| General and administrative expenses, net of asset dispositions | | | 1.8 | | | | 2.1 | | | | 1.8 | | | | 1.8 | | | | 1.3 | |
| Insurance and claims | | | 1.4 | | | | 1.7 | | | | 1.5 | | | | 1.7 | | | | 1.2 | |
| Operating taxes and licenses | | | 0.6 | | | | 0.6 | | | | 0.6 | | | | 0.6 | | | | 0.7 | |
| Communication and utilities | | | 0.3 | | | | 0.4 | | | | 0.4 | | | | 0.3 | | | | 0.3 | |
| Total operating expenses | | | 92.6 | | | | 92.0 | | | | 92.1 | | | | 91.3 | | | | 89.0 | |
| Operating income | | | 7.4 | | | | 8.0 | | | | 7.9 | | | | 8.7 | | | | 11.0 | |
| Net interest expense | | | 0.5 | | | | 0.6 | | | | 0.5 | | | | 0.4 | | | | 0.4 | |
| Earnings before income taxes | | | 6.9 | | | | 7.4 | | | | 7.4 | | | | 8.3 | | | | 10.6 | |
| Income taxes | | | 1.6 | | | | 1.8 | | | | 1.7 | | | | (1.2 | ) | | | 4.0 | |
| Net earnings | | | 5.3 | % | | | 5.6 | % | | | 5.7 | % | | | 9.5 | % | | | 6.6 | % |
| Balance sheet data as of December 31, | | 2020 | | | | 2019 | | | | 2018 | | | | 2017 | | | | 2016 | | |
| Working capital ratio | | | 1.70 | | | | 1.43 | | | | 1.11 | | | | 1.45 | | | | 1.65 | |
| Total assets (millions) | | $ | 5,928 | | | $ | 5,471 | | | $ | 5,092 | | | $ | 4,465 | | | $ | 3,951 | |
| Stockholders’ equity (millions) | | $ | 2,600 | | | $ | 2,267 | | | $ | 2,101 | | | $ | 1,839 | | | $ | 1,414 | |
| Current portion of long-term debt (millions) | | | \- | | | | \- | | | $ | 251 | | | | \- | | | | \- | |
| Total debt (millions) | | $ | 1,305 | | | $ | 1,296 | | | $ | 1,149 | | | $ | 1,086 | | | $ | 986 | |
| Total debt to equity | | | 0.50 | | | | 0.57 | | | | 0.55 | | | | 0.59 | | | | 0.70 | |
| Total debt as a percentage of total capital | | | 33 | % | | | 36 | % | | | 35 | % | | | 37 | % | | | 41 | % |
Item 9. Changes in and Disagreements with Accountants on Accounting and Financial Disclosure 26
0 rewritten, 4 added, 1 removed, 0 unchanged
| | | |
Item 9A.
Controls and Procedures 26
| | | |
None.
Item 9B. Other Information 27
0 rewritten, 0 added, 26 removed, 1 unchanged
| | | |
| PART III | | |
Item 10.
Directors, Executive Officers and Corporate Governance 29
Item 11.
Executive Compensation 29
Item 12.
Security Ownership of Certain Beneficial Owners and Management and Related Stockholder Matters 30
Item 13.
Certain Relationships and Related Transactions, and Director Independence 30
Item 14.
Principal Accounting Fees and Services 30
| PART IV | | |
Item 15.
Exhibits, Financial Statement Schedules 31
| Signatures | | 34 |
FORWARD-LOOKING STATEMENTS
_This report, including documents whic__h are incorporated by reference_ _and other documents which we file periodically with the Securities and Exchange Commission (SEC), contains statements that may be considered to be “forward-looking statements.” Such statements relate to our predictions concerning future events or operations and are within the meaning of Section 27A of the Securities Act_ _of 1933, as amended,_ _and Section 21E of the Securities Exchange Act of 1934, as amended._ _When we use words like “may,” “plan,” “contemplate,” “anticipate,” “believe,” “intend,” “continue,” “expect,” “project,”_ _“goals,” “strategy,” “future,”_ _“predict,”_ _“seek,”_ _“estimate,”_ _“likely,”_ _“could,” “should,” “would,” and similar expressions, you should consider them as identifying forward-looking statements, although we may use other phrasing._ _Forward-looking statements are inherently uncertain, subject to risks, and should be viewed with caution.
These statements are based on our belief or interpretation of information currently available.
Stockholders and prospective investors are cautioned that actual results and future events may differ materially from the__se_ _forward-looking statements as a result of many factors.
Some of the factors and events that are not within our control and that could have a material impact on future operating results include_ _the following:_ _general economic and business conditions__;_ _potential business or operational disruptions resulting from the ongoing effects of the novel coronavirus (COVID-19) pandemic, including any future spikes or outbreaks of the virus, as well as government actions_ _taken_ _in response to the pandemic__;_ _competition and competitive rate fluctuations__;_ _excess capacity in the intermodal or trucking industries;_ _a loss of one or more major customers__;_ _cost and availability of diesel fuel__;_ _interference with or termination of our relationships with certain railroads__;_ _rail service delays__; disruptions to U.S. port-of-call activity;_ _ability to attract and retain qualified drivers__,_ _delivery personnel__, independent contractors, and third-party carriers;_ _retention of key employees__;_ _insurance costs and availability__;_ _litigation and_ _claims expense__; determination that independent contractors are employees;_ _new or different environmental or other laws and regulations__; volatile financial credit markets or interest rates;_ _terrorist attacks or actions__;_ _acts of war__;_ _adverse weather conditions__;_ _disruption or failure of information systems__;_ _operational disruption or adverse effects of business acquisitions;_ _increased costs for new revenue equipment__; increased tariffs assessed on or disruptions in the procurement of imported revenue equipment;_ _decreases in the value of used equipment__;_ _and the ability of revenue equipment manufacturers to perform in accordance with agreements for guaranteed equipment trade-in values__._
_You should understand that many important factors, in addition to those listed above, could impact us financially.
Our operating results may fluctuate as a result of these and other risk factors or events as described in our filings with the SEC.
Some important factors that could cause our actual results to differ from estimates or projections contained in the forward-looking statements are described under “Risk Factors” in Item_ _1__A__.
We assume no obligation to update any forward-looking statement to the extent we become aware that it will not be achieved for any reason._
PART I
Item 9C. Disclosure Regarding Foreign Jurisdictions That Prevent Inspections 27
0 rewritten, 38 added, 0 removed, 0 unchanged
New section this year
| | | |
| | | |
| PART III | | |
| | | |
Item 10.
Directors, Executive Officers and Corporate Governance 27
| | | |
Item 11.
Executive Compensation 27
| | | |
Item 12.
Security Ownership of Certain Beneficial Owners and Management and Related Stockholder Matters 27
| | | |
Item 13.
Certain Relationships and Related Transactions, and Director Independence 28
| | | |
Item 14.
Principal Accounting Fees and Services 28
| | | |
| | | |
| PART IV | | |
| | | |
Item 15.
Exhibits, Financial Statement Schedules 28
| | | |
| Signatures | | 31 |
FORWARD-LOOKING STATEMENTS
_This report, including documents which are incorporated by reference and other documents which we file periodically with the Securities and Exchange Commission (SEC), contains statements that may be considered to be_ “_forward-looking statements._” _Such statements relate to our predictions concerning future events or operations and are within the meaning of Section 27A of the Securities Act of 1933, as amended, and Section 21E of the Securities Exchange Act of 1934, as amended.
When we use words like_ “_may,_” “_plan,_” “_contemplate,_” “_anticipate,_” “_believe,_” “_intend,_” “_continue,_” “_expect,_” “_project,_” “_goals,_” “_strategy,_” “_future,_” “_predict,_” “_seek,_” “_estimate,_” “_likely,_” “_could,_” “_should,_” “_would,_” _and similar expressions, you should consider them as identifying forward-looking statements, although we may use other phrasing.
Forward-looking statements are inherently uncertain, subject to risks, and should be viewed with caution.
These statements are based on our belief or interpretation of information currently available.
Stockholders and prospective investors are cautioned that actual results and future events may differ materially from these forward-looking statements as a result of many factors.
Some of the factors and events that are not within our control and that could have a material impact on future operating results include the following: general economic and business conditions; potential business or operational disruptions resulting from the ongoing effects of the novel coronavirus (COVID-19) pandemic, including any future spikes or outbreaks of the virus, as well as government actions taken in response to the pandemic; competition and competitive rate fluctuations; excess capacity in the intermodal or trucking industries; a loss of one or more major customers; cost and availability of diesel fuel; interference with or termination of our relationships with certain railroads; rail service delays; disruptions to U.S. port-of-call activity; ability to attract and retain qualified drivers, delivery personnel, independent contractors, and third-party carriers; retention of key employees; insurance costs and availability; litigation and claims expense; determination that independent contractors are employees; new or different environmental or other laws and regulations; volatile financial credit markets or interest rates; terrorist attacks or actions; acts of war; adverse weather conditions; disruption or failure of information systems; inability to keep pace with_ _technological advances affecting our information technology platforms;_ _operational disruption or adverse effects of business acquisitions; increased costs for new revenue equipment; increased tariffs assessed on or disruptions in the procurement of imported revenue equipment; decreases in the value of used equipment; and the ability of revenue equipment manufacturers to perform in accordance with agreements for guaranteed equipment trade-in values._
_You should understand that many important factors, in addition to those listed above, could impact us financially.
Our operating results may fluctuate as a result of these and other risk factors or events as described in our filings with the SEC.
Some important factors that could cause our actual results to differ from estimates or projections contained in the forward-looking statements are described under_ “_Risk Factors_” _in Item 1A.
We assume no obligation to update any forward-looking statement to the extent we become aware that it will not be achieved for any reason._
PART I
Item 2. PROPERTIES
5 rewritten, 0 added, 0 removed, 10 unchanged
In addition, we have [removed: 120] [added: 118] leased or owned facilities in our FMS cross-dock and other delivery system [removed: networks, with the remaining three locations outsourced,] [added: networks] and multiple leased or owned remote sales offices or branches in our ICS segment.
| Maintenance and support facilities | | | [removed: 499] [added: 533] | | | | [removed: 1,078,000] [added: 1,132,000] | | | | [removed: 188,000] [added: 198,000] | |
| Cross-dock and delivery system facilities | | | [removed: 20] [added: 33] | | | | [removed: 3,528,000] [added: 3,555,000] | | | | [removed: 130,00] [added: 137,000] | |
| Branch sales offices | | | \- | | | | \- | | | | [removed: 52,000] [added: 50,000] | |
| Other facilities, offices, and parking yards | | | [removed: 409] [added: 503] | | | | [removed: 117,000] [added: 418,000] | | | | [removed: 262,000] [added: 304,000] | |
Item 5. MARKET FOR REGISTRANT’S COMMON EQUITY, RELATED STOCKHOLDER MATTERS AND ISSUER PURCHASES OF EQUITY SECURITIES
9 rewritten, 9 added, 7 removed, 14 unchanged
Our common stock is traded on the NASDAQ Global Select Market (NASDAQ) under the symbol “JBHT.” At December 31, [removed: 2020,] [added: 2021,] we were authorized to issue up to 1 billion shares of our common stock, and 167.1 million shares were issued.
We had [removed: 105.7] [added: 105.1] million and [removed: 106.2] [added: 105.7] million shares outstanding as of December 31, [removed: 2020] [added: 2021] and [removed: 2019] [added: 2020] respectively.
On February [removed: 16, 2021,] [added: 15, 2022,] we had [removed: 988] [added: 971] stockholders of record of our common stock.
On January [removed: 21, 2021,] [added: 20, 2022,] we announced an increase in our quarterly cash dividend from [removed: $0.27] [added: $0.30] to [removed: $0.28] [added: $0.40] per share, which was paid February [removed: 19, 2021,] [added: 18, 2022,] to stockholders of record on February [removed: 5, 2021.][added: 4, 2022.]
The following table summarizes purchases of our common stock during the three months ended December 31, [removed: 2020:][added: 2021:]
| | (1) | On [removed: April 20, 2017, our Board of Directors authorized the purchase of up to $500 million of our common stock. On] January 22, 2020, our Board of Directors authorized [removed: an additional] [added: the] purchase of up to $500 million of our common stock. This stock repurchase program has no expiration date. |
The peer group consists of [removed: 14] [added: 13] companies: C.H. Robinson Worldwide Inc., CSX Corporation, Expeditors International of Washington Inc., Hub Group Inc., [removed: Kansas City Southern,] Knight-Swift Transportation Holdings Inc., Norfolk Southern Corporation, Old Dominion Freight Line Inc., Republic Services Inc., Ryder System Inc., Schneider National Inc., Stericycle Inc., Waste Management Inc., and XPO Logistics Inc. The graph assumes the value of the investment in our common stock, in the index, and in the peer group (including reinvestment of dividends) was $100 on December 31, [removed: 2015] [added: 2016] and tracks it through December 31, [removed: 2020.][added: 2021.]
[removed: ][added: 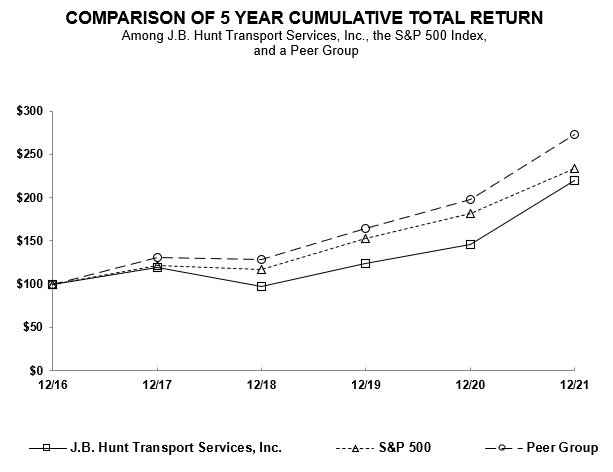]
| | | [removed: 2015 | | | |] 2016 | | | | 2017 | | | | 2018 | | | | 2019 | | | | 2020 | | | [added: | 2021 | | |]
| October 1 through October 31, 2021 | | | \- | | | $ | \- | | | | \- | | | $ | 366 | |
| November 1 through November 30, 2021 | | | 75,509 | | | | 196.05 | | | | 75,509 | | | | 351 | |
| December 1 through December 31, 2021 | | | \- | | | | \- | | | | \- | | | | 351 | |
| Total | | | 75,509 | | | $ | 196.05 | | | | 75,509 | | | $ | 351 | |
| J.B. Hunt Transport Services, Inc. | | $ | 100.00 | | | $ | 119.60 | | | $ | 97.58 | | | $ | 123.69 | | | $ | 146.09 | | | $ | 220.05 | |
| S&P 500 | | | 100.00 | | | | 121.83 | | | | 116.49 | | | | 153.17 | | | | 181.35 | | | | 233.41 | |
| Peer Group | | | 100.00 | | | | 130.56 | | | | 128.21 | | | | 164.52 | | | | 197.27 | | | | 272.79 | |
ITEM 6.
\[Reserved\]
| October 1 through October 31, 2020 | | | 143,912 | | | $ | 120.59 | | | | 143,912 | | | $ | 503 | |
| November 1 through November 30, 2020 | | | \- | | | | \- | | | | \- | | | | 503 | |
| December 1 through December 31, 2020 | | | \- | | | | \- | | | | \- | | | | 503 | |
| Total | | | 143,912 | | | $ | 120.59 | | | | 143,912 | | | $ | 503 | |
| J.B. Hunt Transport Services, Inc. | | $ | 100.00 | | | $ | 133.79 | | | $ | 160.01 | | | $ | 130.55 | | | $ | 165.49 | | | $ | 195.45 | |
| S&P 500 | | | 100.00 | | | | 111.96 | | | | 136.40 | | | | 130.42 | | | | 171.49 | | | | 203.04 | |
| Peer Group | | | 100.00 | | | | 128.31 | | | | 172.63 | | | | 171.77 | | | | 220.44 | | | | 269.20 | |
Item 8. FINANCIAL STATEMENTS AND SUPPLEMENTARY DATA
5 rewritten, 4 added, 0 removed, 2 unchanged
Reports of Independent Registered Public Accounting [removed: Firm][added: Firms]
Consolidated Balance Sheets as of December 31, [removed: 2020] [added: 2021] and [removed: 2019][added: 2020]
Consolidated Statements of Earnings for years ended December 31, [added: 2021,] 2020, [removed: 2019,] and [removed: 2018][added: 2019]
Consolidated Statements of Stockholders’ Equity for years ended December 31, [added: 2021,] 2020, [removed: 2019,] and [removed: 2018][added: 2019]
Consolidated Statements of Cash Flows for years ended December 31, [added: 2021,] 2020, [removed: 2019,] and [removed: 2018][added: 2019]
Management’s Report on Internal Control Over Financial Reporting
ITEM 9.
CHANGES IN AND DISAGREEMENTS WITH ACCOUNTANTS ON ACCOUNTING AND FINANCIAL DISCLOSURE
None.
Item 9A. CONTROLS AND PROCEDURES
6 rewritten, 4 added, 6 removed, 8 unchanged
We maintain controls and procedures designed to ensure that the information we are required to disclose in the reports we file [removed: with] [added: or submit under] the [removed: SEC] [added: Securities Exchange Act of 1934] is recorded, processed, summarized and reported, within the time periods specified in the [removed: SEC rules,] [added: Commission's rules] and [added: forms, and] that such information is accumulated and communicated to our management, including our Chief Executive Officer and Chief Financial Officer, as appropriate, to allow timely decisions regarding required disclosure.
Based upon that evaluation, our Chief Executive Officer and Chief Financial Officer concluded that our disclosure controls and procedures were effective as of December 31, [removed: 2020.][added: 2021.]
[removed: Management’s] [added: Management’s] Report on Internal Control Over Financial Reporting
The effectiveness of internal control over financial reporting as of December 31, [removed: 2020,] [added: 2021,] has been audited by [removed: Ernst & Young] [added: PricewaterhouseCoopers] LLP, an independent registered public accounting firm that also audited our Consolidated Financial Statements.
[removed: Ernst & Young] [added: PricewaterhouseCoopers] LLP’s report on internal control over financial reporting is included herein (following Item 15).
There has been no change in our internal control over financial reporting during the fourth quarter ended December 31, [removed: 2020,] [added: 2021,] that has materially affected, or is reasonably likely to materially affect, our internal control over financial reporting.
Management’s Report on Internal Control Over Financial Reporting is included herein (following Item 15) and is incorporated by reference herein.
ITEM 9C.
DISCLOSURE REGARDING FOREIGN JURISDICTIONS THAT PREVENT INSPECTIONS
None.
Our management is responsible for establishing and maintaining effective internal control over financial reporting as defined in Rules 13a-15(f) under the Securities Exchange Act of 1934.
Our internal control over financial reporting is designed to provide reasonable assurance to our management and Board of Directors regarding the preparation and fair presentation of published financial statements.
Because of its inherent limitation, internal control over financial reporting may not prevent or detect misstatements.
Therefore, even those systems determined to be effective can provide only reasonable assurance with respect to financial statement preparation and presentation.
Management assessed the effectiveness of our internal control over financial reporting as of December 31, 2020.
In making this assessment, management used the criteria set forth by the Committee of Sponsoring Organizations of the Treadway Commission (COSO) in _Internal Control – Integrated_ _Framework (2013_ _Framework)__._ Based on our assessment, we believe that as of December 31, 2020, our internal control over financial reporting is effective based on those criteria.
Item 10. DIRECTORS, EXECUTIVE OFFICERS AND CORPORATE GOVERNANCE
1 rewritten, 0 added, 0 removed, 0 unchanged
The information required for Item 10 is hereby incorporated by reference from the Notice and Proxy Statement for the Annual Meeting of Stockholders to be held April [removed: 22, 2021.][added: 28, 2022.]
Item 11. EXECUTIVE COMPENSATION
1 rewritten, 0 added, 0 removed, 0 unchanged
The information required for Item 11 is hereby incorporated by reference from the Notice and Proxy Statement for the Annual Meeting of Stockholders to be held April [removed: 22, 2021.][added: 28, 2022.]
Item 12. SECURITY OWNERSHIP OF CERTAIN BENEFICIAL OWNERS AND MANAGEMENT AND RELATED STOCKHOLDER MATTERS
4 rewritten, 0 added, 0 removed, 7 unchanged
Except as set forth below, the information required for Item 12 is hereby incorporated by reference from the Notice and Proxy Statement for the Annual Meeting of Stockholders to be held April [removed: 22, 2021.][added: 28, 2022.]
[removed: Securities] [added: Securities] Authorized For Issuance Under Equity Compensation Plans
The following table summarizes, as of December 31, [removed: 2020,] [added: 2021,] information about compensation plans under which equity securities of the Company are authorized for issuance.
| Equity compensation plans approved by security holders | | | [removed: 1,679,071] [added: 1,664,242] | | | $ | [removed: \-] [added: \-(2)] | [removed: (2)] | | | [removed: 5,120,327] [added: 4,648,867] | |
Item 13. CERTAIN RELATIONSHIPS AND RELATED TRANSACTIONS, AND DIRECTOR INDEPENDENCE
1 rewritten, 0 added, 0 removed, 0 unchanged
The information required for Item 13 is hereby incorporated by reference from the Notice and Proxy Statement for the Annual Meeting of Stockholders to be held April [removed: 22, 2021.][added: 28, 2022.]
Item 14. PRINCIPAL ACCOUNTING FEES AND SERVICES
1 rewritten, 0 added, 0 removed, 1 unchanged
The information required for Item 14 is hereby incorporated by reference from the Notice and Proxy Statement for the Annual Meeting of Stockholders to be held April [removed: 22, 2021.][added: 28, 2022.]
Item 15. EXHIBITS, FINANCIAL STATEMENT SCHEDULES
369 rewritten, 96 added, 104 removed, 460 unchanged
| December 31, 2019 | | [added: $] | 23.9 | | | [added: $] | 2.8 | | | [added: $] | (13.4 | ) | | [added: $] | 13.3 | |
[removed: | |] The above schedule reports allowances related to trade accounts receivable and other receivables. [removed: |]
[removed: | |] All other schedules have been omitted either because they are not applicable or because the required information is included in our Consolidated Financial Statements or the notes thereto. [removed: |]
| [removed: Exhibit] Number | | Description |
| 3.2 | | [removed: [Amended] [added: [Second Amended] and Restated Bylaws of J.B. Hunt Transport Services, Inc. dated [removed: April 23, 2015] [added: October 21, 2021] (incorporated by reference from Exhibit 3.1 of the Company’s current report on Form 8-K, filed [removed: April] [added: October] 27, [removed: 2015)](http://www.sec.gov/Archives/edgar/data/728535/000143774915008111/ex3-1.htm)] [added: 2021)](http://www.sec.gov/Archives/edgar/data/728535/000143774921024359/ex_296473.htm)] |
| 4.1 | | [Description of Capital Stock of J.B. Hunt Transport Services, [removed: Inc.](https://www.sec.gov/Archives/edgar/data/728535/000143774921003667/ex_226653.htm)] [added: Inc.](https://www.sec.gov/Archives/edgar/data/728535/000143774922004457/ex_338296.htm)] |
| [removed: 4.5] [added: 4.6] | | [First Supplemental Indenture, dated as of March 1, 2019 (incorporated by reference from Exhibit 4.2 of the Company’s current report on Form 8-K, filed March 1, 2019)](http://www.sec.gov/Archives/edgar/data/728535/000143774919003755/ex_136213.htm) |
| 10.3 | | [Summary of Compensation Arrangements with Named Executive Officers for [removed: 2020] [added: 2021] (incorporated by reference from Exhibit 99.1 of the Company’s current report on Form [removed: 8-K/A,] [added: 8-K,] filed [removed: February 3, 2020)](http://www.sec.gov/Archives/edgar/data/728535/000143774920001559/ex_171160.htm)] [added: January 25, 2021)](http://www.sec.gov/Archives/edgar/data/728535/000143774921001198/ex_222086.htm)] |
| 10.4 | | [Summary of Compensation Arrangements with Named Executive Officers for [removed: 2021] [added: 2022] (incorporated by reference from Exhibit 99.1 of the Company’s current report on Form 8-K, filed January [removed: 25, 2021)](http://www.sec.gov/Archives/edgar/data/728535/000143774920001300/ex_170585.htm)] [added: 24, 2022)](http://www.sec.gov/Archives/edgar/data/728535/000143774922001506/ex_327282.htm)] |
| [removed: 10.5*] [added: 10.5] | | [removed: [Executive Retirement] [added: [Credit] Agreement [removed: with David G. Mee, dated February 6, 2020] [added: and related documents] (incorporated by reference from Exhibit 10.1 of the Company’s current report on Form 8-K, filed [removed: February 10, 2020)](http://www.sec.gov/Archives/edgar/data/728535/000143774920002187/ex_171755.htm)] [added: September 28, 2018)](http://www.sec.gov/Archives/edgar/data/728535/000143774918017588/ex_124627.htm)] |
| [removed: 10.6*] [added: 10.6] | | [removed: [Executive Retirement Agreement with Terrance D. Matthews,] [added: [First Amendment to Credit Agreement,] dated [removed: February 6, 2020] [added: as of March 1, 2019] (incorporated by reference from Exhibit 10.2 of the Company’s current report on Form 8-K, filed [removed: February 10, 2020)](http://www.sec.gov/Archives/edgar/data/728535/000143774920002187/ex_171757.htm)] [added: March 1, 2019)](http://www.sec.gov/Archives/edgar/data/728535/000143774919003755/ex_136049.htm)] |
| [removed: 10.7] [added: 16.1] | | [removed: [Credit Agreement and related documents] [added: [Letter of Ernst & Young LLP, dated June 28, 2021] (incorporated by reference from Exhibit [removed: 10.1] [added: 16.1] of the Company’s current report on Form 8-K, filed [removed: September] [added: June] 28, [removed: 2018)](http://www.sec.gov/Archives/edgar/data/728535/000143774918017588/ex_124627.htm)] [added: 2021)](http://www.sec.gov/Archives/edgar/data/728535/000143774921015782/ex_259944.htm)] |
| 21.1 | | [Subsidiaries of J.B. Hunt Transport Services, [removed: Inc.](https://www.sec.gov/Archives/edgar/data/728535/000143774921003667/ex_226654.htm)] [added: Inc.](https://www.sec.gov/Archives/edgar/data/728535/000143774922004457/ex_338297.htm)] |
| 22.1 | | [List of Guarantor Subsidiaries of J.B. Hunt Transport Services, [removed: Inc.](https://www.sec.gov/Archives/edgar/data/728535/000143774921003667/ex_226655.htm)] [added: Inc.](https://www.sec.gov/Archives/edgar/data/728535/000143774922004457/ex_338298.htm)] |
| 23.1 | | [Consent of [removed: Ernst & Young LLP](https://www.sec.gov/Archives/edgar/data/728535/000143774921003667/ex_226656.htm)] [added: PricewaterhouseCoopers LLP](https://www.sec.gov/Archives/edgar/data/728535/000143774922004457/ex_338299.htm)] |
| 31.1 | | [Rule 13a-14(a)/15d-14(a) [removed: Certification](https://www.sec.gov/Archives/edgar/data/728535/000143774921003667/ex_226657.htm)] [added: Certification](https://www.sec.gov/Archives/edgar/data/728535/000143774922004457/ex_338300.htm)] |
| 31.2 | | [Rule 13a-14(a)/15d-14(a) [removed: Certification](https://www.sec.gov/Archives/edgar/data/728535/000143774921003667/ex_226658.htm)] [added: Certification](https://www.sec.gov/Archives/edgar/data/728535/000143774922004457/ex_338301.htm)] |
| 32.1 | | [Section 1350 [removed: Certification](https://www.sec.gov/Archives/edgar/data/728535/000143774921003667/ex_226659.htm)] [added: Certification](https://www.sec.gov/Archives/edgar/data/728535/000143774922004457/ex_338302.htm)] |
| 104 | | Cover Page Interactive Data File [removed: (embedded within the] [added: (Formatted as] Inline XBRL [removed: Document)] [added: and contained in Exhibit 101)] |
Pursuant to the requirements of Sections 13 or 15(d) of the Securities Exchange Act of 1934, the registrant has duly caused this report to be signed on its behalf by the undersigned thereunto duly authorized, in the City of Lowell, Arkansas, on the [removed: 22nd] [added: 25th] day of February [removed: 2021.][added: 2022.]
Pursuant to the requirements of the Securities Exchange Act of 1934, this report has been signed below by the following persons on the [removed: 22nd] [added: 25th] day of February [removed: 2021,] [added: 2022,] on behalf of the registrant and in the capacities indicated.
| | [removed: /s/ Kirk Thompson] [added: *] | | Chairman of the Board of Directors |
| | [removed: /s/ James L. Robo] [added: *] | | Member of the Board of Directors |
| | James L. Robo | | [removed: (Lead] [added: (Independent Lead] Director) |
| | [removed: /s/ Douglas G. Duncan] [added: *] | | Member of the Board of Directors |
| | [removed: /s/ Francesca M. Edwardson] [added: *] | | Member of the Board of Directors |
| | [removed: /s/ Wayne Garrison] [added: *] | | Member of the Board of Directors |
| | [removed: /s/ Sharilyn S. Gasaway] [added: *] | | Member of the Board of Directors |
| | [removed: /s/ Gary C. George] [added: *] | | Member of the Board of Directors |
| | [removed: /s/ J. Bryan Hunt, Jr.] [added: *] | | Member of the Board of Directors |
| | [removed: /s/ Gale V. King] [added: *] | | Member of the Board of Directors |
| Management’s Report on Internal Control Over Financial Reporting | [removed: 36] [added: 33] |
| Report of Independent Registered Public Accounting Firm [removed: on Consolidated Financial Statements] [added: (PCAOB ID Number 238)] | [removed: 37] [added: 34] |
[removed: | Report of Independent Registered Public Accounting Firm on Internal Control Over Financial Reporting | 39 |][added: MANAGEMENT’S REPORT ON INTERNAL CONTROL OVER FINANCIAL REPORTING]
| Consolidated Balance Sheets as of December 31, [removed: 2020] [added: 2021] and [removed: 2019] [added: 2020] | [removed: 40] [added: 37] |
| Consolidated Statements of Earnings for years ended December 31, [added: 2021,] 2020, [removed: 2019,] and [removed: 2018] [added: 2019] | [removed: 41] [added: 38] |
| Consolidated Statements of Stockholders’ Equity for years ended December 31, [added: 2021,] 2020, [removed: 2019,] and [removed: 2018] [added: 2019] | [removed: 42] [added: 39] |
| Consolidated Statements of Cash Flows for years ended December 31, [added: 2021,] 2020, [removed: 2019,] and [removed: 2018] [added: 2019] | [removed: 43] [added: 40] |
| Notes to Consolidated Financial Statements | [removed: 44] [added: 41] |
[removed: Management’s Report] [added: PricewaterhouseCoopers LLP’s report] on [removed: Internal Control Over Financial Reporting][added: internal control over financial reporting is included herein.]
| December 31, 2021 | | | 18.4 | | | | 2.6 | | | | (4.2 | ) | | | 16.8 | |
| Exhibit | | |
| 23.2 | | [Consent of Ernest & Young LLP](https://www.sec.gov/Archives/edgar/data/728535/000143774922004457/ex_340011.htm) |
| 24.1 | | [Powers of Attorney of Members of J.B. Hunt Transport Services, Inc. Board of Directors](https://www.sec.gov/Archives/edgar/data/728535/000143774922004457/ex_339658.htm) |
| | | |
| | | |
| | John B. Hill, III | | |
| | | | |
| | * | | Member of the Board of Directors |
| | | | |
| *By: | /s/ John N. Roberts, III | | |
| | John N. Roberts, III | | |
| | As Attorney-In-Fact Pursuant to Powers of Attorney filed herewith | | |
| Report of Prior Independent Registered Public Accounting Firm (PCAOB ID Number 42) | 36 |
Our internal control over financial reporting is designed by, or under the supervision of, our Chief Executive Officer and Chief Financial Officer, or persons performing similar functions, and effected by the Company’s Board of Directors, management and other personnel to provide reasonable assurance regarding the reliability of financial reporting and the preparation of financial statements for external purposes in accordance with generally accepted accounting principles.
| --- | --- | --- | --- |
We have audited the accompanying consolidated balance sheet of J.B. Hunt Transport Services, Inc. and its subsidiaries (the “Company”) as of December 31, 2021 and the related consolidated statements of earnings, of stockholders' equity and of cash flows for the year ended December 31, 2021, including the related notes and schedule of valuation and qualifying accounts for the year ended December 31, 2021 appearing under Item 15(A)(2) (collectively referred to as the “consolidated financial statements”).
In our opinion, the consolidated financial statements referred to above present fairly, in all material respects, the financial position of the Company as of December 31, 2021, and the results of its operations and its cash flows for the year ended December 31, 2021 in conformity with accounting principles generally accepted in the United States of America.
Our audit of the consolidated financial statements included performing procedures to assess the risks of material misstatement of the consolidated financial statements, whether due to error or fraud, and performing procedures that respond to those risks.
Such procedures included examining, on a test basis, evidence regarding the amounts and disclosures in the consolidated financial statements.
Our audit also included evaluating the accounting principles used and significant estimates made by management, as well as evaluating the overall presentation of the consolidated financial statements.
Our audit also included performing such other procedures as we considered necessary in the circumstances.
Also, projections of any evaluation of effectiveness to future periods are subject to the risk that controls may become inadequate because of changes in conditions, or that the degree of compliance with the policies or procedures may deteriorate.
_Personal injury and property damage claims accrual_
As described in Note 2 to the consolidated financial statements, the Company is substantially self-insured for loss of and damage to owned and leased revenue equipment.
As of December 31, 2021, the Company’s claims accrual balance for self-insured claims was $287 million, of which a significant portion of claims related to personal injury and property damage.
The Company recognizes a liability at the time of the incident based on an analysis of the nature and severity of the claims and analyses provided by third-party claims administrators, as well as legal, economic, and regulatory factors.
Management uses an actuarial method to develop current claim information to derive an estimate of the ultimate personal injury and property damage claim liability, which involves the use of expected loss rates and loss-development factors based on historical claims experience.
The principal considerations for our determination that performing procedures relating to the personal injury and property damage claims accrual is a critical audit matter are (i) the significant judgment by management when developing the claims accrual estimate; (ii) a high degree of auditor judgment, subjectivity and effort in performing procedures and evaluating management's significant assumptions related to the expected loss rates and loss-development factors based on historical claims experience and (iii) the audit effort involved the use of professionals with specialized skill and knowledge.
Addressing the matter involved performing procedures and evaluating audit evidence in connection with forming our overall opinion on the consolidated financial statements.
These procedures included testing the effectiveness of controls relating to management’s personal injury and property damage claims accrual process, including controls over the development of expected loss rates and loss-development factors based on historical claims experience.
These procedures also included, among others, (i) testing management’s process for developing the claims accrual estimate; (ii) evaluating the appropriateness of the actuarial method; (iii) testing the completeness and accuracy of underlying data used in the personal injury and property damage claims accrual estimate; and (iv) evaluating the reasonableness of management’s significant assumptions related to the expected loss rates and loss- development factors based on historical claims experience used in the calculation of the estimate.
Professionals with specialized skill and knowledge were used to assist in the evaluation of (i) the Company’s claims accrual process and (ii) the expected loss rate and loss-development factors used in developing the estimate.
/s/ PricewaterhouseCoopers LLP
Fayetteville, Arkansas
February 25, 2022
We served as the Company’s auditor from 2005 to 2021.
| Cash and cash equivalents | | $ | 355,549 | | | $ | 313,302 | |
| Prepaid expenses and other current assets | | | 209,554 | | | | 194,759 | |
| | | | | | | | | |
| --- | --- | --- |
| --- | --- | --- | --- | --- | --- | --- | --- | --- | --- | --- | --- | --- | --- | --- | --- | --- |
| | | | | | | | | | | | | | | | | |
| December 31, 2018 | | | 15.9 | | | | 8.9 | | | | (0.9 | ) | | | 23.9 | |
| --- | --- |
| 10.8 | | [First Amendment to Credit Agreement, dated as of March 1, 2019 (incorporated by reference from Exhibit 10.2 of the Company’s current report on Form 8-K, filed March 1, 2019)](http://www.sec.gov/Archives/edgar/data/728535/000143774919003755/ex_136049.htm) |
| | * | Portions of this exhibit have been omitted pursuant to Item 601(b)(10)(iv) of Regulation S-K. |
We are responsible for the preparation, integrity, and fair presentation of our Consolidated Financial Statements and related information appearing in this report.
We take these responsibilities very seriously and are committed to maintaining controls and procedures that are designed to ensure that we collect the information we are required to disclose in our reports to the SEC and to process, summarize, and disclose this information within the time periods specified by the SEC.
Based on an evaluation of our disclosure controls and procedures as of the end of the period covered by this report, conducted by our management and with the participation of our Chief Executive Officer and Chief Financial Officer, we believe our controls and procedures are effective to ensure that we are able to collect, process, and disclose the information we are required to disclose in our reports filed with the SEC within the required time periods.
Our internal control over financial reporting is designed to provide reasonable assurance to our management and Board of Directors regarding the preparation and fair presentation of published financial statements.
Therefore, even those systems determined to be effective can provide only reasonable assurance with respect to financial statement preparation and presentation.
Ernst & Young LLP’s report on internal control over financial reporting is included herein.
| _Description of_ _the Matter_ | At December 31, 2020, the Company’s aggregate claims accrual was $257 million, which is primarily related to casualty and workers’ compensation claims, inclusive of amounts expected to be paid by the Company’s insurers above its self-insured retention limits. As explained in Note 2 of the financial statements, the Company recognizes a liability at the time of the incident based upon the nature and severity of the claim and analyses provided by third-party claims administrators. The Company uses an actuarial method to develop currently known claim information to derive an estimate of the ultimate claim liability to account for estimated incurred but not reported losses (“IBNR”). Auditing the Company's claims accruals is complex and involves significant measurement uncertainty associated with the estimate, the application of significant management judgment, and the use of various actuarial methods. In addition, the estimate for claims accruals is sensitive to significant management assumptions, including the frequency and severity assumptions used to derive the computation of the IBNR, and the case reserves and loss development factors for reported claims. |
| _How We Addressed the Matter in Our Audit_ | We obtained an understanding, evaluated the design and tested the operating effectiveness of internal controls over the claims accrual process, including management’s assessment of the assumptions and data underlying the IBNR reserve. To evaluate the claims accruals, our audit procedures included, among others, testing the completeness and accuracy of the underlying claims by performing a test of details over a representative sample. Furthermore, we involved our actuarial specialist to assist in our evaluation of the methodologies applied by management in determining the calculated reserve. We compared the Company’s reserved amount to a range which our actuarial specialist developed based on independently selected assumptions. |
Rogers, Arkansas
February 22, 2021
We have audited J.B. Hunt Transport Services, Inc.’s internal control over financial reporting as of December 31, 2020, based on criteria established in Internal Control – Integrated Framework issued by the Committee of Sponsoring Organizations of the Treadway Commission (2013 framework) (the COSO criteria).
We also have audited, in accordance with the standards of the Public Company Accounting Oversight Board (United States) (PCAOB), the consolidated balance sheets as of December 31, 2020 and 2019, the related consolidated statements of earnings, stockholders' equity and cash flows for each of the three years in the period ended December 31, 2020, and the related notes and financial statement schedule listed in the Index at Item 15(a) (collectively referred to as the “financial statements”) of the Company and our report dated February 22, 2021, expressed an unqualified opinion thereon.
| /s/ Ernst & Young LLP |
| --- |
| --- | --- | --- | --- | --- | --- | --- | --- | --- | --- |
| Prepaid expenses | | | | 194,759 | | | | 183,033 | |
| | | | | | | | | | |
| Dividends declared per common share | | $ | 1.08 | | | $ | 1.04 | | | $ | 0.96 | |
| --- | --- | --- | --- | --- | --- | --- | --- | --- | --- | --- | --- | --- | --- | --- | --- | --- | --- | --- |
| --- | --- | --- | --- | --- | --- | --- | --- | --- | --- | --- | --- | --- | --- | --- | --- | --- | --- | --- | --- | --- |
| Balances at December 31, 2017 | | $ | 1,671 | | | $ | 310,811 | | | $ | 3,803,844 | | | $ | (2,277,001 | ) | | $ | 1,839,325 | |
| Net earnings | | | \- | | | | \- | | | | 489,585 | | | | \- | | | | 489,585 | |
| | | | | | | | | | | | | | | | | | | | | |
| Claims accruals | | | (9,072 | ) | | | (20,727 | ) | | | 21,580 | |
| Cash and cash equivalents at beginning of year | | | 35,000 | | | | 7,600 | | | | 14,612 | |
For _2019_ and _2020,_ we were self-insured for $500,000 per occurrence for personal injury and property damage and fully insured for workers’ compensation claims for nearly all states.
Accounting Pronouncements Adopted in _20__20_
In _June 2016,_ the Financial Accounting Standards Board (FASB) issued Accounting Standards Update (ASU) _2016_\-_13,_ Financial Instruments – Credit Losses, which replaced the existing incurred loss methodology used for establishing a provision against financial assets, including accounts receivable, with a forward-looking expected loss methodology for accounts receivable, loans and other financial instruments.
We adopted the new standard on _January 1, 2020,_ using the cumulative-effect method.
The adoption of the new guidance did _not_ have a material impact on our financial statements.
| Unvested at December 31, 2017 | | | 1,242,528 | | | $ | 74.71 | |
| Granted | | | 370,669 | | | | 119.82 | |
| Vested | | | (337,512 | ) | | | 79.02 | |
An excerpt. Shown here: 40 of 369 rewritten, 40 of 96 added and 40 of 104 removed. The counts are complete. For every sentence, read Item 15. EXHIBITS, FINANCIAL STATEMENT SCHEDULES in the FY2021 filing and the FY2020 filing.