 filings.tools
Lennar (LEN) 10-K risk factor changes: FY2021 vs FY2020
The 2021-11-30 10-K against the 2020-11-30 one, compared heading by heading and sentence by sentence.
Item 1A38 rewritten42 added23 removed217 unchanged
All filing items919 rewritten598 added513 removed1,982 unchanged
Summary
counted, not written
- Item 1A lists 44 risk factor headings: 6 new, 3 reworded and 35 unchanged since FY2020. 4 headings from FY2020 no longer appear.
- Sentence by sentence, 598 added, 513 removed, 919 rewritten and 1,982 unchanged across 20 items that differ.
- New this year: Item 9C. Disclosure Regarding Foreign Jurisdictions that Prevent Inspections..
New Item 1A headings (6)
- Negative publicity could negatively impact our reputation, which could cause our revenues or results of operations to decline.
- An announced spin off of some of our businesses may not achieve its goals.
- Our business strategies for our homebuilding and mortgage finance businesses may not increase our value.
- Supply shortages and continuing cost increases could adversely affect our operations.
- Excessive Health and safety incidents relating to our operations could be costly to us.
- We could suffer significant losses if there are reductions in the market value of our investments in publicly traded companies.
Removed Item 1A headings (4)
- Continuing cost increases could affect our operating margins.
- Supply shortages and risks related to the demand for skilled labor and building materials could increase costs and delay deliveries.
- Our Financial Services segment, including LMF Commercial, has warehouse facilities that mature in fiscal year 2021, and if we could not renew or replace these facilities, we probably would have to reduce our mortgage lending and origination activities.
- We could suffer significant losses with regard to our investments in technology companies.
Reworded Item 1A headings (3)
- Our results of operations and financial condition may be adversely affected by [added: public health issues, including] the COVID-19
[removed: pandemic][added: pandemic,] and resulting governmental actions. - We may be liable for certain limited representations and warranties we make in connection with [added: the] sale of loans.
[removed: Our][added: An] inability to obtain performance bonds or post letters of credit could adversely affect our operations.
A heading is new when no FY2020 heading matches it after ignoring case and punctuation, and reworded when it shares at least 60 percent of its words with one that went away. All current risk factor headings.
Sentences by item
23 items, with every count and a link to each item that changed
Underlined words on a shaded ground are new in FY2021; struck-through words were in FY2020. Sentences that are wholly new or wholly gone are labelled rather than marked.
Item 1A. Risk Factors.
38 rewritten, 42 added, 23 removed, 217 unchanged
Our results of operations and financial condition may be adversely affected by [added: public health issues, including] the COVID-19 [removed: pandemic] [added: pandemic,] and resulting governmental actions.
With the exception of a period in March and [removed: April,] [added: April of 2020,] the COVID-19 pandemic and its effects on the economy [removed: do] [added: has] not [removed: appear to have] adversely affected our home [removed: sales through the year ended November 30, 2020.][added: sales.]
The extent to which COVID-19 impacts our results will depend on future developments, which [removed: are highly uncertain and] cannot be predicted, including new information which may emerge concerning the continuing severity of COVID-19, whether there are additional outbreaks of [removed: COVID-19,] [added: COVID-19 or other contagious diseases,] and the actions taken to contain [removed: it] [added: them] or [removed: treat its] [added: their] impact.
If [removed: the virus] [added: COVID-19] continues to [removed: cause] [added: cause, or another contagious disease causes,] significant negative impacts to economic conditions or consumer confidence, our results of operations, financial condition and cash flows could be materially adversely impacted.
[removed: During fiscal 2020, we] [added: We] saw the homebuilding industry stall from mid-March through April [added: of 2020] as a result of the COVID-19 [removed: pandemic, but by May and into June, the market for new homes had steadily strengthened.][added: pandemic.]
While the homebuilding industry only paused for a relatively brief period in 2020, [removed: the] [added: a] prior economic downturn in 2007-2010 severely affected for more than two years both the number of homes we could sell and the prices for which we could sell them.
It is possible that another downturn resulting from [removed: increasing severity of the COVID-19] [added: a health] pandemic or other factors would result in a decline in demand for new homes [added: for a significant period] which would negatively impact our business, results of operations and financial condition.
[removed: Continuing] [added: Supply shortages and continuing] cost increases could [added: adversely] affect our [removed: operating margins.][added: operations.]
[removed: Further, we] [added: We have been] actively [removed: managed] [added: managing] our sales pace so we [removed: did] [added: do] not sell homes until construction [removed: was] [added: is] ready to start, in order to avoid the possibility of costs increasing after we [added: have] committed to the prices at which we [removed: would] [added: will] sell homes.
[added: We continue to operate in a labor] constrained market and we cannot predict future inflationary pressures or increases in tariffs on imported building materials.
[removed: Our] [added: Any] inability to pass on future increased costs to homebuyers would put downward pressure on our operating margins in [removed: 2021] [added: 2022] and subsequent years.
If market conditions were to deteriorate significantly in the future, we could again be required to make significant write-downs of the carrying value of our [added: land] inventory and costs relating to land purchase options.
[removed: Operational Risks][added: *Operational Risks*]
At November 30, [removed: 2020,] [added: 2021,] we had a [removed: $2.4] [added: $2.5] billion revolving credit facility with a group of banks
It has a [removed: $400] [added: $300] million accordion feature, subject to additional commitments, thus the maximum borrowings could be $2.8 billion.
At November 30, [removed: 2020,] [added: 2021,] we had no borrowings under the Credit Facility.
[removed: If we were to lose members of our senior management, we might not be] able to find appropriate replacements on a timely basis and our operations could be negatively affected.
Among other things, changes made by Fannie Mae, Freddie Mac, Ginnie Mae and FHA/VA to sponsored mortgage programs, as well as changes made in recent years by private mortgage insurance companies, have reduced the ability of [added: a number of] potential homebuyers to qualify for mortgages.
Approximately [removed: 93%] [added: 97%] of the residential mortgage loans made by our Financial Services segment in [removed: 2020] [added: 2021] were made to buyers of homes we built.
We may be liable for certain limited representations and warranties we make in connection with [added: the] sale of loans.
Mortgage investors sometimes seek to have us buy back mortgage loans or compensate them for losses incurred on mortgage loans that we have sold based on claims that we breached [added: our limited representations and warranties.]
We reduced our outstanding senior [removed: indebtedness] [added: notes] during fiscal [removed: 2020] [added: 2021] by [removed: $1.5] [added: $1.2] billion, but we still have a significant amount [removed: of indebtedness.][added: outstanding.]
Our [removed: reliance on] [added: use of capital markets] debt to help support our operations exposes us to a number of risks, including:
- [removed: we] [added: \[we] may have a competitive disadvantage relative to other companies in our industry that are less [removed: leveraged;] [added: leveraged\];] and
For a number of years, a substantial portion of our access to capital has been through the issuance of senior notes, of which we have approximately [removed: $5.4] [added: $4.2] billion outstanding, net of debt issuance costs, as of November 30, [removed: 2020.][added: 2021.]
During fiscal year [removed: 2021,] [added: 2022,] we will have to replace or renew a total of [removed: $2.4] [added: $2.9] billion of warehouse lines used by Financial Services, including LMF Commercial, as they mature.
[removed: Our] [added: An] inability to obtain performance bonds or post letters of credit could adversely affect our operations.
At November 30, [removed: 2020,] [added: 2021,] we had outstanding surety bonds of [removed: $3.1] [added: $3.6] billion including performance surety bonds related to site improvements at various projects (including certain projects of our joint ventures) and financial surety bonds.
[removed: Our] [added: Our] Financial Services segment, including LMF Commercial, has warehouse facilities that mature in fiscal year [removed: 2021,] [added: 2022,] and if we could not renew or replace these facilities, we probably would have to reduce our mortgage lending and origination [removed: activities.][added: activities.]
If a joint venture partner does not perform its obligations, we may be required to bear more than our proportional share of the cost of fulfilling [removed: them.][added: the joint venture’s obligations.]
During the past [removed: couple of] [added: several] years, the U.S. government has imposed new, or increased existing, tariffs on an array of imported materials and products that are used in the homes we build, including lumber, steel, aluminum, solar panels and washing machines, which increases the costs of those [removed: items, and it has threatened additional new or increased tariffs.][added: items.]
[removed: The new] [added: New] or increased tariffs could also negatively affect U.S. national or regional economies, which could affect the demand for the homes we build.
[removed: In] addition, in many markets government authorities have implemented no growth or growth control initiatives.
[added: However, various] governmental agencies have sought, and in the future may seek, to hold contract parties like us responsible for violations of wage and hour laws, workers’ compensation and other work-related laws by firms whose employees are performing contracted for services.
Moreover, our computer systems, like those of most companies, are subject to [added: the] possibility of computer viruses or other malicious codes, and to cyber or phishing-attacks.
[removed: Our quarterly results of operations may continue to fluctuate in the future as a result of a variety of] factors, including, among others, seasonal home buying patterns, the timing of home closings and land sales and weather-related problems.
Stuart Miller, our Executive Chairman, through family and personal holdings of Class B, and to a lesser extent Class A, common stock, has the power to cast approximately [removed: 34%] [added: 35%] of the votes that can be cast by the holders of all our outstanding Class A and Class B common stock combined.
We believe this is because only a relatively small number of shares of Class B common stock are available for trading, which reduces the liquidity of the market for our Class B common stock to a point where many [added: large] investors are reluctant to invest in it.
Negative publicity could negatively impact our reputation, which could cause our revenues or results of operations to decline.
Our business success is dependent upon the reputation of the Lennar brand and its association with quality and integrity.
If we are unable to maintain the position of the Lennar brand, our business may be adversely affected, which could result in lower sales and earnings.
Unfavorable media or investor and analyst reports related to our industry, company, brand, marketing, personnel, operations, business performance, or prospects may affect our stock price and the performance of our business, regardless of its accuracy or inaccuracy.
Furthermore, the speed at which negative publicity is disseminated has
increased dramatically through the use of electronic communication, including social media outlets, websites and other digital platforms.
Our success in maintaining and enhancing our brand depends on our ability to adapt to this rapidly changing media environment.
Adverse publicity or negative commentary from media outlets could damage our reputation and reduce the demand for our homes, which would adversely affect our business.
An announced spin off of some of our businesses may not achieve its goals.
We have announced our intention to transfer some of our non-core businesses into a newly formed company and to distribute at least most of the stock of that company to our stockholders.
Our hope is that doing that will result in the combined market value of our stock and the stock of the new company exceeding what the market value of our stock would be if we continued to conduct the businesses that we will transfer to the new company.
However, there is no assurance that that will occur.
Among other things, making the new company a self-standing entity will lose some synergies the businesses it will own currently benefit from.
Therefore, it is possible that after the separation, the combined market value of our stock and the stock of the new company will be less, not more, than what the market value of our stock would be if we did not move some of our non-core businesses into a new company
Our business strategies for our homebuilding and mortgage finance businesses may not increase our value.
We cannot assure you that our strategies for our core homebuilding and mortgage finance businesses, and any related initiatives or actions, will be successful.
Principal among our current strategies is continuing to reduce our inventory of land we own (i.e., to become a land lighter company).
We cannot provide any assurance that this strategy, or other strategies we will follow, will increase our value.
It is possible that the land lighter or other strategies will reduce, rather than increase, the value and profitability of our core businesses.
However, after that, demand for new homes grew steadily through the remainder of 2020 and throughout 2021.
During fiscal 2021, we experienced a significantly stressed supply of both labor and materials, and we expect this to continue well into fiscal 2022.
The time it takes to build a home has increased as a result of supply issues, which has led to delayed home deliveries.
In addition, the costs of construction materials and other components of homes, lumber in particular, and the costs of labor have been rising.
The United States has experienced, and may experience in the future, outbreaks of contagious diseases that affect public health and public perception of health risk.
Excessive Health and safety incidents relating to our operations could be costly to us.
Land development and construction are inherently dangerous.
While safety is a priority on our land development and construction sites, we cannot always control the way work is performed by subcontractors, including whether they comply with laws and regulations designed to maximize the safety of construction workers.
Any failure in health and safety performance may result in penalties for non-compliance with relevant regulatory requirements, may result in our subcontractors having difficulty attracting the workers they need and may result in a negative impact to our reputation.
We also had warehouse borrowing facilities totaling $2.3 billion to support our mortgage lending activities.
If we were to lose members of our senior management, we might not be
As of November 30, 2021, we had outstanding senior notes which we had sold into the capital markets over a number of years totaling $4.2 billion.
Sales of senior debt into the capital markets has, until recently, been a significant source of funding for our operations and acquisitions.
In
Government restrictions, standards, or regulations intended to reduce greenhouse gas emissions or potential climate change impacts are likely to result in restrictions on land development in certain areas and may increase energy, transportation, or raw material costs, which could reduce our profit margins and adversely affect our results of operations.
This is a particular concern in the western United States, where some of the most extensive and stringent environmental laws and residential building construction standards in the country have been enacted, and where we have substantial homebuilding and multifamily operations.
Our increased use of remote work environments and virtual platforms in response to COVID-19 may also increase our risk of cyber-attack or data security breaches.
However, a variety of factors, such as the shutdown of large portions of our national economy in the second quarter of 2020 as a result of the COVID-19 pandemic, can change seasonal patterns.
Our quarterly results of operations may continue to fluctuate in the future as a result of a variety of
We could suffer significant losses if there are reductions in the market value of our investments in publicly traded companies.
We have made investments in companies that are engaged in applying technology to improve the homebuilding industry and real estate related aspects of the financial services industry.
While portions of the national economy have reopened, there is still significant uncertainty around the breadth and duration of business disruptions related to COVID-19, as well as their impact on the U.S. economy and consumer confidence.
During fiscal 2020, although lumber, in particular, labor and other costs were rising, we were able to implement cost saving changes that enabled us to minimize the effect of the cost increases.
We continue to operate in a labor
Supply shortages and risks related to the demand for skilled labor and building materials could increase costs and delay deliveries.
During 2020, we experienced increases in the prices of some building materials, particularly lumber, and shortages of skilled labor in some areas.
We generally are unable to pass on increases in construction costs to customers who have already entered into purchase contracts, as those contracts usually fix the price of the homes at the time the contracts are signed, which in the past has often been well in advance of the construction of the homes.
During 2020, in order to reduce the risk of this happening, we focused on not signing a contract relating to sale of a home until construction was ready to start.
However, increases in construction costs sometimes exceed our ability to increase home prices, particularly in areas where there is aggressive pricing competition or weak demand.
This reduces our operating margins and our net income.
The Credit Facility agreement provides that up to $500 million in commitments may be used for letters of credit.
our limited representations and warranties.
As of November 30, 2020, our consolidated debt, net of debt issuance costs, and excluding amounts outstanding under our credit facilities, was $6.0 billion.
If we cannot replace or renew this debt when we need it, our operations could be adversely affected.
Our Financial Services segment's residential mortgage origination subsidiaries have committed and uncommitted borrowing amounts under four warehouse repurchase credit facilities that totaled $1.8 billion as of November 30, 2020, all of which will mature at various dates through fiscal 2021.
Our Financial Services segment uses these facilities to finance its residential mortgage lending activities until the mortgage loans it originates are sold to investors.
In addition, LMF Commercial, our commercial mortgage lending subsidiary, which is included in our Financial Services segment, has committed borrowing amounts under five warehouse repurchase credit facilities that totaled $800 million as of November 30, 2020, all of which will mature within a year after that date.
LMF Commercial uses these facilities primarily to finance its commercial mortgage loan origination activities.
However, various
The shutdown of large portions of our national economy in the second quarter of 2020 as a result of the COVID-19 pandemic changed this pattern with regard to 2020, but we expect it to resume in 2021 and subsequent years.
We could suffer significant losses with regard to our investments in technology companies.
In connection with our effort to use new technology to reduce selling costs and improve the experience of our homebuyers, we have made substantial investments in companies that are developing new technology that we are using.
In many instances those companies have not yet achieved profitability or their ability to survive market downturns has not yet been tested.
While we hope at least most of the investments we have made will prove to be profitable, it is possible that will not be the case, and that we at some time will have to write down significant portions of our investments in technology companies.
An excerpt. Shown here: all 38 rewritten, 40 of 42 added and all 23 removed. The counts are complete. For every sentence, read Item 1A. Risk Factors. in the FY2021 filing and the FY2020 filing.
Item 7. Management’s Discussion and Analysis of Financial Condition and Results of Operations.
221 rewritten, 170 added, 156 removed, 328 unchanged
Among other things, this has [removed: increased our cash flow, which] enabled us to reduce debt, [removed: including prepaying all of our senior debt that was scheduled to become due in fiscal 2021,] such that our [removed: year-end] homebuilding debt-to-total capital ratio improved to [removed: 24.9%, the lowest] [added: 18.3% at year end, from 24.9%] in [removed: our history.][added: the prior year.]
Our net earnings attributable to Lennar were [removed: $2.5] [added: $4.4] billion, or [removed: $7.85] [added: $14.27] per diluted share [removed: ($7.88] [added: ($14.28] per basic share) in [removed: 2020] [added: 2021] and [removed: $1.8] [added: $2.5] billion, or [removed: $5.74] [added: $7.85] per diluted share [removed: ($5.76] [added: ($7.88] per basic share) in [removed: 2019.][added: 2020.]
| Other costs and expenses | | | — | | | | | | 470,777 | | | | | | 575,581 | | | | | | 6,744 | | | | | | [added: —] | | | | | | 1,053,102 | | |
| Equity in earnings (loss) from unconsolidated [removed: entities and] [added: entities,] Multifamily other gain [added: and Lennar Other other income (expense), net] | | | (836) | | | | | | — | | | | | | 21,934 | | | | | | [removed: (35,037)] [added: (44,669)] | | | | | | — | | | | | | [removed: (13,939)] [added: (23,571)] | | |
| [removed: Other] [added: Homebuilding other] expense, net | | | (29,749) | | | | | | — | | | | | | — | | | | | | [removed: (9,632)] [added: —] | | | | | | — | | | | | | [removed: (39,381)] [added: (29,749)] | | |
| Operating [removed: earnings (loss)] [added: earnings] | | | [removed: 2,988,907] [added: 2,988,907] | | | | | | [removed: 480,952] [added: 480,952] | | | | | | [removed: 22,681] [added: 22,681] | | | | | | [removed: (10,334)] [added: (10,334)] | | | | | | [removed: —] [added: —] | | | | | | [removed: 3,482,206] [added: 3,482,206] | | |
| Corporate general and administrative expenses | | | — | | | | | | — | | | | | | — | | | | | | — | | | | | | [removed: 358,418] [added: 398,381] | | | | | | [removed: 358,418] [added: 398,381] | | |
| Earnings (loss) before income taxes | | | [removed: $] [added: $] | [removed: 2,988,907] [added: 2,988,907] | | | | | [removed: 480,952] [added: 480,952] | | | | | | [removed: 22,681] [added: 22,681] | | | | | | [removed: (10,334)] [added: (10,334)] | | | | | | [removed: (358,418)] [added: (358,418)] | | | | | | [removed: 3,123,788] [added: 3,123,788] | | |
| | | | Year ended November 30, [removed: 2019] [added: 2021] | | | | | | | | | | | | | | | | | | | | | | | | | | | | | | | | |
| Costs of homes sold | | | [removed: 16,323,989] [added: 18,562,213] | | | | | | — | | | | | | — | | | | | | — | | | | | | — | | | | | | [removed: 16,323,989] [added: 18,562,213] | | |
| Costs of land sold | | | [removed: 206,526] [added: 143,631] | | | | | | — | | | | | | — | | | | | | — | | | | | | — | | | | | | [removed: 206,526] [added: 143,631] | | |
| Selling, general and administrative | | | [removed: 1,715,185] [added: 1,796,697] | | | | | | — | | | | | | — | | | | | | — | | | | | | — | | | | | | [removed: 1,715,185] [added: 1,796,697] | | |
| Equity in earnings (loss) from unconsolidated [removed: entities and] [added: entities,] Multifamily other gain [added: and Lennar Other other income (expense), net] | | | [removed: (13,273)] [added: (14,205)] | | | | | | — | | | | | | [removed: 11,294] [added: 9,031] | | | | | | [removed: 15,372] [added: 61,957] | | | | | | [added: —] | | | | | | [removed: 13,393] [added: 56,783] | | |
| Corporate general and administrative expenses | | | — | | | | | | — | | | | | | — | | | | | | — | | | | | | [removed: 341,114] [added: 333,446] | | | | | | [removed: 341,114] [added: 333,446] | | |
[removed: 2020] [added: 2021] versus [removed: 2019][added: 2020]
Revenues from home sales increased [removed: 1%] [added: 22%] in the year ended November 30, [removed: 2020] [added: 2021] to [removed: $20.8] [added: $25.3] billion from [removed: $20.6] [added: $20.8] billion in the year ended November 30, [removed: 2019.][added: 2020.]
Revenues were higher primarily due to a [removed: 3%] [added: 13%] increase in the number of home [removed: deliveries, excluding unconsolidated entities, partially offset by a 1% decrease] [added: deliveries and an 8% increase] in the average sales [removed: price of homes delivered.][added: price.]
New home [removed: deliveries, excluding unconsolidated entities,] [added: deliveries] increased to [removed: 52,813] [added: 59,825] homes in the year ended November 30, [removed: 2020] [added: 2021] from [removed: 51,412] [added: 52,925] homes in the year ended November 30, [removed: 2019,] [added: 2020] as a result of an increase in home deliveries in [removed: the Texas and West] [added: all our homebuilding] segments.
Gross margins on home sales were [removed: $4.7] [added: $6.8] billion, or [removed: 22.8%,] [added: 26.8%,] in the year ended November 30, [removed: 2020,] [added: 2021,] compared to [removed: $4.2] [added: $4.7] billion, or [removed: 20.6%,] [added: 22.8%,] in the year ended November 30, [removed: 2019.][added: 2020.]
Selling, general and administrative expenses were [added: $1.8 billion in the year ended November 30, 2021, compared to] $1.7 billion in [removed: both years] [added: the year] ended November 30, [removed: 2020 and 2019.][added: 2020.]
As a percentage of revenues from home sales, selling, general and administrative expenses improved to [removed: 8.1%] [added: 7.1%] in the year ended November 30, [removed: 2020,] [added: 2021,] from [removed: 8.3%] [added: 8.1%] in the year ended November 30, [removed: 2019,] [added: 2020, primarily] due to [removed: improved operating leverage as] a [removed: result of an increase] [added: decrease] in [removed: home deliveries combined with the] [added: broker commissions and] benefits of [removed: our] [added: the Company's] technology [removed: initiatives.][added: efforts.]
Operating earnings for [removed: the] [added: our] Financial Services segment were [removed: $481.0] [added: $491.0] million [removed: ($495.0] [added: ($490.4] million net of noncontrolling interests) in the year ended November 30, [removed: 2020,] [added: 2021,] compared to [removed: $224.6] [added: $481.0] million [removed: ($244.3] [added: ($495.0] million net of noncontrolling interests) in the year ended November 30, [removed: 2019.][added: 2020.]
[removed: Additionally, in the second quarter of 2020, the Financial Services segment recorded] [added: The year ended November 30, 2020 included] a $61.4 million gain on the deconsolidation of a previously consolidated entity.
Operating earnings for [removed: the] [added: our] Multifamily segment were [removed: $22.7] [added: $21.5] million in the year ended November 30, [removed: 2020,] [added: 2021,] compared to [removed: operating earnings of $16.4 million ($18.1] [added: $22.7] million [removed: net of noncontrolling interests)] in the year ended November 30, [removed: 2019.][added: 2020.]
Operating [removed: loss] [added: earnings] for [removed: the] [added: our] Lennar Other segment [removed: was $10.3] [added: were $733.0] million in the year ended November 30, [removed: 2020,] [added: 2021,] compared to [added: an] operating [removed: earnings] [added: loss] of [removed: $31.5 million ($32.0] [added: $10.3] million [removed: net of noncontrolling interests)] in the year ended November 30, [removed: 2019.][added: 2020.]
[removed: In] [added: During] the [removed: fourth quarter of 2020,] [added: year ended November 30, 2021,] we retired [removed: $1.2] [added: $1.15] billion [removed: of senior notes which included the redemption of $300 million] aggregate principal amount of [removed: our 2.95%] senior notes [removed: due November 2020, and early retirement of $400] [added: which included $600] million aggregate principal amount of our [removed: 8.375%] [added: 4.125%] senior notes due January [removed: 2021 and $500 million aggregate principal amount of our 4.75% senior notes due April 2021.][added: 2022 at par, retired early, at a]
For the years ended November 30, [removed: 2020] [added: 2021] and [removed: 2019,] [added: 2020,] we had a tax provision of [removed: $656.2 million] [added: $1.4 billion] and [removed: $592.2] [added: $656.2] million, respectively, which resulted in an overall effective income tax rate of [removed: 21.0%] [added: 23.5%] and [removed: 24.3%,] [added: 21.0%,] respectively.
The [removed: reduction in the] overall effective income tax rate was [added: lower in 2020] primarily due to the [added: retroactive] extension of the new energy efficient home tax credit during the first quarter of 2020.
At November 30, [removed: 2020,] [added: 2021,] we had $2.7 billion of Homebuilding cash and cash equivalents and no outstanding borrowings under our [removed: $2.4] [added: $2.5] billion revolving credit facility, thereby providing [removed: $5.1] [added: $5.2] billion of available capacity.
At November 30, [removed: 2020,] [added: 2021,] our homebuilding operating segments and Homebuilding Other consisted of homebuilding divisions located in:
West: Arizona, California, Colorado, [added: Idaho,] Nevada, Oregon, Utah and Washington
| (Dollars in thousands) | | | Sales of Homes [removed: Revenue] [added: Revenues] | | | | | | Costs of Sales of Homes | | | | | | Gross Margin % | | | | | | Net Margins on Sales of Homes (1) | | | | | | Gross Margins [removed: (Loss)] on Sales of Land | | | | | | Other Revenues | | | | | | Equity in Earnings (Loss) from Unconsolidated Entities | | | | | | Other Income [removed: (Expenses),] [added: (Expense),] net | | | | | | Operating Earnings (Loss) | | |
| | | | Year Ended November 30, [removed: 2019] [added: 2021] | | | | | | | | | | | | | | | | | | | | | | | | | | | | | | | | | | | | | | | | | | | | | | | | | | |
(2)Negative gross and net margins were due to period costs in Urban divisions that impact costs of homes sold without sufficient sales of homes [removed: revenue] [added: revenues] to offset those costs.
| East | | | [removed: 16,976] [added: 18,879] | | | | | | [removed: 17,251] [added: 16,976] | | | | | | | | | | | | $ | [removed: 5,725,481] [added: 6,846,153] | | | | | [removed: 5,708,859] [added: 5,725,481] | | | | | | | | | | | | $ | [removed: 337,000] [added: 363,000] | | | | | [removed: 331,000] [added: 337,000] | | | | | | | | |
| Central | | | [removed: 10,684] [added: 12,138] | | | | | | [removed: 10,799] [added: 10,684] | | | | | | | | | | | | [removed: 4,084,514] [added: 4,807,195] | | | | | | [removed: 4,089,840] [added: 4,084,514] | | | | | | | | | | | | [removed: 382,000] [added: 396,000] | | | | | | [removed: 379,000] [added: 382,000] | | | | | | | | |
| Texas | | | [removed: 9,425] [added: 10,939] | | | | | | [removed: 8,193] [added: 9,425] | | | | | | | | | | | | [removed: 2,640,762] [added: 3,204,609] | | | | | | [removed: 2,526,364] [added: 2,640,762] | | | | | | | | | | | | [removed: 280,000] [added: 293,000] | | | | | | [removed: 308,000] [added: 280,000] | | | | | | | | |
| West | | | [removed: 15,814] [added: 17,850] | | | | | | [removed: 15,178] [added: 15,814] | | | | | | | | | | | | [removed: 8,400,943] [added: 10,503,304] | | | | | | [removed: 8,203,790] [added: 8,400,943] | | | | | | | | | | | | [removed: 531,000] [added: 588,000] | | | | | | [removed: 541,000] [added: 531,000] | | | | | | | | |
| Other | | | [removed: 26] [added: 19] | | | | | | [removed: 70] [added: 26] | | | | | | | | | | | | [removed: 24,522] [added: 18,419] | | | | | | [removed: 67,439] [added: 24,522] | | | | | | | | | | | | [removed: 943,000] [added: 969,000] | | | | | | [removed: 963,000] [added: 943,000] | | | | | | | | |
| Total | | | [removed: 52,925] [added: 59,825] | | | | | | [removed: 51,491] [added: 52,925] | | | | | | | | | | | | $ | [removed: 20,876,222] [added: 25,379,680] | | | | | [removed: 20,596,292] [added: 20,876,222] | | | | | | | | | | | | $ | [removed: 394,000] [added: 424,000] | | | | | [removed: 400,000] [added: 394,000] | | | | | | | | |
It also should be read in conjunction with the disclosure under “Special Note Regarding Forward-Looking Statements” in Part I of this Form 10-K.
While supply chain challenges continued to dominate both the homebuilding and the broader economic narrative in 2021, we were extremely pleased with our performance this year.
The demand for housing continues to be strong, while the supply of new and existing homes continues to be constrained.
New home construction cannot ramp up quickly enough to fill the void of the underproduction of homes for the past decade, and short supply is likely to remain for some time to come.
Even though home prices have moved much higher, overall affordability remains strong as interest rates are still very attractive.
Personal savings for deposits are strong and wages seem to be rising faster than monthly payments.
However, those higher wages are starting to be reflected in government numbers and, unfortunately, in inflation as well.
Millennials are moving out of their parents’ homes and forming families, while large numbers of apartment dwellers are seeking first-time single-family homes.
First-time homes are selling at higher prices, and appreciated equity is enabling first-time move-ups.
The iBuyer and single-family for rent participants are providing additional liquidity to the marketplace for homes, as they evolve and provide ever more frictionless transactions.
While the housing market remains very strong in all of our major markets, our ability to actually execute and deliver results has been tested by the supply chain challenges for both land and construction, the workforce that is short in numbers while driven to produce more, and the never-ending competition for scarce entitled land assets.
The supply chain issues will continue into the first quarter of 2022 and beyond.
But we expect that as we enter the second half of the year, we will be less affected by supply chain disruptions, in part because of the greater number of homes we are starting, the lessons learned and incorporated in our Builder of Choice relationships with suppliers and trades, and the simplicity embedded in our Everything's Included® home offerings.
We remain focused on orderly, targeted growth, with our sales pace tightly matched with the numbers of homes we can build, which enables price appreciation to offset future cost escalations and therefore maximize margins.
Although there have been some headwinds throughout the year, fiscal 2021 was an extraordinary year for our company.
We established an operating plan that included cash flow generation and debt reduction in order to improve returns on capital and equity.
We expect our first quarter community count to be about 5% lower than year-end 2021 because of the shortages both of land and construction materials.
However, we expect community count to start to increase in the second quarter, and we expect to end 2022 with a low double-digit increase in community count year-over-year.
We expect our deliveries for the first quarter of 2022 will be approximately 12,500 homes.
We expect our gross margin to be about 26.75%, which reflects the impact of peak lumber prices from last year and less field expense leverage.
We have remained focused on our optioned versus owned land strategy.
We ended the year with a 3.0 years supply of land owned, compared to a 3.5 years supply of land owned at the same time last year, and our homesites controlled percentage increased to 59% from 39% in the prior year.
We have articulated a drive and desire to have a strong focus on new technology-driven efficiencies in our core business.
We invested in numerous new technologies, while eight prior investments were either sold or went public, which resulted in significant profits for the Company in 2021.
Perhaps more importantly, we have invested in companies that have enabled improvement in our core business, while we have benefited both through the investments and through incorporation in our core.
We are working to address the issues in supply chain, labor shortages, and production, using innovative technology in innovative ways.
We have continued to work on the structural components and organization of our proposed spin-off company as we focus on the strategy of becoming a pure-play homebuilding company.
We have sufficient excess capacity and balance sheet to be able to spin off our well-established ancillary businesses, and we expect to complete a tax-free spin-off by the second or third quarter of 2022.
To that end, in November 2021, we took our first significant step to complete the spin-off by formally filing a request for a private letter ruling from the Internal Revenue Service confirming that the spin-off would not result in taxation either to us or to our stockholders.
We have concluded that the spin company will be an asset-light asset management business that will have a limited balance sheet.
Three core verticals have been identified for the spin, and they are multifamily, single-family for rent, and land strategies.
Each of these verticals already has raised third-party capital, and we are active asset managers.
We believe we have never been better positioned financially, organizationally and technologically to thrive and grow in this evolving high demand housing market.
While difficulties in the supply chain present challenges for Lennar and the industry, the housing market remains strong, and supply of new and existing homes is very limited.
We remain focused on an
orderly, targeted growth strategy, with our sales pace tightly matched with our pace of production.
We focus on gross margin by selling in step with production, while controlling costs, and reducing our SG&A, and therefore driving our net margin.
As we look to 2022, we see continued strength in the market and double-digit growth for Lennar.
| Sales of homes | | | $ | 25,348,105 | | | | | — | | | | | | — | | | | | | — | | | | | | — | | | | | | 25,348,105 | | |
| Sales of land | | | 167,913 | | | | | | — | | | | | | — | | | | | | — | | | | | | — | | | | | | 167,913 | | |
Special Note Regarding Forward-Looking Statements
This annual report on Form 10-K contains "forward-looking statements" within the meaning of the Private Securities Litigation Reform Act of 1995.
These statements concern expectations, beliefs, projections, plans and strategies, anticipated events or trends and similar expressions concerning matters that are not historical facts.
These forward-looking statements typically include the words “anticipate,” “believe,” “consider,” “estimate,” “expect,” “forecast,” “intend,” “objective,” “plan,” “predict,” “projection,” “seek,” “strategy,” “target,” “will” or other words of similar meaning.
Some of them are opinions formed based upon general observations, anecdotal evidence and industry experience, but that are not supported by specific investigation or analysis.
These forward-looking statements reflect our current views about future events and are subject to risks, uncertainties and assumptions.
We wish to caution readers that certain important factors may have affected and could in the future affect our actual results and could cause actual results to differ significantly from what is anticipated by our forward-looking statements.
The most important factors that could cause actual results to differ materially from those anticipated by our forward-looking statements include, but are not limited to: the potential negative impact to our business of the ongoing coronavirus (“COVID-19”) pandemic, the duration, impact and severity of which is highly uncertain; increases in operating costs, including costs related to construction materials, labor, real estate taxes and insurance, and our inability to manage our cost structure, both in our Homebuilding and Multifamily businesses; slowdowns in the residential real estate markets across the nation or in regions where we have significant homebuilding or multifamily development activities; reduced availability of mortgage financing or increased interest rates; our inability to successfully execute our strategies, including our land lighter strategy, our even flow production strategy and our strategy to better position our non-core assets; changes in general economic and financial conditions that reduce demand for our products and services, lower our profit margins or reduce our access to credit; our inability to acquire land at anticipated prices; the possibility that we will incur nonrecurring costs that affect earnings in one or more reporting periods; decreased demand for our homes or Multifamily rental properties; the possibility that the benefit from our increasing use of technology will not justify its cost; increased competition for home sales from other sellers of new and resale homes; our inability to pay down debt; whether government actions or other factors related to COVID-19 force us to further delay or terminate our program of repurchasing our stock; a decline in the value of our land inventories and resulting write-downs of the carrying value of our real estate assets; the failure of the participants in various joint ventures to honor their commitments; difficulty obtaining land-use entitlements or construction financing; natural disasters and other unforeseen events for which our insurance does not provide adequate coverage; new laws or regulatory changes that adversely affect the profitability of our businesses; our inability to refinance our debt on terms that are acceptable to us; and changes in accounting conventions that adversely affect our reported earnings.
Please see "Item 1A-Risk Factors" of this Annual Report for a further discussion of these and other risks and uncertainties which could affect our future results.
We undertake no obligation to revise any forward-looking statements to reflect events or circumstances after the date of those statements or to reflect the occurrence of anticipated or unanticipated events, except to the extent we are legally required to disclose certain matters in SEC filings or otherwise.
With the exception of a relatively brief period in March and April, the single family housing market was strong during 2020, and we expect it to continue to be strong during 2021.
The underproduction of homes for the past 10 years has created a housing shortage that, combined with strong demand, has pushed home prices higher.
Demand is growing as the millennial generation has begun moving towards traditional family formation trends.
Concurrently, the proposition of home as more of an essential part of the way we live, not just a place to live, is becoming a way of life rather than a COVID-driven reaction.
Our measured growth strategy in the current market is to focus on selling homes when we begin construction which improves our inventory turn, while being patient with longer-term sales.
This enables price appreciation to offset future cost escalations to maximize margin.
Our deliveries are expected to grow faster in 2021 than they did in 2020.
We expect continued price appreciation and leverage from field expenses throughout the year, somewhat offset by higher lumber prices and other anticipated cost increases.
We anticipate that our community count will be growing through 2021, and that our new communities will be larger than the communities that sold out during 2020.
We are expecting strong margins for the foreseeable future and throughout 2021, and we expect our bottom line to grow faster than our top line.
We expect to deliver between 62,000 and 64,000 homes in 2021 with between a 23.75% and 24% gross margin as compared to the 22.8% full year gross margin in 2020.
Our technology initiatives have contributed meaningfully to our readiness for current economic and structural shifts while helping to improve our core business and drive our SG&A to a historic low of 8.1% for 2020.
Our results and our expectations for next year are solid in all respects, and they reflect our focused strategy to balance growth, margin, cash flow and returns.
We have remained focused on our optioned versus owned land strategy and believe we are in an excellent position to achieve our target of 50% owned land and 50% land controlled through options or similar agreements by the end of 2021.
At the end of fiscal 2020, the portion of land we controlled through options or similar agreements was 39%, up from 33% at the start of the year.
We ended fiscal 2020 with a 3.5 year supply of land owned, compared to a 4.1 year supply of land owned at the start of fiscal 2020, which put us well on the way to our goal of a 3.0 year supply by the end of 2021.
We expect to be in a strong cash and liquidity position in 2021, and plan to continue with our strategies of reducing our debt balances and leverage ratio, and focusing on total shareholder return.
While we continue to refine and grow our ancillary business divisions, they are becoming a decidedly smaller part of the overall company picture.
We continue to work on strategies to better position our Multifamily platform, our emerging single-family home for rent platform, our strategic investment in FivePoint Holdings entities and our growing technology investments platform.
With a solid balance sheet, leading positions in almost all of our homebuilding markets and continued execution of our core operating strategies, we believe that we are well positioned to meet demand, drive strong margins and cash flow and continue to grow with the market.
| Sales of homes | | | $ | 20,560,147 | | | | | — | | | | | | — | | | | | | — | | | | | | — | | | | | | 20,560,147 | | |
| Sales of land | | | 203,567 | | | | | | — | | | | | | — | | | | | | — | | | | | | — | | | | | | 203,567 | | |
| Other revenues | | | 29,502 | | | | | | 824,810 | | | | | | 604,700 | | | | | | 36,835 | | | | | | — | | | | | | 1,495,847 | | |
| Total revenues | | | 20,793,216 | | | | | | 824,810 | | | | | | 604,700 | | | | | | 36,835 | | | | | | — | | | | | | 22,259,561 | | |
| Other costs and expenses | | | — | | | | | | 600,168 | | | | | | 599,604 | | | | | | 11,794 | | | | | | | | | | | | 1,211,566 | | |
| Total costs and expenses | | | 18,245,700 | | | | | | 600,168 | | | | | | 599,604 | | | | | | 11,794 | | | | | | — | | | | | | 19,457,266 | | |
| Other expense, net | | | (31,338) | | | | | | — | | | | | | — | | | | | | (8,944) | | | | | | | | | | | | (40,282) | | |
| Operating earnings | | | 2,502,905 | | | | | | 224,642 | | | | | | 16,390 | | | | | | 31,469 | | | | | | — | | | | | | 2,775,406 | | |
| Earnings before income taxes | | | $ | 2,502,905 | | | | | 224,642 | | | | | | 16,390 | | | | | | 31,469 | | | | | | (341,114) | | | | | | 2,434,292 | | |
The average sales price of homes delivered, excluding unconsolidated entities, decreased to $395,000 in the year ended November 30, 2020 from $400,000 in the year ended November 30, 2019.
An excerpt. Shown here: 40 of 221 rewritten, 40 of 170 added and 40 of 156 removed. The counts are complete. For every sentence, read Item 7. Management’s Discussion and Analysis of Financial Condition and Results of Operations. in the FY2021 filing and the FY2020 filing.
Item 7A. Quantitative and Qualitative Disclosures About Market Risk.
10 rewritten, 13 added, 13 removed, 47 unchanged
For variable rate debt such as our unsecured revolving credit facility and Financial Services’ and LMF Commercial’s warehouse repurchase facilities, changes in interest rates generally do not affect the fair value of the outstanding borrowings on the debt [removed: facilities,] [added: facilities] but do affect our earnings and cash flows.
The table below provides information at November 30, [removed: 2020] [added: 2021] about our significant instruments that are sensitive to changes in interest rates.
For loans held-for-investment, net and investments held-to-maturity, senior notes and other debts payable and notes and other debts payable, the table presents principal cash flows and related weighted average effective interest rates by expected maturity dates and estimated fair values at November 30, [removed: 2020.][added: 2021.]
Weighted average variable interest rates are based on the variable interest rates at November 30, [removed: 2020.][added: 2021.]
See Management’s Discussion and Analysis of Financial Condition and Results of Operations in Item 7 and Notes 1 and 7 of the [removed: notes] [added: Notes] to [removed: the consolidated financial statements] [added: Consolidated Financial Statements] in Item 8 for a further discussion of these items and our strategy of mitigating our interest rate risk.
| (Dollars in millions) | | | [removed: 2021] [added: 2022] | | | | | | [removed: 2022] [added: 2023] | | | | | | [removed: 2023] [added: 2024] | | | | | | [removed: 2024] [added: 2025] | | | | | | [removed: 2025] [added: 2026] | | | | | | Thereafter | | | | | | Total | | | | | | [removed: 2020] [added: 2021] | | |
| Loans held-for-investment, [removed: net and investments held-to-maturity:] [added: net:] | | | | | | | | | | | | | | | | | | | | | | | | | | | | | | | | | | | | | | | | | | | | | | | |
| Average interest rate | | | [removed: 4.3] [added: 3.7] | | % | | | | [removed: 4.3] [added: 3.7] | | % | | | | [removed: 4.3] [added: 3.7] | | % | | | | [removed: 4.3] [added: 3.7] | | % | | | | [removed: 4.3] [added: 3.7] | | % | | | | [removed: 4.2] [added: 3.6] | | % | | | | [removed: 4.2] [added: 3.6] | | % | | | | — | | |
| Average interest rate | | | [removed: 3.7] [added: —] | | [removed: %] | | | | 4.9 | | % | | | | [removed: 4.5] [added: —] | | [removed: %] | | | | [removed: 5.0] [added: —] | | [removed: %] | | | | [removed: 4.8] [added: —] | | [removed: %] | | | | [removed: 5.0] [added: 3.1] | | % | | | | [removed: 4.9] [added: 4.8] | | % | | | | — | | |
| Fixed rate | | | $ | [removed: 1.9] [added: —] | | | | | — | | | | | | — | | | | | | — | | | | | | — | | | | | | [removed: —] [added: 147.5] | | | | | | [removed: 1.9] [added: 147.5] | | | | | | [removed: 1.9] [added: 148.3] | | |
November 30, 2021
| Fixed rate | | | $ | 1.0 | | | | | 1.1 | | | | | | 1.1 | | | | | | 1.1 | | | | | | 1.2 | | | | | | 31.6 | | | | | | 37.1 | | | | | | 37.1 | | |
| Variable rate | | | $ | — | | | | | 7.3 | | | | | | — | | | | | | — | | | | | | — | | | | | | 0.2 | | | | | | 7.5 | | | | | | 7.5 | | |
| Fixed rate | | | $ | 718.3 | | | | | 104.4 | | | | | | 1,530.0 | | | | | | 591.4 | | | | | | 402.8 | | | | | | 1,294.6 | | | | | | 4,641.5 | | | | | | 5,046.7 | | |
| Average interest rate | | | 4.4 | | % | | | | 4.2 | | % | | | | 5.0 | | % | | | | 4.8 | | % | | | | 5.2 | | % | | | | 4.9 | | % | | | | 4.8 | | % | | | | — | | |
| | | | | | | | | | | | | | | | | | | | | | | | | | | | | | | | | | | | | | | | | | | | | | | | |
| | | | | | | | | | | | | | | | | | | | | | | | | | | | | | | | | | | | | | | | | | | | | | | | |
| | | | | | | | | | | | | | | | | | | | | | | | | | | | | | | | | | | | | | | | | | | | | | | | |
| | | | | | | | | | | | | | | | | | | | | | | | | | | | | | | | | | | | | | | | | | | | | | | | |
| | | | | | | | | | | | | | | | | | | | | | | | | | | | | | | | | | | | | | | | | | | | | | | | |
| | | | | | | | | | | | | | | | | | | | | | | | | | | | | | | | | | | | | | | | | | | | | | | | |
| | | | | | | | | | | | | | | | | | | | | | | | | | | | | | | | | | | | | | | | | | | | | | | | |
| | | | | | | | | | | | | | | | | | | | | | | | | | | | | | | | | | | | | | | | | | | | | | | | |
November 30, 2020
| Fixed rate | | | $ | 1.5 | | | | | 1.6 | | | | | | 1.6 | | | | | | 1.7 | | | | | | 1.8 | | | | | | 48.0 | | | | | | 56.2 | | | | | | 54.1 | | |
| Variable rate | | | $ | 0.1 | | | | | 15.2 | | | | | | 0.1 | | | | | | 0.1 | | | | | | 0.1 | | | | | | 0.8 | | | | | | 16.4 | | | | | | 16.7 | | |
| Average interest rate | | | 2.5 | | % | | | | 6.5 | | % | | | | 2.5 | | % | | | | 2.5 | | % | | | | 2.5 | | % | | | | 2.5 | | % | | | | 6.2 | | % | | | | — | | |
| Fixed rate | | | $ | 139.2 | | | | | 1,805.8 | | | | | | 58.9 | | | | | | 1,518.7 | | | | | | 583.8 | | | | | | 1,672.8 | | | | | | 5,779.2 | | | | | | 6,422.1 | | |
| Variable rate | | | $ | 154.0 | | | | | — | | | | | | — | | | | | | — | | | | | | — | | | | | | — | | | | | | 154.0 | | | | | | 159.7 | | |
| Average interest rate | | | 5.3 | | % | | | | — | | | | | | — | | | | | | — | | | | | | — | | | | | | — | | | | | | 5.3 | | % | | | | — | | |
| Notes and other debts payable: | | | | | | | | | | | | | | | | | | | | | | | | | | | | | | | | | | | | | | | | | | | | | | | |
| Fixed rate | | | $ | — | | | | | — | | | | | | — | | | | | | — | | | | | | — | | | | | | 153.5 | | | | | | 153.5 | | | | | | 154.4 | | |
| Variable rate | | | $ | 1,310.4 | | | | | — | | | | | | — | | | | | | — | | | | | | — | | | | | | — | | | | | | 1,310.4 | | | | | | 1,310.4 | | |
| Average interest rate | | | 2.7 | | % | | | | — | | | | | | — | | | | | | — | | | | | | — | | | | | | — | | | | | | 2.7 | | % | | | | — | | |
| Lennar Other: | | | | | | | | | | | | | | | | | | | | | | | | | | | | | | | | | | | | | | | | | | | | | | | |
| Average interest rate | | | 3.0 | | % | | | | — | | | | | | — | | | | | | — | | | | | | — | | | | | | — | | | | | | 3.0 | | % | | | | — | | |
Item 1. Business
60 rewritten, 62 added, 21 removed, 175 unchanged
We are the largest homebuilder in the United States by [removed: home sale revenues and] net earnings, an originator of residential and commercial mortgage loans, a provider of title insurance and closing services and a developer of multifamily rental properties.
[removed: In addition, we are involved in a venture that will invest in single family rental homes, and we] [added: We also] have [removed: interests] [added: investments] in companies that are engaged in applying technology to improve the homebuilding industry and real estate related aspects of the financial services industry.
Our homebuilding operations are the most substantial part of our business, generating [removed: $21.0] [added: $25.5] billion in revenues, or approximately [removed: 93%] [added: 94%] of consolidated revenues, in fiscal [removed: 2020.][added: 2021.]
As of November 30, [removed: 2020,] [added: 2021,] our reportable homebuilding segments and Homebuilding Other had divisions located in:
West: Arizona, California, Colorado, [added: Idaho,] Nevada, Oregon, Utah and Washington
In fiscal 2020, as the coronavirus ("COVID-19") pandemic caused the shutdown of large portions of our national economy, we accelerated [added: the use of] various technology initiatives that made our home sale process safer, including selling homes virtually or through self-guided tours and digital closings.
We are focused on increasing [removed: the] efficiencies in our building process and reducing selling, general and administrative expenses by using technology, deferring home sale price commitments until construction costs are finalized to protect against [removed: anticipated future] cost escalations and using innovative strategies to reduce customer acquisition costs.
[removed: We also] [added: This will] continue [removed: to focus on divesting non-core assets, possibly including] our [removed: Multifamily platform, and migrating] [added: migration] toward being more of a [removed: pure-play] [added: pure] homebuilding and financial services company.
In addition, we are continuing our pivot to a land light operating model by [removed: controlling the timing of land purchases, reducing our years owned supply of homesites and] increasing the percentage of land controlled through options or agreements versus owned [removed: land.][added: land and controlling the timing of land purchases, which reduce our years supply of owned homesites.]
New home deliveries, including deliveries from unconsolidated entities, were [removed: 52,925] [added: 59,825] in fiscal [removed: 2020,] [added: 2021,] compared to [removed: 51,491] [added: 52,925] in fiscal [removed: 2019] [added: 2020] and [removed: 45,627] [added: 51,491] in fiscal [removed: 2018.][added: 2019.]
For fiscal [removed: 2020,] [added: 2021,] the average sales price, excluding deliveries from unconsolidated entities, was [removed: $395,000,] [added: $424,000,] compared to [removed: $400,000] [added: $395,000] in fiscal [removed: 2019] [added: 2020] and [removed: $413,000] [added: $400,000] in fiscal [removed: 2018.][added: 2019.]
- *Flexible Operating Structure* - Our local operating structure gives us the flexibility to make operating decisions based on local homebuilding conditions and customer preferences, while our centralized management structure provides [added: strategic] oversight for our homebuilding operations.
- *Digital Marketing* \- We are increasingly advertising homes through digital channels, which is significantly increasing the [removed: efficiency] [added: cost effectiveness] of our marketing efforts.
- [removed: *Strategic partners and investments*] [added: *Technology Focused*] \- We partner with and/or invest in technology companies that are looking to improve the homebuilding and financial services industries to [removed: better serve our customers and] increase [removed: efficiencies.][added: efficiencies and create a better customer experience.]
- *Land light strategy* \- We are focused on reducing our years [removed: owned] supply of [added: owned] homesites and increasing the percentage of land [removed: controlled] [added: we control] through options or [added: agreements, including] agreements [added: with strategic land funds,] versus owned land.
- Acquiring land directly from individual land [removed: owners/developers] [added: owners/developers,] or [added: other] homebuilders;
- Acquiring land through option contracts, which generally enables us to control portions of properties owned by third parties (including [added: strategic] land funds) or entities in which we have investments until we have determined whether to exercise the options;
At November 30, [removed: 2020, 39%] [added: 2021, 59%] of our total homesites were controlled through options and joint ventures compared to [removed: 33%] [added: 39%] at November 30, [removed: 2019.][added: 2020.]
At November 30, [removed: 2020,] [added: 2021,] we were actively building and marketing homes in [removed: 1,177] [added: 1,263] communities, including four communities being constructed by unconsolidated entities.
This was [removed: a decrease] [added: an increase] from the [removed: 1,283] [added: 1,177] communities, including [removed: five] [added: four] communities being constructed by unconsolidated entities, in which we were actively building and marketing homes at November 30, [removed: 2019.][added: 2020.]
Although [added: we, like] homebuilders throughout the [removed: country] [added: country,] have [removed: sometimes] encountered shortages of materials and skilled [removed: labor,] [added: labor during 2021, we believe that] because of our size and our builder of choice program, where we work with our trade partners to drive efficiencies, we [added: believe we] have been less affected by these shortages than many of our competitors.
We finance construction and land development activities primarily with cash generated from operations and [added: historically from proceeds of] corporate debt.
[removed: In response to COVID-19, we] [added: We] have [added: also] made it possible for potential homebuyers to take virtual tours of model homes.
We experienced a cancellation rate of [removed: 15%] [added: 10%] in [removed: 2020] [added: 2021] and [removed: 16%] [added: 15%] in [removed: 2019.][added: 2020.]
The backlog dollar value including unconsolidated entities at November 30, [removed: 2020] [added: 2021] was [removed: $7.8] [added: $11.4] billion, compared to [removed: $6.3] [added: $7.8] billion at November 30, [removed: 2019.][added: 2020.]
We expect that a substantial portion of all homes currently in backlog will be delivered in fiscal year [removed: 2021.][added: 2022.]
During fiscal year [removed: 2020,] [added: 2021,] because of the concern about increasing labor and material costs, we, in many instances, deferred entering into contracts to sell homes and committing to the sales price until the costs of the homes were determined, which usually was shortly before construction began.
As of November 30, [removed: 2020] [added: 2021] and [removed: 2019,] [added: 2020,] we had equity investments in [removed: 38] [added: 41] and [removed: 36] [added: 38] active homebuilding and land unconsolidated entities, respectively, in which we were participating, and our maximum recourse debt exposure related to Homebuilding unconsolidated joint ventures was [removed: $4.9] [added: $5.3] million and [removed: $10.8] [added: $4.9] million, respectively.
[removed: FivePoint -] We own an [added: indirect] approximately 40% interest in [removed: FivePoint,] [added: FivePoint Holdings LLC,] which is a publicly traded developer of three large master planned mixed-use developments in California (Newhall Ranch, Great Park Neighborhoods, and [removed: the] San Francisco [removed: Shipyard and Candlestick] [added: Shipyard/Candlestick] Point).
As of November 30, [removed: 2020,] [added: 2021,] the carrying amount of our investment in FivePoint was [removed: $392.1] [added: $381.6] million.
We offer conforming conventional, FHA-insured and VA-guaranteed residential mortgage loan products and other home mortgage products primarily to buyers of our homes through our financial services subsidiary, Lennar [removed: Mortgage (formerly Eagle Home] Mortgage, [removed: LLC),] from locations in most of the states in which we have homebuilding operations.
In fiscal year [removed: 2020,] [added: 2021,] our financial services subsidiaries provided loans to [removed: 80%] [added: 75%] of our homebuyers who obtained mortgage financing in areas where we offered services.
During fiscal year [removed: 2020,] [added: 2021,] we originated approximately [removed: 40,000] [added: 38,100] residential mortgage loans totaling [removed: $12.9] [added: $13.2] billion, compared to [removed: 34,800] [added: 40,000] residential mortgage loans totaling [removed: $10.9] [added: $12.9] billion during fiscal year [removed: 2019.][added: 2020.]
At November 30, [removed: 2020,] [added: 2021,] Financial Services had four warehouse residential facilities maturing at various dates through fiscal [removed: 2021] [added: 2022] with a total maximum borrowing capacity of [removed: $1.8] [added: $2.3] billion including an uncommitted amount of [removed: $700 million.][added: $1.1 billion.]
This new technology has [removed: also] made the mortgage financing [added: process easier for homebuyers and improved the customer experience.]
[removed: In response to COVID-19, this] [added: This] new technology has also enabled us to increase the number of digital closings, with digital document signing and where possible digital notarization.
In order to finance LMF Commercial lending activities, as of November 30, [removed: 2020,] [added: 2021,] LMF Commercial had [removed: five] [added: four] warehouse repurchase financing agreements maturing between December [removed: 2020 and December] 2021 [added: and July 2023] with commitments totaling [removed: $800 million, which includes $50 million for floating rate loans.][added: $550 million.]
At November 30, [removed: 2020,] [added: 2021,] it had interests in [removed: 65] [added: 66] communities with development costs of approximately [removed: $7.8] [added: $7.9] billion, of which [removed: 34] [added: 43] communities were completed and operating, [removed: seven] [added: six] communities were partially completed and [removed: leasing, 21 communities were under construction] [added: leasing] and [removed: the remaining] [added: 17] communities were [removed: owned by the joint ventures.][added: under construction.]
As of November 30, [removed: 2020,] [added: 2021,] our Multifamily segment also had a pipeline of potential future projects, which were under contract or had letters of intent, totaling approximately [removed: $4.7] [added: $8.5] billion in anticipated development costs across a number of states that will be developed primarily by unconsolidated entities.
Our Multifamily segment had equity investments in [removed: 22] [added: 17] and [removed: 19] [added: 22] unconsolidated entities (including the Multifamily Ventures, described below) as of November 30, [removed: 2020] [added: 2021] and [removed: 2019,] [added: 2020,] respectively.
In addition, we are a sponsor and manager of funds engaged in development and ownership of multifamily rental properties and a sponsor and manager of a fund engaged in ownership of single family rental properties.
Other: Urban divisions and other homebuilding related investments primarily in California, including Five Point Holdings, LLC ("FivePoint")
As a robust housing market took shape in the second half of 2020 and throughout 2021, technology initiatives helped us meet strong housing demand and reduce our marketing and other selling costs.
We also continue to focus on divesting non-core assets through a planned spin-off to our stockholders of our Multifamily and single-family home rental platforms and some investment assets.
Even though our community count increased in 2021, the number of homes we built was limited by shortages of both construction materials and skilled labor.
Single Family Rental Operations
In the first quarter of 2021, the Company formed the Upward America Venture (“Upward America”), and is managing and participating in Upward America.
Upward America is an investment fund that acquires new single-family homes in high growth markets across the United States and rents them to the people who will live in them.
Upward America has raised equity commitments totaling $1.25 billion primarily from institutional investors, including $125 million committed by Lennar.
By leveraging these equity investments, Upward America will be positioned to acquire over $4.0 billion of new single-family homes and townhomes from Lennar and potentially other homebuilders.
During the year ended November 30, 2021, Lennar delivered 1,457 homes to Upward America.
Subsequent to November 30, 2021, the equity commitments were increased to $1.6 billion.
FivePoint Holdings LLC
Until recently, we had no role in the management of FivePoint, except that our Executive Chairman was a member of its Board.
However, in August 2021, our Executive Chairman became the non-employee Executive Chairman of the Board of Directors (but not the chief executive officer) of FivePoint.
We are licensed to provide title insurance and closing services for residential and/or commercial transactions in 38 states to our homebuyers and others.
During 2021 and 2020, we closed approximately 67,500 and 61,100 real estate transactions, respectively, in 18 states.
The loans generally are between $5 million and $50 million each.
Six of the companies in which we have strategic investments are publicly traded.
They are:
- Blend, a company that is a digital lending platform developer simplifying and fast tracking the consumer finance process;
- Doma, a company that built a predictive analytics platform for title insurers;
- Hippo, a company that provides an efficient means of obtaining home insurance;
- Opendoor, a company that uses technology to significantly streamline the homebuying and selling process;
- SmartRent, an enterprise smart home automation company; and
- Sunnova, a leading national residential solar company, to which during 2021 we sold our solar business in return for equity.
Each of the investments listed above, except Doma, is reflected in our financial statements at fair value, with changes to the fair values of those investments generating gains or losses on our quarterly financial statements.
Doma is accounted for using the equity method.
At November 30, 2021, the book value (including those recorded at fair value) of our investment in strategic technology investments was $1.2 billion and is included in our Lennar Other segment,
We sold the Rialto Management Group on November 30, 2018.
- Our consumer insight capabilities allows us to continually stay tapped into consumer preferences and feedback so we can continuously evolve and fine-tune our offerings, processes and communications for our Customers;
- Our builder of choice program through which we maximize the efficiency of our suppliers' dealing with us;
- Strategic investments in technology initiatives through our LENX business that help us enhance the homebuying and home ownership experience, and helps us stay at the forefront of homebuilding innovation.
Competition is based
Our single family home rental fund competes with other single family home rental developers and operators, including REITs, across the United States.
In addition, our single family home rental operations compete with a variety of investment vehicles in securing capital, partners and equity, and compete in securing tenants with the large supply of already existing single family rental homes as well as with sellers of homes.
Principal competitive factors include location, rental price and quality, and management of the homes.
The COVID-19 pandemic has slowed down the approval process in many government offices, which has in many instances delayed our being able to begin constructing homes in particular communities.
Environment
We are focused on creating environmentally sustainable products, and our purchasing power enables us to include green features in our homes.
Other: Urban divisions
As a robust housing market took shape, technology initiatives also helped meet strong housing demand.
This included entering into arrangements in which third parties or joint ventures will purchase land we designate and give us options to purchase the land in the future.
Shortly after the end of fiscal 2020, we entered into a venture that will invest in single family rental homes.
During 2020, we emphasized communities that targeted first time homebuyers, many of whom were moving out of urban locations in response to the COVID-19 pandemic.
The decrease was the result of accelerated sales pace and deliveries as well as a result of delayed openings due to the COVID-19 pandemic.
We anticipate the community count will increase by about 10% in fiscal 2021.
We believe that the current availability of raw materials and labor to our subcontractors are in most locations adequate for our planned levels of operation.
Our Executive Chairman is a director of FivePoint.
Solar Business
Our solar business is focused on providing homeowners the ability to purchase or lease solar power systems that generate much of a home's annual expected energy needs.
In fiscal 2020, our solar business operated in California, Colorado, Florida, Maryland, Nevada, South Carolina, and Texas.
This has reduced our origination costs from approximately $8,400 and $5,600 per loan in the fourth quarters of 2018 and 2019, respectively, to approximately $5,500 per loan in the fourth quarter of 2020.
process easier for homebuyers and improved the customer experience.
During 2020, we provided title insurance and closing services to our homebuyers and others in approximately 61,100 real estate transactions in 34 states, through Lennar Title (formerly CalAtlantic Title) compared to approximately 59,700 real estate transactions during 2019.
Our strategic investments include, among others, Opendoor, a company that uses technology to streamline the home buying and selling process; Blend, a company that provides a digital mortgage application platform; Hippo Analytics, a company that provides home insurance in a more efficient and effective way; States Title, a company that built a predictive analytics platform for title insurers; and Notarize, a company that provides online notarizations.
At November 30, 2020, our investment in strategic technology ventures was $324.0 million, which was included in our Lennar Other and Financial Services segments.
In December 2020, one of our strategic investments, Opendoor, began trading on the Nasdaq stock market for which we expect to record a significant unrealized gain in the first quarter of fiscal 2021.
that totaled $190.4 million as of November 30, 2020, and are committed to invest as much as an additional $3.3 million in Rialto funds.
For example, the
And it includes the many people who are
An excerpt. Shown here: 40 of 60 rewritten, 40 of 62 added and all 21 removed. The counts are complete. For every sentence, read Item 1. Business in the FY2021 filing and the FY2020 filing.
Item 3. Legal Proceedings.
2 rewritten, 1 added, 1 removed, 9 unchanged
The costs incurred by us in construction defect lawsuits may be offset by warranty reserves, our third-party insurers, [removed: subcontractor insurers or indemnity contributions from subcontractors.]
[added: From] time-to-time, we also receive notices from environmental agencies or other regulators regarding alleged violations of environmental or other laws.
subcontractor insurers or indemnity contributions from subcontractors.
From
Cover and table of contents
27 rewritten, 3 added, 2 removed, 63 unchanged
For the fiscal year ended November 30, [removed: 2020][added: 2021]
[removed: ][added: ]
The aggregate market value of the registrant’s Class A and Class B common stock held by non-affiliates of the registrant [removed: (269,292,989] [added: (269,686,027] shares of Class A common stock and [removed: 15,605,760] [added: 15,620,380] shares of Class B common stock) as of May 31, [removed: 2020,] [added: 2021,] based on the closing sale price per share as reported by the New York Stock Exchange on such date, was [removed: $16,947,808,831.][added: $27,924,845,491.]
As of December 31, [removed: 2020,] [added: 2021,] the registrant had outstanding [removed: 275,059,914] [added: 261,373,994] shares of Class A common stock and [removed: 37,621,152] [added: 37,505,788] shares of Class B common stock.
| III | | | Definitive Proxy Statement to be filed pursuant to Regulation 14A on or before March 30, [removed: 2021.] [added: 2022.] | | |
| For the fiscal year ended November 30, [removed: 2020] [added: 2021] | | | | | | | | | | | | | | |
| Item 1. | | | | | | [removed: [Business](#i76704f6d0160463182f284ca8d043a7a_13)] [added: [Business](#if8875ebc30f5446fa24ed9be199539fa_13)] | | | | | | [removed: [1](#i76704f6d0160463182f284ca8d043a7a_13)] [added: [1](#if8875ebc30f5446fa24ed9be199539fa_13)] | | |
| Item 1A. | | | | | | [Risk [removed: Factors](#i76704f6d0160463182f284ca8d043a7a_19)] [added: Factors](#if8875ebc30f5446fa24ed9be199539fa_19)] | | | | | | [removed: [8](#i76704f6d0160463182f284ca8d043a7a_19)] [added: [9](#if8875ebc30f5446fa24ed9be199539fa_19)] | | |
| Item 1B. | | | | | | [Unresolved Staff [removed: Comments](#i76704f6d0160463182f284ca8d043a7a_22)] [added: Comments](#if8875ebc30f5446fa24ed9be199539fa_22)] | | | | | | [removed: [17](#i76704f6d0160463182f284ca8d043a7a_22)] [added: [19](#if8875ebc30f5446fa24ed9be199539fa_22)] | | |
| Item 2. | | | | | | [removed: [Properties](#i76704f6d0160463182f284ca8d043a7a_25)] [added: [Properties](#if8875ebc30f5446fa24ed9be199539fa_25)] | | | | | | [removed: [17](#i76704f6d0160463182f284ca8d043a7a_25)] [added: [19](#if8875ebc30f5446fa24ed9be199539fa_25)] | | |
| Item 3. | | | | | | [Legal [removed: Proceedings](#i76704f6d0160463182f284ca8d043a7a_28)] [added: Proceedings](#if8875ebc30f5446fa24ed9be199539fa_28)] | | | | | | [removed: [17](#i76704f6d0160463182f284ca8d043a7a_28)] [added: [19](#if8875ebc30f5446fa24ed9be199539fa_28)] | | |
| Item 4. | | | | | | [Mine Safety [removed: Disclosures](#i76704f6d0160463182f284ca8d043a7a_31)] [added: Disclosures](#if8875ebc30f5446fa24ed9be199539fa_31)] | | | | | | [removed: [18](#i76704f6d0160463182f284ca8d043a7a_31)] [added: [20](#if8875ebc30f5446fa24ed9be199539fa_31)] | | |
| Item 5. | | | | | | [Market for Registrant's Common Equity, Related Stockholder Matters and Issuer Purchases of Equity [removed: Securities](#i76704f6d0160463182f284ca8d043a7a_37)] [added: Securities](#if8875ebc30f5446fa24ed9be199539fa_37)] | | | | | | [removed: [18](#i76704f6d0160463182f284ca8d043a7a_37)] [added: [20](#if8875ebc30f5446fa24ed9be199539fa_37)] | | |
| Item 7. | | | | | | [Management's Discussion and Analysis of Financial Condition and Results of [removed: Operations](#i76704f6d0160463182f284ca8d043a7a_43)] [added: Operations](#if8875ebc30f5446fa24ed9be199539fa_43)] | | | | | | [removed: [21](#i76704f6d0160463182f284ca8d043a7a_43)] [added: [22](#if8875ebc30f5446fa24ed9be199539fa_43)] | | |
| Item 7A. | | | | | | [Quantitative and Qualitative Disclosures About Market [removed: Risk](#i76704f6d0160463182f284ca8d043a7a_118)] [added: Risk](#if8875ebc30f5446fa24ed9be199539fa_121)] | | | | | | [removed: [40](#i76704f6d0160463182f284ca8d043a7a_118)] [added: [40](#if8875ebc30f5446fa24ed9be199539fa_121)] | | |
| Item 8. | | | | | | [Financial Statements and Supplementary [removed: Data](#i76704f6d0160463182f284ca8d043a7a_121)] [added: Data](#if8875ebc30f5446fa24ed9be199539fa_124)] | | | | | | [removed: [42](#i76704f6d0160463182f284ca8d043a7a_121)] [added: [42](#if8875ebc30f5446fa24ed9be199539fa_124)] | | |
| Item 9. | | | | | | [Changes in and Disagreements with Accountants on Accounting and Financial [removed: Disclosure](#i76704f6d0160463182f284ca8d043a7a_238)] [added: Disclosure](#if8875ebc30f5446fa24ed9be199539fa_232)] | | | | | | [removed: [78](#i76704f6d0160463182f284ca8d043a7a_238)] [added: [78](#if8875ebc30f5446fa24ed9be199539fa_232)] | | |
| Item 9A. | | | | | | [Controls and [removed: Procedures](#i76704f6d0160463182f284ca8d043a7a_241)] [added: Procedures](#if8875ebc30f5446fa24ed9be199539fa_235)] | | | | | | [removed: [78](#i76704f6d0160463182f284ca8d043a7a_241)] [added: [79](#if8875ebc30f5446fa24ed9be199539fa_235)] | | |
| Item 9B. | | | | | | [Other [removed: Information](#i76704f6d0160463182f284ca8d043a7a_247)] [added: Information](#if8875ebc30f5446fa24ed9be199539fa_241)] | | | | | | [removed: [80](#i76704f6d0160463182f284ca8d043a7a_247)] [added: [81](#if8875ebc30f5446fa24ed9be199539fa_241)] | | |
| Item 10. | | | | | | [Directors, Executive Officers and Corporate [removed: Governance](#i76704f6d0160463182f284ca8d043a7a_253)] [added: Governance](#if8875ebc30f5446fa24ed9be199539fa_247)] | | | | | | [removed: [80](#i76704f6d0160463182f284ca8d043a7a_253)] [added: [81](#if8875ebc30f5446fa24ed9be199539fa_247)] | | |
| Item 11. | | | | | | [Executive [removed: Compensation](#i76704f6d0160463182f284ca8d043a7a_256)] [added: Compensation](#if8875ebc30f5446fa24ed9be199539fa_250)] | | | | | | [removed: [80](#i76704f6d0160463182f284ca8d043a7a_256)] [added: [81](#if8875ebc30f5446fa24ed9be199539fa_250)] | | |
| Item 12. | | | | | | [Security Ownership of Certain Beneficial Owners and Management and Related Stockholder [removed: Matters](#i76704f6d0160463182f284ca8d043a7a_259)] [added: Matters](#if8875ebc30f5446fa24ed9be199539fa_253)] | | | | | | [removed: [80](#i76704f6d0160463182f284ca8d043a7a_259)] [added: [81](#if8875ebc30f5446fa24ed9be199539fa_253)] | | |
| Item 13. | | | | | | [Certain Relationships and Related Transactions, and Director [removed: Independence](#i76704f6d0160463182f284ca8d043a7a_262)] [added: Independence](#if8875ebc30f5446fa24ed9be199539fa_256)] | | | | | | [removed: [80](#i76704f6d0160463182f284ca8d043a7a_262)] [added: [81](#if8875ebc30f5446fa24ed9be199539fa_256)] | | |
| Item 14. | | | | | | [Principal Accounting Fees and [removed: Services](#i76704f6d0160463182f284ca8d043a7a_265)] [added: Services](#if8875ebc30f5446fa24ed9be199539fa_259)] | | | | | | [removed: [80](#i76704f6d0160463182f284ca8d043a7a_265)] [added: [81](#if8875ebc30f5446fa24ed9be199539fa_259)] | | |
| Item 15. | | | | | | [removed: [Exhibits,] [added: [Exhibit and] Financial Statement [removed: Schedules](#i76704f6d0160463182f284ca8d043a7a_271)] [added: Schedules](#if8875ebc30f5446fa24ed9be199539fa_265)] | | | | | | [removed: [81](#i76704f6d0160463182f284ca8d043a7a_271)] [added: [82](#if8875ebc30f5446fa24ed9be199539fa_265)] | | |
| Item 16. | | | | | | [Form 10-K [removed: Summary](#i76704f6d0160463182f284ca8d043a7a_277)] [added: Summary](#if8875ebc30f5446fa24ed9be199539fa_271)] | | | | | | [removed: [83](#i76704f6d0160463182f284ca8d043a7a_277)] [added: [84](#if8875ebc30f5446fa24ed9be199539fa_271)] | | |
| Financial Statement Schedule | | | | | | | | | | | | [removed: [87](#i76704f6d0160463182f284ca8d043a7a_286)] [added: [87](#if8875ebc30f5446fa24ed9be199539fa_280)] | | |
| Item 6. | | | | | | [Reserved](#if8875ebc30f5446fa24ed9be199539fa_40) | | | | | | [21](#if8875ebc30f5446fa24ed9be199539fa_40) | | |
| Item 9C. | | | | | | [Disclosure Regarding Foreign Jurisdictions that Prevent Inspections](#if8875ebc30f5446fa24ed9be199539fa_2384) | | | | | | [81](#if8875ebc30f5446fa24ed9be199539fa_2384) | | |
| Signatures | | | | | | | | | | | | [85](#if8875ebc30f5446fa24ed9be199539fa_274) | | |
| Item 6. | | | | | | [Selected Financial Data](#i76704f6d0160463182f284ca8d043a7a_40) | | | | | | [20](#i76704f6d0160463182f284ca8d043a7a_40) | | |
| Signatures | | | | | | | | | | | | [84](#i76704f6d0160463182f284ca8d043a7a_280) | | |
Item 1B. Unresolved Staff Comments.
9 rewritten, 0 added, 0 removed, 23 unchanged
The following individuals are our executive officers as of January [removed: 22, 2021:][added: 28, 2022:]
| Stuart Miller | | | Executive Chairman | | | [removed: 63] [added: 64] | | |
| Rick Beckwitt | | | Co-Chief Executive Officer and Co-President | | | [removed: 61] [added: 62] | | |
| Jonathan M. Jaffe | | | Co-Chief Executive Officer and Co-President | | | [removed: 61] [added: 62] | | |
| Diane J. Bessette | | | Vice President, Chief Financial Officer and Treasurer | | | [removed: 60] [added: 61] | | |
| Mark Sustana | | | Vice President, General Counsel and Secretary | | | [removed: 59] [added: 60] | | |
| David M. Collins | | | Vice President and Controller | | | [removed: 51] [added: 52] | | |
| Jeff J. McCall | | | Executive Vice President | | | [removed: 49] [added: 50] | | |
Mr. Miller also serves [added: as non-employee Executive Chairman] on the Board of Directors of Five Point Holdings, [removed: LLC.][added: LLC and a member of the Board of Directors of Doma Holdings, Inc.]
Item 5. Market for Registrant’s Common Equity, Related Stockholder Matters and Issuer Purchases of Equity Securities.
11 rewritten, 8 added, 5 removed, 10 unchanged
As of December 31, [removed: 2020,] [added: 2021,] the last reported sale price of our Class A and Class B common stock on the NYSE was [removed: $76.23] [added: $116.16] and [removed: $61.20,] [added: $95.62,] respectively.
As of December 31, [removed: 2020,] [added: 2021,] there were approximately [removed: 1,736] [added: 1,629] and [removed: 876] [added: 844] holders of record of our Class A and Class B common stock, respectively.
On January [removed: 14, 2021,] [added: 12, 2022,] our Board of Directors [removed: declared] [added: increased the annual dividend rate to $1.50 per share, resulting in] a quarterly cash dividend of [removed: $0.25] [added: $0.375] per share on both our Class A and Class B common [removed: stock, payable on February 12, 2021 to holders of record at the close of business on January 29, 2021.][added: stock.]
The following table provides information about our repurchases of common stock during the three months ended November 30, [removed: 2020:][added: 2021:]
(2)In January [removed: 2019,] [added: 2021,] our Board of Directors authorized a stock repurchase program, [added: which replaced a January 2019 stock repurchase program,] under which we [removed: are] [added: were] authorized to purchase up to the lesser of $1.0 billion in value, [added: excluding commission,] or 25 million in shares, of our outstanding Class A or Class B common stock.
[removed: Subsequent to November 30, 2020, our] [added: In October 2021, the] Board of Directors authorized [removed: a stock repurchase program, which replaced] [added: an increase to] the [removed: January 2019] stock repurchase [removed: program, under which we are authorized] [added: program] to [removed: purchase] [added: enable us to repurchase] up to the lesser of [removed: $1] [added: an additional $1.0] billion in value, [added: excluding commission,] or 25 million [removed: in shares] [added: shares,] of our outstanding Class A or Class B common stock.
The graph assumes $100 invested on November 30, [removed: 2015] [added: 2016] in our Class A common stock, the Dow Jones U.S. Home Construction Index and the Dow Jones U.S. Total Market Index, and the reinvestment of all dividends.
[removed: 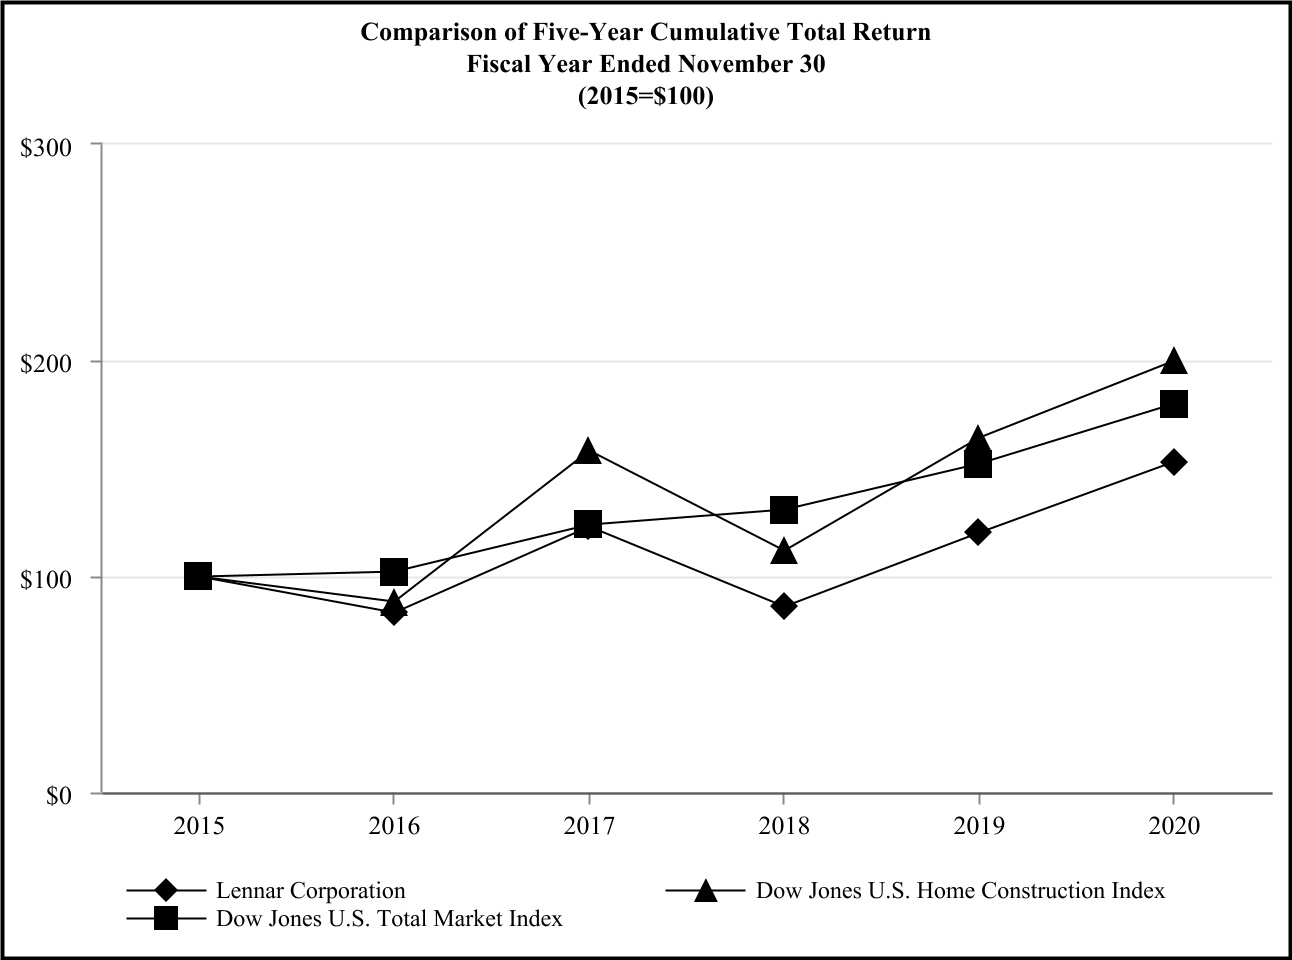][added: ]
| | | | [removed: 2015] [added: 2016] | | | | | | [removed: 2016] [added: 2017] | | | | | | [removed: 2017] [added: 2018] | | | | | | [removed: 2018] [added: 2019] | | | | | | [removed: 2019] [added: 2020] | | | | | | [removed: 2020] [added: 2021] | | |
| Dow Jones U.S. Home Construction Index | | | $ | 100 | | | | | [removed: 88] [added: 179] | | | | | | [removed: 158] [added: 127] | | | | | | [removed: 112] [added: 186] | | | | | | [removed: 164] [added: 227] | | | | | | [removed: 200] [added: 318] | | |
| Dow Jones U.S. Total Market Index | | | $ | 100 | | | | | 102 | | | | | | [removed: 124] [added: 107] | | | | | | [removed: 131] [added: 124] | | | | | | [removed: 152] [added: 147] | | | | | | [removed: 180] [added: 186] | | |
The dividend is payable on February 10, 2022 to holders of record at the close of business on January 27, 2022.
| September 1 to September 30, 2021 | | | 1,245,420 | | | | | | $ | 98.61 | | | | | 1,245,000 | | | | | | 19,745,000 | | |
| October 1 to October 31, 2021 | | | 7,466,076 | | | | | | $ | 96.56 | | | | | 7,466,076 | | | | | | 22,697,884 | | |
| November 1 to November 30, 2021 | | | 1,289,481 | | | | | | $ | 103.74 | | | | | 1,288,924 | | | | | | 21,408,960 | | |
The repurchase authority had no expiration date.
The repurchase authority has no expiration date.
Shortly after the new authorization, the January 2021 stock repurchase program was completed as we had purchased the $1.0 billion in value authorized under that stock repurchase program.
| Lennar Corporation | | | $ | 100 | | | | | 148 | | | | | | 103 | | | | | | 144 | | | | | | 183 | | | | | | 256 | | |
| September 1 to September 30, 2020 | | | — | | | | | | $ | — | | | | | — | | | | | | 10,860,271 | | |
| October 1 to October 31, 2020 | | | — | | | | | | $ | — | | | | | — | | | | | | 10,860,271 | | |
| November 1 to November 30, 2020 | | | 12,407 | | | | | | $ | 77.92 | | | | | — | | | | | | 10,860,271 | | |
This repurchase authorization has no expiration.
| Lennar Corporation | | | $ | 100 | | | | | 83 | | | | | | 123 | | | | | | 86 | | | | | | 120 | | | | | | 153 | | |
Item 6. Reserved.
0 rewritten, 0 added, 41 removed, 0 unchanged
The following table sets forth our selected consolidated financial and operating information as of or for each of the years ended November 30, 2016 through 2020.
The information presented below is based upon our historical financial statements.
| | | | | | | | | | | | | | | | | | | | | | | | | | | | | | |
| --- | --- | --- | --- | --- | --- | --- | --- | --- | --- | --- | --- | --- | --- | --- | --- | --- | --- | --- | --- | --- | --- | --- | --- | --- | --- | --- | --- | --- | --- |
| | | | As of or for the Years Ended November 30, | | | | | | | | | | | | | | | | | | | | | | | | | | |
| (Dollars in thousands, except per share amounts) | | | 2020 | | | | | | 2019 | | | | | | 2018 | | | | | | 2017 | | | | | | 2016 | | |
| Results of Operations: | | | | | | | | | | | | | | | | | | | | | | | | | | | | | |
| Revenues: | | | | | | | | | | | | | | | | | | | | | | | | | | | | | |
| Homebuilding | | | $ | 20,981,136 | | | | | 20,793,216 | | | | | | 19,077,597 | | | | | | 11,188,876 | | | | | | 9,741,337 | | |
| Financial Services | | | $ | 890,311 | | | | | 824,810 | | | | | | 954,631 | | | | | | 891,957 | | | | | | 809,694 | | |
| Multifamily | | | $ | 576,328 | | | | | 604,700 | | | | | | 421,132 | | | | | | 394,771 | | | | | | 287,441 | | |
| Lennar Other | | | $ | 41,079 | | | | | 36,835 | | | | | | 118,271 | | | | | | 170,761 | | | | | | 111,527 | | |
| Total revenues | | | $ | 22,488,854 | | | | | 22,259,561 | | | | | | 20,571,631 | | | | | | 12,646,365 | | | | | | 10,949,999 | | |
| Operating earnings (loss): | | | | | | | | | | | | | | | | | | | | | | | | | | | | | |
| Homebuilding | | | $ | 2,988,907 | | | | | 2,502,905 | | | | | | 2,254,487 | | | | | | 1,264,394 | | | | | | 1,344,740 | | |
| Financial Services | | | $ | 480,952 | | | | | 224,642 | | | | | | 199,716 | | | | | | 195,307 | | | | | | 207,439 | | |
| Multifamily | | | $ | 22,681 | | | | | 16,390 | | | | | | 42,695 | | | | | | 73,432 | | | | | | 71,174 | | |
| Lennar Other | | | $ | (10,334) | | | | | 31,469 | | | | | | (33,707) | | | | | | (57,633) | | | | | | (60,322) | | |
| Gain on sale of Rialto investment and asset management platform | | | $ | — | | | | | — | | | | | | 296,407 | | | | | | — | | | | | | — | | |
| Acquisition and integration costs related to CalAtlantic | | | $ | — | | | | | — | | | | | | 152,980 | | | | | | — | | | | | | — | | |
| Corporate general and administrative expenses | | | $ | 358,418 | | | | | 341,114 | | | | | | 343,934 | | | | | | 285,889 | | | | | | 232,562 | | |
| Earnings before income taxes | | | $ | 3,123,788 | | | | | 2,434,292 | | | | | | 2,262,684 | | | | | | 1,189,611 | | | | | | 1,330,469 | | |
| Net earnings attributable to Lennar | | | $ | 2,465,036 | | | | | 1,849,052 | | | | | | 1,695,831 | | | | | | 810,480 | | | | | | 911,844 | | |
| Diluted earnings per share | | | $ | 7.85 | | | | | 5.74 | | | | | | 5.44 | | | | | | 3.38 | | | | | | 3.86 | | |
| Cash dividends declared per each - Class A and Class B common stock | | | $ | 0.625 | | | | | 0.16 | | | | | | 0.16 | | | | | | 0.16 | | | | | | 0.16 | | |
| Financial Position: | | | | | | | | | | | | | | | | | | | | | | | | | | | | | |
| Total assets | | | $ | 29,935,177 | | | | | 29,359,511 | | | | | | 28,566,181 | | | | | | 18,745,034 | | | | | | 15,361,781 | | |
| Debt: | | | | | | | | | | | | | | | | | | | | | | | | | | | | | |
| Homebuilding | | | $ | 5,955,758 | | | | | 7,776,638 | | | | | | 8,543,868 | | | | | | 6,410,003 | | | | | | 4,575,977 | | |
| Financial Services | | | $ | 1,463,919 | | | | | 1,745,755 | | | | | | 1,558,702 | | | | | | 1,191,344 | | | | | | 1,300,704 | | |
| Lennar Other | | | $ | 1,906 | | | | | 15,178 | | | | | | 14,488 | | | | | | 371,168 | | | | | | 398,859 | | |
| Multifamily | | | $ | — | | | | | 36,125 | | | | | | — | | | | | | — | | | | | | — | | |
| Stockholders’ equity | | | $ | 17,994,856 | | | | | 15,949,517 | | | | | | 14,581,535 | | | | | | 7,872,317 | | | | | | 7,026,042 | | |
| Total equity | | | $ | 18,099,401 | | | | | 16,033,830 | | | | | | 14,682,957 | | | | | | 7,986,132 | | | | | | 7,211,567 | | |
| Shares outstanding (000s) | | | 312,699 | | | | | | 315,893 | | | | | | 324,238 | | | | | | 239,964 | | | | | | 239,133 | | |
| Stockholders’ equity per share | | | $ | 57.55 | | | | | 50.49 | | | | | | 44.97 | | | | | | 32.81 | | | | | | 29.38 | | |
| Homebuilding Data (including unconsolidated entities): | | | | | | | | | | | | | | | | | | | | | | | | | | | | | |
| Number of homes delivered | | | 52,925 | | | | | | 51,491 | | | | | | 45,627 | | | | | | 29,394 | | | | | | 26,563 | | |
| New orders | | | 56,169 | | | | | | 51,439 | | | | | | 45,826 | | | | | | 30,348 | | | | | | 27,372 | | |
| Backlog of home sales contracts | | | 18,821 | | | | | | 15,577 | | | | | | 15,616 | | | | | | 8,935 | | | | | | 7,623 | | |
An excerpt. Shown here: all 0 rewritten, all 0 added and 40 of 41 removed. The counts are complete. For every sentence, read Item 6. Reserved. in the FY2021 filing and the FY2020 filing.
Item 8. Financial Statements and Supplementary Data.
491 rewritten, 281 added, 224 removed, 926 unchanged
We have audited the accompanying consolidated balance sheets of Lennar Corporation and subsidiaries (the "Company") as of November 30, [removed: 2020] [added: 2021] and [removed: 2019,] [added: 2020,] the related consolidated statements of operations and comprehensive income (loss), stockholders' equity, and cash flows, for each of the three years in the period ended November 30, [removed: 2020,] [added: 2021,] and the related notes [added: and the financial statement schedule listed in the Index at Item 15] (collectively referred to as the "consolidated financial statements").
In our opinion, the consolidated financial statements present fairly, in all material respects, the financial position of the Company as of November 30, [removed: 2020] [added: 2021] and [removed: 2019,] [added: 2020,] and the results of its operations and its cash flows for each of the three years in the period ended November 30, [removed: 2020,] [added: 2021,] in conformity with accounting principles generally accepted in the United States of America.
We have also audited, in accordance with the standards of the Public Company Accounting Oversight Board (United States) (PCAOB), the Company's internal control over financial reporting as of November 30, [removed: 2020,] [added: 2021,] based on criteria established in *Internal Control - Integrated Framework (2013)* issued by the Committee of Sponsoring Organizations of the Treadway Commission and our report dated January [removed: 22, 2021,] [added: 28, 2022,] expressed an unqualified opinion on the Company's internal control over financial reporting.
The communication of critical audit matter does not alter in any way our opinion on the financial statements, taken as a whole, and we are not, by communicating the critical audit matter below, providing [removed: a] separate opinion on the critical audit matter or on the accounts or disclosures to which it relates.
As of November 30, [removed: 2020,] [added: 2021,] the carrying value of the Company’s consolidated VIE’s assets and non-recourse liabilities was [removed: $1.1 billion] [added: $875.9 million] and [removed: $528.5] [added: $61.9] million, respectively.
Additionally, [removed: at] [added: as of] November 30, [removed: 2020,] [added: 2021,] the carrying value of the Company’s investments in VIEs that are unconsolidated was [removed: $949.4] [added: $686.7] million.
We identified the consolidation and primary beneficiary assessment upon formation and [added: the occurrence of] reconsideration events of [removed: some] [added: certain] of the Company’s [removed: VIE’s] [added: VIEs] as a critical audit matter given the significant judgment required by management.
◦Evaluating the evidence obtained in other areas of the audit to determine if there were additional reconsideration events that had not been identified by the Company, including, among others, reading joint venture board minutes and [removed: confirming] [added: agreeing] the terms of certain joint venture agreements and side agreements, if any.
November 30, [removed: 2020] [added: 2021] and [removed: 2019][added: 2020]
| | | | [removed: 2020 (1)] [added: 2021] | | | | | | [removed: 2019 (1)] [added: 2020] | | | [added: | | | 2019 | | |]
| Cash and cash equivalents | | | $ | [removed: 2,703,986] [added: 2,735,213] | | | | | [removed: 1,200,832] [added: 2,703,986] | | |
| [removed: Restricted] [added: Homebuilding restricted] cash | | | [removed: 15,211] [added: 21,927] | | | | | | [added: 15,211 | | | | | |] 9,698 | | |
| Receivables, net | | | [removed: 298,671] [added: 490,278] | | | | | | [removed: 329,124] [added: 298,671] | | |
| Finished homes and construction in progress | | | [removed: 8,593,399] [added: 10,446,139] | | | | | | [removed: 9,195,721] [added: 8,593,399] | | |
| Land and land under development | | | [removed: 7,495,262] [added: 7,108,142] | | | | | | [removed: 8,267,647] [added: 7,495,262] | | |
| Consolidated inventory not owned | | | [removed: 836,567] [added: 1,161,023] | | | | | | [removed: 313,139] [added: 836,567] | | |
| Total inventories | | | [removed: 16,925,228] [added: 18,715,304] | | | | | | [removed: 17,776,507] [added: 16,925,228] | | |
| Investments in unconsolidated entities | | | [removed: 953,177] [added: 972,084] | | | | | | [removed: 1,009,035] [added: 953,177] | | |
| Other assets | | | [removed: 1,190,793] [added: 1,090,654] | | | | | | [removed: 1,021,684] [added: 1,190,793] | | |
| [removed: Financial Services] [added: Financial Services] | | | [removed: 2,776,987] [added: (1,431)] | | | | | | [removed: 3,006,024] [added: 1,024] | | |
| Multifamily | | | [removed: 1,175,908] [added: 1,311,747] | | | | | | [removed: 1,068,831] [added: 1,175,908] | | |
| Total assets | | | $ | [removed: 29,935,177] [added: 33,207,778] | | | | | [removed: 29,359,511] [added: 29,935,177] | | |
As of November 30, 2020, total assets include $1.1 billion related to consolidated VIEs of which $32.1 million is included in Homebuilding cash and cash equivalents, $0.1 million in Homebuilding receivables, net, $14.2 million in Homebuilding finished homes and construction in progress, $486.8 million in Homebuilding land and land under development, $426.3 million in Homebuilding consolidated inventory not owned, $1.6 million in Homebuilding investments in unconsolidated entities, [removed: $110.3 million in Homebuilding operating properties and equipment, $10.4] [added: $120.6] million in Homebuilding other assets and $39.9 million in Multifamily assets.
As of November 30, [removed: 2019,] [added: 2021,] total assets include [removed: $980.2 million] [added: $1.1 billion] related to consolidated VIEs of which [removed: $15.5] [added: $60.9] million is included in Homebuilding cash and cash equivalents, [removed: $0.2] [added: $4.4] million in Homebuilding receivables, net, [removed: $97.5] [added: $14.3] million in Homebuilding finished homes and construction in progress, [removed: $283.2] [added: $697.1] million in Homebuilding land and land under development, [removed: $301.0] [added: $239.2] million in Homebuilding consolidated inventory not owned, [removed: $2.5] [added: $1.1] million in Homebuilding investments in unconsolidated entities, [removed: $10.0] [added: $17.4] million in Homebuilding other [removed: assets, $221.2 million in Financial Services] assets and [removed: $49.1] [added: $80.6] million in Multifamily assets.
| | | | [removed: 2020 (2)] [added: 2021] | | | | | | [removed: 2019 (2)] [added: 2020] | | | [added: | | | 2019 | | |]
| Accounts payable | | | $ | [removed: 1,037,338] [added: 1,321,247] | | | | | [removed: 1,069,179] [added: 1,037,338] | | |
| Liabilities related to consolidated inventory not owned | | | [removed: 706,691] [added: 976,602] | | | | | | [removed: 260,266] [added: 706,691] | | |
| Senior notes and other debts payable, net | | | [removed: 5,955,758] [added: 4,652,338] | | | | | | [removed: 7,776,638] [added: 5,955,758] | | |
| Other liabilities | | | [removed: 2,225,864] [added: 2,920,055] | | | | | | [removed: 1,969,082] [added: 2,225,864] | | |
| Financial Services | | | [removed: 1,644,248] [added: 1,906,343] | | | | | | [removed: 1,988,323] [added: 1,644,248] | | |
| Multifamily | | | [removed: 252,911] [added: 288,930] | | | | | | [removed: 232,155] [added: 252,911] | | |
| Lennar Other | | | [removed: 12,966] [added: 145,981] | | | | | | [removed: 30,038] [added: 12,966] | | |
| Total liabilities | | | [removed: 11,835,776] [added: 12,211,496] | | | | | | [removed: 13,325,681] [added: 11,835,776] | | |
| Class A common stock of $0.10 par value per share; Authorized: [removed: 2020] [added: 2021] and [removed: 2019] [added: 2020] - 400,000,000 shares; Issued: [removed: 2020] [added: 2021] - [removed: 298,942,836] [added: 300,500,075] shares; [removed: 2019] [added: 2020] - [removed: 297,119,153] [added: 298,942,836] shares | | | [removed: 29,894] [added: 30,050] | | | | | | [removed: 29,712] [added: 29,894] | | |
| Class B common stock of $0.10 par value per share; Authorized: [removed: 2020] [added: 2021] and [removed: 2019] [added: 2020] - 90,000,000 shares, Issued: [removed: 2020] [added: 2021] - 39,443,168 shares; [removed: 2019] [added: 2020] - [removed: 39,443,064] [added: 39,443,168] shares | | | 3,944 | | | | | | 3,944 | | |
| Additional paid-in capital | | | [removed: 8,676,056] [added: 8,807,891] | | | | | | [removed: 8,578,219] [added: 8,676,056] | | |
| Retained earnings | | | [removed: 10,564,994] [added: 14,685,329] | | | | | | [removed: 8,295,001] [added: 10,564,994] | | |
| Treasury stock, at cost; [removed: 2020] [added: 2021] - [removed: 23,864,589] [added: 38,586,961] shares of Class A common stock and [removed: 1,822,016] [added: 1,922,016] shares of Class B common stock; [removed: 2019] [added: 2020] - [removed: 18,964,973] [added: 23,864,589] shares of Class A common stock and [removed: 1,704,630] [added: 1,822,016] shares of Class B common stock | | | [removed: (1,279,227)] [added: (2,709,448)] | | | | | | [removed: (957,857)] [added: (1,279,227)] | | |
| Accumulated other comprehensive [removed: income (loss)] [added: loss] | | | [removed: (805)] [added: (1,341)] | | | | | | [removed: 498] [added: (805)] | | |
| Total stockholders’ equity | | | [removed: 17,994,856] [added: 20,816,425] | | | | | | [added: 17,994,856 | | | | | |] 15,949,517 | | |
January 28, 2022
| | | | 27,467,819 | | | | | | 25,529,425 | | |
| Financial Services | | | 2,964,367 | | | | | | 2,708,118 | | |
| Lennar Other | | | 1,463,845 | | | | | | 521,726 | | |
| | | | 2021 (2) | | | | | | 2020 (2) | | |
| | | | 9,870,242 | | | | | | 9,925,651 | | |
| Corporate general and administrative | | | 398,381 | | | | | | 333,446 | | | | | | 321,188 | | |
| Charitable foundation contribution | | | 59,825 | | | | | | 24,972 | | | | | | 19,926 | | |
| Lennar Other realized and unrealized gains | | | 680,576 | | | | | | — | | | | | | — | | |
Years Ended November 30, 2021, 2020 and 2019
Years Ended November 30, 2021, 2020 and 2019
| Unrealized (gain) loss on loans held-for-sale | | | 14,449 | | | | | | (21,765) | | | | | | (4,891) | | |
| Lennar Other unrealized/realized gains | | | (680,576) | | | | | | — | | | | | | — | | |
| (Gain) loss on deconsolidation/consolidation of an entity | | | — | | | | | | (56,594) | | | | | | 48,874 | | |
| (Increase) decrease in loans held-for-sale | | | (160,785) | | | | | | 176,617 | | | | | | (426,448) | | |
| Proceeds from sale of investment in consolidated/unconsolidated joint ventures | | | 32,340 | | | | | | — | | | | | | 17,790 | | |
Years Ended November 30, 2021, 2020 and 2019
| Payments related to consolidated inventory not owned | | | (350,583) | | | | | | — | | | | | | — | | |
| Receipts related to noncontrolling interests | | | 69,675 | | | | | | 176,617 | | | | | | 27,859 | | |
| Payments related to noncontrolling interests | | | (24,605) | | | | | | (42,349) | | | | | | (43,734) | | |
conditions and other factors considered relevant by the Company.
| (In thousands) | | | 2021 | | | | | | 2020 | | |
| | | | 492,809 | | | | | | 301,469 | | |
| Allowance for credit losses | | | (2,531) | | | | | | (2,798) | | |
(1)At November 30, 2021, receivables, net included an $85 million short-term loan due from Upward America that was repaid subsequent to November 30, 2021.
| 2021 | | | 4 | | | | | | 1 | | | | | | $ | 5,267 | | | | | $ | 11,849 | | | | | | | | | | |
| | | | 2021 | | | | | | 2020 | | | | | | | | |
The Company has the option to perform a qualitative or quantitative assessment to determine whether the fair value of a reporting unit exceeds its carrying value.
Qualitative factors may include, but are not limited to economic conditions, industry and market considerations, cost factors, overall financial performance of the reporting units and other entity and reporting unit specific events.
The annual goodwill impairment analysis was performed as of September 30, 2021 and no impairment was recorded.
| (In thousands) | | | 2021 | | | | | | 2020 | | |
| | | | 538,761 | | | | | | 589,037 | | |
| | | | $ | 339,906 | | | | | 411,518 | | |
Additionally, the Lennar Other segment had investments in equity securities with a readily determinable fair value (publicly traded common stock), not accounted for under the equity method, that are recorded at fair value with unrealized gains and losses included in earnings.
For equity securities without a readily determinable fair value, the investment is recorded at cost, less any impairment, plus or minus adjustments related to observable transactions for the same or similar securities, with unrealized gains and losses included in earnings.
The Lennar Other segment had investments in equity securities of $1.0 billion and $68.8 million, as of November 30, 2021 and 2020, respectively.
For equity method investments in the Lennar Other segment, the Company records the investment as Lennar Other investments in unconsolidated entities.
The Company regularly reviews its investments in unconsolidated entities to determine whether there is a decline in fair value below book value.
If there is a decline that is other-than-temporary, the investment is written down to fair value.
There was no impairment recorded during the years ended November 30, 2021 and 2020.
January 22, 2021
| | | | 25,529,425 | | | | | | 24,789,239 | | |
| Lennar Other | | | 452,857 | | | | | | 495,417 | | |
| | | | 9,925,651 | | | | | | 11,075,165 | | |
| Acquisition and integration costs related to CalAtlantic | | | — | | | | | | — | | | | | | 152,980 | | |
| Corporate general and administrative | | | 358,418 | | | | | | 341,114 | | | | | | 343,934 | | |
| Lennar Other expense, net | | | (9,632) | | | | | | (8,944) | | | | | | (60,119) | | |
| Gain on sale of Rialto investment and asset management platform | | | — | | | | | | — | | | | | | 296,407 | | |
(1)Provision for income taxes for the year ended November 30, 2018 includes a non-cash one-time write down of deferred tax assets of $68.6 million resulting from the Tax Cuts and Jobs Act enacted in December 2017.
| Stock issuance in connection with CalAtlantic acquisition | | | — | | | | | | — | | | | | | 8,408 | | |
| Conversion of convertible senior notes to shares of Class A common stock | | | — | | | | | | — | | | | | | 365 | | |
| Stock issuance in connection with CalAtlantic acquisition | | | — | | | | | | — | | | | | | 168 | | |
| Conversion of convertible senior notes to shares of Class B common stock | | | — | | | | | | — | | | | | | 7 | | |
| Stock issuance in connection with CalAtlantic acquisition | | | — | | | | | | — | | | | | | 5,061,430 | | |
| Conversion of convertible senior notes to shares of Class A common stock | | | — | | | | | | — | | | | | | 216,782 | | |
| Gain on sale of Rialto investment and asset management platform | | | — | | | | | | — | | | | | | (296,407) | | |
| Loss on consolidation | | | 4,824 | | | | | | 48,874 | | | | | | — | | |
| Gain on deconsolidation of previously consolidated entity | | | (61,418) | | | | | | — | | | | | | — | | |
| Decrease (increase) in loans held-for-sale | | | 154,852 | | | | | | (431,339) | | | | | | 5,805 | | |
| Proceeds from sale of investments in unconsolidated entities | | | — | | | | | | 17,790 | | | | | | 225,267 | | |
| Purchases of CMBS bonds | | | — | | | | | | — | | | | | | (31,068) | | |
| Proceeds from sale of Rialto investment and asset management platform | | | — | | | | | | — | | | | | | 340,000 | | |
| Acquisitions, net of cash and restricted cash acquired | | | — | | | | | | — | | | | | | (1,078,282) | | |
| Net repayments under revolving lines of credit | | | $ | — | | | | | — | | | | | | (454,700) | | |
| Debt issuance costs | | | — | | | | | | (25) | | | | | | (14,661) | | |
| Conversions, exchanges and redemption of convertible senior notes | | | — | | | | | | (1,288) | | | | | | (59,145) | | |
| Principal payments on Rialto notes payable including structured notes | | | — | | | | | | — | | | | | | (359,016) | | |
| Conversions of and exchanges on convertible senior notes to equity | | | — | | | | | | — | | | | | | 217,154 | | |
| Equity component of acquisition consideration | | | — | | | | | | — | | | | | | 5,070,006 | | |
Lennar Other restricted cash primarily consisted of cash set aside for future investments on behalf of a real estate investment trust that Rialto Capital Management is a sub-advisor (“Rialto”).
receivable.
| | | | 301,469 | | | | | | 332,446 | | |
| Allowance for doubtful accounts | | | (2,798) | | | | | | (3,322) | | |
| 2019 | | | 40 | | | | | | 3 | | | | | | 7,910 | | | | | | 2,582 | | | | | | | | | | | |
| | | | | | | | | | | | | | | | | | | | | | | | | | | | | | | | | | | | | | | | | | |
| --- | --- | --- | --- | --- | --- | --- | --- | --- | --- | --- | --- | --- | --- | --- | --- | --- | --- | --- | --- | --- | --- | --- | --- | --- | --- | --- | --- | --- | --- | --- | --- | --- | --- | --- | --- | --- | --- | --- | --- | --- | --- |
Potential impairment is evaluated by comparing the carrying value of each of the Company's reporting units to their estimated fair values.
| | | | 589,037 | | | | | | 448,109 | | |
| | | | $ | 411,518 | | | | | 279,527 | | |
Also, at November 30, 2019, the Financial Services segment had $3.7 million of available-for-sale securities, which consisted primarily of preferred stock and mutual funds.
An excerpt. Shown here: 40 of 491 rewritten, 40 of 281 added and 40 of 224 removed. The counts are complete. For every sentence, read Item 8. Financial Statements and Supplementary Data. in the FY2021 filing and the FY2020 filing.
Item 9A. Controls and Procedures.
7 rewritten, 1 added, 1 removed, 30 unchanged
Based on their participation in that evaluation, our Co-CEOs and CFO concluded that our disclosure controls and procedures were effective as of November 30, [removed: 2020] [added: 2021] to ensure that information required to be disclosed in our reports filed or submitted under the Securities Exchange Act of 1934, as amended, is recorded, processed, summarized and reported within the time periods specified in the Securities and Exchange Commission’s rules and forms, and to ensure that information required to be disclosed in our reports filed or furnished under the Securities Exchange Act of 1934, as amended, is accumulated and communicated to our management, including both of our Co-CEOs and CFO, as appropriate to allow timely decisions regarding required disclosures.
Both of our Co-CEOs and CFO also participated in an evaluation by our management of any changes in our internal control over financial reporting that occurred during the quarter ended November 30, [removed: 2020.][added: 2021.]
Based on our evaluation under the framework in *Internal Control—Integrated Framework* (2013)*,* our management concluded that our internal control over financial reporting was effective as of November 30, [removed: 2020.][added: 2021.]
The effectiveness of our internal control over financial reporting as of November 30, [removed: 2020] [added: 2021] has been audited by Deloitte & Touche LLP, an independent registered public accounting firm, as stated in their attestation report which is included herein.
We have audited the internal control over financial reporting of Lennar Corporation and subsidiaries (the “Company”) as of November 30, [removed: 2020,] [added: 2021,] based on criteria established in *Internal Control - Integrated Framework (2013)* issued by the Committee of Sponsoring Organizations of the Treadway Commission (COSO).
In our opinion, the Company maintained, in all material respects, effective internal control over financial reporting as of November 30, [removed: 2020,] [added: 2021,] based on criteria established in *Internal Control - Integrated Framework (2013)* issued by COSO.
We have also audited, in accordance with the standards of the Public Company Accounting Oversight Board (United States) (PCAOB), the consolidated financial statements as of and for the year ended November 30, [removed: 2020,] [added: 2021,] of the Company and our report dated January [removed: 22, 2021] [added: 28, 2022] expressed an unqualified opinion on those financial statements.
| January 28, 2022 | | |
| January 22, 2021 | | |
Item 9B. Other Information.
0 rewritten, 0 added, 1 removed, 1 unchanged
PART III
Item 9C. Disclosure Regarding Foreign Jurisdictions that Prevent Inspections.
0 rewritten, 2 added, 0 removed, 0 unchanged
New section this year
Not applicable.
PART III
Item 10. Directors, Executive Officers and Corporate Governance.
1 rewritten, 0 added, 0 removed, 3 unchanged
The other information called for by this item is incorporated by reference to our definitive proxy statement, which will be filed with the Securities and Exchange Commission not later than March 30, [removed: 2021] [added: 2022] (120 days after the end of our fiscal year).
Item 11. Executive Compensation.
1 rewritten, 0 added, 0 removed, 0 unchanged
The information required by this item is incorporated by reference to our definitive proxy statement, which will be filed with the Securities and Exchange Commission not later than March 30, [removed: 2021] [added: 2022] (120 days after the end of our fiscal year).
Item 12. Security Ownership of Certain Beneficial Owners and Management and Related Stockholder Matters.
3 rewritten, 1 added, 1 removed, 5 unchanged
The information required by this item is incorporated by reference to our definitive proxy statement, which will be filed with the Securities and Exchange Commission not later than March 30, [removed: 2021] [added: 2022] (120 days after the end of our fiscal year), except for the information required by Item 201(d) of Regulation S-K, which is provided below.
The following table summarizes our equity compensation plans as of November 30, [removed: 2020:][added: 2021:]
| Equity compensation plans approved by stockholders | | | [removed: —] [added: 162,338] | | | | | | $ | [removed: —] [added: 100.00] | | | | | [removed: 7,209,217] [added: 5,600,008] | | |
| Total | | | 162,338 | | | | | | $ | 100.00 | | | | | 5,600,008 | | |
| Total | | | — | | | | | | $ | — | | | | | 7,209,217 | | |
Item 13. Certain Relationships and Related Transactions, and Director Independence.
1 rewritten, 0 added, 0 removed, 0 unchanged
The information required by this item is incorporated by reference to our definitive proxy statement, which will be filed with the Securities and Exchange Commission not later than March 30, [removed: 2021] [added: 2022] (120 days after the end of our fiscal year).
Item 14. Principal Accounting Fees and Services.
1 rewritten, 0 added, 0 removed, 1 unchanged
The information required by this item is incorporated by reference to our definitive proxy statement, which will be filed with the Securities and Exchange Commission not later than March 30, [removed: 2021] [added: 2022] (120 days after the end of our fiscal year).
Item 15. Exhibit and Financial Statement Schedules.
26 rewritten, 1 added, 7 removed, 68 unchanged
| [Report of Independent Registered Public Accounting [removed: Firm](#i76704f6d0160463182f284ca8d043a7a_124)] [added: Firm](#if8875ebc30f5446fa24ed9be199539fa_127)] | | | [removed: [42](#i76704f6d0160463182f284ca8d043a7a_124)] [added: [42](#if8875ebc30f5446fa24ed9be199539fa_127)] | | |
| [Consolidated Balance Sheets as of November 30, [removed: 2020] [added: 2021] and [removed: 2019](#i76704f6d0160463182f284ca8d043a7a_127)] [added: 2020](#if8875ebc30f5446fa24ed9be199539fa_130)] | | | [removed: [44](#i76704f6d0160463182f284ca8d043a7a_127)] [added: [44](#if8875ebc30f5446fa24ed9be199539fa_130)] | | |
| [Consolidated Statements of Operations and Comprehensive Income (Loss) for the Years Ended November 30, [removed: 2020, 2019] [added: 2021, 2020] and [removed: 2018](#i76704f6d0160463182f284ca8d043a7a_136)] [added: 2019](#if8875ebc30f5446fa24ed9be199539fa_136)] | | | [removed: [46](#i76704f6d0160463182f284ca8d043a7a_136)] [added: [46](#if8875ebc30f5446fa24ed9be199539fa_136)] | | |
| [Consolidated Statements of Equity for the Years Ended November 30, [removed: 2020, 2019] [added: 2021, 2020] and [removed: 2018](#i76704f6d0160463182f284ca8d043a7a_139)] [added: 2019](#if8875ebc30f5446fa24ed9be199539fa_139)] | | | [removed: [47](#i76704f6d0160463182f284ca8d043a7a_139)] [added: [47](#if8875ebc30f5446fa24ed9be199539fa_139)] | | |
| [Consolidated Statements of Cash Flows for the Years Ended November 30, [removed: 2020, 2019] [added: 2021, 2020] and [removed: 2018](#i76704f6d0160463182f284ca8d043a7a_145)] [added: 2019](#if8875ebc30f5446fa24ed9be199539fa_142)] | | | [removed: [48](#i76704f6d0160463182f284ca8d043a7a_145)] [added: [48](#if8875ebc30f5446fa24ed9be199539fa_142)] | | |
| [Notes to Consolidated Financial [removed: Statements](#i76704f6d0160463182f284ca8d043a7a_148)] [added: Statements](#if8875ebc30f5446fa24ed9be199539fa_145)] | | | [removed: [49](#i76704f6d0160463182f284ca8d043a7a_148)] [added: [49](#if8875ebc30f5446fa24ed9be199539fa_145)] | | |
| [Schedule II—Valuation and Qualifying [removed: Accounts](#i76704f6d0160463182f284ca8d043a7a_286)] [added: Accounts](#if8875ebc30f5446fa24ed9be199539fa_280)] | | | [removed: [87](#i76704f6d0160463182f284ca8d043a7a_286)] [added: [87](#if8875ebc30f5446fa24ed9be199539fa_280)] | | |
| 4.6 | | | [removed: [Thirteenth] [added: [Fourteenth] Supplemental Indenture, dated as of [removed: January 20,] [added: April 28,] 2017, among Lennar Corporation, each of the guarantors identified therein and The Bank of New York Mellon, as trustee, including the form of [removed: 4.125%] [added: 4.50%] Senior Notes due [removed: 2022-] [added: 2024 -] Incorporated by reference to Exhibit [removed: 4.17] [added: 4.18] of the Company’s Current Report on Form 8-K, dated [removed: January 20, 2017.](http://www.sec.gov/Archives/edgar/data/920760/000119312517014307/d324775dex417.htm)] [added: April 28, 2017.](http://www.sec.gov/Archives/edgar/data/920760/000119312517148377/d385723dex418.htm)] | | |
| 4.7 | | | [removed: [Fourteenth Supplemental Indenture,] [added: [Indenture,] dated as of [removed: April 28,] [added: November 29,] 2017, among Lennar Corporation, each of the guarantors identified therein and The Bank of New York Mellon, as trustee, including the form of [removed: 4.50%] [added: 2.95%] Senior Notes due [removed: 2024 -] [added: 2020 and the form of 4.75% Senior Notes due 2027-] Incorporated by reference to Exhibit [removed: 4.18] [added: 4.1] of the Company’s Current Report on Form 8-K, dated [removed: April 28, 2017.](http://www.sec.gov/Archives/edgar/data/920760/000119312517148377/d385723dex418.htm)] [added: November 29, 2017.](http://www.sec.gov/Archives/edgar/data/920760/000119312517357394/d438218dex41.htm)] | | |
| 4.8 | | | [Indenture, dated as of [removed: November 29, 2017,] [added: February 20, 2018,] among Lennar Corporation, each of the guarantors identified therein and The Bank of New York Mellon, as trustee, [removed: including] [added: governing] the [removed: form of 2.95%] [added: 5.875%] Senior Notes due [removed: 2020 and] [added: November 15, 2024 (including] the [removed: form] [added: forms] of [removed: 4.75%] [added: 5.875%] Senior Notes due [removed: 2027-] [added: November 15, 2024) -] Incorporated by reference to Exhibit [removed: 4.1] [added: 4.6] of the Company’s Current Report on Form 8-K, dated [removed: November 29, 2017.](http://www.sec.gov/Archives/edgar/data/920760/000119312517357394/d438218dex41.htm)] [added: February 16, 2018.](http://www.sec.gov/Archives/edgar/data/920760/000119312518050568/d513500dex46.htm)] | | |
| 4.9 | | | [Indenture, dated as of February 20, 2018, among Lennar Corporation, each of the guarantors identified therein and The Bank of New York Mellon, as trustee, governing the [removed: 6.25%] [added: 5.25%] Senior Notes due [removed: December 15, 2021] [added: June 1, 2026] (including the forms of [removed: 6.25%] [added: 5.25%] Senior Notes due [removed: December 15, 2021)] [added: June 1, 2026)] - Incorporated by reference to Exhibit [removed: 4.4] [added: 4.7] of the Company’s Current Report on Form 8-K, dated February 16, [removed: 2018.](https://www.sec.gov/Archives/edgar/data/920760/000119312518050568/d513500dex44.htm)] [added: 2018.](http://www.sec.gov/Archives/edgar/data/920760/000119312518050568/d513500dex47.htm)] | | |
| 4.10 | | | [Indenture, dated as of February 20, 2018, among Lennar Corporation, each of the guarantors identified therein and The Bank of New York Mellon, as trustee, governing the [removed: 5.375%] [added: 5.00%] Senior Notes due [removed: October 1, 2022] [added: June 15, 2027] (including the forms of [removed: 5.375%] [added: 5.00%] Senior Notes due [removed: October 1, 2022)] [added: June 15, 2027)] - Incorporated by reference to Exhibit [removed: 4.5] [added: 4.8] of the Company’s Current Report on Form 8-K, dated February 16, [removed: 2018.](http://www.sec.gov/Archives/edgar/data/920760/000119312518050568/d513500dex45.htm)] [added: 2018.](http://www.sec.gov/Archives/edgar/data/920760/000119312518050568/d513500dex48.htm)] | | |
| 10.6* | | | [Form of [removed: 2018 Restricted Stock] [added: 2019 Award] Agreement [added: under the Company’s 2016 Equity Incentive Plan] for [removed: Stuart] [added: Mr.] Miller, [removed: Rick] [added: Mr.] Beckwitt and [removed: Jonathan] [added: Mr.] Jaffe - Incorporated by reference to Exhibit 10.2 of the Company’s Current Report on Form 8-K, dated [removed: February 14, 2018.](http://www.sec.gov/Archives/edgar/data/920760/000119312518048648/d526400dex102.htm)] [added: June 25, 2019.](http://www.sec.gov/Archives/edgar/data/920760/000119312519186216/d748760dex102.htm)] | | |
| 10.7* | | | [removed: [2019] [added: [2020] Award Agreements [added: under the Company’s 2016 Incentive Compensation Plan] for Mr. Miller, Mr. [removed: Beckwitt] [added: Beckwitt, Mr. Jaffe, Ms. Bessette] and Mr. [removed: Jaffe] [added: McCall] - Incorporated by reference to Exhibit 10.1 of the Company’s Current Report on Form 8-K, dated [removed: June 25, 2019.](http://www.sec.gov/Archives/edgar/data/920760/000119312519186216/d748760dex101.htm)] [added: February 28, 2020.](https://www.sec.gov/Archives/edgar/data/920760/000119312520060518/d895314dex101.htm)] | | |
| 10.8* | | | [Form of [removed: 2019] [added: 2020] Award Agreement under the Company’s 2016 Equity Incentive Plan for Mr. Miller, Mr. [removed: Beckwitt] [added: Beckwitt, Mr. Jaffe, Ms. Bessette] and Mr. [removed: Jaffe] [added: McCall] - Incorporated by reference to Exhibit 10.2 of the Company’s Current Report on Form 8-K, dated [removed: June 25, 2019.](http://www.sec.gov/Archives/edgar/data/920760/000119312519186216/d748760dex102.htm)] [added: February 28, 2020.](https://www.sec.gov/Archives/edgar/data/920760/000119312520060518/d895314dex102.htm)] | | |
| [removed: 10.9*] [added: 10.10*] | | | [removed: [2019] [added: [2021] Award Agreements [added: under the Company’s 2016 Incentive Compensation Plan] for [added: Mr. Miller, Mr. Beckwitt, Mr. Jaffe,] Ms. Bessette, Mr. [removed: Sustana, Mr.] McCall and Mr. [removed: Gross] [added: Sustana] - Incorporated by reference to Exhibit [removed: 10.3] [added: 10.1] of the Company’s Current Report on Form 8-K, dated [removed: June 25, 2019.](http://www.sec.gov/Archives/edgar/data/920760/000119312519186216/d748760dex103.htm)] [added: February 26, 2021.](https://www.sec.gov/Archives/edgar/data/920760/000119312521067743/d14705dex101.htm)] | | |
| [removed: 10.10*] [added: 10.11*] | | | [removed: [2020] [added: [Form of 2021] Award [removed: Agreements] [added: Agreement] under the Company’s 2016 [added: Equity] Incentive [removed: Compensation] Plan for Mr. Miller, Mr. Beckwitt, Mr. Jaffe, Ms. Bessette and Mr. McCall - Incorporated by reference to Exhibit 10.1 of the Company’s Current Report on Form 8-K, dated February [removed: 28, 2020.](https://www.sec.gov/Archives/edgar/data/920760/000119312520060518/d895314dex101.htm)] [added: 26, 2021.](https://www.sec.gov/Archives/edgar/data/920760/000119312521067743/d14705dex102.htm)] | | |
| [removed: 10.12] [added: 10.9] | | | [Master Agreement, dated [removed: October](https://www.sec.gov/Archives/edgar/data/920760/000162828021000722/len-20201130x10kxexh1012.htm) [8](https://www.sec.gov/Archives/edgar/data/920760/000162828021000722/len-20201130x10kxexh1012.htm)[, 2020,](https://www.sec.gov/Archives/edgar/data/920760/000162828021000722/len-20201130x10kxexh1012.htm) [between AG](https://www.sec.gov/Archives/edgar/data/920760/000162828021000722/len-20201130x10kxexh1012.htm) [Ess](https://www.sec.gov/Archives/edgar/data/920760/000162828021000722/len-20201130x10kxexh1012.htm)[ential] [added: October 8, 2020, between AG Essential] Housing Company 1, [removed: L.P.](https://www.sec.gov/Archives/edgar/data/920760/000162828021000722/len-20201130x10kxexh1012.htm) [and](https://www.sec.gov/Archives/edgar/data/920760/000162828021000722/len-20201130x10kxexh1012.htm) [Essential Ho](https://www.sec.gov/Archives/edgar/data/920760/000162828021000722/len-20201130x10kxexh1012.htm)[using] [added: L.P. and Essential Housing] Financing, [removed: LLC](https://www.sec.gov/Archives/edgar/data/920760/000162828021000722/len-20201130x10kxexh1012.htm)[.](https://www.sec.gov/Archives/edgar/data/920760/000162828021000722/len-20201130x10kxexh1012.htm)] [added: LLC](https://www.sec.gov/Archives/edgar/data/0000920760/000162828021000722/len-20201130x10kxexh1012.htm) [-](https://www.sec.gov/Archives/edgar/data/0000920760/000162828021000722/len-20201130x10kxexh1012.htm) [Incorporated by reference to Exhibit 10.12 of the Company's Annual Report on Form 10-K for the fiscal year ended November 30, 2020](https://www.sec.gov/Archives/edgar/data/0000920760/000162828021000722/len-20201130x10kxexh1012.htm)] | | |
| 21 | | | [List of [removed: subsidiaries.](https://www.sec.gov/Archives/edgar/data/920760/000162828021000722/len-2020x1130x10kxexh21.htm)] [added: subsidiaries.](https://www.sec.gov/Archives/edgar/data/920760/000162828022001450/len-20211130x10kxexh21.htm)] | | |
| 23 | | | [Consent of Independent Registered Public Accounting [removed: Firm.](https://www.sec.gov/Archives/edgar/data/920760/000162828021000722/len-20201130x10kxexh23.htm)] [added: Firm.](https://www.sec.gov/Archives/edgar/data/920760/000162828022001450/len-20211130x10kxexh23.htm)] | | |
| 31.1 | | | [Rule 13a-14a/15d-14(a) Certification of Rick [removed: Beckwitt.](https://www.sec.gov/Archives/edgar/data/920760/000162828021000722/len-20201130x10kxexh311.htm)] [added: Beckwitt.](https://www.sec.gov/Archives/edgar/data/920760/000162828022001450/len-20211130x10kxexh311.htm)] | | |
| 31.2 | | | [Rule 13a-14a/15d-14(a) Certification of Jonathan M. [removed: Jaffe.](https://www.sec.gov/Archives/edgar/data/920760/000162828021000722/len-20201130x10kxexh312.htm)] [added: Jaffe.](https://www.sec.gov/Archives/edgar/data/920760/000162828022001450/len-20211130x10kxexh312.htm)] | | |
| 31.3 | | | [Rule 13a-14a/15d-14(a) Certification of Diane [removed: Bessette.](https://www.sec.gov/Archives/edgar/data/920760/000162828021000722/len-20201130x10kxexh313.htm)] [added: Bessette.](https://www.sec.gov/Archives/edgar/data/920760/000162828022001450/len-20211130x10kxexh313.htm)] | | |
| 32 | | | [Section 1350 Certifications of Rick [removed: Beckwitt](https://www.sec.gov/Archives/edgar/data/920760/000162828021000722/len-20201130x10kxexh32.htm)[,] [added: Beckwitt,] Jonathan M. [removed: Jaffe](https://www.sec.gov/Archives/edgar/data/920760/000162828021000722/len-20201130x10kxexh32.htm) [and] [added: Jaffe and] Diane [removed: Bessette.](https://www.sec.gov/Archives/edgar/data/920760/000162828021000722/len-20201130x10kxexh32.htm)] [added: Bessette.](https://www.sec.gov/Archives/edgar/data/920760/000162828022001450/len-20211130x10kxexh32.htm)] | | |
| 101 | | | The following financial statements from Lennar Corporation Annual Report on Form 10-K for the year ended November 30, [removed: 2020,] [added: 2021,] filed on January [removed: 22, 2021,] [added: 28, 2022,] formatted in iXBRL (Inline Extensible Business Reporting Language); (i) Consolidated Balance Sheets, (ii) Consolidated Statements of Operations and Comprehensive Income (Loss), (iii) Consolidated Statements of Equity (iv) Consolidated Statements of Cash Flows and (v) the Notes to Consolidated Financial Statements. | | |
| 104* | | | The cover page from Lennar Corporation's fiscal year Report on Form 10-K for the year ended November 30, [removed: 2020] [added: 2021] was formatted in iXBRL. | | |
| 10.2* | | | [Lennar Corporation 2016 Incentive Compensation Plan, as Amended and Restated effective January 12, 2022– Filed herewith.](https://www.sec.gov/Archives/edgar/data/920760/000162828022001450/len-20211130x10kxexh102.htm) | | |
| | | | | | |
| [Report of Independent Registered Public Accounting Firm](#i76704f6d0160463182f284ca8d043a7a_283) | | | [86](#i76704f6d0160463182f284ca8d043a7a_283) | | |
| 4.11 | | | [Indenture, dated as of February 20, 2018, among Lennar Corporation, each of the guarantors identified therein and The Bank of New York Mellon, as trustee, governing the 5.875% Senior Notes due November 15, 2024 (including the forms of 5.875% Senior Notes due November 15, 2024) - Incorporated by reference to Exhibit 4.6 of the Company’s Current Report on Form 8-K, dated February 16, 2018.](http://www.sec.gov/Archives/edgar/data/920760/000119312518050568/d513500dex46.htm) | | |
| 4.12 | | | [Indenture, dated as of February 20, 2018, among Lennar Corporation, each of the guarantors identified therein and The Bank of New York Mellon, as trustee, governing the 5.25% Senior Notes due June 1, 2026 (including the forms of 5.25% Senior Notes due June 1, 2026) - Incorporated by reference to Exhibit 4.7 of the Company’s Current Report on Form 8-K, dated February 16, 2018.](http://www.sec.gov/Archives/edgar/data/920760/000119312518050568/d513500dex47.htm) | | |
| 4.13 | | | [Indenture, dated as of February 20, 2018, among Lennar Corporation, each of the guarantors identified therein and The Bank of New York Mellon, as trustee, governing the 5.00% Senior Notes due June 15, 2027 (including the forms of 5.00% Senior Notes due June 15, 2027) - Incorporated by reference to Exhibit 4.8 of the Company’s Current Report on Form 8-K, dated February 16, 2018.](http://www.sec.gov/Archives/edgar/data/920760/000119312518050568/d513500dex48.htm) | | |
| 10.2* | | | [Lennar Corporation 2016 Incentive Compensation Plan - Incorporated by reference to Exhibit B of the Company’s Definitive Proxy Statement on Schedule 14A, filed with the Commission on March 2, 2016.](http://www.sec.gov/Archives/edgar/data/920760/000119312516489179/d26986ddef14a.htm) | | |
| 10.11* | | | [Form of 2020 Award Agreement under the Company’s 2016 Equity Incentive Plan for Mr. Miller, Mr. Beckwitt, Mr. Jaffe, Ms. Bessette and Mr. McCall - Incorporated by reference to Exhibit 10.](https://www.sec.gov/Archives/edgar/data/920760/000119312520060518/d895314dex102.htm)[2](https://www.sec.gov/Archives/edgar/data/920760/000119312520060518/d895314dex102.htm) [of the Company’s Current Report on Form 8-K, dated February 28, 2020.](https://www.sec.gov/Archives/edgar/data/920760/000119312520060518/d895314dex102.htm) | | |
Item 16. Form 10-K Summary
10 rewritten, 13 added, 17 removed, 68 unchanged
| | | | Date: | | | January [removed: 22, 2021] [added: 28, 2022] | | |
| Co-Chief Executive Officer, Co-President and Director | | | Date: | | | January [removed: 22, 2021] [added: 28, 2022] | | |
| Vice President, Chief Financial Officer and Treasurer | | | Date: | | | January [removed: 22, 2021] [added: 28, 2022] | | |
| Vice President and Controller | | | Date: | | | January [removed: 22, 2021] [added: 28, 2022] | | |
Years Ended November 30, [removed: 2020, 2019] [added: 2021, 2020] and [removed: 2018][added: 2019]
| Allowances for [removed: doubtful accounts] [added: credit losses] and notes and other receivables | | | $ | 3,379 | | | | | 661 | | | | | | (568) | | | | | | (1,078) | | | | | | 2,394 | | |
| Allowances for [removed: doubtful accounts] [added: credit losses] and notes and other receivables | | | $ | 2,793 | | | | | 1,404 | | | | | | (344) | | | | | | (474) | | | | | | 3,379 | | |
| Year ended November 30, [removed: 2018] [added: 2021] | | | | | | | | | | | | | | | | | | | | | | | | | | | | | |
| Allowance for loan losses and loans receivable | | | $ | [removed: 3,192] [added: 4,012] | | | | | [removed: 2,177] [added: —] | | | | | | [removed: 3,890] [added: (31)] | | | | | | [removed: (3,105)] [added: (1,890)] | | | | | | [removed: 6,154] [added: 2,091] | | |
| Allowance against net deferred tax assets | | | $ | [removed: 6,423] [added: 4,411] | | | | | [removed: 796] [added: —] | | | | | | [removed: —] [added: (1,556)] | | | | | | [removed: —] [added: (162)] | | | | | | [removed: 7,219] [added: 2,693] | | |
| | | | Date: | | | January 28, 2022 | | |
| Co-Chief Executive Officer, Co-President and Director | | | Date: | | | January 28, 2022 | | |
| Amy Banse | | | /S/ AMY BANSE | | | | | |
| | | | Date: | | | January 28, 2022 | | |
| | | | Date: | | | January 28, 2022 | | |
| | | | Date: | | | January 28, 2022 | | |
| | | | Date: | | | January 28, 2022 | | |
| | | | Date: | | | January 28, 2022 | | |
| | | | Date: | | | January 28, 2022 | | |
| | | | Date: | | | January 28, 2022 | | |
| | | | Date: | | | January 28, 2022 | | |
| | | | Date: | | | January 28, 2022 | | |
| Allowances for credit losses and notes and other receivables | | | $ | 2,394 | | | | | 79 | | | | | | 59 | | | | | | (1) | | | | | | 2,531 | | |
| | | | | | | | | |
| Irving Bolotin | | | /S/ IRVING BOLOTIN | | | | | |
| Scott Stowell | | | /S/ SCOTT STOWELL | | | | | |
REPORT OF INDEPENDENT REGISTERED PUBLIC ACCOUNTING FIRM
To the stockholders and the Board of Directors of Lennar Corporation
Opinion on the Financial Statement Schedule
We have audited the consolidated financial statements of Lennar Corporation and subsidiaries (the "Company") as of November 30, 2020 and 2019, and for each of the three years in the period ended November 30, 2020, and the Company's internal control over financial reporting as of November 30, 2020, and have issued our reports thereon dated January 22, 2021; such reports are included elsewhere in this Form 10-K.
Our audits also included the financial statement schedule of the Company listed in the Index at Item 15.
This financial statement schedule is the responsibility of the Company's management.
Our responsibility is to express an opinion on the Company’s financial statement schedule based on our audits.
In our opinion, such financial statement schedule, when considered in relation to the financial statements taken as a whole, presents fairly, in all material respects, the information set forth therein.
| | | |
| --- | --- | --- |
| /s/ Deloitte & Touche LLP | | |
| Miami, Florida | | |
| January 22, 2021 | | |
| Allowances for doubtful accounts and notes and other receivables | | | $ | 2,849 | | | | | 246 | | | | | | (156) | | | | | | (146) | | | | | | 2,793 | | |