 filings.tools
Item 5. MARKET FOR REGISTRANT’S COMMON EQUITY, RELATED STOCKHOLDER MATTERS AND ISSUER PURCHASES OF EQUITY SECURITIES.
9K characters. Original on sec.gov · Markdown
Item 5. MARKET FOR REGISTRANT’S COMMON EQUITY, RELATED STOCKHOLDER MATTERS AND ISSUER PURCHASES OF EQUITY SECURITIES.
Market Information and Price Range of Common Stock
Our common stock, par value $1.00 per share, is listed and traded on the NYSE, under the ticker symbol “HRS.” According to the records of our transfer agent, as of August 24, 2018, there were approximately 12,209 holders of record of our common stock. The high and low sales prices of our common stock as reported in the NYSE consolidated transaction reporting system and the cash dividends paid on our common stock for each quarterly period in our last two fiscal years are reported below:
| High | Low | Cash Dividends | High | Low | Cash Dividends | |||||||||||||||||||
| Fiscal 2018 | Fiscal 2017 | |||||||||||||||||||||||
| First Quarter | $ | 132.00 | $ | 109.08 | $ | 0.57 | First Quarter | $ | 94.09 | $ | 80.78 | $ | 0.53 | |||||||||||
| Second Quarter | $ | 144.94 | $ | 131.52 | 0.57 | Second Quarter | $ | 107.54 | $ | 88.89 | 0.53 | |||||||||||||
| Third Quarter | $ | 164.58 | $ | 140.84 | 0.57 | Third Quarter | $ | 113.00 | $ | 99.13 | 0.53 | |||||||||||||
| Fourth Quarter | $ | 170.54 | $ | 142.50 | 0.57 | Fourth Quarter | $ | 114.32 | $ | 106.18 | 0.53 | |||||||||||||
| $ | 2.28 | $ | 2.12 |
On August 24, 2018, the last sale price of our common stock as reported in the NYSE consolidated transaction reporting system was $163.23 per share.
Dividends
The cash dividends paid on our common stock for each quarterly period in our last two fiscal years are set forth in the tables above. On August 25, 2018, our Board of Directors increased the quarterly cash dividend rate on our common stock from $.57 per share to $.685 per share, for an annualized cash dividend rate of $2.74 per share, which was our seventeenth consecutive annual increase in our quarterly cash dividend rate. Our annualized cash dividend rate in fiscal 2018, 2017 and 2016 was $2.28 per share, $2.12 per share and $2.00 per share, respectively. Quarterly cash dividends are typically paid in March, June, September and December. We currently expect that quarterly cash dividends will continue to be paid in the near future, but we can give no assurances concerning payment of future dividends. The declaration of quarterly cash dividends and the amount thereof will depend on a number of factors, including our financial condition, capital requirements, cash flows, results of operations, future business prospects and other factors that our Board of Directors may deem relevant.
Harris Stock Performance Graph
The following performance graph and table do not constitute soliciting material and the performance graph and table should not be deemed filed or incorporated by reference into any other previous or future filings by us under the Securities Act or the Exchange Act, except to the extent that we specifically incorporate the performance graph and table by reference therein.
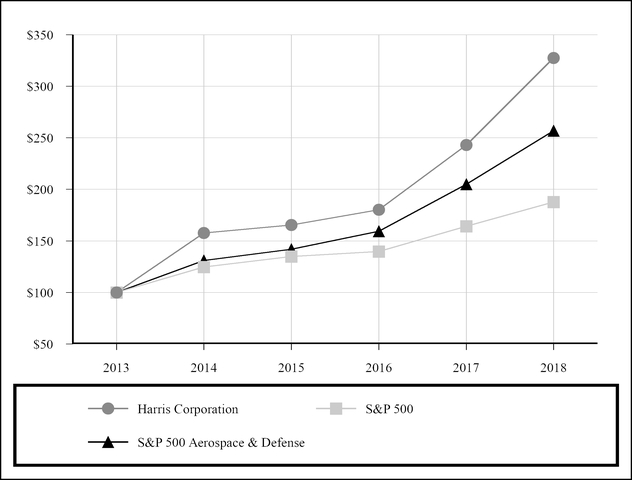
The performance graph and table below compare the 5-year cumulative total shareholder return of our common stock with the comparable 5-year cumulative total returns of the Standard & Poor’s 500 Composite Stock Index (“S&P 500”) and the Standard & Poor’s 500 Aerospace & Defense Index (“S&P 500 Aerospace & Defense”). The figures in the performance graph and table below assume an initial investment of $100 at the close of business on June 28, 2013 in Harris common stock, the S&P 500 and the S&P 500 Aerospace & Defense and the reinvestment of all dividends.
COMPARISON OF FIVE-YEAR CUMULATIVE TOTAL RETURN AMONG
HARRIS, S&P 500 AND S&P 500 AEROSPACE & DEFENSE
| HARRIS FISCAL YEAR END | 2013 | 2014 | 2015 | 2016 | 2017 | 2018 | ||||||||||||
| Harris | $ | 100 | $ | 158 | $ | 166 | $ | 180 | $ | 243 | $ | 327 | ||||||
| S&P 500 | $ | 100 | $ | 125 | $ | 135 | $ | 140 | $ | 164 | $ | 188 | ||||||
| S&P 500 Aerospace & Defense | $ | 100 | $ | 131 | $ | 142 | $ | 159 | $ | 205 | $ | 257 |
Sales of Unregistered Securities
During fiscal 2018, we did not issue or sell any unregistered securities.
Issuer Purchases of Equity Securities
During fiscal 2018, we repurchased 1,959,435 shares of our common stock under our current repurchase program for $272 million at an average share price of $138.87, excluding commissions of $.02 per share. During fiscal 2017, we repurchased 6,637,239 shares of our common stock under our current and prior repurchase programs for $710 million, including $600 million pursuant to fixed-dollar accelerated share repurchase (“ASR”) agreements (including 296,952 shares of our common stock received in the first quarter of fiscal 2018 pursuant to an ASR agreement). The level of our repurchases depends on a number of factors, including our financial condition, capital requirements, cash flows, results of operations, future business prospects and other factors our Board of Directors may deem relevant. The timing, volume and nature of repurchases are subject to market conditions, applicable securities laws and other factors and are at our discretion and may be suspended or discontinued at any time. Shares repurchased by us are cancelled and retired. The following table sets forth information with respect to repurchases by us of our common stock during the fiscal quarter ended June 29, 2018:
| Period* | Total number of shares purchased | Average price paid per share | Total number of shares purchased as part of publicly announced plans or programs(1) | Maximum approximate dollar value of shares that may yet be purchased under the plans or programs(1) | |||||||||
| Month No. 1 | |||||||||||||
| (March 31, 2018-April 27, 2018) | |||||||||||||
| Repurchase program(1) | — | — | — | $776,343,512 | |||||||||
| Employee transactions(2) | 2,273 | $ | 160.77 | — | — | ||||||||
| Month No. 2 | |||||||||||||
| (April 28, 2018-May 25, 2018) | |||||||||||||
| Repurchase program(1) | 115,000 | $ | 152.60 | 115,000 | $758,794,323 | ||||||||
| Employee transactions(2) | 21,425 | $ | 150.02 | — | — | ||||||||
| Month No. 3 | |||||||||||||
| (May 26, 2018-June 29, 2018) | |||||||||||||
| Repurchase program(1) | 377,722 | $ | 152.25 | 377,722 | $701,284,313 | ||||||||
| Employee transactions(2) | 28,373 | $ | 151.29 | — | — | ||||||||
| Total | 544,793 | 492,722 | $701,284,313 |
- Periods represent our fiscal months.
| (1) | On February 2, 2017, we announced that on January 26, 2017, our Board of Directors approved a share repurchase program authorizing us to repurchase up to $1 billion in shares of our common stock through open-market purchases, private transactions, transactions structured through investment banking institutions or any combination thereof. As of June 29, 2018, $701,284,313 (as reflected in the table above) was the approximate dollar amount of our common stock that may yet be purchased under our repurchase program, which does not have a stated expiration date. |
| (2) | Represents a combination of (a) shares of our common stock delivered to us in satisfaction of the tax withholding obligation of holders of performance units, restricted units or restricted shares that vested during the quarter and (b) performance units, restricted units or restricted shares returned to us upon retirement or employment termination of employees. Our equity incentive plans provide that the value of shares delivered to us to pay the exercise price of options or to cover tax withholding obligations shall be the closing price of our common stock on the date the relevant transaction occurs. |
The information required by this Item with respect to securities authorized for issuance under our equity compensation plans is included in “Item 12. Security Ownership of Certain Beneficial Owners and Management and Related Stockholder Matters” of this Report. See Note 14: Stock Options and Other Share-Based Compensation in the Notes for a general description of our share-based incentive plans.
Previous: Item 4. MINE SAFETY DISCLOSURES. · Next: Item 6. SELECTED FINANCIAL DATA.