 filings.tools
Item 5. Market for Registrant’s Common Equity, Related Stockholder Matters and Issuer Purchases of Equity Securities
8K characters. Original on sec.gov · Markdown
Item 5. Market for Registrant’s Common Equity, Related Stockholder Matters and Issuer Purchases of Equity Securities
Stock Information
Our Common Stock is traded on the Nasdaq Global Select MarketSM under the symbol “LRCX.” As of August 15, 2019, we had 401 stockholders of record.
Dividends
Our Board of Directors has declared quarterly dividends since April 2014. Our intent to continue to pay quarterly dividends is subject to capital availability and periodic determinations by our Board of Directors that cash dividends are in the best interest of our stockholders and are in compliance with all laws and agreements applicable to the declaration and payment of cash dividends by us. During fiscal year 2019, our quarterly dividend was $1.10 per share.
Repurchase of Company Shares
In November 2018, the Board of Directors authorized management to repurchase up to an additional $5.0 billion of Common Stock on such terms and conditions as it deems appropriate. These repurchases can be conducted on the open market or as private purchases and may include the use of derivative contracts with large financial institutions, in all cases subject to compliance with applicable law. This repurchase program has no termination date and may be suspended or discontinued at any time. Funding for this share repurchase program may be through a combination of cash on hand, cash generation, and borrowings. As of June 30, 2019, we have purchased approximately $2.0 billion of shares under this authorization, $0.5 billion via open market trading and $1.5 billion utilizing accelerated share repurchase arrangements.
Accelerated Share Repurchase Agreements
On June 4, 2019, we entered into four separate accelerated share repurchase agreements (collectively, the "June 2019 ASR") with two financial institutions to repurchase a total of $750 million of Common Stock. We took an initial delivery of approximately 3.1 million shares, which represented 75% of the prepayment amount divided by our closing stock price on June 4, 2019. The total number of shares received under the June 2019 ASR will be based upon the average daily volume weighted average price of our Common Stock during the repurchase period, less an agreed upon discount. Final settlement of the June 2019 ASR is anticipated to occur no later than November 20, 2019.
On January 31, 2019, we entered into two separate accelerated share repurchase agreements (collectively, the "January 2019 ASR") with two financial institutions to repurchase a total of $760 million of Common Stock. We took an initial delivery of approximately 3.3 million shares, which represented 75% of the prepayment amount divided by our closing stock price on January 30, 2019. The total number of shares received under the January 2019 ASR was based upon the average daily volume weighted average price of our Common Stock during the repurchase period, less an agreed upon discount. Final settlement of the agreements occurred during May 2019, resulted in the receipt of approximately 0.8 million additional shares, which yielded a weighted-average share price of approximately $182.32 for the transaction period.
Continues on next page
Lam Research Corporation 2019 10-K 27

Share repurchases, including those under the repurchase program, were as follows:
| Period | Total Number of Shares Repurchased (1) | Average Price Paid per Share**(2)** | Total Number of Shares Purchased as Part of Publicly Announced Plans or Programs | Amount Available Under Repurchase Program | |||||||||
| (in thousands, except per share data) | |||||||||||||
| Available balance as of June 24, 2018 | $ | 1,733,638 | |||||||||||
| Quarter ended September 23, 2018 | 7,821 | $ | 183.46 | 7,807 | 108 | ||||||||
| Board authorization, $5.0 billion, November 2018 | 5,000,000 | ||||||||||||
| Quarter ended December 23, 2018 | 1,693 | $ | 145.30 | 1,683 | 5,000,000 | ||||||||
| Quarter ended March 31, 2019 | 6,125 | $ | 172.06 | 5,702 | 4,138,494 | ||||||||
| April 1, 2019 - April 28, 2019 | 3 | $ | 193.52 | — | 4,138,494 | ||||||||
| April 29, 2019 - May 26, 2019 | 1,147 | $ | 190.89 | 1,143 | 3,920,258 | ||||||||
| May 27, 2019 - June 30, 2019 | 4,728 | $ | 176.68 | 4,724 | 3,033,500 | ||||||||
| Total | 21,517 | $ | 181.72 | 21,059 | $ | 3,033,500 |
| (1) | During the fiscal year ended June 30, 2019, we acquired 0.5 million shares at a total cost of $80.5 million which we withheld through net share settlements to cover minimum tax withholding obligations upon the vesting of restricted stock unit awards granted under our equity compensation plans. The shares retained by us through these net share settlements are not a part of the Board-authorized repurchase program but instead are authorized under our equity compensation plan. |
| (2) | Average price paid per share excludes effect of accelerated share repurchases, see additional disclosure above regarding our accelerated share repurchase activity during the fiscal year. |
Continues on next page
Lam Research Corporation 2019 10-K 28
Cumulative Five-Year Return
The graph below compares Lam Research Corporation’s cumulative five-year total shareholder return on Common Stock with the cumulative total returns of the Nasdaq Composite index, the Standard & Poor’s (“S&P”) 500 index, and the Philadelphia Semiconductor Sector Index. The graph tracks the performance of a $100 investment in our Common Stock and in each of the indices (with the reinvestment of all dividends) for the five years ended June 30, 2019.
| COMPARISON OF FIVE-YEAR CUMULATIVE TOTAL RETURN* | |||
| Among Lam Research Corporation, the Nasdaq Composite Index, the S&P 500 Index, and the Philadelphia Semiconductor Index |
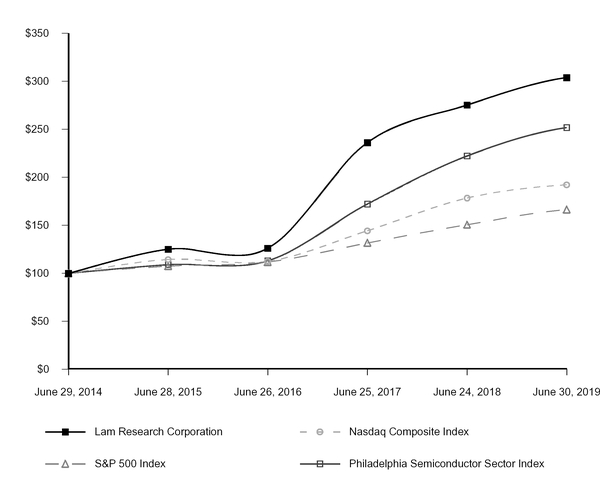
*$100 invested on June 29, 2014 in stock or June 30, 2014 in index, including reinvestment of dividends. Indexes calculated on month-end basis.
Copyright © 2019 Standard & Poor’s, a division of S&P Global. All rights reserved.
Continues on next page
Lam Research Corporation 2019 10-K 29
| June 29, 2014 | June 28, 2015 | June 26, 2016 | June 25, 2017 | June 24, 2018 | June 30, 2019 | ||||||||||||
| Lam Research Corporation | 100.00 | 125.08 | 126.17 | 236.07 | 275.33 | 303.92 | |||||||||||
| Nasdaq Composite Index | 100.00 | 114.44 | 112.51 | 144.35 | 178.42 | 192.30 | |||||||||||
| S&P 500 Index | 100.00 | 107.42 | 111.71 | 131.70 | 150.64 | 166.33 | |||||||||||
| Philadelphia Semiconductor Sector Index | 100.00 | 108.97 | 113.07 | 172.12 | 222.22 | 251.80 |
Previous: Item 4. Mine Safety Disclosures · Next: Item 6. Selected Financial Data