 filings.tools
Item 5. Market for Registrant’s Common Equity, Related Stockholder Matters, and Issuer Purchases of Equity Securities
6K characters. Original on sec.gov · Markdown
Item 5. Market for Registrant’s Common Equity, Related Stockholder Matters, and Issuer Purchases of Equity Securities
The Company’s common stock is listed on the New York Stock Exchange ("NYSE") and is traded under the symbol “LUV.” The following table shows the high and low prices per share of the Company’s common stock, as reported on the NYSE Composite Tape, and the cash dividends per share declared on the Company’s common stock.
| Period | Dividend | High | Low | |||||||||
| 2015 | ||||||||||||
| 1st Quarter | $ | 0.06000 | $ | 47.17 | $ | 38.26 | ||||||
| 2nd Quarter | 0.07500 | 44.19 | 33.02 | |||||||||
| 3rd Quarter | 0.07500 | 40.87 | 31.36 | |||||||||
| 4th Quarter | 0.07500 | 51.34 | 37.00 | |||||||||
| 2014 | ||||||||||||
| 1st Quarter | $ | 0.04000 | $ | 24.17 | $ | 18.78 | ||||||
| 2nd Quarter | 0.06000 | 27.70 | 22.35 | |||||||||
| 3rd Quarter | 0.06000 | 35.49 | 25.86 | |||||||||
| 4th Quarter | 0.06000 | 43.19 | 28.40 |
The Company currently intends to continue declaring dividends on a quarterly basis for the foreseeable future; however, the Company’s Board of Directors may elect to alter the timing, amount, and payment of dividends on the basis of operational results, financial condition, cash requirements, future prospects, and other factors deemed relevant by the Board. As of January 29, 2016, there were approximately 13,518 holders of record of the Company’s common stock.
Stock Performance Graph
The following Performance Graph and related information shall not be deemed “soliciting material” or “filed” with the Securities and Exchange Commission, nor shall such information be incorporated by reference into any future filing under the Securities Act of 1933 or Securities Exchange Act of 1934.
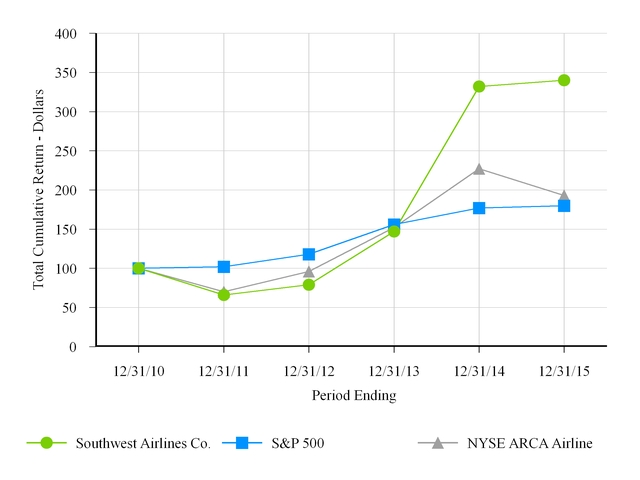
The following graph compares the cumulative total shareholder return on the Company’s common stock over the five-year period ended December 31, 2015, with the cumulative total return during such period of the Standard and Poor’s 500 Stock Index and the NYSE ARCA Airline Index. The comparison assumes $100 was invested on December 31, 2010, in the Company’s common stock and in each of the foregoing indices and assumes reinvestment of dividends. The stock performance shown on the graph below represents historical stock performance and is not necessarily indicative of future stock price performance.
COMPARISON OF FIVE YEAR CUMULATIVE TOTAL RETURN AMONG SOUTHWEST AIRLINES CO., S&P 500 INDEX, AND NYSE ARCA AIRLINE INDEX
| 12/31/2010 | 12/31/2011 | 12/31/2012 | 12/31/2013 | 12/31/2014 | 12/31/2015 | |||||||||||||||||||
| Southwest Airlines Co. | $ | 100 | $ | 66 | $ | 79 | $ | 147 | $ | 332 | $ | 340 | ||||||||||||
| S&P 500 | $ | 100 | $ | 102 | $ | 119 | $ | 156 | $ | 177 | $ | 180 | ||||||||||||
| NYSE ARCA Airline | $ | 100 | $ | 70 | $ | 96 | $ | 152 | $ | 227 | $ | 193 |
Issuer Repurchases
| Issuer Purchases of Equity Securities (1) | ||||||||||||||||
| (a) | (b) | (c) | (d) | |||||||||||||
| Total number of | Maximum dollar | |||||||||||||||
| shares purchased | value of shares that | |||||||||||||||
| Total number | Average | as part of publicly | may yet be purchased | |||||||||||||
| of shares | price paid | announced plans | under the plans | |||||||||||||
| Period | purchased | per share | or programs | or programs | ||||||||||||
| October 1, 2015 through October 31, 2015 | — | $ | — | — | $ | 700,000,000 | ||||||||||
| November 1, 2015 through November 30, 2015 | 3,213,009 | $ | — | (2 | ) | 3,213,009 | $ | 700,000,000 | ||||||||
| December 1, 2015 through December 31, 2015 | — | $ | — | — | $ | 700,000,000 | ||||||||||
| Total | 3,213,009 | 3,213,009 |
| (1) | In May 2015, the Company’s Board of Directors authorized the repurchase of up to $1.5 billion of the Company’s common stock. Repurchases are made in accordance with applicable securities laws in open market, private, or in accelerated repurchase transactions from time to time, depending on market conditions, and may be discontinued at any time. |
| (2) | Under an accelerated share repurchase program entered into by the Company with a third party financial institution in third quarter 2015 ("Third Quarter ASR Program"), the Company paid $500 million and received an initial delivery of 9,679,195 shares during third quarter 2015, representing an estimated 75 percent of the shares to be purchased by the Company under the Third Quarter ASR Program based on a volume-weighted average price of $38.74 per share of the Company’s common stock on the New York Stock Exchange during a calculation period between August 3, 2015 and August 20, 2015. Final settlement of this Third Quarter ASR Program occurred in November 2015 and was determined based generally on a discount to the volume-weighted average price per share of the Company's common stock during a calculation period completed in October 2015. Upon settlement, the third party financial institution delivered 3,213,009 additional shares of the Company’s common stock to the Company. In total, the average purchase price per share for the 12,892,204 shares repurchased under the Third Quarter ASR Program, upon completion of the Third Quarter ASR Program in November 2015, was $38.78. |
Previous: Item 4. Mine Safety Disclosures · Next: Item 6. Selected Financial Data