 filings.tools
Marriott International 10-K 2019-12-31
Filed 2020-02-27. 17 sections, 386K characters. Original on sec.gov · Markdown · JSON
Cover and table of contents
UNITED STATES
SECURITIES AND EXCHANGE COMMISSION
Washington, D.C. 20549
FORM 10-K
| ☒ | ANNUAL REPORT PURSUANT TO SECTION 13 OR 15(d) OF THE SECURITIES EXCHANGE ACT OF 1934 |
For the Fiscal Year Ended December 31, 2019
or
| ☐ | TRANSITION REPORT PURSUANT TO SECTION 13 OR 15(d) OF THE SECURITIES EXCHANGE ACT OF 1934 |
For the transition period from to
Commission File No. 1-13881

MARRIOTT INTERNATIONAL, INC.
(Exact name of registrant as specified in its charter)
| Delaware | 52-2055918 | |||||
| (State or other jurisdiction of incorporation or organization) | (IRS Employer Identification No.) | |||||
| 10400 Fernwood Road | Bethesda | Maryland | 20817 | |||
| (Address of Principal Executive Offices) | (Zip Code) |
Registrant’s Telephone Number, Including Area Code (301) 380-3000
Securities registered pursuant to Section 12(b) of the Act:
| Title of Each Class | Trading Symbol(s) | Name of Each Exchange on Which Registered | ||
| Class A Common Stock, $0.01 par value | MAR | Nasdaq Global Select Market | ||
| Class A Common Stock, $0.01 par value | MAR | Chicago Stock Exchange |
Securities registered pursuant to Section 12(g) of the Act: NONE
Indicate by check mark if the registrant is a well-known seasoned issuer, as defined in Rule 405 of the Securities Act. Yes ý No o
Indicate by check mark if the registrant is not required to file reports pursuant to Section 13 or Section 15(d) of the Act. Yes o No ý
Indicate by check mark whether the registrant: (1) has filed all reports required to be filed by Section 13 or 15(d) of the Securities Exchange Act of 1934 during the preceding 12 months (or for such shorter period that the registrant was required to file such reports), and (2) has been subject to such filing requirements for the past 90 days. Yes ý No o
Indicate by check mark whether the registrant has submitted electronically every Interactive Data File required to be submitted pursuant to Rule 405 of Regulation S-T during the preceding 12 months (or for such shorter period that the registrant was required to submit such files). Yes ý No o
Indicate by check mark whether the registrant is a large accelerated filer, an accelerated filer, a non-accelerated filer, smaller reporting company, or an emerging growth company. See the definitions of “large accelerated filer,” “accelerated filer,” “smaller reporting company,” and “emerging growth company” in Rule 12b-2 of the Exchange Act.
| Large accelerated filer | ý | Accelerated filer | o | |
| Non-accelerated filer | o | Smaller reporting company | ☐ | |
| Emerging growth company | ☐ | |||
| If an emerging growth company, indicate by check mark if the registrant has elected not to use the extended transition period for complying with any new or revised financial accounting standards provided pursuant to Section 13(a) of the Exchange Act. o |
Indicate by check mark whether the registrant is a shell company (as defined in Rule 12b-2 of the Exchange Act). Yes ☐ No ý
The aggregate market value of shares of common stock held by non-affiliates at June 28, 2019, was $38,730,375,024.
There were 324,214,545 shares of Class A Common Stock, par value $0.01 per share, outstanding at February 20, 2020.
DOCUMENTS INCORPORATED BY REFERENCE
Portions of the Proxy Statement prepared for the 2020 Annual Meeting of Shareholders are incorporated by reference into Part III of this report.
MARRIOTT INTERNATIONAL, INC.
FORM 10-K TABLE OF CONTENTS
FISCAL YEAR ENDED DECEMBER 31, 2019
Throughout this report, we refer to Marriott International, Inc., together with its consolidated subsidiaries, as “we,” “us,” “Marriott,” or “the Company.” In order to make this report easier to read, we also refer throughout to (i) our Consolidated Financial Statements as our “Financial Statements,” (ii) our Consolidated Statements of Income as our “Income Statements,” (iii) our Consolidated Balance Sheets as our “Balance Sheets,” (iv) our Consolidated Statements of Cash Flows as our “Statements of Cash Flows,” (v) our properties, brands, or markets in the United States (“U.S.”) and Canada as “North America” or “North American,” and (vi) our properties, brands, or markets in our Caribbean and Latin America, Europe, and Middle East and Africa regions as “Other International,” and together with those in our Asia Pacific segment, as “International.” In addition, references throughout to numbered “Notes” refer to the Notes to our Financial Statements, unless otherwise stated.
PART I
Item 1. Business.
Corporate Structure and Business
We are a worldwide operator, franchisor, and licensor of hotel, residential, and timeshare properties under numerous brand names at different price and service points. Consistent with our focus on management, franchising, and licensing, we own very few of our lodging properties. We were organized as a corporation in Delaware in 1997 and became a public company in 1998 when we were “spun off” as a separate entity by the company formerly named “Marriott International, Inc.”
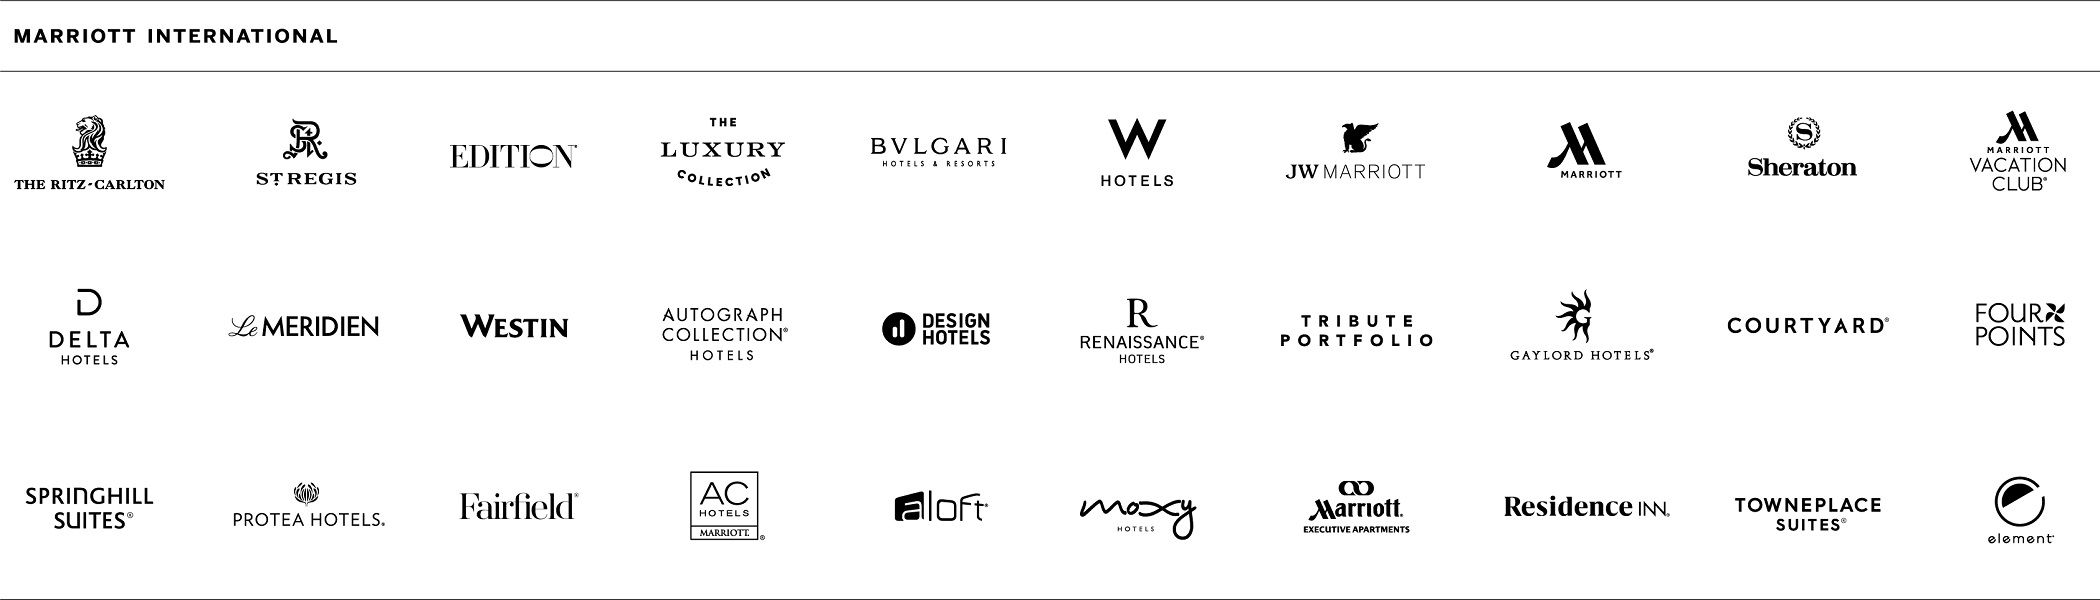
We believe that our portfolio of brands, shown in the following table, is the largest and most compelling range of brands and properties of any lodging company in the world.
We discuss our operations in the following reportable business segments: North American Full-Service, North American Limited-Service, and Asia Pacific. Our Europe, Middle East and Africa, and Caribbean and Latin America operating segments do not individually meet the criteria for separate disclosure as reportable segments. In January 2020, we modified our reportable segment structure as a result of a change in the way management intends to evaluate results and allocate resources within the Company. Beginning with the first quarter of 2020, we will present the following reportable business segments: North America; Asia Pacific; and Europe, Middle East, and Africa. Our Caribbean and Latin America operating segment will be included in a combined Caribbean and Latin America and “Unallocated corporate” caption. See Note 15 for more information.
Acquisition of Elegant
On December 9, 2019, we completed the acquisition of Elegant Hotels Group plc (“Elegant”), and Elegant became an indirect wholly-owned subsidiary of the Company. See Note 3 for more information.
Acquisition of Starwood Hotels & Resorts Worldwide
On September 23, 2016 (the “Merger Date”), we completed the acquisition of Starwood Hotels & Resorts Worldwide, LLC, formerly known as Starwood Hotels & Resorts Worldwide, Inc. (“Starwood”), through a series of transactions (the “Starwood Combination”), after which Starwood became an indirect wholly-owned subsidiary of the Company. We refer to our business associated with brands that were in our portfolio before the Starwood Combination as “Legacy-Marriott” and to the Starwood business and brands that we acquired as “Legacy-Starwood.”
Starwood Reservations Database Security Incident
On November 30, 2018, we announced a data security incident involving unauthorized access to the Starwood reservations database (the “Data Security Incident”). The Starwood reservations database is no longer used for business operations. For further information about the Data Security Incident, see Part II, Item 7 “Management’s Discussion and Analysis of Financial Condition and Results of Operations” and “Data Security Incident” in Note 7 in Part II, Item 8.
Company-Operated Properties
At year-end 2019, we had 2,144 company-operated properties (584,879 rooms), which included properties under long-term management or lease agreements with property owners (management and lease agreements together, the “Operating Agreements”), properties that we own, and home and condominium communities for which we manage the related owners’ associations.
Terms of our management agreements vary, but we earn a management fee that is typically composed of a base management fee, which is a percentage of the revenues of the hotel, and an incentive management fee, which is based on the profits of the hotel. Our management agreements also typically include reimbursement of costs of operations (both direct and indirect). Such agreements are generally for initial periods of 20 to 30 years, with options for us to renew for up to 50 or more additional years. Our lease agreements also vary, but may include fixed annual rentals plus additional rentals based on a specified percentage of annual revenues that exceed a fixed amount. Many of our Operating Agreements are subordinated to mortgages or other liens securing indebtedness of the owners. Many of our Operating Agreements also permit the owners to terminate the agreement if we do not meet certain performance metrics, financial returns fail to meet defined levels for a period of time, and we have not cured those deficiencies. In certain circumstances, some of our management agreements allow owners to convert company-operated properties to franchised properties under our brands.
For the lodging facilities we operate, we generally are responsible for hiring, training, and supervising the managers and employees needed to operate the facilities and for purchasing supplies, and owners are required to reimburse us for those costs. We provide centralized reservation services and advertising, marketing, and promotional services, as well as various accounting and data processing services, and owners are also required to reimburse us for those costs.
Franchised, Licensed, and Unconsolidated Joint Venture Properties
We have franchising, licensing, and joint venture programs that permit hotel owners and operators to use many of our lodging brand names and systems. Under our hotel franchising programs, we generally receive an initial application fee and continuing royalty fees, which typically range from four to seven percent of room revenues for all brands, plus two to three percent of food and beverage revenues for certain full-service brands. Franchisees and certain joint ventures contribute to our marketing and advertising programs and pay fees for use of our centralized reservation systems.
We also receive royalty fees under license agreements with Marriott Vacations Worldwide Corporation (“MVW”), our former timeshare subsidiary that we spun off in 2011, and its affiliates for certain brands, including Marriott Vacation Club, Grand Residences by Marriott, The Ritz-Carlton Destination Club, Westin, Sheraton, and for certain existing properties, St. Regis and The Luxury Collection. We receive license fees from MVW consisting of a fixed annual fee, adjusted for inflation, plus certain variable fees based on sales volumes.
At year-end 2019, we had 5,205 franchised and licensed properties (796,042 rooms).
Residential
We use or license our trademarks for the sale of residential real estate, often in conjunction with hotel development, and receive branding fees for sales of such branded residential real estate by others. Third-party owners typically construct and sell residences with limited amounts, if any, of our capital at risk. We have used or licensed our JW Marriott, The Ritz-Carlton, Ritz-Carlton Reserve, W, The Luxury Collection, St. Regis, EDITION, Bulgari, Marriott, Sheraton, Westin, Four Points, Delta and Autograph Collection brand names and trademarks for residential real estate sales.
Seasonality
In general, business at company-operated and franchised properties fluctuates moderately with the seasons and is relatively stable. Business at some resort properties may be more seasonal depending on location.
Relationship with Major Customer
We operate or franchise properties that are owned or leased by Host Hotels & Resorts, Inc. (“Host”). In addition, Host is a partner in several partnerships that own properties that we operate under long-term management agreements. See Note 17 for more information.
Intellectual Property
We operate in a highly competitive industry and our brand names, trademarks, service marks, trade names, and logos are very important to the sales and marketing of our properties and services. We believe that our brand names and other intellectual property have come to represent the highest standards of quality, care, service, and value to our customers, guests, and the traveling public. Accordingly, we register and protect our intellectual property where we deem appropriate and otherwise protect against its unauthorized use.
Brand Portfolio
We believe that our brand portfolio offers the largest and most compelling range of brands and properties in hospitality, with two overall styles of hotels -- Classic, offering time-honored hospitality for the modern traveler, and Distinctive, offering memorable experiences with a unique perspective -- each of which we group into three quality tiers: Luxury, Premium, and Select.
Luxury offers bespoke and superb amenities and services. Our Classic Luxury hotel brands include JW Marriott, The Ritz-Carlton, and St. Regis. Our Distinctive Luxury hotel brands include W Hotels, The Luxury Collection, EDITION, and Bulgari.
Premium offers sophisticated and thoughtful amenities and services. Our Classic Premium hotel brands include Marriott Hotels, Sheraton, Delta Hotels, Marriott Executive Apartments, and Marriott Vacation Club. Our Distinctive Premium hotel brands include Westin, Renaissance, Le Méridien, Autograph Collection, Gaylord Hotels, Tribute Portfolio, and Design Hotels.
Select offers smart and easy amenities and services with our longer stay brands offering amenities that mirror the comforts of home. Our Classic Select hotel brands include Courtyard, Residence Inn, Fairfield by Marriott, SpringHill Suites, Four Points, TownePlace Suites, and Protea Hotels. Our Distinctive Select hotel brands include Aloft, AC Hotels by Marriott, Element, and Moxy.
The following table shows the geographic distribution of our brands at year-end 2019:
| North America | Europe | Middle East & Africa | Asia Pacific | Caribbean & Latin America | Total | ||
| Luxury | |||||||
| JW Marriott® | Properties | 30 | 7 | 6 | 40 | 13 | 96 |
| Rooms | 16,853 | 2,205 | 3,327 | 15,080 | 3,597 | 41,062 | |
| The Ritz-Carlton® | Properties | 39 | 13 | 13 | 33 | 8 | 106 |
| Rooms | 11,410 | 3,079 | 3,523 | 8,207 | 2,081 | 28,300 | |
| W® Hotels | Properties | 26 | 7 | 5 | 14 | 6 | 58 |
| Rooms | 7,672 | 1,423 | 1,850 | 3,788 | 1,074 | 15,807 | |
| The Luxury Collection® (1) | Properties | 16 | 47 | 10 | 31 | 14 | 118 |
| Rooms | 4,799 | 6,962 | 2,411 | 7,883 | 1,188 | 23,243 | |
| St. Regis® | Properties | 10 | 7 | 5 | 20 | 3 | 45 |
| Rooms | 1,968 | 1,002 | 1,426 | 4,812 | 448 | 9,656 | |
| EDITION® | Properties | 4 | 3 | 1 | 2 | — | 10 |
| Rooms | 1,209 | 381 | 255 | 651 | — | 2,496 | |
| Bulgari® | Properties | — | 2 | 1 | 3 | — | 6 |
| Rooms | — | 143 | 120 | 260 | — | 523 | |
| Premium | |||||||
| Marriott Hotels® | Properties | 340 | 97 | 25 | 83 | 30 | 575 |
| Rooms | 134,412 | 24,595 | 8,119 | 28,000 | 8,033 | 203,159 | |
| Sheraton® | Properties | 189 | 62 | 31 | 130 | 35 | 447 |
| Rooms | 72,039 | 17,054 | 9,910 | 47,878 | 9,682 | 156,563 | |
| Westin® | Properties | 130 | 18 | 7 | 58 | 12 | 225 |
| Rooms | 53,097 | 6,024 | 1,839 | 17,872 | 3,640 | 82,472 | |
| Renaissance® Hotels | Properties | 86 | 34 | 4 | 42 | 9 | 175 |
| Rooms | 28,597 | 8,049 | 1,035 | 14,535 | 2,745 | 54,961 | |
| Le Méridien® | Properties | 21 | 15 | 23 | 49 | 2 | 110 |
| Rooms | 4,480 | 5,021 | 6,526 | 12,903 | 271 | 29,201 | |
| Autograph Collection® Hotels (2) | Properties | 108 | 53 | 9 | 9 | 13 | 192 |
| Rooms | 22,463 | 7,165 | 1,906 | 2,364 | 3,751 | 37,649 | |
| Delta Hotels by MarriottTM (Delta Hotels®) | Properties | 72 | 5 | 1 | 1 | — | 79 |
| Rooms | 17,376 | 729 | 360 | 339 | — | 18,804 | |
| Gaylord Hotels® | Properties | 6 | — | — | — | — | 6 |
| Rooms | 9,918 | — | — | — | — | 9,918 | |
| Marriott Executive Apartments® | Properties | — | 4 | 9 | 17 | 2 | 32 |
| Rooms | — | 361 | 1,029 | 2,959 | 240 | 4,589 | |
| Tribute Portfolio® | Properties | 21 | 8 | — | 8 | 3 | 40 |
| Rooms | 4,445 | 905 | — | 1,107 | 155 | 6,612 | |
| Design Hotels® | Properties | 1 | 3 | — | — | — | 4 |
| Rooms | 248 | 542 | — | — | — | 790 | |
| Select | |||||||
| Courtyard by Marriott® (Courtyard®) | Properties | 1,053 | 68 | 7 | 72 | 41 | 1,241 |
| Rooms | 146,602 | 12,892 | 1,487 | 16,931 | 6,717 | 184,629 | |
| Residence Inn by Marriott® (Residence Inn®) | Properties | 833 | 12 | 3 | — | 2 | 850 |
| Rooms | 103,038 | 1,477 | 301 | — | 249 | 105,065 | |
| Fairfield by Marriott® | Properties | 1,001 | — | — | 42 | 14 | 1,057 |
| Rooms | 94,063 | — | — | 7,050 | 2,036 | 103,149 | |
| SpringHill Suites by Marriott® (SpringHill Suites®) | Properties | 456 | — | — | — | — | 456 |
| Rooms | 54,033 | — | — | — | — | 54,033 | |
| Four Points® by Sheraton (Four Points®) | Properties | 159 | 18 | 17 | 75 | 20 | 289 |
| Rooms | 23,847 | 2,778 | 4,371 | 18,561 | 2,686 | 52,243 | |
| TownePlace Suites by Marriott® (TownePlace Suites®) | Properties | 418 | — | — | — | — | 418 |
| Rooms | 42,378 | — | — | — | — | 42,378 |
| North America | Europe | Middle East & Africa | Asia Pacific | Caribbean & Latin America | Total | ||
| Aloft® Hotels | Properties | 119 | 10 | 8 | 29 | 10 | 176 |
| Rooms | 17,647 | 1,801 | 2,012 | 6,598 | 1,644 | 29,702 | |
| AC Hotels by Marriott® | Properties | 63 | 83 | 1 | — | 12 | 159 |
| Rooms | 10,720 | 10,631 | 188 | — | 1,922 | 23,461 | |
| Protea Hotels by Marriott® (Protea Hotels®) | Properties | — | — | 80 | — | — | 80 |
| Rooms | — | — | 8,359 | — | — | 8,359 | |
| Element® Hotels | Properties | 42 | 2 | 1 | 6 | — | 51 |
| Rooms | 5,785 | 293 | 168 | 1,253 | — | 7,499 | |
| Moxy® Hotels | Properties | 21 | 37 | — | 4 | — | 62 |
| Rooms | 4,149 | 7,451 | — | 609 | — | 12,209 | |
| Residences and Timeshare | |||||||
| Residences | Properties | 60 | 8 | 3 | 14 | 10 | 95 |
| Rooms | 6,557 | 298 | 308 | 2,132 | 573 | 9,868 | |
| Timeshare | Properties | 72 | 5 | — | 5 | 9 | 91 |
| Rooms | 18,668 | 919 | — | 471 | 2,463 | 22,521 | |
| Total Properties | 5,396 | 628 | 270 | 787 | 268 | 7,349 | |
| Total Rooms | 918,473 | 124,180 | 60,830 | 222,243 | 55,195 | 1,380,921 |
| (1) | Includes two properties acquired when we purchased Elegant in December 2019 which we currently intend to re-brand under The Luxury Collection brand following the completion of planned renovations. |
| (2) | Includes five properties acquired when we purchased Elegant in December 2019 which we currently intend to re-brand under the Autograph Collection brand following the completion of planned renovations. |
Other Activities
Loyalty Program, Sales and Marketing, and Reservation Systems*.* On February 13, 2019, we completed the integration of our three legacy loyalty programs - Marriott Rewards, The Ritz-Carlton Rewards, and Starwood Preferred Guest - under one name, Marriott BonvoyTM. Members have access to Marriott Bonvoy’s diverse brand portfolio, rich benefits, and travel experiences. We refer to Marriott Bonvoy throughout this report as our “Loyalty Program.”
Our Loyalty Program rewards members with points toward free hotel stays, access to travel experiences through our Marriott Bonvoy Tours & Activities program, miles with participating airline programs, and other benefits. We believe that our Loyalty Program generates substantial repeat business that might otherwise go to competing hotels. In 2019, over 50 percent of our room nights were booked by Loyalty Program members. We strategically market to this large and growing guest base to generate revenue. See the “Loyalty Program” caption in Note 2 for more information.
Marriott.com, our international websites, and our mobile apps continued to grow significantly in 2019. Our web and mobile products allow for a seamless booking experience and easy enrollment in our Loyalty Program to book our exclusive Member Rates. Our Look No Further® Best Rate Guarantee ensures best rate integrity, strengthening consumer confidence in our brand, and gives guests greater access to the same rates when they book hotel rooms through our various direct channels. We also continue to grow engagement levels with millions of guests through our digital guest services - check-in, check-out, service requests, mobile key, and more - across our hotel portfolio. Our digital strategy continues to focus on creating a simple and efficient digital booking experience, while elevating the service experience through digital guest services and generating superior guest satisfaction and more memorable stays at our properties.
At year-end 2019, we operated 22 hotel reservation centers, eight in the U.S. and 14 in other countries and territories, which handle reservation requests for our lodging brands worldwide, including franchised properties. We own two of the U.S. facilities and either lease the others or share space with a company-operated property. Our reservation system manages inventory and allows us to utilize third-party agents where cost effective. Economies of scale enable us to minimize costs per occupied room, drive profits for our owners and franchisees, and enhance our fee revenue.
We believe our global sales and revenue management organizations are a key competitive advantage due to our unrelenting focus on optimizing our investment in people, processes, and systems. Our above-property sales deployment strategy aligns our sales efforts around how the customer wants to buy, reducing duplication of efforts by individual hotels and
allowing us to cover a larger number of accounts. We also utilize innovative and sophisticated revenue management systems, many of which are proprietary, which we believe provide a competitive advantage in pricing decisions, increasing efficiency and producing higher property-level revenue for hotels in our portfolio. Most of the hotels in our portfolio utilize web-based programs to effectively manage the rate set-up and modification processes which provides for greater pricing flexibility, reduces time spent on rate program creation and maintenance, and increases the speed to market of new products and services.
Credit Card Programs. We have multi-year agreements with JP Morgan Chase and American Express for our U.S.-issued, co-brand credit cards associated with our Loyalty Program. We also license credit card programs internationally, including in Canada, the United Kingdom, United Arab Emirates, and Japan. We earn fixed amounts that are generally payable at contract inception and variable amounts that are paid to us monthly over the term of the agreements primarily based on card usage, and we believe that our co-brand credit cards contribute to the success of our Loyalty Program and reflect the quality and value of our portfolio of brands.
Sustainability and Social Impact*.* Guided by our 2025 sustainability and social impact goals, as well as the United Nations Sustainable Development Goals, we believe we have an opportunity to create a positive and sustainable impact wherever we do business. Our sustainability and social impact platform, Serve 360: Doing Good In Every Direction, is built around four focus areas: Nurture Our World; Sustain Responsible Operations; Empower Through Opportunity; and Welcome All and Advance Human Rights - each with targets to drive our efforts through 2025. These targets reflect our goals to protect and invest in the vitality of the communities and natural environments in which we operate, build and operate sustainable hotels, source responsibly, advance human rights, and mitigate climate-related risk. In 2019, we continued to implement programs designed to help reduce our carbon, water, and waste footprints, with programming such as the switch from single-use toiletry bottles to larger, pump-topped bottles at many properties. When implemented globally, our expanded toiletry program is expected to help reduce our current amenity plastic usage by approximately 30 percent. We also made significant progress toward our goal to train 100% of on-property associates in human trafficking awareness by 2025, with over 675,000 associates trained as of year-end 2019. These and other sustainability and social impact efforts help us to address the growing expectations of our stakeholders, increase our operational efficiency and excellence, and enhance our reputation while mitigating risk and supporting the continued growth and resiliency of our business.
Global Design Division. Our Global Design division provides design, development, refurbishment, and procurement services to owners and franchisees of lodging properties on a voluntary basis outside the scope of and separate from our management or franchise contracts. Like third-party contractors, Global Design provides these services on a fee basis to owners and franchisees of our branded properties.
Competition
We encounter strong competition both as a lodging operator and as a franchisor. According to lodging industry data, in the U.S. alone, there are over 1,800 lodging management companies, including approximately 18 that operate more than 100 properties. These operators are primarily private management firms, but also include several large national and international chains that own and operate their own hotels, operate hotels on behalf of third-party owners, and also franchise their brands. Management contracts are typically long-term in nature, but most allow the hotel owner to replace the management firm if it does not meet certain financial or performance criteria.
We also compete for guests with large companies that offer online travel services as part of their business model, search engines such as Google and Bing, and online services including Airbnb and HomeAway that allow travelers to book short-term rentals of homes and apartments as an alternative to hotel rooms. We compete against lodging operators, franchisors, and other competitors for guests in many areas, including brand recognition and reputation, location, guest satisfaction, room rates, quality of service, amenities, quality of accommodations, security, and the ability to earn and redeem loyalty program points.
Affiliation with a national or regional brand is common in the U.S. lodging industry, and we believe that our brand recognition assists us in attracting and retaining guests, owners, and franchisees. In 2019, approximately 72 percent of U.S. hotel rooms were brand-affiliated. Most of the branded properties are franchises, under which the owner pays the franchisor a fee for use of its hotel name and reservation system. In the franchising business, we face many competitors that have strong brands and guest appeal, including Hilton, Intercontinental Hotels Group, Hyatt, Wyndham, Accor, Choice, Radisson, Best Western, and others.
Outside the U.S., branding is much less prevalent and most markets are served primarily by independent operators, although branding is more common for new hotel development. We believe that chain affiliation will increase in many overseas markets as local economies grow, trade barriers decline, international travel accelerates, and hotel owners seek the benefits of centralized reservation systems, marketing programs, and our Loyalty Program.
Based on lodging industry data, we have an approximately 16 percent share of the U.S. hotel market (based on number of rooms) and we estimate less than a four percent share of the hotel market outside the U.S. We believe that our hotel brands are attractive to hotel owners seeking a management company or franchise affiliation because our hotels typically generate higher Revenue per Available Room (“RevPAR”) than our direct competitors in most market areas. We attribute this performance premium to our success in achieving and maintaining strong guest preference. We believe that the location and quality of our lodging facilities, our marketing programs, our reservation systems, our Loyalty Program, and our emphasis on guest service and guest and associate satisfaction contribute to guest preference across all our brands.
Properties that we operate, franchise, or license are regularly upgraded to maintain their competitiveness. Most of our management agreements provide for the allocation of funds to be set aside, generally a fixed percentage of revenue, for periodic refurbishment and replacement of furnishings, fixtures, and equipment. These ongoing refurbishment programs, along with periodic brand initiatives, are generally adequate to preserve or enhance the competitive position and earning power of the properties. Properties converting to one of our brands typically complete renovations as needed in conjunction with the conversion.
Employee Relations
At year-end 2019, we had approximately 174,000 employees, approximately 22,000 of whom were represented by labor unions in the United States, the country with our most significant union representation. These numbers do not include hotel personnel employed by our owners, franchisees, and management companies hired by our franchisees. We believe relations with our employees are positive.
Environmental Compliance
The properties we operate or develop are subject to national, regional, state or provincial, and local laws and regulations that govern the discharge of materials into the environment or otherwise relate to protecting the environment. Those environmental provisions include requirements that address health and safety; the use, management, and disposal of hazardous substances and wastes; and emission or discharge of wastes or other materials. We believe that our operation and development of properties complies, in all material respects, with environmental laws and regulations. Compliance with such provisions has not materially impacted our capital expenditures, earnings, or competitive position, and we do not anticipate that it will have a material impact in the future.
Internet Address and Company SEC Filings
Our primary Internet address is Marriott.com. On the investor relations portion of our website, Marriott.com/investor, we provide a link to our electronic filings with the U.S. Securities and Exchange Commission (the “SEC”), including our annual report on Form 10-K, our quarterly reports on Form 10-Q, our current reports on Form 8-K, and any amendments to these reports. We make all such filings available free of charge as soon as reasonably practicable after filing. The information found on our website is not part of this or any other report we file with or furnish to the SEC.
Item 1A. Risk Factors.
Forward-Looking Statements
We make forward-looking statements in Management’s Discussion and Analysis of Financial Condition and Results of Operations and elsewhere in this Annual Report based on the beliefs and assumptions of our management and on information currently available to us. Forward-looking statements include information about our possible or assumed future results of operations, which follow under the captions “Business and Overview,” “Liquidity and Capital Resources,” and other statements throughout this Annual Report preceded by, followed by, or that include the words “believes,” “expects,” “anticipates,” “intends,” “plans,” “estimates,” or similar expressions.
Any number of risks and uncertainties could cause actual results to differ materially from those we express in our forward-looking statements, including the risks and uncertainties we describe below and other factors we describe from time to time in our periodic filings with the SEC. We therefore caution you not to rely unduly on any forward-looking statement. The forward-looking statements in this Annual Report speak only as of the date of this Annual Report, and we undertake no obligation to update or revise any forward-looking statement, whether due to new information, future developments, or otherwise.
Risks and Uncertainties
We are subject to various risks that make an investment in our securities risky. The events and consequences discussed in these risk factors could, in circumstances we may or may not be able to accurately predict, recognize, or control, have a material adverse effect on our business, growth, reputation, prospects, financial condition, operating results (including components of our financial results), cash flows, liquidity, and stock price. In addition, these risks could cause results to differ materially from those we express in forward-looking statements contained in this Annual Report or in other Company communications. These risk factors do not identify all risks that we face; our operations could also be affected by factors, events, or uncertainties that are not presently known to us or that we currently do not consider to present significant risks to our operations. Because there is no way to determine in advance whether, or to what extent, any present uncertainty will ultimately impact our business, you should give equal weight to each of the following:
Our industry is highly competitive, which may impact our ability to compete successfully for guests with other hotel properties and home sharing or rental services. We operate in markets that contain many competitors. Each of our hotel brands and our home rental offering competes with major hotel chains, regional hotel chains, independent hotels, and home sharing and rental services across national and international venues. Our ability to remain competitive and attract and retain business and leisure travelers depends on our success in distinguishing the quality, value, and efficiency of our lodging products and services, including our Loyalty Program, direct booking channels, and consumer-facing technology platforms and services, from those offered by others. If we cannot compete successfully in these areas, our operating margins could contract, our market share could decrease, and our earnings could decline. Further, new lodging supply in individual markets could have a negative impact on the hotel industry and hamper our ability to increase room rates or occupancy in those markets.
Economic downturns and other global, national, and regional conditions could impact our financial results and growth. Because we conduct our business on a global platform, changes in global, national, or regional economies, governmental policies (including in areas such as trade, travel, immigration, healthcare, and related issues), and geopolitical conditions impact our activities. Our business is impacted by decreases in travel resulting from weak economic conditions, changes in energy prices and currency values, political instability, heightened travel security measures, travel advisories, disruptions in air travel, and concerns over disease, violence, war, or terrorism. Our performance could be materially affected if these conditions arise or extend longer than anticipated, or in other circumstances that we are not able to predict or mitigate.
During the last recession when demand for hotel rooms declined significantly, particularly in 2009, we took steps to reduce operating costs and improve efficiency and such cost controls could again become necessary if demand significantly declines. Our efforts to implement any such changes in a manner designed to maintain guest loyalty, owner preference, and associate satisfaction may not be successful, and our market share may suffer as a result.
In addition, U.S. government travel and travel associated with U.S. government operations are a significant part of our business, which can suffer due to U.S. federal spending cuts, government hiring restrictions, or other spending limitations that may result from presidential or congressional action or inaction, including for example, a U.S. federal government shutdown, such as the partial shutdown that occurred in December 2018 and January 2019.
Risks Relating to Our Integration of Starwood
Some of the anticipated benefits of combining Starwood and Marriott may still not be realized and challenges related to our integration efforts could have adverse effects on our business. Although we have achieved substantial benefits from the Starwood Combination, we cannot assure you when or that we will be able to fully realize additional benefits that we anticipated when we decided to acquire Starwood, including enhancing revenues or achieving other operating efficiencies or cost savings. We also cannot assure you that challenges we encountered with the harmonization of our systems, our Loyalty Program, and other business practices (some of which still place a significant burden on our management and internal resources) will not have significant adverse effects on our business or reputation.
Program changes associated with our integration efforts could have a negative effect on guest preference or behavior. Our integration efforts involved significant changes to certain of our guest programs and services, including our Loyalty Program, co-brand credit card arrangements, and consumer-facing technology platforms and services. While we believe such changes enhance these programs and services for our guests and will drive guest preference and satisfaction, these changes remain subject to various uncertainties, including whether the changes could be negatively perceived by certain guests and consumers, could affect guest preference or could alter reservation, spending or other guest or consumer behavior, all of which could adversely affect our market share, reputation, business, financial condition, or results of operations.
Risks Relating to Our Business
Operational Risks
Premature termination of our management or franchise agreements could hurt our financial performance. Our hotel management and franchise agreements may be subject to premature termination in certain circumstances, such as the bankruptcy of a hotel owner or franchisee, a failure under some agreements to meet specified financial or performance criteria that are subject to the risks described in this section, which we fail or elect not to cure, or in certain limited cases, other negotiated contractual termination rights. Some courts have also applied agency law principles and related fiduciary standards to managers of third-party hotel properties, including us (or have interpreted hotel management agreements to be “personal services contracts”). Property owners may assert the right to terminate management agreements even where the agreements provide otherwise, and some courts have upheld such assertions about our management agreements an
Showing the first 8K of 63K characters. Open the full section
Item 1B. Unresolved Staff Comments.
None.
Item 2. Properties.
We describe our company-operated properties in Part I, Item 1. “Business” earlier in this report, and under the “Properties and Rooms” caption in Part II, Item 7. “Management’s Discussion and Analysis of Financial Condition and Results of Operations.” We believe our owned and leased properties are in generally good physical condition with the need for only routine repairs and maintenance and periodic capital improvements. Most of our regional offices, reservation centers, and sales offices, as well as our corporate headquarters, are in leased facilities, both domestically and internationally.
As of December 31, 2019, we owned or leased the following hotel properties:
| Properties | Location | Rooms | |||
| North American Full-Service | |||||
| Owned Hotels | |||||
| The Westin Peachtree Plaza, Atlanta | Atlanta, GA | 1,073 | |||
| Sheraton Phoenix Downtown | Phoenix, AZ | 1,000 | |||
| W New York - Union Square | New York, NY | 270 | |||
| Las Vegas Marriott | Las Vegas, NV | 278 | |||
| Leased Hotels | |||||
| W New York – Times Square | New York, NY | 509 | |||
| Renaissance New York Times Square Hotel | New York, NY | 317 | |||
| Anaheim Marriott | Anaheim, CA | 1,030 | |||
| Kaua’i Marriott Resort | Lihue, HI | 356 | |||
| North American Limited-Service | |||||
| Owned Hotels | |||||
| Courtyard Las Vegas Convention Center | Las Vegas, NV | 149 | |||
| Residence Inn Las Vegas Convention Center | Las Vegas, NV | 192 | |||
| Leased Hotels | |||||
| Albuquerque Airport Courtyard | Albuquerque, NM | 150 | |||
| Baltimore BWI Airport Courtyard | Linthicum, MD | 149 | |||
| Baton Rouge Acadian Centre/LSU Area Courtyard | Baton Rouge, LA | 149 | |||
| Chicago O'Hare Courtyard | Des Plaines, IL | 180 | |||
| Des Moines West/Clive Courtyard | Clive, IA | 108 | |||
| Fort Worth University Drive Courtyard | Fort Worth, TX | 130 | |||
| Greensboro Courtyard | Greensboro, NC | 149 | |||
| Indianapolis Airport Courtyard | Indianapolis, IN | 151 | |||
| Irvine John Wayne Airport/Orange County Courtyard | Irvine, CA | 153 | |||
| Louisville East Courtyard | Louisville, KY | 151 | |||
| Mt. Laurel Courtyard | Mt Laurel, NJ | 151 | |||
| Newark Liberty International Airport Courtyard | Newark, NJ | 146 | |||
| Orlando Airport Courtyard | Orlando, FL | 149 | |||
| Orlando International Drive/Convention Center Courtyard | Orlando, FL | 151 | |||
| Sacramento Airport Natomas Courtyard | Sacramento, CA | 149 | |||
| San Diego Sorrento Valley Courtyard | San Diego, CA | 149 | |||
| Spokane Downtown at the Convention Center Courtyard | Spokane, WA | 149 | |||
| St. Louis Downtown West Courtyard | St. Louis, MO | 151 | |||
| Asia Pacific | |||||
| Leased Hotels | |||||
| The Ritz-Carlton, Tokyo | Tokyo, Japan | 250 | |||
| The St. Regis Osaka | Osaka, Japan | 160 |
| Properties | Location | Rooms | |||
| Other International | |||||
| Owned Hotels | |||||
| Sheraton Grand Rio Hotel & Resort | Rio de Janeiro, Brazil | 538 | |||
| Sheraton Lima Hotel & Convention Center | Lima, Peru | 431 | |||
| Sheraton Mexico City Maria Isabel Hotel | Mexico City, Mexico | 755 | |||
| Courtyard by Marriott Toulouse Airport | Toulouse, France | 187 | |||
| Courtyard by Marriott Aberdeen Airport | Aberdeen, UK | 194 | |||
| Courtyard by Marriott Rio de Janeiro Barra da Tijuca | Barra da Tijuca, Brazil | 264 | |||
| Residence Inn Rio de Janeiro Barra da Tijuca | Barra da Tijuca, Brazil | 140 | |||
| Treasure Beach, Barbados | Barbados | 35 | |||
| Crystal Cove, Barbados | Barbados | 88 | |||
| Tamarind, Barbados | Barbados | 104 | |||
| Waves, Barbados | Barbados | 70 | |||
| The House, Barbados | Barbados | 34 | |||
| Colony Club, Barbados | Barbados | 96 | |||
| Turtle Beach, Barbados | Barbados | 161 | |||
| Leased Hotels | |||||
| Grosvenor House, A JW Marriott Hotel | London, UK | 496 | |||
| The Ritz-Carlton, Berlin | Berlin, Germany | 303 | |||
| W Barcelona | Barcelona, Spain | 473 | |||
| W London – Leicester Square | London, UK | 192 | |||
| Hotel Alfonso XIII, a Luxury Collection Hotel, Seville | Seville, Spain | 148 | |||
| Hotel Maria Cristina, San Sebastian | San Sebastian, Spain | 139 | |||
| Cape Town Marriott Hotel Crystal Towers | Cape Town, South Africa | 180 | |||
| Frankfurt Marriott Hotel | Frankfurt, Germany | 593 | |||
| Berlin Marriott Hotel | Berlin, Germany | 379 | |||
| Leipzig Marriott Hotel | Leipzig, Germany | 231 | |||
| Heidelberg Marriott Hotel | Heidelberg, Germany | 248 | |||
| Sheraton Diana Majestic, Milan | Milan, Italy | 106 | |||
| Renaissance Hamburg Hotel | Hamburg, Germany | 205 | |||
| Renaissance Santo Domingo Jaragua Hotel & Casino | Santo Domingo, Dominican Republic | 300 | |||
| 15 on Orange Hotel, Autograph Collection | Cape Town, South Africa | 129 | |||
| African Pride Melrose Arch, Autograph Collection | Johannesburg, South Africa | 118 | |||
| Courtyard by Marriott Paris Gare de Lyon | Paris, France | 249 | |||
| Protea Hotel by Marriott Cape Town Sea Point | Cape Town, South Africa | 124 | |||
| Protea Hotel by Marriott Midrand | Midrand, South Africa | 177 | |||
| Protea Hotel by Marriott Pretoria Centurion | Pretoria, South Africa | 177 | |||
| Protea Hotel by Marriott O R Tambo Airport | Johannesburg, South Africa | 213 | |||
| Protea Hotel by Marriott Roodepoort | Roodepoort, South Africa | 79 | |||
| Protea Hotel Fire & Ice! by Marriott Cape Town | Cape Town, South Africa | 201 | |||
| Protea Hotel Fire & Ice! by Marriott Johannesburg Melrose Arch | Johannesburg, South Africa | 197 |
Item 3. Legal Proceedings.
See the information under the “Litigation, Claims, and Government Investigations” caption in Note 7, which we incorporate here by reference.
From time to time, we are also subject to other legal proceedings and claims in the ordinary course of business, including adjustments proposed during governmental examinations of the various tax returns we file. While management presently believes that the ultimate outcome of these other proceedings, individually and in aggregate, will not materially harm our financial position, cash flows, or overall trends in results of operations, legal proceedings are inherently uncertain, and unfavorable rulings could, individually or in aggregate, have a material adverse effect on our business, financial condition, or operating results.
Item 4. Mine Safety Disclosures.
Not applicable.
Information about our Executive Officers
See the information under “Information about our Executive Officers” in Part III, Item 10 of this report for information about our executive officers, which we incorporate here by reference.
PART II
Item 5. Market for Registrant’s Common Equity, Related Stockholder Matters, and Issuer Purchases of Equity Securities.
Market Information
At February 20, 2020, 324,214,545 shares of our Class A Common Stock (our “common stock”) were outstanding and were held by 34,999 shareholders of record. Our common stock trades on the Nasdaq Global Select Market (“Nasdaq”) and the Chicago Stock Exchange under the trading symbol MAR.
Fourth Quarter 2019 Issuer Purchases of Equity Securities
| (in millions, except per share amounts) | ||||||||||||
| Period | Total Number of Shares Purchased | Average Price per Share | Total Number of Shares Purchased as Part of Publicly Announced Plans or Programs (1) | Maximum Number of Shares That May Yet Be Purchased Under the Plans or Programs (1) | ||||||||
| October 1, 2019-October 31, 2019 | — | $ | — | — | 21.5 | |||||||
| November 1, 2019-November 30, 2019 | 1.6 | $ | 134.96 | 1.6 | 19.9 | |||||||
| December 1, 2019-December 31, 2019 | 1.5 | $ | 145.13 | 1.5 | 18.4 |
| (1) | On February 15, 2019, we announced that our Board of Directors increased our common stock repurchase authorization by 25 million shares. At year-end 2019, 18.4 million shares remained available for repurchase under Board approved authorizations. We repurchase shares in the open market and in privately negotiated transactions. |
Item 6. Selected Financial Data.
The following table presents a summary of our selected historical financial data derived from our last 10 years of Financial Statements. Because this information is only a summary and does not provide all of the information contained in our Financial Statements, including the related notes, you should read “Management’s Discussion and Analysis of Financial Condition and Results of Operations” and our Financial Statements for each year for more detailed information including, among other items, our adoption of ASU 2014-09 “Revenue from Contracts with Customers” in 2018, our acquisition of Starwood in 2016, restructuring charges we incurred in 2016, timeshare strategy-impairment charges we incurred in 2011, and our 2011 spin-off of our former timeshare operations and timeshare development business. For 2016, we include Legacy-Starwood results from the Merger Date to year-end 2016.
| Fiscal Year (1) | |||||||||||||||||||||||||||||||||||||||
| ($ in millions, except per share data) | 2019 | 2018 | 2017 | 2016 | 2015 | 2014 | 2013 | 2012 | 2011 | 2010 | |||||||||||||||||||||||||||||
| Income Statement Data: | |||||||||||||||||||||||||||||||||||||||
| Revenues (6) | $ | 20,972 | $ | 20,758 | $ | 20,452 | $ | 15,407 | $ | 14,486 | $ | 13,796 | $ | 12,784 | $ | 11,814 | $ | 12,317 | $ | 11,691 | |||||||||||||||||||
| Operating income (loss) (6) | $ | 1,800 | $ | 2,366 | $ | 2,504 | $ | 1,424 | $ | 1,350 | $ | 1,159 | $ | 988 | $ | 940 | $ | 526 | $ | 695 | |||||||||||||||||||
| Net income (loss) (6) | $ | 1,273 | $ | 1,907 | $ | 1,459 | $ | 808 | $ | 859 | $ | 753 | $ | 626 | $ | 571 | $ | 198 | $ | 458 | |||||||||||||||||||
| Per Share Data: | |||||||||||||||||||||||||||||||||||||||
| Diluted earnings (losses) per share (6) | $ | 3.80 | $ | 5.38 | $ | 3.84 | $ | 2.73 | $ | 3.15 | $ | 2.54 | $ | 2.00 | $ | 1.72 | $ | 0.55 | $ | 1.21 | |||||||||||||||||||
| Cash dividends declared per share | $ | 1.8500 | $ | 1.5600 | $ | 1.2900 | $ | 1.1500 | $ | 0.9500 | $ | 0.7700 | $ | 0.6400 | $ | 0.4900 | $ | 0.3875 | $ | 0.2075 | |||||||||||||||||||
| Balance Sheet Data (at year-end): | |||||||||||||||||||||||||||||||||||||||
| Total assets (4) (6) (7) | $ | 25,051 | $ | 23,696 | $ | 23,846 | $ | 24,078 | $ | 6,082 | $ | 6,833 | $ | 6,794 | $ | 6,342 | $ | 5,910 | $ | 8,983 | |||||||||||||||||||
| Long-term debt (4) | 9,963 | 8,514 | 7,840 | 8,197 | 3,807 | 3,447 | 3,147 | 2,528 | 1,816 | 2,691 | |||||||||||||||||||||||||||||
| Shareholders’ equity (deficit) (6) | 703 | 2,225 | 3,582 | 6,265 | (3,590 | ) | (2,200 | ) | (1,415 | ) | (1,285 | ) | (781 | ) | 1,585 | ||||||||||||||||||||||||
| Other Data: | |||||||||||||||||||||||||||||||||||||||
| Base management fees | $ | 1,180 | $ | 1,140 | $ | 1,102 | $ | 806 | $ | 698 | $ | 672 | $ | 621 | $ | 581 | $ | 602 | $ | 562 | |||||||||||||||||||
| Franchise fees (5) (6) | 2,006 | 1,849 | 1,586 | 1,157 | 984 | 872 | 697 | 607 | 506 | 441 | |||||||||||||||||||||||||||||
| Incentive management fees | 637 | 649 | 607 | 425 | 319 | 302 | 256 | 232 | 195 | 182 | |||||||||||||||||||||||||||||
| Total fees (5) (6) | $ | 3,823 | $ | 3,638 | $ | 3,295 | $ | 2,388 | $ | 2,001 | $ | 1,846 | $ | 1,574 | $ | 1,420 | $ | 1,303 | $ | 1,185 | |||||||||||||||||||
| Fee Revenue-Source: | |||||||||||||||||||||||||||||||||||||||
| North America (2) (5) (6) | $ | 2,791 | $ | 2,641 | $ | 2,388 | $ | 1,845 | $ | 1,586 | $ | 1,439 | $ | 1,200 | $ | 1,074 | $ | 970 | $ | 878 | |||||||||||||||||||
| Total Outside North America (3) (5) (6) | 1,032 | 997 | 907 | 543 | 415 | 407 | 374 | 346 | 333 | 307 | |||||||||||||||||||||||||||||
| Total fees (5) (6) | $ | 3,823 | $ | 3,638 | $ | 3,295 | $ | 2,388 | $ | 2,001 | $ | 1,846 | $ | 1,574 | $ | 1,420 | $ | 1,303 | $ | 1,185 |
| (1) | In 2013, we changed to a calendar year-end reporting cycle. All fiscal years presented before 2013 included 52 weeks. |
| (2) | Represents fee revenue from the U.S. (but not Hawaii before 2011) and Canada. |
| (3) | Represents fee revenue outside of North America, as defined in footnote (2) above. |
| (4) | In 2015, we adopted ASU No. 2015-03, which changes the presentation of debt issuance costs, and ASU No. 2015-17, which changes the classification of deferred taxes. Years before 2014 have not been adjusted for these new accounting standards. |
| (5) | In 2017, we reclassified branding fees for third-party residential sales and credit card licensing to the “Franchise fees” caption from the “Owned, leased, and other revenue” caption on our Income Statements. We reclassified prior period amounts through 2013 to conform to our current presentation. We did not reclassify amounts for years before 2013. |
| (6) | In 2018, we adopted ASU 2014-09, which impacted our recognition of revenues and certain expenses. Years before 2016 have not been adjusted for this new accounting standard. |
| (7) | In 2019, we adopted ASU No. 2016-02, which brought substantially all leases onto the balance sheet. Years before 2019 have not been adjusted for this new accounting standard. |
Item 7. Management’s Discussion and Analysis of Financial Condition and Results of Operations.
BUSINESS AND OVERVIEW
Overview
We are a worldwide operator, franchisor, and licensor of hotel, residential, and timeshare properties in 134 countries and territories under 30 brand names. Under our asset-light business model, we typically manage or franchise hotels, rather than own them. We discuss our operations in the following reportable business segments: North American Full-Service, North American Limited-Service, and Asia Pacific. Our Europe, Middle East and Africa, and Caribbean and Latin America operating segments do not individually meet the criteria for separate disclosure as reportable segments**.** In January 2020, we modified our reportable segment structure as a result of a change in the way management intends to evaluate results and allocate resources within the Company. Beginning with the first quarter of 2020, we will present the following reportable business segments: North America; Asia Pacific; and Europe, Middle East, and Africa. Our Caribbean and Latin America operating segment will be included in a combined Caribbean and Latin America and “Unallocated corporate” caption.
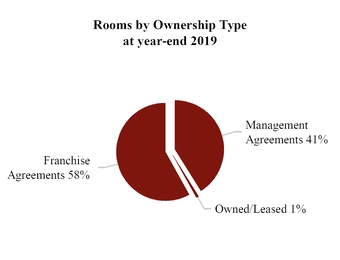
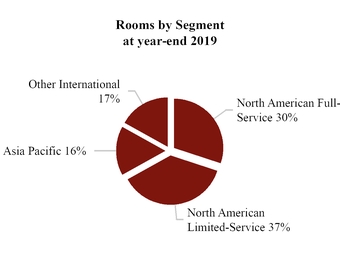
We earn base management fees and in many cases incentive management fees from the properties that we manage, and we earn franchise fees on the properties that others operate under franchise agreements with us. In most markets, base management and franchise fees typically consist of a percentage of property-level revenue, or certain property-level revenue in the case of franchise fees, while incentive management fees typically consist of a percentage of net house profit after a specified owner return. In our Middle East and Africa and Asia Pacific regions, incentive management fees typically consist of a percentage of gross operating profit without adjustment for a specified owner return. Net house profit is calculated as gross operating profit (also referred to as “house profit,” which we discuss under the “Performance Measures” section below) less non-controllable expenses such as property insurance, real estate taxes, and capital spending reserves.
Our emphasis on long-term management contracts and franchising tends to provide more stable earnings in periods of economic softness, while adding new hotels to our system generates growth, typically with little or no investment by the Company. This strategy has driven substantial growth while minimizing financial leverage and risk in a cyclical industry. In addition, we believe minimizing our capital investments and adopting a strategy of recycling our investments maximizes and maintains our financial flexibility.
We remain focused on doing the things that we do well; that is, selling rooms, taking care of our guests, and making sure we control costs both at company-operated properties and at the corporate level (“above-property”). We provide our guests new and memorable experiences through our portfolio of brands, innovative technology, personalized guest recognition, and access to travel experiences through our Marriott Bonvoy Tours & Activities program. Our brands remain strong due to our skilled management teams, dedicated associates, superior guest service with an emphasis on guest and associate satisfaction, significant distribution, Loyalty Program, multichannel reservation systems, and desirable property amenities. We strive to effectively leverage our size and broad distribution. We believe that our Loyalty Program generates substantial repeat business that might otherwise go to competing hotels, and we strategically market to the program’s large and growing member base to generate revenue.
We, along with owners and franchisees, continue to invest in our brands by means of new, refreshed, and reinvented properties, new room and public space designs, and enhanced amenities, technology offerings, and guest experiences. We address, through various means, hotels in our system that do not meet our standards. We continue to enhance the appeal of our proprietary, information-rich, and easy-to-use websites, and of our associated mobile applications, through functionality and service improvements.
Our profitability, as well as that of owners and franchisees, has benefited from our approach to property-level and above-property productivity. Managed properties in our system continue to maintain tight cost controls. We also control above-property costs, some of which we allocate to hotels, by remaining focused on systems, processing, and support areas.
Data Security Incident
On November 30, 2018, we announced a data security incident involving unauthorized access to the Starwood reservations database. The Starwood reservations database is no longer used for business operations.
To date, we have not seen a meaningful impact on demand as a result of the Data Security Incident.
In July 2019, the ICO issued a formal notice of intent under the U.K. Data Protection Act 2018 proposing a fine in the amount of £99 million against the Company in relation to the Data Security Incident (the “Proposed ICO Fine”). We mutually agreed with the ICO to an extension of the regulatory process until June 1, 2020 and the ICO proceeding is ongoing. In the 2019 second quarter, we recorded an accrual in the full amount of the Proposed ICO Fine for this loss contingency, and in the 2019 fourth quarter, we reduced the accrual to $65 million based on the ongoing proceeding. See Note 7 for additional information.
We are currently unable to estimate the range of total possible financial impact to the Company from the Data Security Incident in excess of the expenses already incurred. However, we do not believe this incident will impact our long-term financial health. Although our insurance program includes coverage designed to limit our exposure to losses such as those related to the Data Security Incident, that insurance may not be sufficient or available to cover all of our expenses or other losses (including fines and penalties) related to the Data Security Incident. As we expected, the cost of such insurance increased for our current policy period, and the cost of such insurance could continue to increase in future years. We expect to incur significant expenses associated with the Data Security Incident in future periods, primarily related to legal proceedings and regulatory investigations (including possible fines and penalties), increased expenses and capital investments for information technology and information security and data privacy, and increased expenses for compliance activities and to meet increased legal and regulatory requirements. See Note 7 for information related to expenses incurred in 2018 and 2019, insurance recoveries, and legal proceedings and governmental investigations related to the Data Security Incident.
Performance Measures
We believe RevPAR, which we calculate by dividing room sales for comparable properties by room nights available for the period, is a meaningful indicator of our performance because it measures the period-over-period change in room revenues for comparable properties. RevPAR may not be comparable to similarly titled measures, such as revenues, and should not be viewed as necessarily correlating with our fee revenue. We also believe occupancy and average daily rate (“ADR”), which are components of calculating RevPAR, are meaningful indicators of our performance. Occupancy, which we calculate by dividing occupied rooms by total rooms available, measures the utilization of a property’s available capacity. ADR, which we calculate by dividing property room revenue by total rooms sold, measures average room price and is useful in assessing pricing levels. Comparisons to the prior year period are on a constant
Showing the first 8K of 66K characters. Open the full section
Item 7A. Quantitative and Qualitative Disclosures About Market Risk.
We are exposed to market risk from changes in interest rates, stock prices, currency exchange rates, and debt prices. We manage our exposure to these risks by monitoring available financing alternatives, through development and application of credit granting policies and by entering into derivative arrangements. We do not foresee any significant changes in either our exposure to fluctuations in interest rates or currency rates or how we manage such exposure in the future.
We are exposed to interest rate risk on our floating-rate notes receivable and floating-rate debt. Changes in interest rates also impact the fair value of our fixed-rate notes receivable and the fair value of our fixed-rate long-term debt.
We are also subject to risk from changes in debt prices from our investments in debt securities and fluctuations in stock price from our investment in a publicly traded company. Changes in the price of the underlying stock can impact the fair value of our investment.
We use derivative instruments, including cash flow hedges, net investment in non-U.S. operations hedges, and other derivative instruments, as part of our overall strategy to manage our exposure to market risks associated with fluctuations in interest rates and currency exchange rates. As a matter of policy, we only enter into transactions that we believe will be highly effective at offsetting the underlying risk, and we do not use derivatives for trading or speculative purposes. See Note 2 for more information on derivative instruments.
The following table sets forth the scheduled maturities and the total fair value as of year-end 2019 for our financial instruments that are impacted by market risks:
| Maturities by Period | |||||||||||||||||||||||||||||||
| ($ in millions) | 2020 | 2021 | 2022 | 2023 | 2024 | There- after | Total Carrying Amount | Total Fair Value | |||||||||||||||||||||||
| Assets - Maturities represent expected principal receipts, fair values represent assets. | |||||||||||||||||||||||||||||||
| Fixed-rate notes receivable | $ | 5 | $ | 3 | $ | 3 | $ | 1 | $ | 1 | $ | 31 | $ | 44 | $ | 44 | |||||||||||||||
| Average interest rate | 1.27 | % | |||||||||||||||||||||||||||||
| Floating-rate notes receivable | $ | 4 | $ | 29 | $ | 25 | $ | 1 | $ | 7 | $ | 16 | $ | 82 | $ | 77 | |||||||||||||||
| Average interest rate | 4.36 | % | |||||||||||||||||||||||||||||
| Liabilities - Maturities represent expected principal payments, fair values represent liabilities. | |||||||||||||||||||||||||||||||
| Fixed-rate debt | $ | (422 | ) | $ | (859 | ) | $ | (1,107 | ) | $ | (686 | ) | $ | (14 | ) | $ | (2,543 | ) | $ | (5,631 | ) | $ | (5,880 | ) | |||||||
| Average interest rate | 3.44 | % | |||||||||||||||||||||||||||||
| Floating-rate debt | $ | (549 | ) | $ | (299 | ) | $ | (543 | ) | $ | — | $ | (3,761 | ) | $ | — | $ | (5,152 | ) | $ | (5,179 | ) | |||||||||
| Average interest rate | 2.30 | % |
Item 8. Financial Statements and Supplementary Data.
The following financial information is included on the pages indicated:
MANAGEMENT’S REPORT ON
INTERNAL CONTROL OVER FINANCIAL REPORTING
Management of Marriott International, Inc. (the “Company”) is responsible for establishing and maintaining adequate internal control over financial reporting and for assessing the effectiveness of internal control over financial reporting. The Company has designed its internal control over financial reporting to provide reasonable assurance on the reliability of financial reporting and the preparation of the consolidated financial statements in accordance with U.S. generally accepted accounting principles.
The Company’s internal control over financial reporting includes those policies and procedures that: (1) pertain to the maintenance of records that, in reasonable detail, accurately and fairly reflect the Company’s transactions and dispositions of the Company’s assets; (2) provide reasonable assurance that transactions are recorded as necessary to permit preparation of the consolidated financial statements in accordance with U.S. generally accepted accounting principles, and that receipts and expenditures of the Company are being made only in accordance with authorizations of the Company’s management and directors; and (3) provide reasonable assurance regarding prevention or timely detection of unauthorized acquisition, use, or disposition of the Company’s assets that could have a material effect on the consolidated financial statements.
Because of inherent limitations in internal control over financial reporting, such controls may not prevent or detect misstatements. Also, projections of any evaluation of the effectiveness of internal controls to future periods are subject to the risk that controls may become inadequate because of changes in conditions, or that the degree of compliance with the policies or procedures may deteriorate.
In connection with the preparation of the Company’s annual consolidated financial statements, management assessed the effectiveness of the Company’s internal control over financial reporting as of December 31, 2019, based on criteria established in the Internal Control-Integrated Framework issued by the Committee of Sponsoring Organizations of the Treadway Commission (2013 Framework) (the “COSO criteria”).
Based on this assessment, and the existence of a material weakness related to the accounting for our Loyalty Program further described in Part II, Item 9A, management has concluded that, applying the COSO criteria, as of December 31, 2019, the Company’s internal control over financial reporting was not effective to provide reasonable assurance of the reliability of financial reporting and the preparation of financial statements for external purposes in accordance with U.S. generally accepted accounting principles. We have made progress towards remediation and continue to implement our remediation plan. See the “Remediation of Material Weakness” caption in Part II, Item 9A for further information.
Ernst & Young LLP, the independent registered public accounting firm that audited the Company’s consolidated financial statements included in this report, has issued an attestation report on the effectiveness of the Company’s internal control over financial reporting, a copy of which appears on the following page.
REPORT OF INDEPENDENT REGISTERED PUBLIC ACCOUNTING FIRM
To the Shareholders and Board of Directors of Marriott International, Inc.
Opinion on Internal Control over Financial Reporting
We have audited Marriott International, Inc.’s internal control over financial reporting as of December 31, 2019, based on criteria established in Internal Control-Integrated Framework issued by the Committee of Sponsoring Organizations of the Treadway Commission (2013 Framework) (the COSO criteria). In our opinion, because of the effect of the material weakness described below on the achievement of the objectives of the control criteria, Marriott International, Inc. (the Company) has not maintained effective internal control over financial reporting as of December 31, 2019, based on the COSO criteria.
A material weakness is a deficiency, or combination of deficiencies, in internal control over financial reporting, such that there is a reasonable possibility that a material misstatement of the Company’s annual or interim financial statements will not be prevented or detected on a timely basis. The following material weakness has been identified and included in management’s assessment. Management has identified a material weakness in controls whereby the Company did not have a sufficient complement of resources, including IT and accounting processes and personnel, to perform the ongoing accounting associated with the guest loyalty program.
We also have audited, in acc
Showing the first 8K of 152K characters. Open the full section
Item 9. Changes in and Disagreements with Accountants on Accounting and Financial Disclosure.
None.
Item 9A. Controls and Procedures.
Disclosure Controls and Procedures
As of the end of the period covered by this annual report, we evaluated, under the supervision and with the participation of our management, including our Chief Executive Officer and Chief Financial Officer, the effectiveness of our disclosure controls and procedures (as such term is defined in Rules 13a-15(e) and 15d-15(e) of the Securities Exchange Act of 1934 (the “Exchange Act”)). Management necessarily applied its judgment in assessing the costs and benefits of those controls and procedures, which by their nature, can provide only reasonable assurance about management’s control objectives. You should note that the design of any system of controls is based in part upon certain assumptions about the likelihood of future events, and we cannot assure you that any design will succeed in achieving its stated goals under all potential future conditions, regardless of how remote. Based upon this evaluation, our Chief Executive Officer and the Chief Financial Officer concluded that our disclosure controls and procedures were not effective because of the material weakness in internal control over financial reporting described below. In light of the material weakness, management performed additional procedures to validate the accuracy and completeness of the financial results impacted by the control deficiencies. Such procedures included the validation of data underlying key financial models, substantive logic inspection, fluctuation analyses, and detailed testing.
Material Weakness in Internal Control Over Financial Reporting
A material weakness (as defined in Rule 12b-2 under the Exchange Act) is a deficiency, or combination of deficiencies, in internal control over financial reporting, such that there is a reasonable possibility that a material misstatement of the company’s annual or interim financial statements will not be prevented or detected on a timely basis.
As we reported in our Annual Report on Form 10-K for the fiscal year ended December 31, 2018, in the 2018 fourth quarter, we identified the following deficiencies in the design of internal control over financial reporting for our Loyalty Program.
| 1. | There were not sufficient resources with an understanding of both the requirements under generally accepted accounting principles of ASU 2014-09 and Loyalty Program operations involved in the initial implementation and ongoing monitoring of ASU 2014-09 to allow the individuals responsible for the review of the Loyalty Program accounting model to prevent or detect material misstatements on a timely basis in the normal course of their review. |
| 2. | The combination of the Starwood Preferred Guest and Marriott Rewards programs in August 2018 resulted in delayed, incomplete, and inaccurate reporting of Loyalty Program data such that the financial results of the Loyalty Program could not be properly recorded on a timely basis. |
These control deficiencies resulted in errors in the calculation of cost reimbursement revenue and reimbursed expenses in our previously issued financial statements for the 2018 first, second, and third quarters. Although the errors were not material to those financial statements, we concluded that the combination of control deficiencies represented a material weakness. Ernst & Young LLP, an independent registered public accounting firm, has independently assessed our internal control over financial reporting and its report is included in Part II, Item 8 of this report.
Remediation of Material Weakness
We are committed to maintaining a strong internal control environment and implementing measures designed to help ensure that control deficiencies contributing to the material weakness are remediated as soon as possible. We have made progress towards remediation and continue to implement our remediation plan for the material weakness in internal control over financial reporting described above, which includes steps to increase dedicated personnel, improve reporting processes, design and implement new controls, and enhance related supporting technology. We will consider the material weakness remediated after the applicable controls operate for a sufficient period of time, and management has concluded, through testing, that the controls are operating effectively.
Internal Control Over Financial Reporting
We have set forth management’s report on internal control over financial reporting and the attestation report of our independent registered public accounting firm on our internal control over financial reporting in Part II, Item 8 of this Form 10-K, and we incorporate those reports here by reference.
As outlined above, we are in the process of taking steps to remediate the material weakness. We made no other changes in internal control over financial reporting during the fourth quarter of 2019 that materially affected, or are reasonably likely to materially affect, our internal control over financial reporting.
Item 9B. Other Information.
None.
PART III
Items 10, 11, 12, 13, 14.
As described below, we incorporate by reference in this Annual Report on Form 10-K certain information appearing in the Proxy Statement that we will furnish to our shareholders for our 2020 Annual Meeting of Shareholders.
| Item 10. Directors, Executive Officers, and Corporate Governance. | We incorporate this information by reference to “Our Board of Directors,” “Audit Committee,” “Transactions with Related Persons,” and “Selection of Director Nominees” sections of our Proxy Statement. We have included information regarding our executive officers and our Code of Ethics below. |
| Item 11. Executive Compensation. | We incorporate this information by reference to the “Executive and Director Compensation” and “Compensation Committee Interlocks and Insider Participation” sections of our Proxy Statement. |
| Item 12. Security Ownership of Certain Beneficial Owners and Management and Related Stockholder Matters. | We incorporate this information by reference to the “Securities Authorized for Issuance Under Equity Compensation Plans” and the “Stock Ownership” sections of our Proxy Statement. |
| Item 13. Certain Relationships and Related Transactions, and Director Independence. | We incorporate this information by reference to the “Transactions with Related Persons” and “Director Independence” sections of our Proxy Statement. |
| Item 14. Principal Accountant Fees and Services. | We incorporate this information by reference to the “Independent Registered Public Accounting Firm Fee Disclosure” and the “Pre-Approval of Independent Auditor Fees and Services Policy” sections of our Proxy Statement. |
INFORMATION ABOUT OUR EXECUTIVE OFFICERS
We include below certain information on our executive officers. This information is as of February 1, 2020, except where indicated.
| Name and Title | Age | Business Experience | |||
| J.W. Marriott, Jr. Executive Chairman and Chairman of the Board | 87 | J.W. Marriott, Jr. was elected Executive Chairman effective March 31, 2012, having relinquished his position as Chief Executive Officer. He served as Chief Executive Officer of the Company and its predecessors since 1972. He joined Marriott in 1956, became President and a Director in 1964, Chief Executive Officer in 1972, and Chairman of the Board in 1985. Mr. Marriott serves on the Board of Trustees of The J. Willard & Alice S. Marriott Foundation and the Executive Committee of the World Travel & Tourism Council. Mr. Marriott has served as a Director of the Company and its predecessors since 1964. He holds a Bachelor of Science degree in Banking and Finance from the University of Utah. | |||
| Arne M. Sorenson President and Chief Executive Officer | 61 | Arne M. Sorenson is President and Chief Executive Officer of Marriott. Mr. Sorenson became the third CEO in the Company’s history in 2012. Before that, he served as Marriott’s President and Chief Operating Officer. He has held a number of positions since joining Marriott in 1996, including Executive Vice President, Chief Financial Officer, President of Continental European Lodging, and Senior Vice President of Business Development. He was elected to Marriott’s Board of Directors in 2011. Mr. Sorenson is active on multiple boards. He joined the Microsoft Board of Directors in November 2017. He is also a member of the Business Roundtable, serving on both its Immigration and Infrastructure Committees. He serves on the Board of Trustees for The Brookings Institution, the Board of Directors for the Warrior-Scholar Project, and as a member of the Luther College Board of Regents. Before he joined Marriott, Mr. Sorenson was a Partner with the law firm Latham & Watkins in Washington, D.C. He holds a Bachelor of Arts degree from Luther College in Decorah, Iowa and a J.D. from the University of Minnesota Law School. | |||
| Bao Giang Val Bauduin Controller and Chief Accounting Officer | 43 | Val Bauduin became Marriott’s Controller and Chief Accounting Officer in June 2014, with responsibility for the accounting operations of the Company including oversight of Financial Reporting & Analysis, Accounting Policy, Governance, Risk Management (Insurance, Claims, Business Continuity, Fire & Life Safety), Global Finance Shared Services, and the Corporate Finance Business Partners and in January 2020, he also became Chief Financial Officer - Consumer Operations, Technology & Emerging Business. Before joining Marriott, Mr. Bauduin was a Partner and U.S. Hospitality leader of Deloitte & Touche LLP from 2011 to 2014, where he served as a Travel, Hospitality & Leisure industry expert for Deloitte teams globally. He earned a Bachelor of Arts in Economics from the University of Notre Dame and a Master of Business Administration from The Wharton School at the University of Pennsylvania. He is also a Certified Public Accountant. | |||
| Liam Brown Group President, Europe, Middle East & Africa | 59 | Liam Brown became Group President of Europe, Middle East & Africa, a division that encompasses Continental Europe, the United Kingdom, and Ireland, along with the entire Middle East region and the continent of Africa in January 2020. Mr. Brown joined Marriott in 1989 and served as President for Franchising, Owner Services and Managed by Marriott Select Brands, North America from 2012 to 2018. Most recently, he served as the President and Managing Director of Europe. Other key positions held by Mr. Brown include Chief Operations Officer for the Americas for Select Service & Extended Stay Lodging and Owner & Franchise Services, as well as Senior Vice President and Executive Vice President of Development for Marriott’s Select Service & Extended Stay lodging products. He holds a Hotel Diploma and Business Degree from the Dublin Institute of Technology, Trinity College and earned his Master of Business Administration from the Robert H. Smith School of Management at the University of Maryland. |
| Name and Title | Age | Business Experience | |||
| Anthony G. Capuano Group President - Global Development, Design and Operations Services | 54 | Anthony G. Capuano became Group President - Global Development, Design and Operations Services in January 2020. He continues to be responsible for leading the Company’s global development and design efforts. Mr. Capuano began his Marriott career in 1995 as part of the Market Planning and Feasibility team. Between 1997 and 2005, he led Marriott’s full-service development efforts in the Western U.S. and Canada. In early 2008, his responsibilities expanded to include all of North America and the Caribbean and Latin America and he became Executive Vice President and Global Chief Development Officer in 2009. Mr. Capuano began his professional career in Laventhol and Horwath’s Boston-based Leisure Time Advisory Group. He then joined Kenneth Leventhal and Company’s hospitality consulting group in Los Angeles, CA. Mr. Capuano earned his bachelor’s degree in Hotel Administration from Cornell University. He is an active member of the Cornell Hotel Society and a member of The Cornell School of Hotel Administration Dean’s Advisory Board. Mr. Capuano is also a member of the American Hotel and Lodging Association’s Industry Real Estate Financial Advisory Council. | |||
| David Grissen Group President | 62 | David Grissen became Group President effective February 2014, assuming additional responsibility for The Ritz-Carlton and EDITION Brands. He became the Group President for the Americas in 2012, with responsibility for all business activities including Operations, Sales and Marketing, Revenue Management, Human Resources, Engineering, Rooms Operations, Food and Beverage, Retail, Spa, Information Technology and Development. Before this, he served as President, Americas from 2010; Executive Vice President of the Eastern Region from 2005; Senior Vice President of the Mid-Atlantic Region and Senior Vice President of Finance and Business Development from 2000. Mr. Grissen is chair of the Americas’ Hotel Development Committee and a member of the Lodging Strategy Group and Corporate Growth Committee. He is a member of the Board of Directors of Regis Corporation. Mr. Grissen holds a Bachelor of Arts degree from Michigan State University and earned his Master of Business Administration from Loyola University in Chicago. | |||
| Stephanie Linnartz Group President - Consumer Operations, Technology & Emerging Businesses | 51 | Stephanie Linnartz became Group President - Consumer Operations, Technology & Emerging Businesses in January 2020. She is responsible for the Company’s brand management, sales, marketing, revenue management, distribution, customer experience and innovation, information technology and digital functions, including Marriott Bonvoy. Ms. Linnartz also is responsible for developing, incubating, and running new lines of business that focus on consumer interaction with Marriott Bonvoy. Before assuming her current position, Ms. Linnartz served as Global Chief Commercial Officer from 2013 to 2019; Global Officer, Sales and Revenue Management from 2009 to 2013; Senior Vice President, Global Sales from 2008 to 2009; and, Senior Vice President, Sales and Marketing Planning and Support from 2005 to 2008. She holds a bachelor’s degree in Political Science and Government from the College of the Holy Cross and earned her Master of Business Administration from the College of William and Mary. | |||
| Name and Title | Age | Business Experience | |||
| Kathleen K. Oberg Executive Vice President and Chief Financial Officer | 59 | Kathleen (“Leeny”) K. Oberg was appointed as Marriott’s Chief Financial Officer, effective January 1, 2016. Previously, Ms. Oberg was the Chief Financial Officer for The Ritz-Carlton since 2013, where she contributed significantly to the brand’s performance, growth, and organizational effectiveness. Prior to assuming that role, Ms. Oberg served in a range of financial leadership positions with Marriott. From 2008 to 2013, she was the Company’s Senior Vice President, Corporate and Development Finance, where she led a team that valued new hotel development projects and merger and acquisition opportunities, prepared the Company’s long-range plans and annual budgets, and made recommendations for the Company’s financial and capital allocation strategy. From 2006 to 2008, Ms. Oberg served in London as Senior Vice President, International Project Finance and Asset Management for Europe and the Middle East and Africa, and as the region’s senior finance executive. Ms. Oberg first joined Marriott as part of its Investor Relations group in 1999. Before joining Marriott, Ms. Oberg held a variety of financial leadership positions with such organizations as Sodexo (previously Sodexo Marriott Services), Sallie Mae, Goldman Sachs, and Chase Manhattan Bank. She currently serves on the Adobe Board of Directors. She earned her Bachelor of Science in Commerce, with concentrations in Finance and Management Information Systems from the University of Virginia, McIntire School of Commerce and received her Master of Business Administration from Stanford University Graduate School of Business. | |||
| Rena Hozore Reiss Executive Vice President and General Counsel | 60 | Rena Hozore Reiss became Executive Vice President and General Counsel in December 2017. Ms. Reiss previously held the position of Executive Vice President, General Counsel and Corporate Secretary at Hyatt Hotels where she led the global legal team and oversaw Hyatt’s risk management team and corporate transactions group. Prior to her position with Hyatt, Ms. Reiss was an attorney in Marriott’s law department from 2000 to 2010 building her career in roles with increasing responsibility, ultimately holding the position of Senior Vice President and Associate General Counsel in which she led Marriott’s managed development efforts in the Americas region. Before joining Marriott, Ms. Reiss was a partner at Counts & Kanne, Chartered, in Washington, D.C. and Associate General Counsel at the Miami Herald Publishing Company. She earned her A.B. from Princeton University and her J.D. from Harvard Law School. | |||
| David A. Rodriguez Executive Vice President and Global Chief Human Resources Officer | 61 | David A. Rodriguez was appointed Executive Vice President and Global Chief Human Resources Officer in 2006. Before joining Marriott in 1998, he held senior roles in human resources at Citicorp (now Citigroup) from 1989 through 1998. Dr. Rodriguez holds a Bachelor of Arts degree and a doctorate degree in Industrial and Organizational Psychology from New York University. He is an elected fellow of the National Academy of Human Resources, chairman of the American Health Policy Institute, vice chair of the Human Resources Policy Association, and a governor on the board of the Health Transformation Alliance. | |||
| Craig S. Smith Group President & Managing Director Asia Pacific | 57 | Craig S. Smith became Group President and Managing Director of Asia Pacific in October 2019 and previously served as President and Managing Director of Asia Pacific since June 2015, assuming the responsibility for the strategic leadership of all operational and development functions spanning the region. Mr. Smith began his career with Marriott in 1988. Before his current position, Mr. Smith served as President of Marriott’s Caribbean and Latin America region from 2011 to 2015. Before moving to the Caribbean and Latin America region in 2011, he was Executive Vice President and Chief Operations Officer for Asia Pacific. As the son of an American diplomat, Mr. Smith has lived in 13 countries, working in North America, the Caribbean, Latin America, Asia Pacific, and Australia. He is fluent in Spanish and conversant in Portuguese. Mr. Smith earned his Master of Business Administration from the Rotman School of Management at the University of Toronto and a Bachelor of Science from Brigham Young University. |
Code of Ethics and Business Conduct Guide
The Company has long maintained and enforced a Code of Ethics that applies to all Marriott associates, including our Chairman of the Board, Chief Executive Officer, Chief Financial Officer, and Principal Accounting Officer, and to each member of the Board. The Code of Ethics is encompassed in our Business Conduct Guide, which is available in the Investor Relations section of our website (www.Marriott.com/investor) by clicking on “Governance” and then “Documents & Charters.” We intend to post on that website any future changes or amendments to our Code of Ethics, and any waiver of our Code of Ethics that applies to our Chairman of the Board, any of our executive officers, or a member of our Board within four business days following the date of the amendment or waiver.
PART IV
Item 15. Exhibits and Financial Statement Schedules.
LIST OF DOCUMENTS FILED AS PART OF THIS REPORT
(1) FINANCIAL STATEMENTS
We include this portion of Item 15 under Part II, Item 8 of this Annual Report on Form 10-K.
(2) FINANCIAL STATEMENT SCHEDULES
We include the financial statement schedule information required by the applicable accounting regulations of the SEC in the notes to our financial statements and incorporate that information in this Item 15 by reference.
(3) EXHIBITS
Any shareholder who wants a copy of the following Exhibits may obtain one from us upon request at a charge that reflects the reproduction cost of such Exhibits. Requests should be made to the Secretary, Marriott International, Inc., 10400 Fernwood Road, Department 52/862, Bethesda, MD 20817.
We have not filed as exhibits certain instruments defining the rights of holders of the long-term debt of Marriott or its subsidiary Starwood Hotels & Resorts Worldwide, LLC, pursuant to Item 601(b)(4)(iii) of Regulation S-K promulgated under the Exchange Act, because the amount of debt authorized and outstanding under each such instrument does not exceed 10 percent of the total assets of the Company’s and its consolidated subsidiaries. The Company agrees to furnish a copy of any such instrument to the Commission upon request.
| Exhibit No. | Description | Incorporation by Reference (where a report is indicated below, that document has been previously filed with the SEC and the applicable exhibit is incorporated by reference thereto) | ||
| 2.1 | Agreement and Plan of Merger, dated as of November 15, 2015, by and among the Company, Starwood, and certain of their subsidiaries. | Exhibit No. 2.1 to our Form 8-K filed November 16, 2015 (File No. 001-13881). | ||
| 2.2 | Amendment No. 1 to Agreement and Plan of Merger, dated March 20, 2016, by and among the Company, Starwood, and certain of their subsidiaries. | Exhibit No. 2.1 to our Form 8-K filed March 21, 2016 (File No. 001-13881). | ||
| 3.1 | Restated Certificate of Incorporation. | Exhibit No. 3(i) to our Form 8-K filed August 22, 2006 (File No. 001-13881). | ||
| 3.2 | Amended and Restated Bylaws. | Exhibit No. 3.(ii) to our Form 8-K filed August 14, 2019 (File No. 001-13881). | ||
| 4.1 | Form of Common Stock Certificate. | Exhibit No. 4.5 to our Form S-3ASR filed December 8, 2005 (File No. 333-130212). | ||
| 4.2 | Indenture dated as of November 16, 1998, between the Company and The Bank of New York Mellon, as successor to JPMorgan Chase Bank, N.A., formerly known as The Chase Manhattan Bank. | Exhibit No. 4.1 to our Form 10-K for the fiscal year- ended January 1, 1999 (File No. 001-13881). | ||
| 4.3 | Description of Registrant’s Securities | Filed with this report. | ||
| Exhibit No. | Description | Incorporation by Reference (where a report is indicated below, that document has been previously filed with the SEC and the applicable exhibit is incorporated by reference thereto) | ||
| 10.1 | U.S. $4,500,000 Fifth Amended and Restated Credit Agreement dated as of June 28, 2019 with Bank of America, N.A. as administrative agent and certain banks. | Exhibit No. 10 to our Form 8-K filed July 1, 2019 (File No. 001-13881). | ||
| 10.2.1 | License, Services and Development Agreement entered into on November 17, 2011, among the Company, Marriott Worldwide Corporation, Marriott Vacations Worldwide Corporation, and the other signatories thereto. | Exhibit No. 10.1 to our Form 8-K filed November 21, 2011 (File No. 001-13881). | ||
| 10.2.2 | First Amendment to License, Services, and Development Agreement for Marriott Projects, dated February 26, 2018, among the Company, Marriott Worldwide Corporation, Marriott Vacations Worldwide Corporation, and the other signatories thereto. | Exhibit No. 10.1 to our Form 8-K filed February 27, 2018 (File No. 001-13881). | ||
| 10.2.3 | Letter of Agreement, effective as of September 1, 2018, among Marriott International, Inc., Marriott Worldwide Corporation, Marriott Rewards, LLC, Starwood Hotels & Resorts Worldwide, LLC, Marriott Vacations Worldwide Corporation, Marriott Ownership Resorts, Inc., Vistana Signature Experiences, Inc. and ILG, LLC. | Exhibit No. 10.2 to our Form 10-Q filed November 6, 2018 (File No. 001-13881). | ||
| 10.3.1 | License, Services and Development Agreement entered into on November 17, 2011, among The Ritz-Carlton Hotel Company, L.L.C., Marriott Vacations Worldwide Corporation, and the other signatories thereto. | Exhibit No. 10.2 to our Form 8-K filed November 21, 2011 (File No. 001-13881). | ||
| 10.3.2 | First Amendment to License, Services, and Development Agreement for Ritz-Carlton Projects, dated February 26, 2018, among The Ritz-Carlton Hotel Company, L.L.C., Marriott Vacations Worldwide Corporation, and the other signatories thereto. | Exhibit No. 10.2 to our Form 8-K filed February 27, 2018 (File No. 001-13881). | ||
| 10.4.1 | Marriott Rewards Affiliation Agreement entered into on November 17, 2011, among the Company, Marriott Rewards, L.L.C., Marriott Vacations Worldwide Corporation and certain of its subsidiaries, Marriott Ownership Resorts, Inc., and the other signatories thereto. | Exhibit No. 10.5 to our Form 8-K filed November 21, 2011 (File No. 001-13881). | ||
| 10.4.2 | First Amendment to the Marriott Rewards Affiliation Agreement, dated February 26, 2018, among the Company, Marriott Rewards, LLC, Marriott Vacations Worldwide Corporation, and Marriott Ownership Resorts, Inc. | Exhibit No. 10.3 to our Form 8-K filed February 27, 2018 (File No. 001-13881). | ||
| 10.4.3 | Second Amendment to Marriott Rewards Affiliation Agreement, dated November 25, 2019, among the Company, Marriott Rewards, LLC, Marriott Vacations Worldwide Corporation, and Marriott Ownership Resorts, Inc. | Filed with this report. | ||
| *10.5.1 | Marriott International, Inc. Stock and Cash Incentive Plan, as Amended Through February 13, 2014. | Exhibit A to our Definitive Proxy Statement filed April 4, 2014 (File No. 001-13881). | ||
| *10.5.2 | Amendment dated August 7, 2014 to the Marriott International, Inc. Stock and Cash Incentive Plan. | Exhibit No. 10 to our Form 10-Q filed October 29, 2014 (File No. 001-13881). | ||
| *10.5.3 | Amendment dated September 23, 2016 to the Marriott International, Inc. Stock and Cash Incentive Plan. | Exhibit 10.8.2 to our Form 10-K filed February 15, 2018 (File No. 001-13881). | ||
| Exhibit No. | Description | Incorporation by Reference (where a report is indicated below, that document has been previously filed with the SEC and the applicable exhibit is incorporated by reference thereto) | ||
| *10.5.4 | Amendment dated May 5, 2017 to the Marriott International, Inc. Stock and Cash Incentive Plan. | Exhibit 10.8.3 to our Form 10-K filed February 15, 2018 (File No. 001-13881). | ||
| *10.5.5 | Amendment dated February 15, 2019 to the Marriott International, Inc. Stock and Cash Incentive Plan. | Exhibit 10.7.5 to our Form 10-K filed March 1, 2019 (File No. 001-13881). | ||
| *10.5.6 | Amendment dated May 10, 2019 to the Marriott International, Inc. Stock and Cash Incentive Plan. | Exhibit 10.1 to our Form 10-Q filed August 6, 2019 (File No. 001-13881). | ||
| *10.6.1 | Marriott International, Inc. Executive Deferred Compensation Plan, Amended and Restated as of January 1, 2009. | Exhibit No. 99 to our Form 8-K filed August 6, 2009 (File No. 001-13881). | ||
| *10.6.2 | Amendment to the Marriott International, Inc. Executive Deferred Compensation Plan, effective January 1, 2010. | Exhibit 10.9.1 to our Form 10-K filed February 15, 2018 (File No. 001-13881). | ||
| *10.6.3 | Amendment to the Marriott International, Inc. Executive Deferred Compensation Plan, effective April 1, 2010. | Exhibit 10.9.2 to our Form 10-K filed February 15, 2018 (File No. 001-13881). | ||
| *10.6.4 | Amendment to the Marriott International, Inc. Executive Deferred Compensation Plan, effective October 25, 2011. | Exhibit 10.9.3 to our Form 10-K filed February 15, 2018 (File No. 001-13881). | ||
| *10.6.5 | Amendment to the Marriott International, Inc. Executive Deferred Compensation Plan, effective November 19, 2011. | Exhibit 10.9.4 to our Form 10-K filed February 15, 2018 (File No. 001-13881). | ||
| *10.6.6 | Amendment to the Marriott International, Inc. Executive Deferred Compensation Plan, effective January 1, 2013. | Exhibit 10.9.5 to our Form 10-K filed February 15, 2018 (File No. 001-13881). | ||
| *10.6.7 | Amendment to the Marriott International, Inc. Executive Deferred Compensation Plan, effective September 23, 2016 (409A). | Exhibit 10.9.6 to our Form 10-K filed February 15, 2018 (File No. 001-13881). | ||
| *10.6.8 | Amendment to the Marriott International, Inc. Executive Deferred Compensation Plan, effective September 23, 2016 (Starwood deferral elections). | Exhibit 10.9.7 to our Form 10-K filed February 15, 2018 (File No. 001-13881). | ||
| *10.6.9 | Amendment to the Marriott International, Inc. Executive Deferred Compensation Plan, effective January 1, 2019. | Exhibit 10.8.9 to our Form 10-K filed March 1, 2019 (File No. 001-13881). | ||
| *10.7.1 | Form of Employee Non-Qualified Stock Option Agreement for the Marriott International, Inc. Stock and Cash Incentive Plan. | Exhibit 10.10 to our Form 10-K filed February 15, 2018 (File No. 001-13881). | ||
| *10.7.2 | Form of Senior Executive Supplemental Non-Qualified Stock Option Agreement for the Marriott International, Inc. Stock and Cash Incentive Plan. | Exhibit 10.10.1 to our Form 10-K filed February 15, 2018 (File No. 001-13881). | ||
| *10.8.1 | Form of Executive Restricted Stock Unit/MI Shares Agreement for the Marriott International, Inc. Stock and Cash Incentive Plan (pre-February 2018). | Exhibit 10.11 to our Form 10-K filed February 15, 2018 (File No. 001-13881). | ||
| *10.8.2 | Form of Executive Restricted Stock Unit/MI Shares Agreement for the Marriott International, Inc. Stock and Cash Incentive Plan (February 2018). | Exhibit 10.6.1 to our Form 10-Q filed May 10, 2018 (File No. 001-13881). | ||
| *10.8.3 | Form of Retention Executive Restricted Stock Unit Agreement for the Marriott International, Inc. Stock and Cash Incentive Plan (February 2018). | Exhibit 10.6.2 to our Form 10-Q filed May 10, 2018 (File No. 001-13881). | ||
| Exhibit No. | Description | Incorporation by Reference (where a report is indicated below, that document has been previously filed with the SEC and the applicable exhibit is incorporated by reference thereto) | ||
| *10.8.4 | Form of MI Shares Agreement for the Marriott International, Inc. Stock and Cash Incentive Plan (March 2019). | Exhibit 10.1 to our Form 10-Q filed May 10, 2019 (File No. 001-13881). | ||
| *10.8.5 | Form of Retention Executive Restricted Stock Unit Agreement for the Marriott International, Inc. Stock and Cash Incentive Plan (March 2019). | Exhibit 10.2 to our Form 10-Q filed May 10, 2019 (File No. 001-13881). | ||
| *10.9.1 | Form of Stock Appreciation Right Agreement for the Marriott International, Inc. Stock and Cash Incentive Plan (pre-February 2018). | Exhibit 10.12 to our Form 10-K filed February 15, 2018 (File No. 001-13881). | ||
| *10.9.2 | Form of Senior Executive Supplemental Stock Appreciation Right Agreement for the Marriott International, Inc. Stock and Cash Incentive Plan. | Exhibit 10.12.1 to our Form 10-K filed February 15, 2018 (File No. 001-13881). | ||
| *10.9.3 | Form of Stock Appreciation Right Agreement for the Marriott International, Inc. Stock and Cash Incentive Plan (For Non-Employee Directors). | Exhibit 10.12.2 to our Form 10-K filed February 15, 2018 (File No. 001-13881). | ||
| *10.9.4 | Form of Stock Appreciation Right Agreement for the Marriott International, Inc. Stock and Cash Incentive Plan (February 2018). | Exhibit 10.7 to our Form 10-Q filed May 10, 2018 (File No. 001-13881). | ||
| *10.9.5 | Form of Stock Appreciation Rights Agreement for the Marriott International, Inc. Stock and Cash Incentive Plan (March 2019). | Exhibit 10.3 to our Form 10-Q filed May 10, 2019 (File No. 001-13881). | ||
| *10.10.1 | Form of Performance Share Unit Award Agreement for the Marriott International, Inc. Stock and Cash Incentive Plan (February 2018). | Exhibit 10.8 to our Form 10-Q filed May 10, 2018 (File No. 001-13881). | ||
| *10.10.2 | Form of Performance Share Unit Award Agreement for the Marriott International, Inc. Stock and Cash Incentive Plan (March 2019). | Exhibit 10.4 to our Form 10-Q filed May 10, 2019 (File No. 001-13881). | ||
| *10.11 | Summary of Marriott International, Inc. Director Compensation. | Exhibit 10 to our Form 10-Q filed November 5, 2019 (File No. 001-13881). | ||
| *10.12 | Marriott International, Inc. Executive Officer Annual Cash Incentive Program. | Exhibit 10.9 to our Form 10-Q filed May 10, 2018 (File No. 001-13881). | ||
| *10.13.1 | Starwood 1999 Long-Term Incentive Compensation Plan. | Exhibit 10.4 to Starwood’s Form 10-Q for the quarterly period ended June 30, 1999 (File No. 001-07959). | ||
| *10.13.2 | First Amendment to the Starwood 1999 Long-Term Incentive Compensation Plan, dated as of August 1, 2001. | Exhibit 10.1 to Starwood’s Form 10-Q for the quarterly period ended September 30, 2001 (File No. 001-07959). | ||
| *10.13.3 | Second Amendment to the Starwood 1999 Long-Term Incentive Compensation Plan. | Exhibit 10.2 to Starwood’s Form 10-Q for the quarterly period ended March 31, 2003 (File No. 001-07959). | ||
| *10.14.1 | Starwood 2002 Long-Term Incentive Compensation Plan. | Annex B of Starwood’s 2002 Notice of Annual Meeting and Proxy Statement filed April 12, 2002 (File No. 001-07959). | ||
| *10.14.2 | First Amendment to the Starwood 2002 Long-Term Incentive Compensation Plan. | Exhibit 10.1 to Starwood’s Form 10-Q for the quarterly period ended March 31, 2003 (File No. 001-07959). | ||
| *10.15.1 | Starwood 2004 Long-Term Incentive Compensation Plan, amended and restated as of December 31, 2008. | Exhibit 10.3 to Starwood’s Form 8-K filed January 6, 2009 (File No. 001-07959). | ||
| *10.15.2 | First Amendment to the Starwood 2004 Long-Term Incentive Compensation Plan. | Exhibit 10.1 to Starwood’s Form 10-Q for the quarterly period ended June 30, 2013 (File No. 001-07959). | ||
| Exhibit No. | Description | Incorporation by Reference (where a report is indicated below, that document has been previously filed with the SEC and the applicable exhibit is incorporated by reference thereto) | ||
| *10.16.1 | Starwood 2013 Long-Term Incentive Compensation Plan. | Exhibit 4.4 to Starwood’s Form S-8 filed June 28, 2013 (File No. 333-189674). | ||
| *10.16.2 | Amendment dated May 5, 2017 to the Starwood 2013 Long-Term Incentive Compensation Plan. | Exhibit 10.19.1 to our Form 10-K filed February 15, 2018 (File No. 001-13881). | ||
| *10.17 | Amendment dated June 29, 2016 to the Starwood 2013 Long-Term Incentive Compensation Plan, the Starwood 2004 Long-Term Incentive Compensation Plan, the Starwood 2002 Long-Term Incentive Compensation Plan, and the Starwood 1999 Long-Term Incentive Compensation Plan. | Exhibit 10.20 to our Form 10-K filed February 15, 2018 (File No. 001-13881). | ||
| *10.18 | Amendment dated September 23, 2016 to the Starwood 2013 Long-Term Incentive Compensation Plan, the Starwood 2004 Long-Term Incentive Compensation Plan, the Starwood 2002 Long-Term Incentive Compensation Plan, and the Starwood 1999 Long-Term Incentive Compensation Plan. | Exhibit 10.21 to our Form 10-K filed February 15, 2018 (File No. 001-13881). | ||
| *10.19 | Amendment dated November 10, 2016 to the Marriott International, Inc. Stock and Cash Incentive Plan, the Starwood 2013 Long-Term Incentive Compensation Plan, the Starwood 2004 Long-Term Incentive Compensation Plan, the Starwood 2002 Long-Term Incentive Compensation Plan, and the Starwood 1999 Long-Term Incentive Compensation Plan. | Exhibit 10.22 to our Form 10-K filed February 15, 2018 (File No. 001-13881). | ||
| †10.20 | Amended and Restated Side Letter Agreement - Program Affiliation, dated February 26, 2018, among the Company, Marriott Vacations Worldwide, and certain of their subsidiaries. | Exhibit No. 10.5 to our Form 8-K filed February 27, 2018 (File No. 001-13881). | ||
| 10.21 | Aircraft Time Sharing Agreement, effective as of September 20, 2018, between Marriott International Administrative Services, Inc. and J. Willard Marriott Jr. | Exhibit No. 10.3 to our Form 10-Q filed November 6, 2018 (File No. 001-13881). | ||
| 21 | Subsidiaries of Marriott International, Inc. | Filed with this report. | ||
| 23 | Consent of Ernst & Young LLP. | Filed with this report. | ||
| 31.1 | Certification of Chief Executive Officer Pursuant to Rule 13a-14(a). | Filed with this report. | ||
| 31.2 | Certification of Chief Financial Officer Pursuant to Rule 13a-14(a). | Filed with this report. | ||
| 32 | Section 1350 Certifications. | Furnished with this report. | ||
| 101 | The following financial statements from Marriott International, Inc.’s Annual Report on Form 10-K for the year ended December 31, 2019, formatted in Inline XBRL (Extensible Business Reporting Language): (i) the Consolidated Statements of Income for the year ended December 31, 2019, December 31, 2018, and December 31, 2017; (ii) the Consolidated Balance Sheets at December 31, 2019, and December 31, 2018; (iii) the Consolidated Statements of Cash Flows for the year ended December 31, 2019, December 31, 2018, and December 31, 2017; (iv) the Consolidated Statements of Comprehensive Income for the year ended December 31, 2019, December 31, 2018, and December 31, 2017; (v) the Consolidated Statements of Shareholders’ Equity for the year ended December 31, 2019, December 31, 2018, and December 31, 2017; and (vi) Notes to Consolidated Financial Statements. | Submitted electronically with this report. |
| Exhibit No. | Description | Incorporation by Reference (where a report is indicated below, that document has been previously filed with the SEC and the applicable exhibit is incorporated by reference thereto) | ||
| 101.INS | XBRL Instance Document. | Submitted electronically with this report. | ||
| 101.SCH | XBRL Taxonomy Extension Schema Document. | Submitted electronically with this report. | ||
| 101.CAL | XBRL Taxonomy Calculation Linkbase Document. | Submitted electronically with this report. | ||
| 101.DEF | XBRL Taxonomy Extension Definition Linkbase. | Submitted electronically with this report. | ||
| 101.LAB | XBRL Taxonomy Label Linkbase Document. | Submitted electronically with this report. | ||
| 101.PRE | XBRL Taxonomy Presentation Linkbase Document. | Submitted electronically with this report. | ||
| 104 | The cover page from Marriott International, Inc.’s Annual Report on Form 10-K for the year ended December 31, 2019, formatted in Inline XBRL (included as Exhibit 101). | Submitted electronically with this report. |
| * | Denotes management contract or compensatory plan. |
| † | Portions of this exhibit were redacted pursuant to a confidential treatment request filed with the Securities and Exchange Commission pursuant to Rule 24b-2 under the Exchange Act. The redacted portions of this exhibit have been filed with the Securities and Exchange Commission. |
Item 16. Form 10-K Summary.
None.
SIGNATURES
Pursuant to the requirements of Section 13 or 15(d) of the Exchange Act, we have duly caused this Form 10-K to be signed on our behalf by the undersigned, thereunto duly authorized, on this 27th day of February 2020.
MARRIOTT INTERNATIONAL, INC.
| By: | /s/Arne M. Sorenson | |
| Arne M. Sorenson | ||
| President and Chief Executive Officer |
Pursuant to the requirements of the Exchange Act, this Form 10-K has been signed by the following persons on our behalf in the capacities indicated and on the date indicated above.
| PRINCIPAL EXECUTIVE OFFICER: | ||
| /s/Arne M. Sorenson | President, Chief Executive Officer and Director | |
| Arne M. Sorenson | ||
| PRINCIPAL FINANCIAL OFFICER: | ||
| /s/Kathleen K. Oberg | Executive Vice President and Chief Financial Officer | |
| Kathleen K. Oberg | ||
| PRINCIPAL ACCOUNTING OFFICER: | ||
| /s/Bao Giang Val Bauduin | Controller and Chief Accounting Officer | |
| Bao Giang Val Bauduin | ||
| DIRECTORS: | ||
| /s/J.W. Marriott, Jr. | /s/Debra L. Lee | |
| J.W. Marriott, Jr., Executive Chairman and Chairman of the Board | Debra L. Lee, Director | |
| /s/Mary K. Bush | /s/Aylwin B. Lewis | |
| Mary K. Bush, Director | Aylwin B. Lewis, Director | |
| /s/Bruce W. Duncan | /s/Margaret M. McCarthy | |
| Bruce W. Duncan, Director | Margaret M. McCarthy, Director | |
| /s/Deborah Marriott Harrison | /s/George Muñoz | |
| Deborah Marriott Harrison, Director | George Muñoz, Director | |
| /s/Frederick A. Henderson | /s/Steven S Reinemund | |
| Frederick A. Henderson, Director | Steven S Reinemund, Director | |
| /s/Eric Hippeau | /s/Susan C. Schwab | |
| Eric Hippeau, Director | Susan C. Schwab, Director | |
| /s/Lawrence W. Kellner | ||
| Lawrence W. Kellner, Director |