 filings.tools
Item 5. MARKET FOR THE REGISTRANT’S COMMON EQUITY, RELATED SHAREHOLDER MATTERS AND ISSUER PURCHASES OF EQUITY SECURITIES
9K characters. Original on sec.gov · Markdown
Item 5. MARKET FOR THE REGISTRANT’S COMMON EQUITY, RELATED SHAREHOLDER MATTERS AND ISSUER PURCHASES OF EQUITY SECURITIES
Information in response to this Item is set forth under the captions below.
MOODY’S PURCHASES OF EQUITY SECURITIES
For the three months ended December 31, 2019:
| Period | Total Number of Shares Purchased (1) | Average Price Paid per Share | Total Number of Shares Purchased as Part of Publicly Announced Program | Approximate Dollar Value of Shares That May Yet Be Purchased Under The Program (2) | ||||||||||||||||||||||
| October 1- 31 | 269,922 | $ | 211.45 | 267,621 | $540 million | |||||||||||||||||||||
| November 1- 30 | 434,096 | $ | 220.21 | 433,208 | $445 million | |||||||||||||||||||||
| December 1- 31 | 477,686 | $ | 232.83 | 475,447 | $1,334 million | |||||||||||||||||||||
| Total | 1,181,704 | $ | 223.32 | 1,176,276 |
(1)Includes surrender to the Company of 2,301, 888 and 2,239 shares of common stock in October, November and December, respectively, to satisfy tax withholding obligations in connection with the vesting of restricted stock issued to employees.
(2)As of the last day of each of the months. On December 15, 2015, the Board authorized a $1 billion share repurchase program which was fully utilized during 2019. On October 22, 2018, the Board approved an additional $1 billion for the share repurchase program, which at December 31, 2019 had approximately $334 million of remaining authority. On December 16, 2019, the Board approved an additional $1 billion for the share repurchase program, which may commence following the completion of the existing program. There is no established expiration date for the remaining authorization.
During the fourth quarter of 2019, Moody’s issued 0.1 million shares under employee stock-based compensation plans.
COMMON STOCK INFORMATION
The Company’s common stock trades on the New York Stock Exchange under the symbol “MCO”. The number of registered shareholders of record at January 31, 2020 was 1,801. A substantially greater number of the Company’s common stock is held by beneficial holders whose shares of record are held by banks, brokers and other financial institutions.
EQUITY COMPENSATION PLAN INFORMATION
The table below sets forth, as of December 31, 2019, certain information regarding the Company’s equity compensation plans.
| Plan Category | Number of Securities to be Issued Upon Exercise of Outstanding Options, Warrants and Rights | Weighted-Average Exercise Price of Outstanding Options, Warrants and Rights (2) | Number of Securities Remaining Available for Future Issuance Under Equity Compensation Plans (excluding Securities Reflected in Column (a)) | |||||||||||||||||||||||
| (a) | (b) | (c) | ||||||||||||||||||||||||
| Equity compensation plans approved by security holders | 4,277,981 | (1) | $ | 93.51 | 18,297,931 | (3) | ||||||||||||||||||||
| Equity compensation plans not approved by security holders | — | $ | — | — | ||||||||||||||||||||||
| Total | 4,277,981 | $ | 93.51 | 18,297,931 |
(1)Includes 3,394,705 options and unvested restricted shares outstanding under the Company's 2001 Key Employees' Stock Incentive Plan and 9,766 unvested restricted shares outstanding under the 1998 Non-Employee Directors' Stock Incentive Plan. This number also includes a maximum of 873,510 performance shares outstanding under the Company's 2001 Key Employees' Stock Incentive Plan, which is the maximum number of shares issuable pursuant to performance share awards assuming the maximum payout at 225% of the target award for performance shares granted in 2017 and the maximum payout of 200% of the target award for performance shares granted in 2018 and 2019. Assuming payout at target, the number of shares to be issued upon the vesting of outstanding performance share awards is 415,754.
(2)Does not reflect unvested restricted shares or performance share awards included in column (a) because these awards have no exercise price.
(3)Includes 14,724,774 shares available for issuance as under the 2001 Stock Incentive Plan, of which all may be issued as options and 8,552,689 may be issued as restricted stock, performance shares or other stock-based awards under the 2001 Stock Incentive Plan and 893,602 shares available for issuance as options, shares of restricted stock or performance shares under the 1998 Directors Plan, and 2,679,555 shares available for issuance under the Company’s Employee Stock Purchase Plan. No new grants may be made under the 1998 Stock Incentive Plan, which expired by its terms in June 2008.
MOODY'S 2019 10-K 27
PERFORMANCE GRAPH
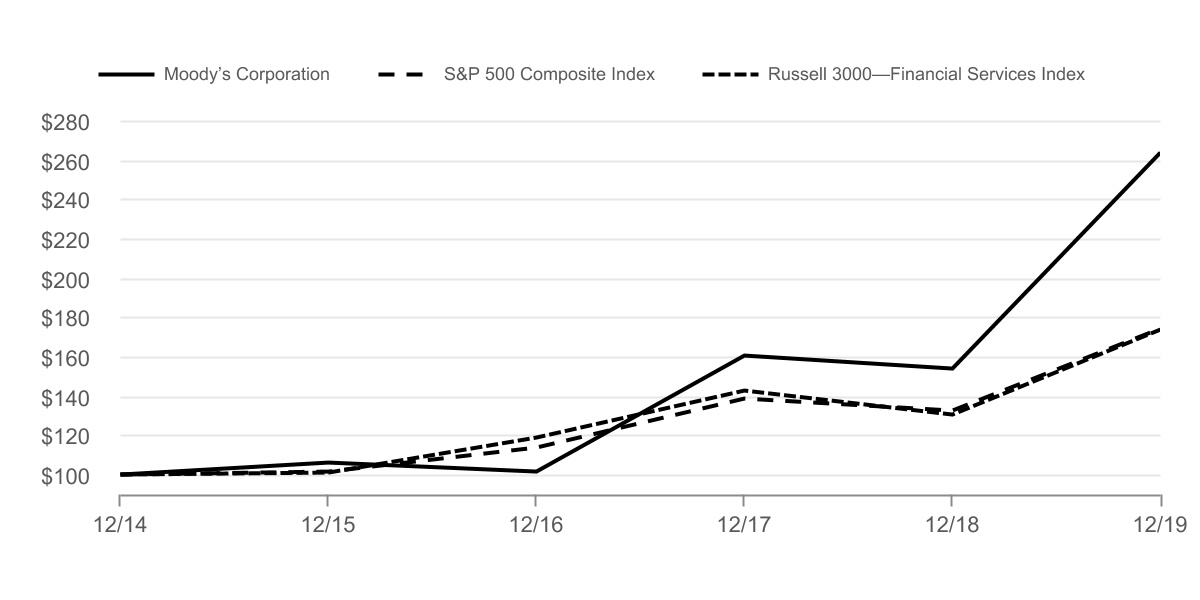
The following graph compares the total cumulative shareholder return of the Company to the performance of Standard & Poor’s 500 Composite Index and the Russell 3000 Financial Services Index. Both of the aforementioned indexes are easily accessible to the Company’s shareholders in newspapers, the internet and other readily available sources for purposes of the following graph.
The comparison assumes that $100.00 was invested in the Company’s common stock and in each of the foregoing indices on December 31, 2014. The comparison also assumes the reinvestment of dividends, if any. The total return for the common stock was 163% during the performance period as compared with a total return during the same period of 74% for both the Russell 3000 Financial Services Index and the S&P 500 Composite Index.
Comparison of Cumulative Total Return
COMPARISON OF 5 YEAR CUMULATIVE TOTAL RETURN
Among Moody’s Corporation, the S&P 500 Index
and the Russell 3000 Financial Services Index
| Year Ended December 31, | ||||||||||||||||||||||||||||||||||||||||||||||||||||||||||||||||||||
| 2014 | 2015 | 2016 | 2017 | 2018 | 2019 | |||||||||||||||||||||||||||||||||||||||||||||||||||||||||||||||
| Moody’s Corporation | $ | 100.00 | $ | 106.09 | $ | 101.22 | $ | 160.45 | $ | 153.86 | $ | 263.49 | ||||||||||||||||||||||||||||||||||||||||||||||||||||||||
| S&P 500 Composite Index | $ | 100.00 | $ | 101.38 | $ | 113.51 | $ | 138.29 | $ | 132.23 | $ | 173.86 | ||||||||||||||||||||||||||||||||||||||||||||||||||||||||
| Russell 3000—Financial Services Index | $ | 100.00 | $ | 100.68 | $ | 118.77 | $ | 142.45 | $ | 130.56 | $ | 173.54 |
The comparisons in the graph above are provided in response to disclosure requirements of the SEC and are not intended to forecast or be indicative of future performance of the Company’s common stock.
28 MOODY'S 2019 10-K
Previous: Item 4. MINE SAFETY DISCLOSURES · Next: Item 6. SELECTED FINANCIAL DATA