 filings.tools
Item 7. MANAGEMENT'S DISCUSSION AND ANALYSIS OF FINANCIAL CONDITION AND RESULTS OF OPERATIONS
143K characters. Original on sec.gov · Markdown
Item 7. MANAGEMENT'S DISCUSSION AND ANALYSIS OF FINANCIAL CONDITION AND RESULTS OF OPERATIONS
This discussion and analysis of financial condition and results of operations should be read in conjunction with the Moody’s Corporation consolidated financial statements and notes thereto included elsewhere in this annual report on Form 10-K.
This MD&A contains Forward-Looking Statements. See “Forward-Looking Statements” commencing on page 59 and Item 1A. “Risk Factors” commencing on page 17 for a discussion of uncertainties, risks and other factors associated with these statements.
THE COMPANY
Moody’s is a provider of (i) credit ratings and assessment services; (ii) credit, capital markets and economic research, data and analytical tools; (iii) software solutions that support financial risk management activities; (iv) quantitatively derived credit scores; (v) learning solutions and certification services; (vi) offshore financial research and analytical services (this business was divested with the sale of MAKS in the fourth quarter of 2019); and (vii) company information and business intelligence products. Moody’s reports in two reportable segments: MIS and MA.
MIS, the credit rating agency, publishes credit ratings and provides assessment services on a wide range of debt obligations and the entities that issue such obligations in markets worldwide. Revenue is primarily derived from the originators and issuers of such transactions who use MIS ratings in the distribution of their debt issues to investors. Additionally, MIS earns revenue from certain non-ratings-related operations, which consist primarily of financial instrument pricing services in the Asia-Pacific region as well as revenue from ICRA’s non-ratings operations. The revenue from these operations is included in the MIS Other LOB and is not material to the results of the MIS segment.
MA provides financial intelligence and analytical tools to assist businesses in making decisions. MA’s portfolio of solutions consists of specialized research, data, software, and professional services, which are assembled to support the financial analysis and risk management activities of institutional customers worldwide.
CRITICAL ACCOUNTING ESTIMATES
Moody’s discussion and analysis of its financial condition and results of operations are based on the Company’s consolidated financial statements, which have been prepared in accordance with accounting principles generally accepted in the United States. The preparation of these financial statements requires Moody’s to make estimates and judgments that affect reported amounts of assets and liabilities and related disclosures of contingent assets and liabilities at the dates of the financial statements and revenue and expenses during the reporting periods. These estimates are based on historical experience and on other assumptions that are believed to be reasonable under the circumstances. On an ongoing basis, Moody’s evaluates its estimates, including those related to revenue recognition, accounts receivable allowances, contingencies, restructuring, goodwill, long-lived assets (including acquired intangible assets), leases, pension and other retirement benefits and income taxes. Actual results may differ from these estimates under different assumptions or conditions. The following accounting estimates are considered critical because they are particularly dependent on management’s judgment about matters that are uncertain at the time the accounting estimates are made and changes to those estimates could have a material impact on the Company’s consolidated results of operations or financial condition.
Goodwill
On July 31st of each year, Moody’s evaluates its goodwill for impairment at the reporting unit level, defined as an operating segment (i.e., MIS and MA), or one level below an operating segment (i.e., a component of an operating segment).
The Company has seven primary reporting units at December 31, 2019: two within the Company’s ratings business (one for the ICRA business and one that encompasses all of Moody’s other ratings operations) and five reporting units within MA: Content, ERS, MALS, Bureau van Dijk and Reis. The Content reporting unit offers subscription-based research, data and analytical products, including credit ratings produced by MIS, credit research, quantitative credit scores and other analytical tools, economic research and forecasts, business intelligence and company information products. The ERS reporting unit provides products and services that support the credit risk management and regulatory compliance activities of financial institutions and also provides advanced actuarial software for the life insurance industry. These products and services are primarily delivered via software that is licensed on a perpetual basis or sold on a subscription basis. The MALS reporting unit consists of the portion of the MA business that offers both credit training as well as other professional development training. The Bureau van Dijk reporting unit primarily consists of the Bureau van Dijk business, and primarily provides business intelligence and company information products. The Reis reporting unit, which consists of the newly acquired Reis business, provides commercial real estate market information and analytical tools.
MOODY'S 2019 10-K 31
The Company evaluates the recoverability of goodwill using a two-step impairment test approach at the reporting unit level. In the first step, the Company assesses various qualitative factors to determine whether the fair value of a reporting unit may be less than its carrying amount. If a determination is made based on the qualitative factors that an impairment does not exist, the Company is not required to perform further testing. If the aforementioned qualitative assessment results in the Company concluding that it is more likely than not that the fair value of a reporting unit may be less than its carrying amount, the fair value of the reporting unit will be quantitatively determined and compared to its carrying value including goodwill. If the fair value of the reporting unit exceeds the carrying value of the net assets assigned to that unit, goodwill is not impaired and the Company is not required to perform further testing. If the fair value of the reporting unit is less than the carrying value, the Company will record a goodwill impairment charge for the amount by which the carrying value exceeds the reporting unit’s fair value. The Company evaluates its reporting units on an annual basis, or more frequently if there are changes in the reporting structure of the Company due to acquisitions, realignments or if there are indicators of potential impairment. For the reporting units where the Company is consistently able to conclude that no impairment exists using only a qualitative approach, the Company’s accounting policy is to perform the second step of the aforementioned goodwill impairment assessment at least once every three years.
At July 31, 2019, the Company performed quantitative assessments of the Content, ERS, MALS, Bureau van Dijk, MIS, and ICRA reporting units and a qualitative assessment for the Reis reporting unit, which was acquired by Moody's within one year of the Company's annual assessment date. The quantitative assessments did not result in the carrying value of the reporting unit exceeding its fair value. The qualitative analysis for Reis resulted in the Company determining that it was not more likely than not that the fair value of the Reis reporting unit was less than its carrying amount.
Determining the fair value of a reporting unit or an indefinite-lived acquired intangible asset involves the use of significant estimates and assumptions, which are more fully described below. In addition, the Company also makes certain judgments and assumptions in allocating shared assets and liabilities to determine the carrying values for each of its reporting units.
Other assets and liabilities, including applicable corporate assets, are allocated to the extent they are related to the operation of respective reporting units.
Sensitivity Analysis and Key Assumptions for Deriving the Fair Value of a Reporting Unit
The following table identifies the amount of goodwill allocated to each reporting unit as of December 31, 2019 and the amount by which the net assets of each reporting unit would exceed the fair value under Step 2 of the goodwill impairment test as prescribed in ASC Topic 350, assuming hypothetical reductions in their fair values as of the date of the last quantitative goodwill impairment assessment for each reporting unit (July 31, 2019 for all reporting units except Reis).
| Sensitivity Analysis | |||||||||||||||||||||||||||||||||||||||||||||||
| Deficit Caused by a Hypothetical Reduction to Fair Value | |||||||||||||||||||||||||||||||||||||||||||||||
| Goodwill | 10 | % | 20 | % | 30 | % | 40 | % | |||||||||||||||||||||||||||||||||||||||
| MIS | $ | 98 | $ | — | $ | — | $ | — | $ | — | |||||||||||||||||||||||||||||||||||||
| Content | 363 | — | — | — | — | ||||||||||||||||||||||||||||||||||||||||||
| ERS | 690 | — | — | — | — | ||||||||||||||||||||||||||||||||||||||||||
| MALS | 125 | — | — | (12) | (37) | ||||||||||||||||||||||||||||||||||||||||||
| ICRA | 220 | — | — | — | (30) | ||||||||||||||||||||||||||||||||||||||||||
| Bureau van Dijk | 2,045 | — | — | — | (266) | ||||||||||||||||||||||||||||||||||||||||||
| Reis (1) | 181 | N/A | N/A | N/A | N/A | ||||||||||||||||||||||||||||||||||||||||||
| Totals | $ | 3,722 | $ | — | $ | — | $ | (12) | $ | (333) |
(1)Reis was acquired in October 2018. Due to the close proximity of the Reis acquisition, the purchase price approximates the fair value of the reporting unit. In the event that Reis' actual performance does not meet its acquisition-case cash flows, an impairment in future quarters could result.
As illustrated in the preceding table, the reporting unit most at risk for potential impairment is the MALS reporting unit and failure to meet its financial projections could result in impairment in future quarters.
As discussed in further detail in Note 11 to the Company's consolidated financial statements, ICRA has reported that it is addressing certain matters which are currently under investigation. As of the date of the filing of this annual report on Form 10-K, the Company is unable to estimate the financial impact, if any, that may result from a potential unfavorable conclusion of these matters or any other ICRA inquiry. An unfavorable resolution of such matters may negatively impact ICRA’s future operating results, which could result in an impairment of goodwill and amortizable intangible assets in future quarters.
32 MOODY'S 2019 10-K
Methodologies and significant estimates utilized in determining the fair value of reporting units:
The following is a discussion regarding the Company’s methodology for determining the fair value of its reporting units, excluding ICRA, as of July 31, 2019, the date of each reporting unit’s last quantitative assessment. As ICRA is a publicly traded company in India, the Company was able to observe its fair value based on its market capitalization. The fair value of each reporting unit, excluding ICRA, was estimated using a discounted cash flow methodology and comparable public company and precedent transaction multiples. The discounted cash flow analysis requires significant estimates, including projections of future operating results and cash flows of each reporting unit that are based on internal budgets and strategic plans, expected long-term growth rates, terminal values, weighted average cost of capital and the effects of external factors and market conditions. Changes in these estimates and assumptions could materially affect the estimated fair value of each reporting unit that could result in an impairment charge to reduce the carrying value of goodwill, which could be material to the Company’s financial position and results of operations. Moody’s allocates newly acquired goodwill to reporting units based on the reporting unit expected to benefit from the acquisition.
The sensitivity analysis on the future cash flows and WACC assumptions described below are as of each reporting unit’s last quantitative goodwill impairment assessment. The following discusses the key assumptions utilized in the discounted cash flow valuation methodology that requires significant management judgment:
*–*Future cash flow assumptions —The projections for future cash flows utilized in the models are derived from historical experience and assumptions regarding future growth and profitability of each reporting unit. These projections are consistent with the Company’s operating budget and strategic plan. Cash flows for the six years subsequent to the date of the quantitative goodwill impairment analysis were utilized in the determination of the fair value of each reporting unit. The growth rates assumed a gradual increase in revenue based on a continued improvement in the global economy and capital markets, new customer acquisition and new products. Beyond six years, a terminal value was determined using a perpetuity growth rate based on inflation and real GDP growth rates. A sensitivity analysis of the revenue growth rates was performed on all reporting units. For each reporting unit analyzed, a 10% reduction in the revenue growth rates used would not have resulted in its carrying value exceeding its estimated fair value.
*–*WACC —The WACC is the rate used to discount each reporting unit’s estimated future cash flows. The WACC is calculated based on the proportionate weighting of the cost of debt and equity. The cost of equity is based on a risk-free interest rate and an equity risk factor, which is derived from public companies similar to the reporting unit and which captures the perceived risks and uncertainties associated with the reporting unit’s cash flows. The cost of debt component is calculated as the weighted average cost associated with all of the Company’s outstanding borrowings as of the date of the impairment test and was immaterial to the computation of the WACC. The cost of debt and equity is weighted based on the debt to market capitalization ratio of publicly traded companies with similarities to the reporting unit being tested. The WACC for all reporting units ranged from 8.5% to 9.0% as of July 31, 2019. Differences in the WACC used between reporting units is primarily due to distinct risks and uncertainties regarding the cash flows of the different reporting units. A sensitivity analysis of the WACC was performed on all reporting units as of July 31, 2019. For all reporting units analyzed, an increase in the WACC of one percentage point would not result in the carrying value of the reporting unit exceeding its fair value.
Long-lived assets
Long-lived assets, which consist primarily of amortizable intangible assets, operating lease ROU assets and property and equipment, are reviewed for recoverability whenever events or changes in circumstances indicate that the carrying amount may not be recoverable.
Under the first step of the recoverability assessment, Moody's compares the estimated undiscounted future cash flows attributable to the asset or asset group to its carrying value. If the undiscounted future cash flows are greater than the carrying value, no further assessment is required. If the undiscounted future cash flows are less than the carrying value, Moody's proceeds with step two of the assessment. Under step two of this assessment, Moody's is required to determine the fair value of the asset or asset group and recognize an impairment loss if the carrying amount exceeds its fair value. In performing this assessment, Moody's must include assumptions that market participants would use in their estimates of fair value, including the estimated future cash flows and discount rate. Moody's must apply judgment in developing estimated future cash flows and in the determination of market participant assumptions.
Income Taxes
The Company is subject to income taxes in the U.S. and various foreign jurisdictions. The Company’s tax assets and liabilities are affected by the amounts charged for services provided and expenses incurred as well as other tax matters such as intercompany transactions. The Company accounts for income taxes under the asset and liability method in accordance with ASC Topic 740. Therefore, income tax expense is based on reported income before income taxes, and deferred income taxes reflect the effect of temporary differences between the amounts of assets and liabilities that are recognized for financial reporting purposes and the amounts that are recognized for income tax purposes.
The Company is subject to tax audits in various jurisdictions. The Company regularly assesses the likely outcomes of such audits in order to determine the appropriateness of liabilities for UTPs. The Company classifies interest related to income taxes as a component of interest expense in the Company’s consolidated financial statements and associated penalties, if any, as part of other non-operating expenses.
MOODY'S 2019 10-K 33
For UTPs, ASC Topic 740 requires a company to first determine whether it is more-likely-than-not (defined as a likelihood of more than fifty percent) that a tax position will be sustained based on its technical merits as of the reporting date, assuming that taxing authorities will examine the position and have full knowledge of all relevant information. A tax position that meets this more-likely-than-not threshold is then measured and recognized at the largest amount of benefit that is greater than fifty percent likely to be realized upon effective settlement with a taxing authority. As the determination of liabilities related to UTPs and associated interest and penalties requires significant estimates to be made by the Company, there can be no assurance that the Company will accurately predict the outcomes of these audits, and thus the eventual outcomes could have a material impact on the Company’s operating results or financial condition.
On December 22, 2017, the Tax Act was signed into law, which resulted in significant changes to U.S. corporate tax laws. The Tax Act includes a mandatory one-time deemed repatriation tax (“transition tax”) on previously untaxed accumulated earnings of foreign subsidiaries and reduces the statutory federal corporate income tax rate from 35% to 21%. Due to the complexities involved in applying the provisions of the Tax Act, in 2017 the Company recorded a provisional estimate of $247 million related to the transition tax in 2017. In 2018, the IRS issued notices clarifying certain aspects of the transition tax. As a result, the Company reduced its provision for the transition tax by $11 million. The IRS may issue additional regulations or notices in future periods to clarify or amend provisions of the Tax Act and such guidance could result in revisions in future periods to the amounts recorded for the existing provisions and interpretations of the Tax Act. In addition, in 2018 the Company recorded a deferred tax asset of $48 million related to potential foreign tax credits which could be realized if certain UTPs resulted in tax assessments. Due to additional UTPs recorded, the Company increased the deferred tax asset to $50 million in 2019. The transition tax liability reported on the Company’s 2017 and 2018 tax returns is payable over eight years starting in 2018 and will not accrue interest. Due to the reduction in U.S. corporate income tax rates beginning in 2018, a decrease of $56 million was recorded to net deferred tax assets in 2017. The above amounts may be impacted by a number of additional considerations, including but not limited to the issuance of regulations and the Company’s ongoing analysis of the new law.
Pursuant to the Tax Act being signed into law, all previously undistributed foreign earnings became subject to U.S. tax. In light of U.S. tax reform, the Company has reassessed its capital allocation strategy, including reevaluating its global cash position and revising its plans for repatriating or reinvesting foreign earnings. The Company regularly evaluates in which entities it will indefinitely reinvest earnings outside the U.S. The Company has provided deferred taxes for those entities whose earnings are not considered indefinitely reinvested outside of the U.S.
Revenue Recognition and Costs to Obtain a Contract with a Customer
Revenue is recognized when control of promised goods or services is transferred to the customer, in an amount that reflects the consideration the Company expects to be entitled to in exchange for those goods or services.
The discussion below outlines areas of the Company’s revenue recognition process that require significant management judgment and estimates. Refer to Note 2 of the consolidated financial statements for a comprehensive discussion regarding the Company’s accounting policies relating to the recognition of revenue and costs to obtain a contract with a customer.
Determination of performance obligations:
When contracts with customers contain multiple performance obligations, the Company accounts for individual performance obligations separately if they are distinct.
In the Company’s MIS segment, revenue arrangements with multiple elements are generally comprised of two distinct performance obligations; the initial rating and the related monitoring services. Revenue attributed to initial ratings of issued securities is generally recognized when the rating is delivered to the issuer, whereas revenue from monitoring related to MIS’s ratings is recognized ratably over the period in which the monitoring is performed.
In the MA segment, contracts with customers often include promises to transfer multiple products and services to a customer. When arrangements for software, content or SaaS licenses also include related implementation services, the Company may be required to exercise significant judgment in determining the level of integration and interdependency between the promise to grant the software license and the promise to deliver the related implementation services. This determination influences whether the software license is considered distinct and accounted for separately (with revenue generally being recognized at the time the product master or first copy is delivered or transferred to the customer), or not distinct and accounted for together with the implementation services (with revenue being recognized on a percentage-of-completion basis as implementation services are performed).
Allocating consideration to performance obligations:
Management judgment is also required in the determination of the SSP, which is utilized to allocate the transaction price to each distinct performance obligation at contract inception when the contract includes multiple distinct performance obligations.
In the MIS segment, the SSP for both ratings and monitoring services is generally based upon directly observable selling prices where the rating or monitoring service is sold separately.
In the MA segment, for performance obligations where an observable price exists, such as PCS, the observable price is utilized. If an observable price does not currently exist, the Company will utilize management’s best estimate of SSP for that good or service using estimation methods that maximize the use of observable data points.
34 MOODY'S 2019 10-K
The SSP in both segments is usually apportioned along the lines of class of customer, nature of product/services, and other attributes related to those products and services. Once SSP is determined for each performance obligation, the transaction price, including any discount, is allocated based on the relative SSP of the separate performance obligations.
Costs to Obtain a Contract with a Customer:
Costs incurred to obtain customer contracts, such as sales commissions, are deferred and recorded within other current assets and other assets when such costs are determined to be incremental to obtaining a contract, would not have been incurred otherwise and the Company expects to recover those costs. These costs are amortized to expense on a systematic basis consistent with the transfer of products or services to the customer for which the asset relates. Depending on the line of business to which the contract relates, this amortization period may be based upon the average economic life of the products sold or average period for which services are provided, inclusive of anticipated contract renewals.
Contingencies
Accounting for contingencies, including those matters described in Note 22 to the consolidated financial statements, is highly subjective and requires the use of judgments and estimates in assessing their magnitude and likely outcome. In many cases, the outcomes of such matters will be determined by third parties, including governmental or judicial bodies. The provisions made in the consolidated financial statements, as well as the related disclosures, represent management’s best estimates of the current status of such matters and their potential outcome based on a review of the facts and in consultation with outside legal counsel where deemed appropriate. The Company regularly reviews contingencies and as new information becomes available may, in the future, adjust its associated liabilities.
For claims, litigation and proceedings and governmental investigations and inquiries not related to income taxes, the Company records liabilities in the consolidated financial statements when it is both probable that a liability has been incurred and the amount of loss can be reasonably estimated and periodically adjusts these as appropriate. When the reasonable estimate of the loss is within a range of amounts, the minimum amount of the range is accrued unless some higher amount within the range is a better estimate than another amount within the range. In instances, when a loss is reasonably possible but uncertainties related to the probable outcome and/or the amount or range of loss, management does not record a liability but discloses the contingency if material.
As additional information becomes available, the Company adjusts its assessments and estimates of such matters accordingly. Moody’s also discloses material pending legal proceedings pursuant to SEC rules and other pending matters as it may determine to be appropriate.
In view of the inherent difficulty of assessing the potential outcome of legal proceedings, governmental, regulatory and legislative investigations and inquiries, claims and litigation and similar matters and contingencies, particularly when the claimants seek large or indeterminate damages or assert novel legal theories or the matters involve a large number of parties, the Company often cannot predict what the eventual outcome of the pending matters will be or the timing of any resolution of such matters. The Company also may be unable to predict the impact (if any) that any such matters may have on how its business is conducted, on its competitive position or on its financial position, results of operations or cash flows. As the process to resolve any pending matters progresses, management will continue to review the latest information available and assess its ability to predict the outcome of such matters and the effects, if any, on its operations and financial condition and to accrue for and disclose such matters as and when required. However, because such matters are inherently unpredictable and unfavorable developments or resolutions can occur, the ultimate outcome of such matters, including the amount of any loss, may differ from those estimates.
Accounts Receivable Allowances
Moody’s records variable consideration in respect of estimated future adjustments to customer billings as an adjustment to revenue, using the expected value method based on analysis of similar contracts in the same line of business. Such amounts are reflected as additions to the accounts receivable allowance. Additionally, estimates of uncollectible accounts due to uncertainty relating to customers inability to pay are recorded as bad debt expense and are reflected as additions to the accounts receivable allowance. Actual billing adjustments are recorded against the allowance depending on the nature of the adjustment. Actual uncollectible account write-offs are recorded against the allowance. Moody’s evaluates its accounts receivable allowance by reviewing and assessing historical collection and adjustment experience and the current status of customer accounts. Moody’s also considers the economic environment of the customers, both from an industry and geographic perspective, in evaluating the need for allowances. Based on its analysis, Moody’s adjusts its allowance as considered appropriate in the circumstances. This process involves a high degree of judgment and estimation and could involve significant dollar amounts. Accordingly, Moody’s results of operations can be affected by adjustments to the allowance. Management believes that the allowance is adequate to cover anticipated adjustments and write-offs under current conditions. However, significant changes in any of the above factors, or actual write-offs or adjustments that differ from the estimated amounts, could impact the Company’s consolidated results of operations.
Pension and Other Retirement Benefits
The expenses, assets and liabilities that Moody’s reports for its Retirement Plans are dependent on many assumptions concerning the outcome of future events and circumstances. These significant assumptions include the following:
–future compensation increases based on the Company’s long-term actual experience and future outlook;
MOODY'S 2019 10-K 35
–long-term expected return on pension plan assets based on historical portfolio results and the expected future average annual return for each major asset class within the plan’s portfolio (which is principally comprised of equity and fixed-income investments); and
–discount rates based on current yields on high-grade corporate long-term bonds.
The discount rates used to measure the present value of the Company’s benefit obligation for its Retirement Plans as of December 31, 2019 were derived using a cash flow matching method whereby the Company compares each plan’s projected payment obligations by year with the corresponding yield on the FTSE pension discount curve. The cash flows by plan are then discounted back to present value to determine the discount rate applicable to each plan.
Moody’s major assumptions vary by plan and assumptions used are set forth in Note 16 to the consolidated financial statements. In determining these assumptions, the Company consults with third-party actuaries and other advisors as deemed appropriate. While the Company believes that the assumptions used in its calculations are reasonable, differences in actual experience or changes in assumptions could have a significant effect on the expenses, assets and liabilities related to the Company’s Retirement Plans. Additionally, the Company has updated its mortality assumption by adopting the newly released mortality improvement scale MP-2019 to accompany the Pri2012 mortality tables to reflect the latest information regarding future mortality expectations by the Society of Actuaries.
When actual plan experience differs from the assumptions used, actuarial gains or losses arise. Excluding differences between the expected long-term rate of return assumption and actual returns on plan assets, the Company amortizes, as a component of annual pension expense, total outstanding actuarial gains or losses over the estimated average future working lifetime of active plan participants to the extent that the gain/loss exceeds 10% of the greater of the beginning-of-year projected benefit obligation or the market-related value of plan assets. For Moody’s Retirement Plans, the total actuarial losses as of December 31, 2019 that have not been recognized in annual expense are $122 million, and Moody’s expects to recognize a net periodic expense of $8 million in 2020 related to the amortization of actuarial losses.
For Moody’s funded U.S. pension plan, the differences between the expected long-term rate of return assumption and actual returns could also affect the net periodic pension expense. As permitted under ASC Topic 715, the Company amortizes the impact of asset returns over a five-year period for purposes of calculating the market-related value of assets that is used in determining the expected return on assets’ component of annual expense and in calculating the total unrecognized gain or loss subject to amortization. As of December 31, 2019, the Company has an unrecognized asset loss of $26 million, of which $3 million will be recognized in the market-related value of assets that is used to calculate the expected return on assets’ component of 2020 expense.
The table below shows the estimated effect that a one percentage-point decrease in each of these assumptions will have on Moody’s 2020 income before provision for income taxes. These effects have been calculated using the Company’s current projections of 2020 expenses, assets and liabilities related to Moody’s Retirement Plans, which could change as updated data becomes available.
| (dollars in millions) | Assumptions Used for 2020 | Estimated Impact on 2020 Income before Provision for Income Taxes(Decrease)/Increase | |||||||||
| Weighted Average Discount Rates (1) | 3.04%/3.05% | $ | (10) | ||||||||
| Weighted Average Assumed Compensation Growth Rate | 3.64 | % | $ | 2 | |||||||
| Assumed Long-Term Rate of Return on Pension Assets | 4.45 | % | $ | (4) |
(1)Weighted average discount rates of 3.04% and 3.05% for pension plans and Other Retirement Plans, respectively.
A one percentage-point increase in assumed healthcare cost trend rates will not affect 2020 projected expenses. Based on current projections, the Company estimates that expenses related to Retirement Plans will be approximately $28 million in 2020, an increase compared to the $24 million recognized in 2019.
Leases
The Company’s operating leases do not provide an implicit interest rate. Accordingly, the Company must estimate the secured incremental borrowing rate attributable to the currency in which the lease is denominated in the derivation of operating lease liabilities and related operating lease ROU Assets. This secured incremental borrowing rate is based on the information available at the lease commencement date and is utilized in the determination of the present value of lease payments.
In addition, certain of Moody’s leases have the option to extend the lease beyond the initial term or terminate the lease prior to the end of the term. For these leases, Moody’s may be required to exercise significant judgment to determine when that option is reasonably certain of being exercised, which will impact the lease term and determination of the lease liability and corresponding ROU Asset.
36 MOODY'S 2019 10-K
Restructuring
The Company has engaged, and may continue to engage, in restructuring actions, which require management to utilize significant estimates related to expenses for severance and other employee benefit costs, contract termination costs and asset impairments. If the actual amounts differ from these estimates, the amount of the restructuring charge could be impacted. For a full description of Moody’s restructuring actions, refer to Note 12 to the consolidated financial statements.
Other Estimates
In addition, there are other accounting estimates within Moody’s consolidated financial statements, including recoverability of deferred tax assets, valuation of investments in affiliates and the estimated lives of amortizable intangible assets. Management believes the current assumptions and other considerations used to estimate amounts reflected in Moody’s consolidated financial statements are appropriate. However, if actual experience differs from the assumptions and other considerations used in estimating amounts reflected in Moody’s consolidated financial statements, the resulting changes could have a material adverse effect on Moody’s consolidated results of operations or financial condition.
See Note 2 to the consolidated financial statements for further information on significant accounting policies that impact Moody’s.
REPORTABLE SEGMENTS
The Company is organized into two reportable segments at December 31, 2019: MIS and MA, which are more fully described in the section entitled “The Company” above and in Note 23 to the consolidated financial statements.
RECLASSIFICATION OF PREVIOUSLY REPORTED REVENUE BY LOB
There were certain organizational/product realignments in both MIS and MA in the first quarter of 2019. Accordingly, in MIS, revenue from REITs, which was previously classified in the SFG LOB, is now classified in the CFG LOB. In MA, revenue relating to the Bureau van Dijk FACT product (a credit assessment and origination solution), which was previously classified in RD&A, is now classified in the ERS LOB. Accordingly, 2018 and 2017 revenue by LOB was reclassified to conform with this new presentation, as follows:
| MIS | As previously reported | Reclassification | As Reclassified | MA | As previously reported | Reclassification | As Reclassified | |||||||||||||||||||||||||||||||||||||||||||
| Full year 2018 | ||||||||||||||||||||||||||||||||||||||||||||||||||
| CFG | $ | 1,334 | $ | 45 | $ | 1,379 | RD&A | $ | 1,134 | $ | (13) | $ | 1,121 | |||||||||||||||||||||||||||||||||||||
| SFG | $ | 526 | $ | (45) | $ | 481 | ERS | $ | 438 | $ | 13 | $ | 451 | |||||||||||||||||||||||||||||||||||||
| Full year 2017 | ||||||||||||||||||||||||||||||||||||||||||||||||||
| CFG | $ | 1,393 | $ | 55 | $ | 1,448 | RD&A | $ | 833 | $ | (7) | $ | 826 | |||||||||||||||||||||||||||||||||||||
| SFG | $ | 495 | $ | (55) | $ | 440 | ERS | $ | 448 | $ | 7 | $ | 455 |
MOODY'S 2019 10-K 37
RESULTS OF OPERATIONS
This section of this Form 10-K generally discusses year ended December 31, 2019 and 2018 financial results and year-to-year comparisons between these years. Discussions related to the year ended December 31, 2017 financial results and year-to-year comparisons between the years ended December 31, 2018 and 2017 that are not included in this Form 10-K can be found in “Management’s Discussion and Analysis of Financial Condition and Results of Operations” in Part II, Item 7 of the Company’s Annual Report on Form 10-K for the fiscal year ended December 31, 2018*.*
Year ended December 31, 2019 compared with year ended December 31, 2018
Executive Summary
–Moody’s completed the following acquisitions, which impact the Company's year-over-year comparative results:
–Omega Performance on August 16, 2018;
–Reis on October 15, 2018;
–Vigeo Eiris on April 12, 2019;
–Four Twenty Seven on July 22, 2019;
–RiskFirst on July 25, 2019;
–ABS Suite on October 1, 2019
–On November 8, 2019, the Company sold its MAKS business to Equistone Partners Europe Limited, a European private equity firm. The operating results of MAKS are reported within the MA segment (and PS LOB) through the November 8, 2019 closing of the transaction.
–Refer to the section entitled "Non-GAAP Financial Measures" of this MD&A for the definitions of how the Company determines certain organic growth measures used in this MD&A that exclude the impact of acquisition/divestiture activity.
–The following table provides an executive summary of key operating results for the year ended December 31, 2019. Following this executive summary is a more detailed discussion of the Company’s operating results as well as a discussion of the operating results of the Company’s reportable segments.
38 MOODY'S 2019 10-K
| Year Ended December 31, | |||||||||||||||||||||||
| Financial measure: | 2019 | 2018 | % Change | Insight and Key Drivers of Change Compared to Prior Year | |||||||||||||||||||
| Moody's total revenue | $ | 4,829 | $ | 4,443 | 9 | % | — reflects growth in both segments | ||||||||||||||||
| MIS External Revenue | $ | 2,875 | $ | 2,712 | 6 | % | — higher revenue from rating corporate debt (both investment-grade and high-yield) resulting from both higher rated issuance volumes reflecting favorable market conditions and favorable product mix; | ||||||||||||||||
| partially offset by | |||||||||||||||||||||||
| — a decline in activity in bank loans and the CLO asset class primarily resulting from higher borrowing costs and shift in investor demand to fixed-rate instruments | |||||||||||||||||||||||
| MA External Revenue | $ | 1,954 | $ | 1,731 | 13 | % | — strong growth in the credit research and ratings data feeds product lines as well as growth from Bureau van Dijk within RD&A; | ||||||||||||||||
| — inorganic growth from 2019 acquisitions; and | |||||||||||||||||||||||
| — growth from ongoing demand in ERS for SaaS-based solutions, especially to facilitate adoption of new accounting standards by banks and insurance companies | |||||||||||||||||||||||
| Total operating and SG&A expenses | $ | 2,554 | $ | 2,326 | 10 | % | — additional compensation expense resulting from hiring activity, salary increases and incentive compensation aligned with financial performance; | ||||||||||||||||
| — inorganic expense growth from acquisitions | |||||||||||||||||||||||
| Restructuring | $ | 60 | $ | 49 | 22 | % | — charges pursuant to the 2018 Restructuring Program reflecting the rationalization and exit of certain real estate leases and reductions to staff - refer to Note 12 to the consolidated financial statements | ||||||||||||||||
| Loss pursuant to the divestiture of MAKS | $ | 14 | $ | — | NM | — loss relates to the divestiture of MAKS - refer to Note 10 to the consolidated financial statements | |||||||||||||||||
| Operating Margin | 41.4 | % | 42.0 | % | (60BPS) | — modest contraction is primarily due to the aforementioned restructuring and loss pursuant to the divestiture of MAKS | |||||||||||||||||
| Adjusted Operating Margin | 47.4 | % | 47.6 | % | (20BPS) | — in line with prior year | |||||||||||||||||
| ETR | 21.0 | % | 21.1 | % | (10BPS) | — overall in line with the prior year period | |||||||||||||||||
| Diluted EPS | $ | 7.42 | $ | 6.74 | 10 | % | — growth reflects higher operating income/Adjusted Operating Income coupled with benefits from the Company's share repurchase program | ||||||||||||||||
| Adjusted Diluted EPS | $ | 8.29 | $ | 7.39 | 12 | % |
MOODY'S 2019 10-K 39
Moody’s Corporation
| Year Ended December 31, | % Change Favorable (Unfavorable) | ||||||||||||||||||||||
| 2019 | 2018 | ||||||||||||||||||||||
| Revenue: | |||||||||||||||||||||||
| United States | $ | 2,544 | $ | 2,330 | 9 | % | |||||||||||||||||
| Non-U.S.: | |||||||||||||||||||||||
| EMEA | 1,446 | 1,377 | 5 | % | |||||||||||||||||||
| Asia-Pacific | 551 | 493 | 12 | % | |||||||||||||||||||
| Americas | 288 | 243 | 19 | % | |||||||||||||||||||
| Total Non-U.S. | 2,285 | 2,113 | 8 | % | |||||||||||||||||||
| Total | 4,829 | 4,443 | 9 | % | |||||||||||||||||||
| Expenses: | |||||||||||||||||||||||
| Operating | 1,387 | 1,246 | (11 | %) | |||||||||||||||||||
| SG&A | 1,167 | 1,080 | (8 | %) | |||||||||||||||||||
| Restructuring | 60 | 49 | (22 | %) | |||||||||||||||||||
| Depreciation and amortization | 200 | 192 | (4 | %) | |||||||||||||||||||
| Acquisition-Related Expenses | 3 | 8 | 63 | % | |||||||||||||||||||
| Loss pursuant to the divestiture of MAKS | 14 | — | NM | ||||||||||||||||||||
| Total | 2,831 | 2,575 | (10 | %) | |||||||||||||||||||
| Operating income | 1,998 | 1,868 | 7 | % | |||||||||||||||||||
| Adjusted Operating Income (1) | 2,291 | 2,117 | 8 | % | |||||||||||||||||||
| Interest expense, net | (208) | (215) | 3 | % | |||||||||||||||||||
| Other non-operating income, net | 20 | 19 | 5 | % | |||||||||||||||||||
| Non-operating (expense) income, net | (188) | (196) | 4 | % | |||||||||||||||||||
| Net income attributable to Moody’s | $ | 1,422 | $ | 1,310 | 9 | % | |||||||||||||||||
| Diluted weighted average shares outstanding | 191.6 | 194.4 | 1 | % | |||||||||||||||||||
| Diluted EPS attributable to Moody’s common shareholders | $ | 7.42 | $ | 6.74 | 10 | % | |||||||||||||||||
| Adjusted Diluted EPS (1) | $ | 8.29 | $ | 7.39 | 12 | % | |||||||||||||||||
| Operating margin | 41.4 | % | 42.0 | % | |||||||||||||||||||
| Adjusted Operating Margin (1) | 47.4 | % | 47.6 | % | |||||||||||||||||||
| Effective tax rate | 21.0 | % | 21.1 | % |
(1)Adjusted Operating Income, Adjusted Operating Margin and Adjusted Diluted EPS attributable to Moody’s common shareholders are non-GAAP financial measures. Refer to the section entitled “Non-GAAP Financial Measures” of this Management Discussion and Analysis for further information regarding these measures.
The table below shows Moody’s global staffing by geographic area:
| December 31, | % Change | ||||||||||||||||||||||||||||
| 2019 | 2018 | ||||||||||||||||||||||||||||
| United States | 3,908 | 4,007 | (2 | %) | |||||||||||||||||||||||||
| Non-U.S. | 7,173 | 9,050 | (21 | %) | |||||||||||||||||||||||||
| Total | 11,081 | (1) | 13,057 | (15 | %) |
(1)The divestiture of the MAKS business resulted in a reduction of approximately 2,700 employees, most of which were in low-cost jurisdictions. Additionally, Moody’s global staffing increased by approximately 400 employees relating to 2019 acquisitions.
40 MOODY'S 2019 10-K
GLOBAL REVENUE
2019**----------------------------------------------------------------------------------------------------------------------**2018
____________________________________________________________________********________________________________________________________________
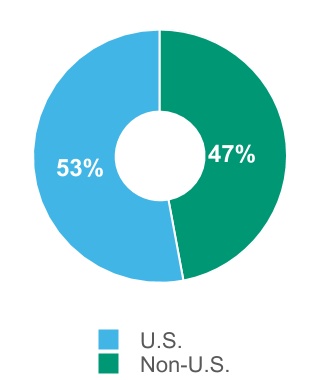
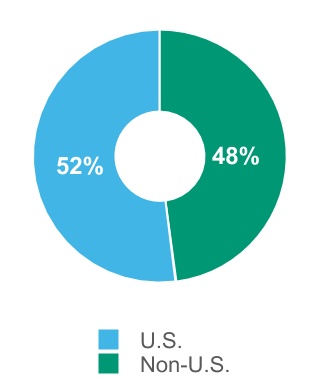
| Global revenue ⇑ $386 million | U.S. Revenue ⇑ $214 million | Non-U.S. Revenue ⇑ $172 million |
The increase in global revenue reflected growth in both reportable segments. Refer to the section entitled “Segment Results” of this MD&A for a more fulsome discussion of the Company’s segment revenue.
–The increase in U.S. revenue reflects strong growth in MA (most notably in RD&A) coupled with good growth in MIS (most notably in corporate debt ratings revenue)
–The increase in non-U.S. revenue reflects strong growth in MA (most notably in RD&A across all regions) coupled with good growth in MIS (most notably in corporate debt ratings revenue across all regions)
–Foreign currency translation unfavorably impacted non-U.S. revenue by three percent.
| Operating Expense ⇑ $141 million | SG&A Expense ⇑ $87 million |
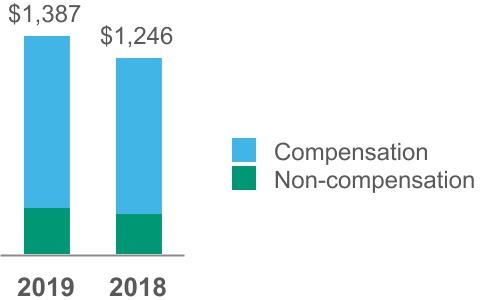 -------------------------------------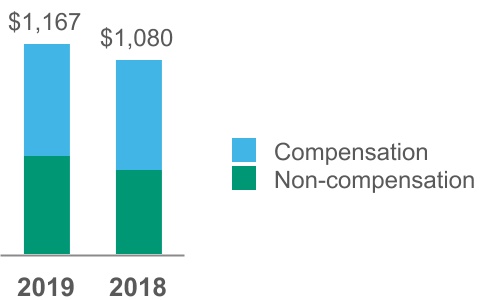
| Compensation expenses increased $100 million reflecting: | Compensation expenses increased $66 million reflecting: | ||||||||||||||||
| — hiring activity and salary increases partially offset by benefits from the 2018 Restructuring Program; | — hiring activity and salary increases partially offset by benefits from the 2018 Restructuring Program; | ||||||||||||||||
| — an increase in incentive compensation aligned with higher actual financial performance relative to targets; and | — an increase in incentive compensation aligned with higher actual financial performance relative to targets; and | ||||||||||||||||
| — inorganic expense growth from the aforementioned acquisitions. | — inorganic expense growth from the aforementioned acquisitions. | ||||||||||||||||
| Non-compensation expenses increased $41 million reflecting: | Non-compensation expenses increased $21 million reflecting: | ||||||||||||||||
| — higher costs to support the Company’s initiative to enhance technology infrastructure to enable automation, innovation and efficiency; and | — inorganic expense growth from the aforementioned acquisitions; | ||||||||||||||||
| — costs from the aforementioned acquisitions. | — higher costs to support the Company’s initiative to enhance technology infrastructure to enable automation, innovation and efficiency. |
MOODY'S 2019 10-K 41
| Other Expenses |
The restructuring charge of $60 million relates to actions pursuant to the Company’s 2018 Restructuring Program, which is more fully discussed in Note 12 to the consolidated financial statements.
The $14 million loss pursuant to the divestiture of MAKS relates to the Company's strategic divestiture of this business, which is more fully discussed in Note 10 to the consolidated financial statements.
| Operating margin 41.4%, down 60 BPS | Adjusted Operating Margin 47.4%, in line with prior year |
| — | Modest operating margin contraction is primarily due to a higher restructuring charge in 2019 coupled with the loss pursuant to the divestiture of MAKS | — | Adjusted Operating Margin is in line with the prior year |
| Interest Expense, net ⇓ $7 million | Other non-operating income ⇑ $1 million |
| Decrease is primarily due to: | Was in line with the prior year reflecting: | |||||||||||||
| — | a $41 million higher benefit from the interest element of cross-currency swaps (more fully discussed in Note 7 to the consolidated financial statements); | — | FX losses of approximately $18 million in 2019 compared to $11 million in FX losses in the same period of the prior year; | |||||||||||
| partially offset by: | offset by: | |||||||||||||
| — | an increase in tax-related interest of $13 million reflecting a higher benefit relating to the favorable resolution of UTPs in the 2018 compared to the same period in 2019 coupled with an increase in statutory interest rates for existing UTP reserves; and | — | $8 million in higher income primarily related to a higher expected return on the Company's pension plan assets. | |||||||||||
| — | a $12 million prepayment penalty on the early redemption of the 2010 Senior Notes. |
| ETR ⇓ 10BPS |
The ETR of 21.0% in 2019 was in line with the prior year (refer to Note 18 of the consolidated financial statements for further detail on the Company's ETR).
| Diluted EPS ⇑ $0.68 | Adjusted Diluted EPS ⇑ $0.90 |
| Diluted EPS in 2019 of $7.42 increased $0.68 compared to 2018 and included the aforementioned restructuring charge as well as the loss and tax-related charge pursuant to the divestiture of MAKS. Diluted EPS benefited approximately $0.11 from lower diluted weighted average shares outstanding, which primarily resulted from the Company's share repurchase program. | Adjusted Diluted EPS of $8.29 in 2019 increased $0.90 compared to 2018 (refer to the section entitled “Non-GAAP Financial Measures” of this MD&A for items excluded in the derivation of Adjusted Diluted EPS). Adjusted Diluted EPS benefited approximately $0.12 from lower diluted weighted average shares outstanding, which primarily resulted from the Company's share repurchase program. |
42 MOODY'S 2019 10-K
Segment Results
Moody’s Investors Service
The table below provides a summary of revenue and operating results, followed by further insight and commentary:
| Year Ended December 31, | % Change Favorable (Unfavorable) | ||||||||||||||||||||||
| 2019 | 2018 | ||||||||||||||||||||||
| Revenue: | |||||||||||||||||||||||
| Corporate finance (CFG) | $ | 1,497 | $ | 1,379 | 9 | % | |||||||||||||||||
| Structured finance (SFG) | 427 | 481 | (11 | %) | |||||||||||||||||||
| Financial institutions (FIG) | 476 | 442 | 8 | % | |||||||||||||||||||
| Public, project and infrastructure finance (PPIF) | 446 | 391 | 14 | % | |||||||||||||||||||
| Total ratings revenue | 2,846 | 2,693 | 6 | % | |||||||||||||||||||
| MIS Other | 29 | 19 | 53 | % | |||||||||||||||||||
| Total external revenue | 2,875 | 2,712 | 6 | % | |||||||||||||||||||
| Intersegment royalty | 134 | 124 | 8 | % | |||||||||||||||||||
| Total | 3,009 | 2,836 | 6 | % | |||||||||||||||||||
| Expenses: | |||||||||||||||||||||||
| Operating and SG&A (external) | 1,265 | 1,167 | (8 | %) | |||||||||||||||||||
| Operating and SG&A (intersegment) | 9 | 12 | 25 | % | |||||||||||||||||||
| Restructuring | 31 | 32 | 3 | % | |||||||||||||||||||
| Depreciation and amortization | 71 | 65 | (9 | %) | |||||||||||||||||||
| Total expense | 1,376 | 1,276 | (8 | %) | |||||||||||||||||||
| Operating income | $ | 1,633 | $ | 1,560 | 5 | % | |||||||||||||||||
| Restructuring | 31 | 32 | 3 | % | |||||||||||||||||||
| Depreciation and amortization | 71 | 65 | (9 | %) | |||||||||||||||||||
| Captive insurance company settlement | 10 | — | NM | ||||||||||||||||||||
| Adjusted Operating Income | $ | 1,745 | $ | 1,657 | 5 | % | |||||||||||||||||
| Operating margin | 54.3 | % | 55.0 | % | |||||||||||||||||||
| Adjusted Operating Margin | 58.0 | % | 58.4 | % |
Pursuant to certain organizational realignments in 2019, revenue from REITs, which was previously classified in the SFG LOB, is now reported as a component of the CFG LOB. The amounts reclassified were not material and prior year revenue by LOB has been reclassified to conform to this new presentation.
MOODY'S 2019 10-K 43
MOODY'S INVESTORS SERVICE REVENUE
2019**----------------------------------------------------------------------------------------------------------------------**2018
____________________________________________________________________********________________________________________________________________
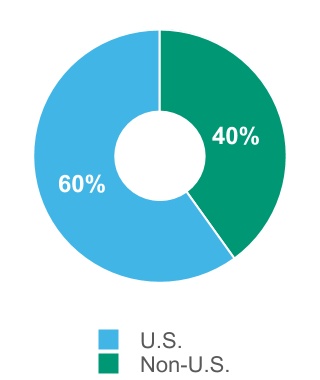
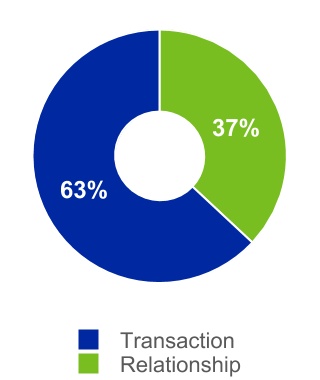
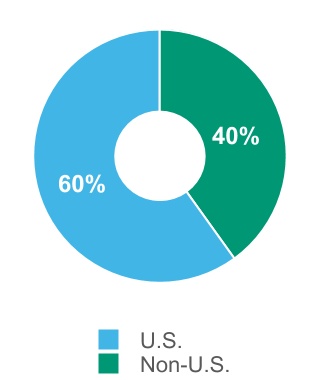
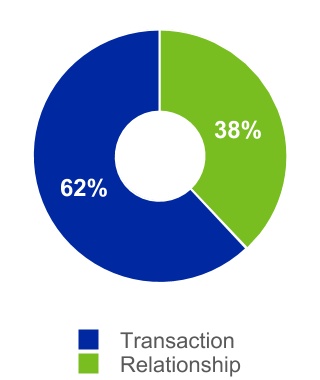
| MIS: Global revenue ⇑ $163 million | U.S. Revenue ⇑ $102 million | Non-U.S. Revenue ⇑ $61 million |
**–**The increase in Global MIS revenue reflected growth across all LOBs excluding SFG.
–The growth in U.S. revenue reflected higher CFG and PPIF revenue being partially offset by declines in SFG.
–The increase in non-U.S. revenue reflected growth in CFG and FIG being partially offset by declines in SFG.
–Foreign currency translation unfavorably impacted non-U.S. MIS revenue by three percentage points.
CFG REVENUE
2019**----------------------------------------------------------------------------------------------------------------------**2018
____________________________________________________________________********________________________________________________________________
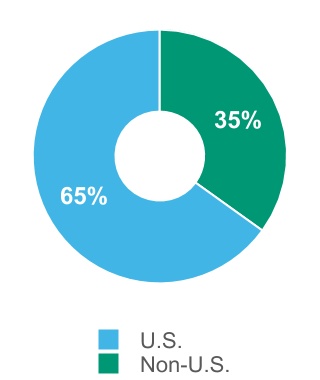
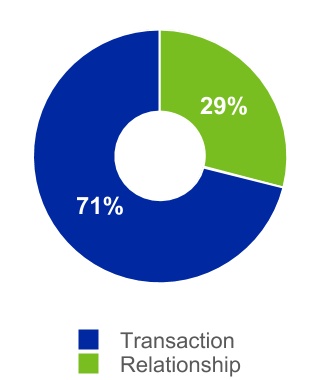
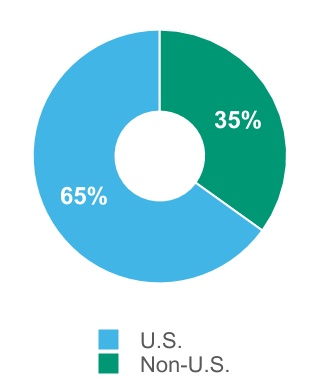
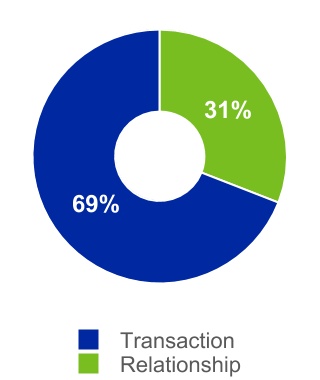
| CFG: Global revenue ⇑ $118 million | U.S. Revenue ⇑ $74 million | Non-U.S. Revenue ⇑ $44 million |
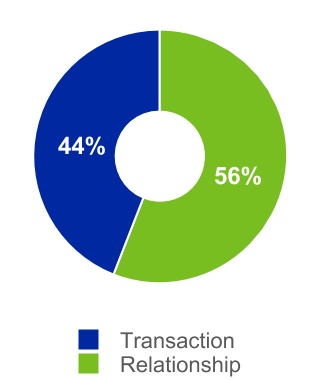
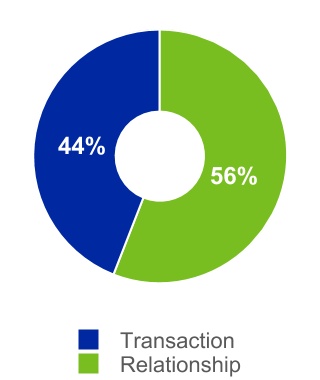
Global CFG revenue for the years ended December 31, 2019 and 2018 was comprised as follows:
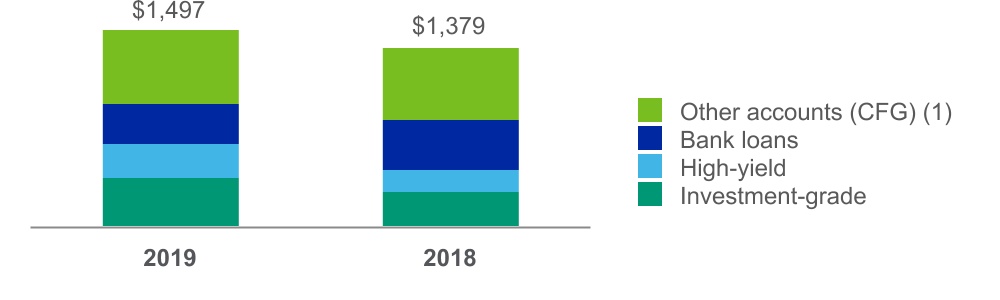
(1) Other includes: recurring monitoring fees of a rated debt obligation and/or entities that issue such obligations as well as fees from programs such as commercial paper, medium term notes, and ICRA corporate finance revenue.
44 MOODY'S 2019 10-K
The increase in CFG revenue of 9% reflected growth both in the U.S. (8%) and internationally (9%) with the most notable drivers consisting of:
–benefits from favorable changes in product mix and pricing increases;
–growth in corporate bond (both investment-grade and speculative-grade) rated issuance volumes, mainly in the U.S. and EMEA, as issuers took advantage of low borrowing costs to secure acquisition financing and complete opportunistic new issuance/refinancing transactions;
partially offset by:
–a decline in rated issuance volumes in U.S. bank loans as higher borrowing costs and reduced investor demand for floating rate instruments suppressed activity.
SFG REVENUE
2019**----------------------------------------------------------------------------------------------------------------------**2018
____________________________________________________________________********________________________________________________________________
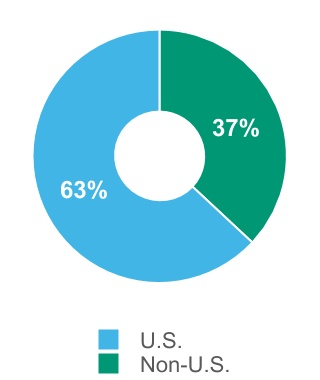
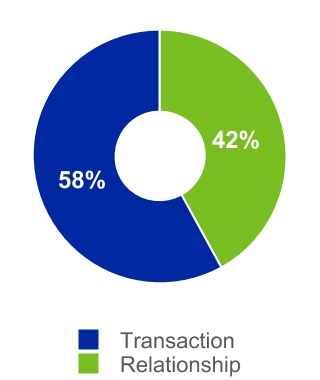
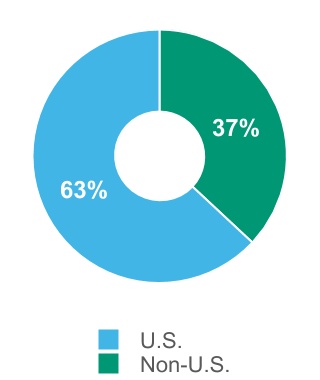
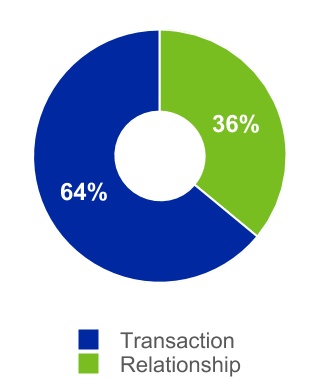
| SFG: Global revenue ⇓ $54 million | U.S. Revenue ⇓ $31 million | Non-U.S. Revenue ⇓ $23 million |
Global SFG revenue for the years ended December 31, 2019 and 2018 was comprised as follows:
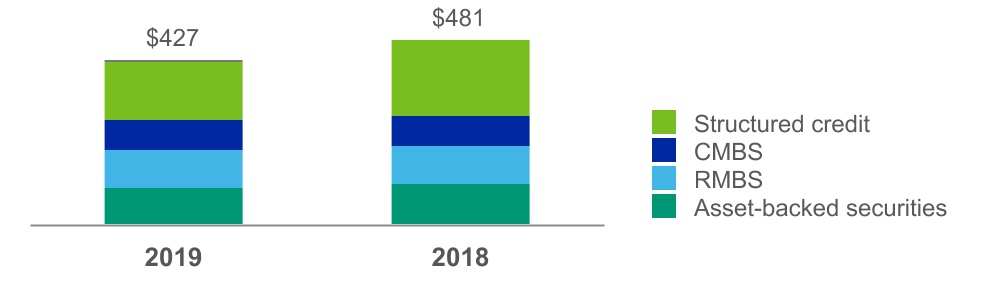
The decrease in SFG revenue of 11% reflected declines both in the U.S. (10%) and internationally (13%) and primarily reflected:
–lower revenue from the CLO asset class in the U.S. and internationally, as wider credit spreads, lower loan supply and an increasingly competitive landscape have resulted in reduced activity;
–declines across most asset classes in EMEA, as geopolitical uncertainties and continued uncertainties relating to Brexit during 2019 resulted in reduced activity. Additionally, there was elevated activity in 2018 in advance of certain regulations relating to securitization transactions in Europe.
MOODY'S 2019 10-K 45
FIG REVENUE
2019**----------------------------------------------------------------------------------------------------------------------**2018
____________________________________________________________________********________________________________________________________________
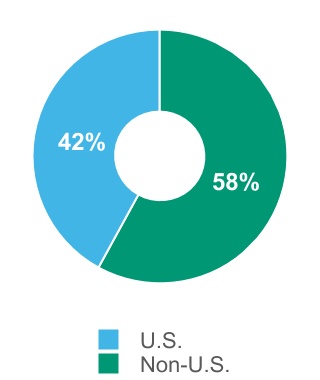
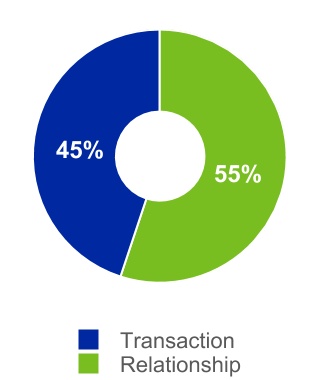
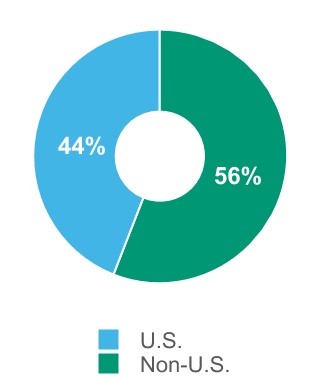

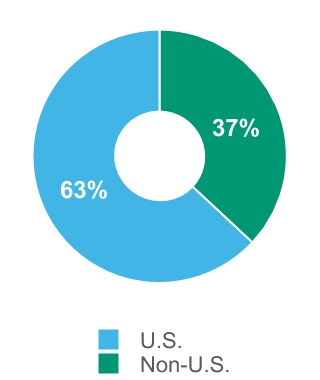
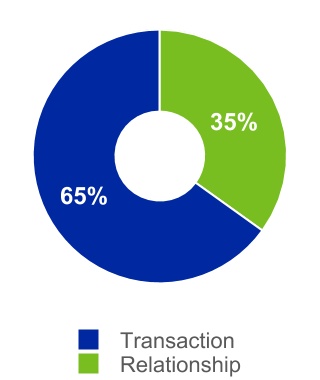
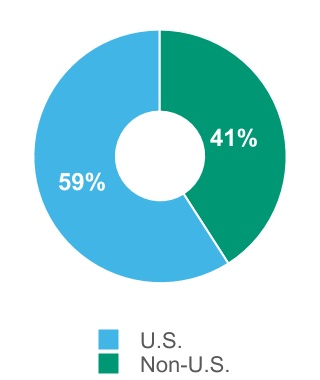
| FIG: Global revenue ⇑ $34 million | U.S. Revenue ⇑ $6 million | Non-U.S. Revenue ⇑ $28 million |
Global FIG revenue for the years ended December 31, 2019 and 2018 was comprised as follows:
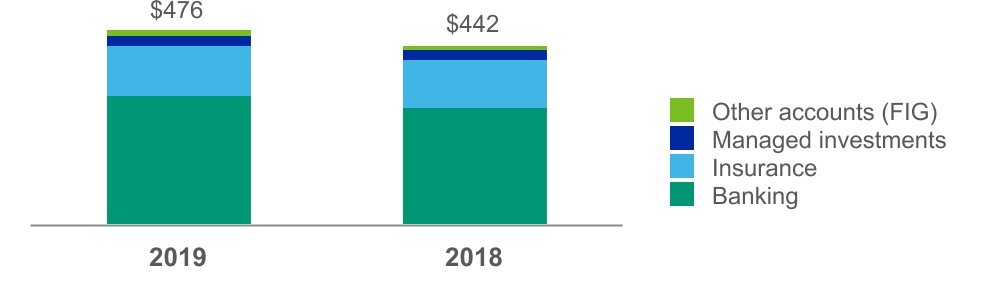
The 8% increase in FIG revenue was mainly due to growth internationally in the banking sector primarily due to favorable product mix.
Foreign currency translation unfavorably impacted FIG revenue by two percent.
PPIF REVENUE
2019**----------------------------------------------------------------------------------------------------------------------**2018
____________________________________________________________________********________________________________________________________________

46 MOODY'S 2019 10-K
| PPIF: Global revenue ⇑ $55 million | U.S. Revenue ⇑ $53 million | Non-U.S. Revenue ⇑ $2 million |
Global PPIF revenue for the years ended December 31, 2019 and 2018 was comprised as follows:
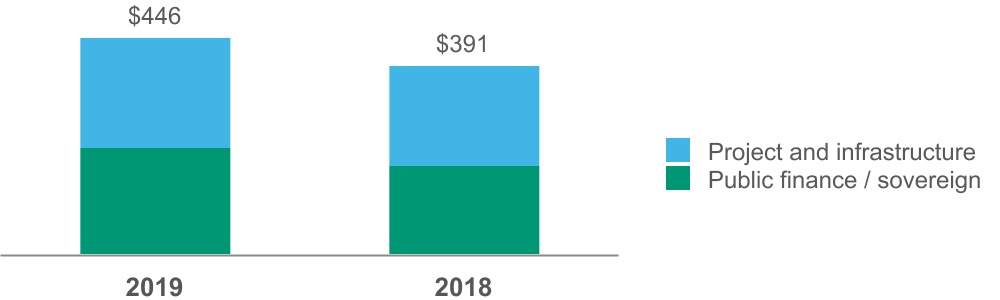
The 14% increase in PPIF revenue consisted almost entirely of growth in the U.S. reflecting:
–higher public finance refunding volumes resulting from continued low benchmark interest rates; and
–higher infrastructure finance rated issuance volumes (mainly in the utilities and power sectors) resulting from favorable market conditions.
| MIS: Operating and SG&A Expense ⇑ $98 million |
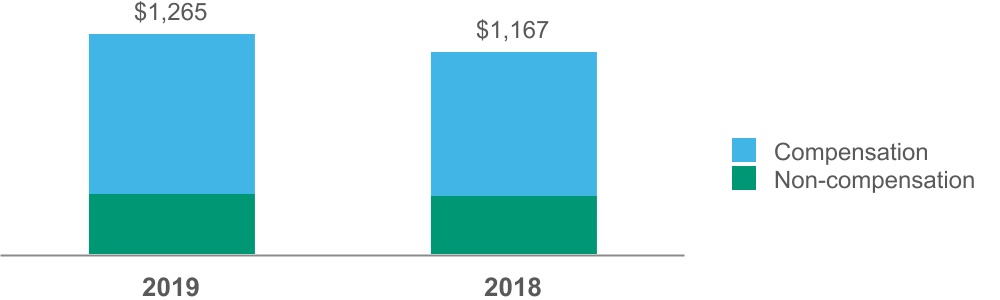
The increase is primarily due to growth in compensation expenses reflecting:
–higher incentive compensation of approximately $50 million aligned with higher financial performance relative to targets;
–higher salaries and employee benefits of approximately $40 million reflecting hiring activity and salary increases partially offset by the beneficial impacts of the 2018 Restructuring Program.
| Other Expenses |
The restructuring charge of $31 million relates to actions pursuant to the Company’s 2018 Restructuring Program, which are more fully discussed in Note 12 to the consolidated financial statements.
| MIS: Operating Margin 54.3% ⇓ 70BPS | Adjusted Operating Income 58.0% ⇓ 40BPS |
MIS operating margin and Adjusted Operating Margin were both generally in line with the prior year.
MOODY'S 2019 10-K 47
Moody’s Analytics
The table below provides a summary of revenue and operating results, followed by further insight and commentary:
| Year Ended December 31, | % Change Favorable (Unfavorable) | ||||||||||||||||||||||
| 2019 | 2018 | ||||||||||||||||||||||
| Revenue: | |||||||||||||||||||||||
| Research, data and analytics (RD&A) | $ | 1,273 | $ | 1,121 | 14 | % | |||||||||||||||||
| Enterprise risk solutions (ERS) | 522 | 451 | 16 | % | |||||||||||||||||||
| Professional services (PS) | 159 | 159 | — | % | |||||||||||||||||||
| Total external revenue | 1,954 | 1,731 | 13 | % | |||||||||||||||||||
| Intersegment revenue | 9 | 12 | (25 | %) | |||||||||||||||||||
| Total MA Revenue | 1,963 | 1,743 | 13 | % | |||||||||||||||||||
| Expenses: | |||||||||||||||||||||||
| Operating and SG&A (external) | 1,289 | 1,159 | (11 | %) | |||||||||||||||||||
| Operating and SG&A (intersegment) | 134 | 124 | (8 | %) | |||||||||||||||||||
| Restructuring | 29 | 17 | (71 | %) | |||||||||||||||||||
| Depreciation and amortization | 129 | 127 | (2 | %) | |||||||||||||||||||
| Acquisition-Related Expenses | 3 | 8 | 63 | % | |||||||||||||||||||
| Loss pursuant to the divestiture of MAKS | 14 | — | NM | ||||||||||||||||||||
| Total expense | 1,598 | 1,435 | (11 | %) | |||||||||||||||||||
| Operating income | $ | 365 | $ | 308 | 19 | % | |||||||||||||||||
| Restructuring | 29 | 17 | (71 | %) | |||||||||||||||||||
| Depreciation and amortization | 129 | 127 | (2 | %) | |||||||||||||||||||
| Acquisition-Related Expenses | 3 | 8 | 63 | % | |||||||||||||||||||
| Loss pursuant to the divestiture of MAKS | 14 | — | NM | ||||||||||||||||||||
| Captive insurance company settlement | 6 | — | NM | ||||||||||||||||||||
| Adjusted Operating Income | $ | 546 | $ | 460 | 19 | % | |||||||||||||||||
| Operating margin | 18.6 | % | 17.7 | % | |||||||||||||||||||
| Adjusted Operating Margin | 27.8 | % | 26.4 | % |
Pursuant to organizational/product realignments in the first quarter of 2019, revenue relating to the Bureau van Dijk FACT product, a credit assessment and origination software solution, is now reported in the ERS LOB. This revenue was previously reported in the RD&A LOB. Prior year revenue by LOB has been reclassified to conform to this new presentation, and the amounts reclassified were not material.
48 MOODY'S 2019 10-K
MOODY'S ANALYTICS REVENUE
2019**----------------------------------------------------------------------------------------------------------------------**2018
____________________________________________________________________********________________________________________________________________
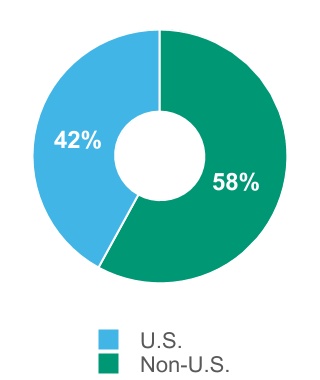
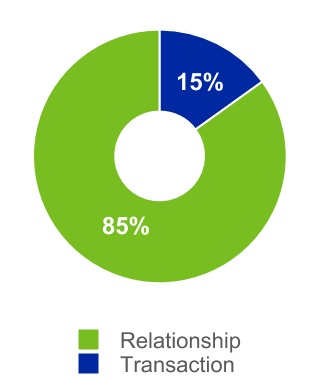
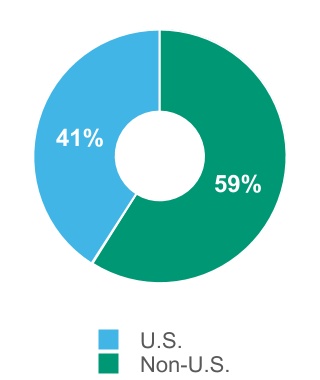
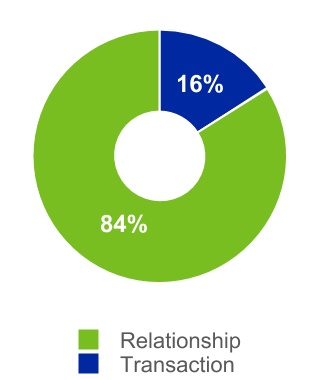
| MA: Global revenue ⇑ $223 million | U.S. Revenue ⇑ $112 million | Non-U.S. Revenue ⇑ $111 million |
The 13% increase in global MA revenue reflects strong growth in RD&A and ERS.
–Organic revenue growth was 11% (refer to the section entitled "Non-GAAP Financial Measures" of this MD&A for the definition and methodology that the Company utilizes to calculate this metric).
–Foreign currency translation unfavorably impacted MA revenue by two percent.
–The increase in U.S. revenue reflected growth across all LOBs, most notably in RD&A.
–The increase in non-U.S. revenue reflected growth in RD&A and ERS across all regions.
–Foreign currency translation unfavorably impacted non-U.S. MA revenue by three percent.
RD&A REVENUE
2019**----------------------------------------------------------------------------------------------------------------------**2018
____________________________________________________________________********________________________________________________________________
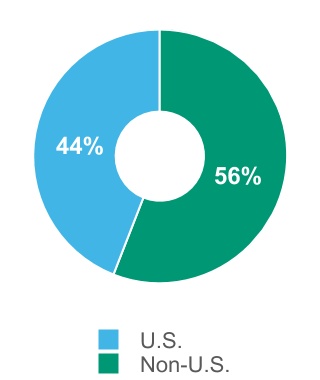
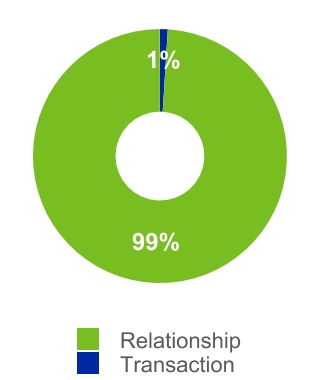
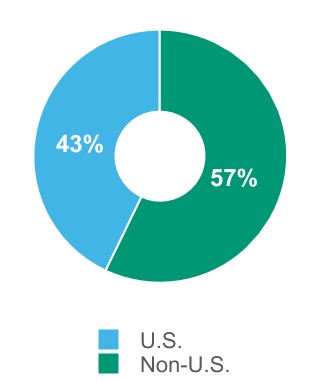

| RD&A: Global revenue ⇑ $152 million | U.S. Revenue ⇑ $77 million | Non-U.S. Revenue ⇑ $75 million |
Global RD&A revenue grew 14% compared to 2018 with the most notable drivers of the change reflecting:
–strong results in the credit research and rating data feeds product lines which comprised approximately 40% of the global RD&A growth;
–this growth reflected enhanced content on the new CreditView platform and continued alignment of usage and licensing parameters which have generated higher fees
–strong demand for Bureau van Dijk solutions that address customer identity requirements, such as know-your-customer, anti-money laundering, anti-bribery and sanctions compliance;
–inorganic revenue from the Reis acquisition of $28 million.
Foreign currency translation unfavorably impacted RD&A revenue by two percent.
Organic revenue growth for RD&A was 11%.
MOODY'S 2019 10-K 49
ERS REVENUE
2019**----------------------------------------------------------------------------------------------------------------------**2018
____________________________________________________________________********________________________________________________________________

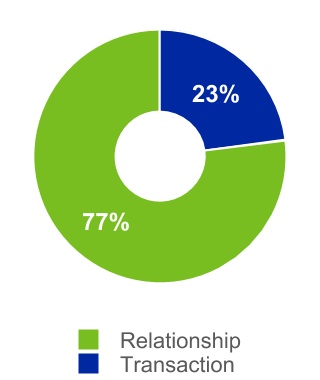
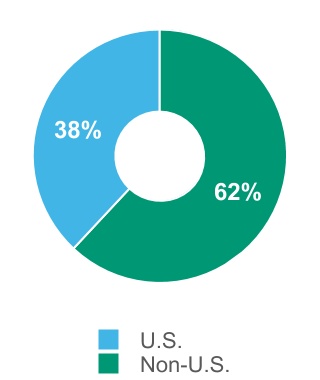

| ERS: Global revenue ⇑ $71 million | U.S. Revenue ⇑ $31 million | Non-U.S. Revenue ⇑ $40 million |
Global ERS revenue increased 16% compared to 2018 with the most notable drivers of the growth reflecting:
–ongoing demand for credit assessment and loan origination solutions and SaaS-based CECL solutions;
–increased demand for actuarial modeling tools in support of certain international accounting standards relating to insurance contracts.
Approximately 73% of the global ERS revenue growth was from subscription-based products.
Organic revenue growth for ERS was 14%.
PS REVENUE
2019**----------------------------------------------------------------------------------------------------------------------**2018
____________________________________________________________________********________________________________________________________________
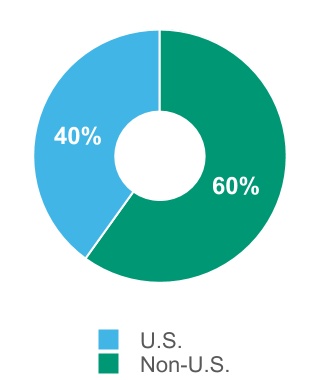
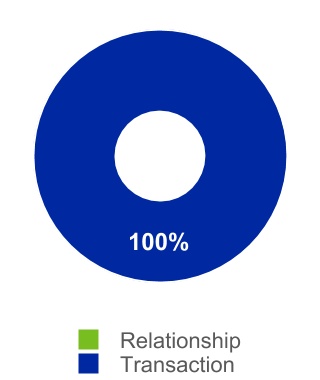
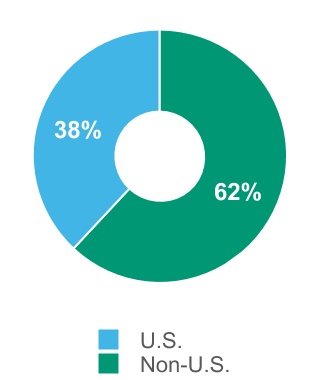

| PS: Global revenue was in line with prior year | U.S. Revenue ⇑ $4 million | Non-U.S. Revenue ⇓ $4 million |
Global PS revenue was flat compared to 2018 and reflected the following offsetting drivers:
–organic growth in online learning solutions;
–$5 million in inorganic revenue growth from the acquisition of Omega Performance;
partially offset by:
*–*lower revenue from outsourced analytical and research services pursuant to the divestiture of the MAKS business on November 8, 2019.
Organic revenue growth for PS was 8%.
50 MOODY'S 2019 10-K
| MA: Operating and SG&A Expense ⇑ $130 million |
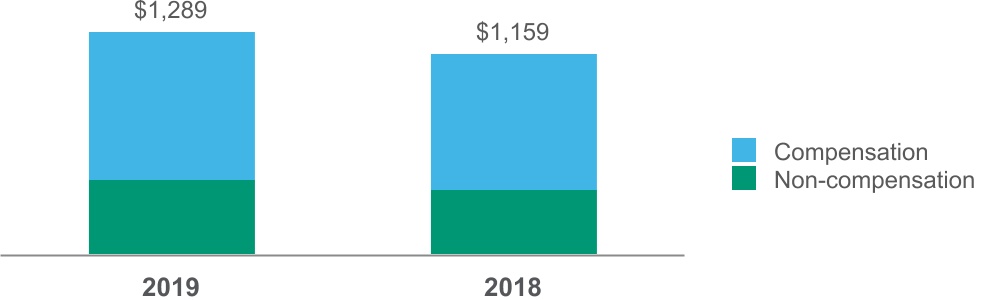
The increase in operating and SG&A expenses compared to 2018 reflected growth in both compensation and non-compensation costs of approximately $74 million and $56 million, respectively. The most notable drivers of this growth were:
| Compensation costs | Non-compensation costs | ||||||||||
| — | higher costs reflecting hiring activity and salary increases partially offset by savings from the 2018 Restructuring Program; | — | higher costs to support the Company’s initiative to enhance technology infrastructure to enable automation, innovation and efficiency. | ||||||||
| — | inorganic expense growth of $26 million relating to the 2019 acquisitions. |
| Other Expenses |
The restructuring charge of $29 million relates to actions pursuant to the Company’s 2018 Restructuring Plan, which are more fully discussed in Note 12 to the consolidated financial statements.
The $14 million loss pursuant to the divestiture of MAKS, which is more fully discussed in Note 10 to the consolidated financial statements, relates to the Company's strategic divestiture of this business.
| MA: Operating Margin 18.6% ⇑ 90BPS | Adjusted Operating Margin 27.8% ⇑ 140BPS |
The operating margin and Adjusted Operating Margin expansion for MA both reflect strong RD&A revenue growth coupled with strong growth in higher margin SaaS-based solutions in the ERS LOB. Operating margin expansion was suppressed by higher restructuring charges in 2019 and the loss pursuant to the divestiture of MAKS.
MARKET RISK
Foreign exchange risk:
Moody’s maintains a presence in more than 40 countries. In 2019, approximately 43% of the Company’s revenue and approximately 42% of the Company expenses were denominated in functional currencies other than the U.S. dollar, principally in the British pound and the euro. As such, the Company is exposed to market risk from changes in FX rates. As of December 31, 2019, approximately 68% of Moody’s assets were located outside the U.S., making the Company susceptible to fluctuations in FX rates. The effects of translating assets and liabilities of non-U.S. operations with non-U.S. functional currencies to the U.S. dollar are charged or credited to OCI.
The effects of revaluing assets and liabilities that are denominated in currencies other than a subsidiary’s functional currency are charged to other non-operating income (expense), net in the Company’s consolidated statements of operations. Accordingly, the Company enters into foreign exchange forwards to partially mitigate the change in fair value on certain assets and liabilities denominated in currencies other than a subsidiary’s functional currency.
MOODY'S 2019 10-K 51
The following table shows the impact to the fair value of the forward contracts if foreign currencies weakened against the U.S. dollar or euro:
| Foreign Currency Forwards (1) | Impact on fair value of contract if foreign currency weakened by 10% | |||||||||||||||||||
| Sell | Buy | |||||||||||||||||||
| U.S. dollar | British pound | $23 million unfavorable impact | ||||||||||||||||||
| U.S. dollar | Canadian dollar | $8 million unfavorable impact | ||||||||||||||||||
| U.S. dollar | Euro | $42 million unfavorable impact | ||||||||||||||||||
| U.S. dollar | Japanese yen | $3 million unfavorable impact | ||||||||||||||||||
| U.S. dollar | Singapore dollar | $4 million unfavorable impact | ||||||||||||||||||
| Euro | British pound | €2 million unfavorable impact |
(1)Refer to Note 7 to the consolidated financial statements in Item 8 of this Form 10-K for further detail on the forward contracts.
The change in fair value of the foreign exchange forward contracts would be offset by FX revaluation gains or losses on underlying assets and liabilities denominated in currencies other than a subsidiary’s functional currency.
Euro-denominated debt and cross-currency swaps designated as net investment hedges:
The Company has designated €500 million of the 2015 Senior Notes and €750 million of the 2019 Senior Notes as a net investment hedge to mitigate FX exposure relating to euro denominated net investments in subsidiaries. If the euro were to strengthen 10% relative to the U.S. dollar, there would be an approximate $140 million unfavorable adjustment to OCI related to this net investment hedge. This adjustment would be offset by favorable translation adjustments on the Company’s euro net investment in subsidiaries.
In 2019, the Company had cross-currency swaps to exchange an aggregate amount of €1,079 million with corresponding euro fixed interest rates for an aggregate amount of $1,220 million with corresponding USD fixed interest rates. Additionally, the Company had cross-currency swaps to exchange an aggregate amount of €931 million with corresponding interest based on the floating 3-month EURIBOR for an aggregate amount of $1,080 million with corresponding interest based on the floating 3-month U.S. LIBOR. Both types of swaps were designated as net investment hedges under ASC Topic 815, Derivatives and Hedging. The purpose of these cross-currency swaps is to mitigate FX exposure related to a portion of the Company’s euro net investments in certain foreign subsidiaries against changes in euro/USD exchange rates. If the euro were to strengthen 10% relative to the U.S. dollar, there would be an approximate $226 million unfavorable impact to the fair value of the cross-currency swaps recognized in OCI, which would be offset by favorable currency translation gains on the Company’s euro net investment in foreign subsidiaries.
Credit and Interest rate risk:
Interest rate swaps designated as a fair value hedge:
The Company’s interest rate risk management objectives are to reduce the funding cost and volatility to the Company and to alter the interest rate exposure to the desired risk profile. Moody’s uses interest rate swaps as deemed necessary to assist in accomplishing these objectives. The Company is exposed to interest rate risk on its various outstanding fixed-rate debt for which the fair value of the outstanding fixed rate debt fluctuates based on changes in interest rates. The Company has entered into interest rate swaps to convert the fixed interest rate on certain of its long-term debt to a floating interest rate based on the 3-month LIBOR. These swaps are adjusted to fair market value based on prevailing interest rates at the end of each reporting period and fluctuations are recorded as a reduction or addition to the carrying value of the borrowing, while net interest payments are recorded as interest expense/income in the Company’s consolidated statement of operations. A hypothetical change of 100 BPS in the LIBOR-based swap rate would result in an approximate $27 million change to the fair value of the swap, which would be offset by the change in fair value of the hedged item.
Additional information on these interest rate swaps is disclosed in Note 7 to the consolidated financial statements located in Item 8 of this Form 10-K.
Moody’s cash equivalents consist of investments in high-quality investment-grade securities within and outside the U.S. with maturities of three months or less when purchased. The Company manages its credit risk exposure by allocating its cash equivalents among various money market mutual funds, money market deposit accounts, certificates of deposit and issuers of high-grade commercial paper and by limiting the amount it can invest with any single issuer. Short-term investments primarily consist of certificates of deposit.
52 MOODY'S 2019 10-K
LIQUIDITY AND CAPITAL RESOURCES
Cash Flow
The Company is currently financing its operations, capital expenditures, acquisitions and share repurchases from operating and financing cash flows.
The following is a summary of the changes in the Company’s cash flows followed by a brief discussion of these changes:
| Year Ended December 31, | $ Change Favorable (unfavorable) | |||||||||||||||||||||||||
| 2019 | 2018 | |||||||||||||||||||||||||
| Net cash provided by operating activities | $ | 1,675 | $ | 1,461 | $ | 214 | ||||||||||||||||||||
| Net cash provided by (used in) investing activities | $ | 36 | $ | (406) | $ | 442 | ||||||||||||||||||||
| Net cash used in financing activities | $ | (1,563) | $ | (412) | $ | (1,151) | ||||||||||||||||||||
| Free Cash Flow (1) | $ | 1,606 | $ | 1,370 | $ | 236 |
(1)Free Cash Flow is a non-GAAP measure and is defined by the Company as net cash provided by operating activities minus cash paid for capital expenditures. Refer to “Non-GAAP Financial Measures” of this MD&A for further information on this financial measure.
Net cash provided by operating activities
Net cash flows from operating activities increased $214 million compared to the prior year primarily due to the increase in Adjusted Operating Income compared to the same period in the prior year (see section entitled "Results of Operations" for further discussion) coupled with various changes in working capital.
Net cash provided by (used in) investing activities
The $442 million increase in cash flows provided by investing activities compared to 2018 primarily reflects:
–a $127 million decrease in cash paid for acquisitions compared to the prior year; and
–$226 million of net cash received relating to the MAKS divestiture in 2019.
Net cash used in financing activities
The $1,151 million increase in cash used in financing activities was primarily attributed to:
–a $788 million increase in the amount of treasury shares repurchased, which included the execution of an ASR program by the Company in February 2019; and
–an increase in the net debt repayments of $288 million compared to prior year.
Cash and short-term investments held in non-U.S. jurisdictions
The Company’s aggregate cash and cash equivalents and short-term investments of $1.9 billion at December 31, 2019 included approximately $1.2 billion located outside of the U.S. Approximately 26% of the Company’s aggregate cash and cash equivalents and short-term investments is denominated in euros and British pounds. The Company manages both its U.S. and non-U.S. cash flow to maintain sufficient liquidity in all regions to effectively meet its operating needs.
As a result of the Tax Act, all previously net undistributed foreign earnings have now been subject to U.S. tax. The Company continues to evaluate which entities it will indefinitely reinvest earnings outside the U.S. The Company has provided deferred taxes for those entities whose earnings are not considered indefinitely reinvested. Accordingly, the Company has commenced repatriating a portion of its non-U.S. cash in these subsidiaries and will continue to repatriate certain of its offshore cash in a manner that addresses compliance with local statutory requirements, sufficient offshore working capital and any other factors that may be relevant in certain jurisdictions. Notwithstanding the Tax Act, which generally eliminated federal income tax on future cash repatriation to the U.S., cash repatriation may be subject to state and local taxes or withholding or similar taxes.
Other Material Future Cash Requirements
The Company believes that it has the financial resources needed to meet its cash requirements and expects to have positive operating cash flow in 2020. Cash requirements for periods beyond the next twelve months will depend, among other things, on the Company’s profitability and its ability to manage working capital requirements. The Company may also borrow from various sources.
The Company remains committed to using its strong cash flow to create value for shareholders by investing in growing areas of the business, reinvesting in ratings quality initiatives, making selective acquisitions, repurchasing stock and paying a dividend, all in a manner consistent with maintaining sufficient liquidity after giving effect to any additional indebtedness that may be incurred.
MOODY'S 2019 10-K 53
Dividends and Share Repurchases
On February 11, 2020, the Board approved the declaration of a quarterly dividend of $0.56 per share for Moody’s common stock, payable March 18, 2020 to shareholders of record at the close of business on February 25, 2020. The continued payment of dividends at this rate, or at all, is subject to the discretion of the Board.
In October 2018, the Board authorized a $1.0 billion share repurchase program, which at December 31, 2019 had a remaining authority of approximately $334 million. Additionally, in December 2019, the Board authorized an additional $1.0 billion share repurchase program, which may commence following the completion of the existing program.
Full-year 2020 total share repurchases are expected to be approximately $1.3 billion, subject to available cash, market conditions and other ongoing capital allocation decisions.
Other cash requirements
The Company has future cash requirements, including operating leases and debt service and payments, as noted in the tables that follow as well as future payments related to the transition tax under the Tax Act.
On February 13, 2020, the Company completed the acquisition of Regulatory Data Corporation for $700 million.
The Company anticipates making contributions of approximately $100 million to its funded U.S. pension plan in 2020.
Indebtedness
At December 31, 2019, Moody’s had $5.6 billion of outstanding debt and approximately $1 billion of additional capacity available under the Company’s CP program, which is backstopped by the 2018 Facility as more fully discussed in Note 19 to the consolidated financial statements. At December 31, 2019, the Company was in compliance with all covenants contained within all of the debt agreements. All of the Company’s long-term debt agreements contain cross default provisions which state that default under one of the aforementioned debt instruments could in turn permit lenders under other debt instruments to declare borrowings outstanding under those instruments to be immediately due and payable. At December 31, 2019, there were no such cross defaults.
During 2019, the Company issued €750 million in unsecured senior notes via a public offering, the terms of which are more fully discussed in Note 19. Additionally, the Company repaid the $500 million 2010 Senior Notes and the $450 million 2014 Senior Notes (5-year) in 2019.
The repayment schedule for the Company’s borrowings outstanding at December 31, 2019 is as follows:

For additional information on the Company's outstanding debt, refer to Note 19 to the consolidated financial statements.
Management may consider pursuing additional long-term financing when it is appropriate in light of cash requirements for operations, share repurchases and other strategic opportunities, which would result in higher financing costs.
Off-Balance Sheet Arrangements
At December 31, 2019, Moody’s did not have any relationships with unconsolidated entities or financial partnerships, such as entities often referred to as special purpose or variable interest entities where Moody’s is the primary beneficiary, which would have been established for the purpose of facilitating off-balance sheet arrangements or other contractually narrow or limited purposes. As such, Moody’s is not exposed to any financing, liquidity, market or credit risk that could arise if it had engaged in such relationships.
54 MOODY'S 2019 10-K
Contractual Obligations
The following table presents payments due under the Company’s contractual obligations as of December 31, 2019:
| Payments Due by Period | ||||||||||||||||||||||||||||||||||||||||||||||||||
| (in millions) | Total | Less Than 1 Year | 1-3 Years | 3-5 Years | Over 5 Years | |||||||||||||||||||||||||||||||||||||||||||||
| Indebtedness (1) | $ | 7,676 | $ | 175 | $ | 1,646 | $ | 1,251 | $ | 4,604 | ||||||||||||||||||||||||||||||||||||||||
| Operating lease obligations | 648 | 107 | 194 | 164 | 183 | |||||||||||||||||||||||||||||||||||||||||||||
| Purchase obligations | 127 | 96 | 31 | — | — | |||||||||||||||||||||||||||||||||||||||||||||
| Pension obligations (2) | 147 | 8 | 45 | 27 | 67 | |||||||||||||||||||||||||||||||||||||||||||||
| Total (3) | $ | 8,598 | $ | 386 | $ | 1,916 | $ | 1,442 | $ | 4,854 |
(1)Reflects principal payments, related interest and applicable fees due on all indebtedness outstanding as described in Note 19 to the consolidated financial statements.
(2)Reflects projected benefit payments relating to the Company’s U.S. unfunded DBPPs and Retirement and Other Plans described in Note 16 to the consolidated financial statements.
(3)The table above does not include the Company’s net long-term tax liabilities of $477 million relating to UTPs, since the expected cash outflow of such amounts by period cannot be reasonably estimated. Additionally, the table above does not include approximately $43 million relating to indemnification liability resulting from the divestiture of MAKS and approximately $51 million relating to the remaining unpaid deemed repatriation liability resulting from the Tax Act enacted into law in the U.S. in December 2017.
Non-GAAP Financial Measures:
In addition to its reported results, Moody’s has included in this MD&A certain adjusted results that the SEC defines as “non-GAAP financial measures.” Management believes that such non-GAAP financial measures, when read in conjunction with the Company’s reported results, can provide useful supplemental information for investors analyzing period to period comparisons of the Company’s performance, facilitate comparisons to competitors’ operating results and can provide greater transparency to investors of supplemental information used by management in its financial and operational decision-making. These non-GAAP measures, as defined by the Company, are not necessarily comparable to similarly defined measures of other companies. Furthermore, these non-GAAP measures should not be viewed in isolation or used as a substitute for other GAAP measures in assessing the operating performance or cash flows of the Company. Below are descriptions of the Company’s non-GAAP financial measures accompanied by a reconciliation of the non-GAAP measure to its most directly comparable GAAP measure:
Adjusted Operating Income and Adjusted Operating Margin:
The Company presents Adjusted Operating Income and Adjusted Operating Margin because management deems these metrics to be useful measures to provide additional perspective on the operating performance of Moody’s. Adjusted Operating Income excludes the impact of: i) restructuring charges; ii) depreciation and amortization; iii) Acquisition-Related Expenses; iv) a loss pursuant to the divestiture of MAKS; and v) a captive insurance company settlement. Restructuring charges are excluded as the frequency and magnitude of these charges may vary widely across periods and companies. Depreciation and amortization are excluded because companies utilize productive assets of different ages and use different methods of acquiring and depreciating productive assets. Acquisition-Related Expenses consist of expenses incurred to complete and integrate the acquisition of Bureau van Dijk and are excluded due to the material nature of these expenses (which are not expected to recur at this dollar magnitude) over the course of the multi-year integration effort. Acquisition-related expenses from other acquisitions were not material. The loss pursuant to the divestiture of MAKS is excluded as the frequency and magnitude of divestiture activity may vary widely from period to period and across companies. The captive insurance company settlement, which is more fully discussed in Note 22 to the consolidated financial statements, relates to the resolution of a matter that is not expected to recur in the future at this magnitude. Management believes that the exclusion of the aforementioned items, as detailed in the reconciliation below, allows for an additional perspective on the Company’s operating results from period to period and across companies. The Company defines Adjusted Operating Margin as Adjusted Operating Income divided by revenue.
| Year ended December 31, | |||||||||||||||||||||||
| 2019 | 2018 | ||||||||||||||||||||||
| Operating income | $ | 1,998 | $ | 1,868 | |||||||||||||||||||
| Adjustments: | |||||||||||||||||||||||
| Restructuring | 60 | 49 | |||||||||||||||||||||
| Depreciation and amortization | 200 | 192 | |||||||||||||||||||||
| Acquisition-Related Expenses | 3 | 8 | |||||||||||||||||||||
| Loss pursuant to the divestiture of MAKS | 14 | — | |||||||||||||||||||||
| Captive insurance company settlement | 16 | — | |||||||||||||||||||||
| Adjusted Operating Income | $ | 2,291 | $ | 2,117 | |||||||||||||||||||
| Operating margin | 41.4 | % | 42.0 | % | |||||||||||||||||||
| Adjusted Operating Margin | 47.4 | % | 47.6 | % |
MOODY'S 2019 10-K 55
Adjusted Net Income and Adjusted Diluted EPS attributable to Moody’s common shareholders:
The Company presents Adjusted Net Income and Adjusted Diluted EPS because management deems these metrics to be useful measures to provide additional perspective on the operating performance of Moody’s. Adjusted Net Income and Adjusted Diluted EPS exclude the impact of: i) amortization of acquired intangible assets; ii) Acquisition-Related Expenses; iii) restructuring charges; iv) a loss and tax charge pursuant to the divestiture of MAKS; and v) a captive insurance company settlement.
The Company excludes the impact of amortization of acquired intangible assets as companies utilize intangible assets with different ages and have different methods of acquiring and amortizing intangible assets. Furthermore, the timing and magnitude of business combination transactions are not predictable and the purchase price allocated to amortizable intangible assets and the related amortization period are unique to each acquisition and can vary significantly from period to period and across companies. Also, management believes that excluding acquisition-related amortization expense provides additional perspective when comparing operating results from period to period, and with both acquisitive and non-acquisitive peer companies. Additionally, Acquisition-Related Expenses consist of expenses incurred to complete and integrate the acquisition of Bureau van Dijk and are excluded due to the material nature of these expenses (which are not expected to recur at this dollar magnitude) over the course of the multi-year integration effort. Acquisition-related expenses from other acquisitions were not material. Restructuring charges are excluded as the frequency and magnitude of these charges may vary widely across periods and companies. The loss and tax charge pursuant to the divestiture of MAKS are excluded as the frequency and magnitude of divestiture activity may vary widely from period to period and across companies. The captive insurance company settlement, which is more fully discussed in Note 22 to the consolidated financial statements, relates to the resolution of a matter that is not expected to recur in the future at this magnitude.
Furthermore, the Company excluded the impact of 2018 adjustments pursuant to U.S. Tax Reform and certain adjustments relating to the Company’s non-U.S. UTPs, which resulted in significant adjustments to the provision for income taxes in the prior year. The Company excludes these items to provide additional perspective when comparing net income and diluted EPS from period to period and across companies as the frequency and magnitude of similar transactions may vary widely across periods.
| Year ended December 31, | |||||||||||||||||||||||||||||||||||||||||
| Amounts in millions | 2019 | 2018 | |||||||||||||||||||||||||||||||||||||||
| Net income attributable to Moody’s common shareholders | $ | 1,422 | $ | 1,310 | |||||||||||||||||||||||||||||||||||||
| Pre-Tax Acquisition-Related Expenses | $ | 3 | $ | 8 | |||||||||||||||||||||||||||||||||||||
| Tax on Acquisition-Related Expenses | — | (2) | |||||||||||||||||||||||||||||||||||||||
| Net Acquisition-Related Expenses | 3 | 6 | |||||||||||||||||||||||||||||||||||||||
| Pre-Tax Acquisition-Related Intangible Amortization Expenses | $ | 103 | $ | 102 | |||||||||||||||||||||||||||||||||||||
| Tax on Acquisition-Related Intangible Amortization Expenses | (24) | (23) | |||||||||||||||||||||||||||||||||||||||
| Net Acquisition-Related Intangible Amortization Expenses | 79 | 79 | |||||||||||||||||||||||||||||||||||||||
| Loss pursuant to the divestiture of MAKS | 14 | — | |||||||||||||||||||||||||||||||||||||||
| Tax charge pursuant to the divestiture of MAKS | 13 | — | |||||||||||||||||||||||||||||||||||||||
| Impact of U.S. tax reform | — | (59) | |||||||||||||||||||||||||||||||||||||||
| Increase to non-U.S. UTPs | — | 64 | |||||||||||||||||||||||||||||||||||||||
| Pre-Tax Restructuring | $ | 60 | $ | 49 | |||||||||||||||||||||||||||||||||||||
| Tax on Restructuring | (15) | (12) | |||||||||||||||||||||||||||||||||||||||
| Net Restructuring | 45 | 37 | |||||||||||||||||||||||||||||||||||||||
| Pre-tax captive insurance company settlement | $ | 16 | $ | — | |||||||||||||||||||||||||||||||||||||
| Tax on captive insurance company settlement | (4) | — | |||||||||||||||||||||||||||||||||||||||
| Net captive insurance company settlement | 12 | — | |||||||||||||||||||||||||||||||||||||||
| Adjusted Net Income | $ | 1,588 | $ | 1,437 |
56 MOODY'S 2019 10-K
Below is a reconciliation of this measure to its most directly comparable U.S. GAAP amount:
| Year ended December 31, | |||||||||||||||||||||||||||||||||||||||||||||||||||||
| 2019 | 2018 | ||||||||||||||||||||||||||||||||||||||||||||||||||||
| Diluted earnings per share attributable to Moody’s common shareholders | $ | 7.42 | $ | 6.74 | |||||||||||||||||||||||||||||||||||||||||||||||||
| Pre-Tax Acquisition-Related Expenses | $ | 0.02 | $ | 0.04 | |||||||||||||||||||||||||||||||||||||||||||||||||
| Tax on Acquisition-Related Expenses | — | (0.01) | |||||||||||||||||||||||||||||||||||||||||||||||||||
| Net Acquisition-Related Expenses | 0.02 | 0.03 | |||||||||||||||||||||||||||||||||||||||||||||||||||
| Pre-Tax Acquisition-Related Intangible Amortization Expenses | $ | 0.54 | $ | 0.52 | |||||||||||||||||||||||||||||||||||||||||||||||||
| Tax on Acquisition-Related Intangible Amortization Expenses | (0.12) | (0.12) | |||||||||||||||||||||||||||||||||||||||||||||||||||
| Net Acquisition-Related Intangible Amortization Expenses | 0.42 | 0.40 | |||||||||||||||||||||||||||||||||||||||||||||||||||
| Loss pursuant to the divestiture of MAKS | 0.07 | — | |||||||||||||||||||||||||||||||||||||||||||||||||||
| Tax charge pursuant to the divestiture of MAKS | 0.07 | — | |||||||||||||||||||||||||||||||||||||||||||||||||||
| Impact of U.S. tax reform | — | (0.30) | |||||||||||||||||||||||||||||||||||||||||||||||||||
| Increase to non-U.S. UTPs | — | 0.33 | |||||||||||||||||||||||||||||||||||||||||||||||||||
| Pre-Tax Restructuring | $ | 0.31 | $ | 0.25 | |||||||||||||||||||||||||||||||||||||||||||||||||
| Tax on Restructuring | (0.08) | (0.06) | |||||||||||||||||||||||||||||||||||||||||||||||||||
| Net Restructuring | 0.23 | 0.19 | |||||||||||||||||||||||||||||||||||||||||||||||||||
| Pre-tax captive insurance company settlement | $ | 0.08 | $ | — | |||||||||||||||||||||||||||||||||||||||||||||||||
| Tax on captive insurance company settlement | (0.02) | — | |||||||||||||||||||||||||||||||||||||||||||||||||||
| Net captive insurance company settlement | 0.06 | — | |||||||||||||||||||||||||||||||||||||||||||||||||||
| Adjusted Diluted EPS | $ | 8.29 | $ | 7.39 |
Note: the tax impacts in the table above were calculated using tax rates in effect in the jurisdiction for which the item relates.
Free Cash Flow:
The Company defines Free Cash Flow as net cash provided by operating activities minus payments for capital additions. Management believes that Free Cash Flow is a useful metric in assessing the Company’s cash flows to service debt, pay dividends and to fund acquisitions and share repurchases. Management deems capital expenditures essential to the Company’s product and service innovations and maintenance of Moody’s operational capabilities. Accordingly, capital expenditures are deemed to be a recurring use of Moody’s cash flow. Below is a reconciliation of the Company’s net cash flows from operating activities to Free Cash Flow:
| Year ended December 31, | |||||||||||||||||||||||
| 2019 | 2018 | ||||||||||||||||||||||
| Net cash provided by operating activities | $ | 1,675 | $ | 1,461 | |||||||||||||||||||
| Capital additions | (69) | (91) | |||||||||||||||||||||
| Free Cash Flow | $ | 1,606 | $ | 1,370 | |||||||||||||||||||
| Net cash provided by (used in) investing activities | $ | 36 | $ | (406) | |||||||||||||||||||
| Net cash used in financing activities | $ | (1,563) | $ | (412) |
MOODY'S 2019 10-K 57
Organic Revenue:
The Company presents the organic revenue and growth because management deems this metric to be a useful measure which provides additional perspective in assessing the revenue growth excluding the inorganic revenue impacts from certain acquisitions and divestiture activity. The following table details the periods excluded from each acquisition/divestiture to determine organic revenue.
| Acquisition/Divestiture | Period excluded to determine organic revenue growth | |||||||
| Omega Performance | January 1, 2019 - August 16, 2019 | |||||||
| Reis | January 1, 2019 - October 14, 2019 | |||||||
| RiskFirst | July 25, 2019 - December 31, 2019 | |||||||
| ABS Suite | October 1, 2019 - December 31, 2019 | |||||||
| MAKS | November 8, 2018 - December 31, 2018 |
Below is a reconciliation of the Company's organic dollar revenue and growth rates:
| Year Ended December 31, | |||||||||||||||||||||||||||||||||||||||||||||||
| Amounts in millions | 2019 | 2018 | Change | Growth | |||||||||||||||||||||||||||||||||||||||||||
| MA revenue | $ | 1,954 | $ | 1,731 | $ | 223 | 13% | ||||||||||||||||||||||||||||||||||||||||
| Omega Performance revenue | (5) | — | (5) | ||||||||||||||||||||||||||||||||||||||||||||
| Reis revenue | (28) | — | (28) | ||||||||||||||||||||||||||||||||||||||||||||
| RiskFirst revenue | (7) | — | (7) | ||||||||||||||||||||||||||||||||||||||||||||
| ABS Suite revenue | (2) | — | (2) | ||||||||||||||||||||||||||||||||||||||||||||
| MAKS revenue | — | (16) | 16 | ||||||||||||||||||||||||||||||||||||||||||||
| Organic MA revenue | $ | 1,912 | $ | 1,715 | $ | 197 | 11% | ||||||||||||||||||||||||||||||||||||||||
| Year Ended December 31, | |||||||||||||||||||||||||||||||||||||||||||||||
| Amounts in millions | 2019 | 2018 | Change | Growth | |||||||||||||||||||||||||||||||||||||||||||
| RD&A revenue | $ | 1,273 | $ | 1,121 | $ | 152 | 14% | ||||||||||||||||||||||||||||||||||||||||
| Reis revenue | (28) | — | (28) | ||||||||||||||||||||||||||||||||||||||||||||
| ABS Suite revenue | (2) | — | (2) | ||||||||||||||||||||||||||||||||||||||||||||
| Organic RD&A revenue | $ | 1,243 | $ | 1,121 | $ | 122 | 11% | ||||||||||||||||||||||||||||||||||||||||
| Year Ended December 31, | |||||||||||||||||||||||||||||||||||||||||||||||
| Amounts in millions | 2019 | 2018 | Change | Growth | |||||||||||||||||||||||||||||||||||||||||||
| ERS revenue | $ | 522 | $ | 451 | $ | 71 | 16% | ||||||||||||||||||||||||||||||||||||||||
| RiskFirst revenue | (7) | — | (7) | ||||||||||||||||||||||||||||||||||||||||||||
| Organic ERS revenue | $ | 515 | $ | 451 | $ | 64 | 14% | ||||||||||||||||||||||||||||||||||||||||
| Year Ended December 31, | |||||||||||||||||||||||||||||||||||||||||||||||
| Amounts in millions | 2019 | 2018 | Change | Growth | |||||||||||||||||||||||||||||||||||||||||||
| PS revenue | $ | 159 | $ | 159 | $ | — | —% | ||||||||||||||||||||||||||||||||||||||||
| Omega Performance revenue | (5) | — | (5) | ||||||||||||||||||||||||||||||||||||||||||||
| MAKS revenue | — | (16) | 16 | ||||||||||||||||||||||||||||||||||||||||||||
| Organic PS revenue | $ | 154 | $ | 143 | $ | 11 | 8% |
Recently Issued Accounting Pronouncements
Refer to Note 2 to the consolidated financial statements located in Part II, Item 8 on this Form 10-K for a discussion on the impact to the Company relating to recently issued accounting pronouncements.
58 MOODY'S 2019 10-K
CONTINGENCIES
For information regarding legal proceedings, see Part II, Item 8 – “Financial Statements”, Note 22 “Contingencies” in this Form 10-K.
Forward-Looking Statements
Certain statements contained in this annual report on Form 10-K are forward-looking statements and are based on future expectations, plans and prospects for the Company’s business and operations that involve a number of risks and uncertainties. Such statements involve estimates, projections, goals, forecasts, assumptions and uncertainties that could cause actual results or outcomes to differ materially from those contemplated, expressed, projected, anticipated or implied in the forward-looking statements. Those statements appear at various places throughout this annual report on Form 10-K, including in the sections entitled “Contingencies” under Item 7, “MD&A”, commencing on page 31 of this annual report on Form 10-K, under “Legal Proceedings” in Part I, Item 3, of this Form 10-K, and elsewhere in the context of statements containing the words “believe”, “expect”, “anticipate”, “intend”, “plan”, “will”, “predict”, “potential”, “continue”, “strategy”, “aspire”, “target”, “forecast”, “project”, “estimate”, “should”, “could”, “may” and similar expressions or words and variations thereof relating to the Company’s views on future events, trends and contingencies or otherwise convey the prospective nature of events or outcomes generally indicative of forward-looking statements. Stockholders and investors are cautioned not to place undue reliance on these forward-looking statements. The forward-looking statements and other information are made as of the date of this annual report on Form 10-K, and the Company undertakes no obligation (nor does it intend) to publicly supplement, update or revise such statements on a going-forward basis, whether as a result of subsequent developments, changed expectations or otherwise, except as required by applicable law or regulation. In connection with the “safe harbor” provisions of the Private Securities Litigation Reform Act of 1995, the Company is identifying examples of factors, risks and uncertainties that could cause actual results to differ, perhaps materially, from those indicated by these forward-looking statements.
Those factors, risks and uncertainties include, but are not limited to, credit market disruptions or economic slowdowns, which could affect the volume of debt and other securities issued in domestic and/or global capital markets; other matters that could affect the volume of debt and other securities issued in domestic and/or global capital markets, including regulation, credit quality concerns, changes in interest rates and other volatility in the financial markets such as that due to uncertainty as companies transition away from LIBOR and Brexit; the level of merger and acquisition activity in the U.S. and abroad; the uncertain effectiveness and possible collateral consequences of U.S. and foreign government actions affecting credit markets, international trade and economic policy, including those related to tariffs and trade barriers; concerns in the marketplace affecting our credibility or otherwise affecting market perceptions of the integrity or utility of independent credit agency ratings; the introduction of competing products or technologies by other companies; pricing pressure from competitors and/or customers; the level of success of new product development and global expansion; the impact of regulation as an NRSRO, the potential for new U.S., state and local legislation and regulations, including provisions in the Financial Reform Act and regulations resulting from that Act; the potential for increased competition and regulation in the EU and other foreign jurisdictions; exposure to litigation related to our rating opinions, as well as any other litigation, government and regulatory proceedings, investigations and inquires to which the Company may be subject from time to time; provisions in the Financial Reform Act legislation modifying the pleading standards, and EU regulations modifying the liability standards, applicable to credit rating agencies in a manner adverse to credit rating agencies; provisions of EU regulations imposing additional procedural and substantive requirements on the pricing of services and the expansion of supervisory remit to include non-EU ratings used for regulatory purposes; the possible loss of key employees; failures or malfunctions of our operations and infrastructure; any vulnerabilities to cyber threats or other cybersecurity concerns; the outcome of any review by controlling tax authorities of the Company’s global tax planning initiatives; exposure to potential criminal sanctions or civil remedies if the Company fails to comply with foreign and U.S. laws and regulations that are applicable in the jurisdictions in which the Company operates, including data protection and privacy laws, sanctions laws, anti-corruption laws, and local laws prohibiting corrupt payments to government officials; the impact of mergers, acquisitions or other business combinations and the ability of the Company to successfully integrate such acquired businesses; currency and foreign exchange volatility; the level of future cash flows; the levels of capital investments; and a decline in the demand for credit risk management tools by financial institutions. These factors, risks and uncertainties as well as other risks and uncertainties that could cause Moody’s actual results to differ materially from those contemplated, expressed, projected, anticipated or implied in the forward-looking statements are described in greater detail under “Risk Factors” in Part I, Item 1A of the Company’s annual report on Form 10-K for the year ended December 31, 2019, and in other filings made by the Company from time to time with the SEC or in materials incorporated herein or therein. Stockholders and investors are cautioned that the occurrence of any of these factors, risks and uncertainties may cause the Company’s actual results to differ materially from those contemplated, expressed, projected, anticipated or implied in the forward-looking statements, which could have a material and adverse effect on the Company’s business, results of operations and financial condition. New factors may emerge from time to time, and it is not possible for the Company to predict new factors, nor can the Company assess the potential effect of any new factors on it.
Previous: Item 6. SELECTED FINANCIAL DATA · Next: Item 7A. QUANTITATIVE AND QUALITATIVE DISCLOSURES ABOUT MARKET RISK