 filings.tools
Item 2. MANAGEMENT’S DISCUSSION AND ANALYSIS OF FINANCIAL CONDITION AND RESULTS OF OPERATIONS
104K characters. Original on sec.gov · Markdown
Item 2. MANAGEMENT’S DISCUSSION AND ANALYSIS OF FINANCIAL CONDITION AND RESULTS OF OPERATIONS
This section should also be read in conjunction with the unaudited consolidated financial statements and accompanying footnotes included under Item 1. Financial Statements and in conjunction with our Annual Report on Form 10-K for the year ended December 31, 2020.
DISCLOSURES REGARDING FORWARD-LOOKING STATEMENTS
This Quarterly Report on Form 10-Q, particularly Management’s Discussion and Analysis of Financial Condition and Results of Operations and Quantitative and Qualitative Disclosures about Market Risk, includes forward-looking statements that are subject to risks, contingencies or uncertainties. You can identify forward-looking statements by words such as “anticipate,” “believe,” “commitment,” “could,” “design,” “estimate,” “expect,” “forecast,” “goal,” “guidance,” “imply,” “intend,” “may,” “objective,” “opportunity,” “outlook,” “plan,” “policy,” “position,” “potential,” “predict,” “priority,” “project,” “proposition,” “prospective,” “pursue,” “seek,” “should,” “strategy,” “target,” “will,” “would” or other similar expressions that convey the uncertainty of future events or outcomes.
Forward-looking statements include, among other things, statements regarding:
-
future financial and operating results;
-
environmental, social and governance (“ESG”) goals and targets, including those related to greenhouse gas emissions, diversity and inclusion and ESG reporting;
-
our plans to achieve our ESG goals and targets and to monitor and report progress thereon;
-
future levels of capital, environmental or maintenance expenditures, general and administrative and other expenses;
-
expected savings from the restructuring or reorganization of business components;
-
the success or timing of completion of ongoing or anticipated projects or transactions;
-
business strategies, growth opportunities and expected investments;
-
consumer demand for refined products, natural gas and NGLs;
-
the timing and amount of any future common stock repurchases or dividends; and
-
the anticipated effects of actions of third parties such as competitors, activist investors, federal, foreign, state or local regulatory authorities, or plaintiffs in litigation.
Our forward-looking statements are not guarantees of future performance, and you should not rely unduly on them, as they involve risks, uncertainties and assumptions. Material differences between actual results and any future performance suggested in our forward-looking statements could result from a variety of factors, including the following:
-
general economic, political or regulatory developments, including inflation, changes in governmental policies relating to refined petroleum products, crude oil, natural gas or NGLs, or taxation;
-
the magnitude, duration and extent of future resurgences of the COVID-19 pandemic and its effects, including travel restrictions, business and school closures, increased remote work, stay-at-home orders and other actions taken by individuals, governments and the private sector to stem the spread of the virus;
-
our ability to realize the expected benefits of the Speedway sale within the expected timeframe or at all;
-
further impairments;
-
the regional, national and worldwide availability and pricing of refined products, crude oil, natural gas, NGLs and other feedstocks;
-
disruptions in credit markets or changes to credit ratings;
-
the adequacy of capital resources and liquidity, including availability, timing and amounts of free cash flow necessary to execute business plans and to effect any share repurchases or to maintain or increase the dividend;
-
the potential effects of judicial or other proceedings on the business, financial condition, results of operations and cash flows;
-
continued or further volatility in and degradation of general economic, market, industry or business conditions as a result of the COVID-19 pandemic, other infectious disease outbreaks, natural hazards, extreme weather events or otherwise;
-
compliance with federal and state environmental, economic, health and safety, energy and other policies and regulations and enforcement actions initiated thereunder;
-
adverse market conditions or other risks affecting MPLX;
-
refining industry overcapacity or under capacity;
-
changes in producer customers’ drilling plans or in volumes of throughput of crude oil, natural gas, NGLs, refined products or other hydrocarbon-based products;
-
non-payment or non-performance by our customers;
-
changes in the cost or availability of third-party vessels, pipelines, railcars and other means of transportation for crude oil, natural gas, NGLs, feedstocks and refined products;
-
the price, availability and acceptance of alternative fuels and alternative-fuel vehicles and laws mandating such fuels or vehicles;
-
political and economic conditions in nations that consume refined products, natural gas and NGLs, including the United States and Mexico, and in crude oil producing regions, including the Middle East, Africa, Canada and South America;
-
actions taken by our competitors, including pricing adjustments, the expansion and retirement of refining capacity and the expansion and retirement of pipeline capacity, processing, fractionation and treating facilities in response to market conditions;
-
completion of pipeline projects within the United States;
-
changes in fuel and utility costs for our facilities;
-
accidents or other unscheduled shutdowns affecting our refineries, machinery, pipelines, processing, fractionation and treating facilities or equipment, means of transportation, or those of our suppliers or customers;
-
acts of war, terrorism or civil unrest that could impair our ability to produce refined products, receive feedstocks or to gather, process, fractionate or transport crude oil, natural gas, NGLs or refined products;
-
political pressure and influence of environmental groups and other stakeholders upon policies and decisions related to the production, gathering, refining, processing, fractionation, transportation and marketing of crude oil or other feedstocks, refined products, natural gas, NGLs or other hydrocarbon-based products;
-
labor and material shortages;
-
the costs, disruption and diversion of management’s attention associated with campaigns commenced by activist investors; and
-
personnel changes.
For additional risk factors affecting our business, see the risk factors described in our Annual Report on Form 10-K for the year ended December 31, 2020. We undertake no obligation to update any forward-looking statements except to the extent required by applicable law.
EXECUTIVE SUMMARY
Business Update
Through the first nine months of 2021, while demand remains below historical levels, we continue to see recovery in the environment in which our business operates, albeit in some markets and regions more or less than others. The increased availability of vaccinations and the reductions in travel and business restrictions appear to be driving increased economic activity, including the opening of many businesses and schools as well as more in-person interaction broadly. While we have seen improving results through the first nine months of 2021, we are unable to predict the potential effects that further resurgences of COVID-19 may have on our financial position and results.
The outbreak of COVID-19 and its development into a pandemic in March 2020 resulted in significant economic disruption globally. Actions taken by various governmental authorities, individuals and companies around the world to prevent the spread of COVID-19 through social distancing restricted travel, many business operations, public gatherings and the overall level of individual movement and in-person interaction across the globe resulted in dramatic reductions in airline flights and motor vehicle use in 2020 as compared to prior to the pandemic.
In response to this business environment, we continue to focus on three near-term priorities for our businesses:
Strengthen Competitive Position of Assets
We are committed to positioning our assets so that we are a leader in operational, financial, and sustainability performance and are evaluating the strength and fit of assets in our portfolio. Our goal is that each individual asset generates free-cash-flow back to the business and contributes to shareholder returns. With our investments we are focused on high returning projects that we believe will enhance the competitiveness of our portfolio, including our investments in sustainable fuels and technologies that lower our carbon intensity as the global energy mix evolves.
Improve Commercial Performance
We are focused on leveraging advantaged raw material selection, new approaches in the commercial space to be more dynamic amidst changing market conditions and achieving technology improvements to advance our commercial performance.
Lower Cost Structure
We are committed to achieving operational excellence by reducing costs, improving efficiency and driving operational improvements. In response to the pandemic, in March of 2020, we committed to immediately reducing our capital spending and operating expenses. In 2021, we are continuing this focus with planned reductions of over $200 million for our capital
expenditures and investments as compared to 2020 (excluding capitalized interest, potential acquisitions and MPLX’s capital investment plan).
In connection with our commitment to lower cost and strengthen the competitive position of our assets, in the third quarter of 2020 we announced strategic actions to lay a foundation for long-term success, including plans to optimize our assets and structurally lower costs in 2021 and beyond. These actions included indefinitely idling the Gallup refinery, initiating actions to strategically reposition the Martinez refinery to a renewable diesel facility and the approval of an involuntary workforce reduction plan. Our results in the first nine months of 2021 reflect the favorable effects from these cost reduction actions.
Many uncertainties remain with respect to COVID-19 and we are unable to predict the ultimate economic impacts from COVID-19 and how quickly the U.S. and economies around the world can recover once the pandemic ultimately subsides. However, the adverse impact of the economic effects on MPC have been and may continue to be significant.
Strategic Updates
On August 19, 2021, we announced an agreement to form a joint venture with Archer-Daniels-Midland Company (“ADM”) for the production of soybean oil to supply rapidly growing demand for renewable diesel fuel. Under the terms of the agreement, the joint venture will own and operate ADM’s previously announced soybean processing complex in Spiritwood, North Dakota, with ADM owning 75 percent of the joint venture and MPC owning 25 percent. When complete in 2023, the Spiritwood facility will source and process local soybeans and supply the resulting soybean oil exclusively to MPC. The Spiritwood complex is expected to produce approximately 600 million pounds of refined soybean oil annually, enough feedstock for approximately 75 million gallons of renewable diesel per year.
On May 14, 2021, we completed the sale of Speedway, our company-owned and operated retail transportation fuel and convenience store business, to 7-Eleven for cash proceeds of $21.38 billion. This transaction resulted in a pretax gain of $11.68 billion ($8.02 billion after income taxes) after deducting the book value of the net assets and certain other adjustments. MPC remains committed to executing its plan to use the proceeds from the sale to strengthen the balance sheet and return capital to shareholders.
In connection with the Speedway sale, our board of directors approved an additional $7.1 billion share repurchase authorization bringing total share repurchase authorizations to $10.0 billion prior to the June tender offer discussed below.
-
During the third quarter of 2021, MPC repurchased approximately 16 million shares of its common stock and paid $928 million of cash, with an additional $50 million of cash paid in early October in connection with the settlement of certain late September repurchases. As of September 30, 2021, MPC has $8.04 billion remaining under its share repurchase authorizations.
-
During the second quarter of 2021, MPC completed a modified Dutch auction tender offer, purchasing 15,573,365 shares of its common stock at a purchase price of $63.00 per share, for an aggregate purchase price of approximately $981 million, excluding fees and expenses related to the tender offer.
During the first nine months of 2021, we utilized a portion of the Speedway sale proceeds to structurally reduce debt through the following actions:
-
MPC intends to redeem of all of the $1.25 billion outstanding aggregate principal amount of MPC's 4.5% senior notes due May 1, 2023 and the $850 million outstanding aggregate principal amount of MPC’s 4.75% senior notes due December 15, 2023, including the portion of such notes for which Andeavor LLC, a wholly-owned subsidiary of MPC, is the obligor. The notes are expected to be redeemed on December 2, 2021, at a price equal to par, plus a make-whole premium calculated in accordance with the terms of the senior notes and accrued and unpaid interest to, but not including, the redemption date. MPC expects to fund the redemption amount with cash on hand.
-
In June of 2021,we redeemed all of the $300 million outstanding aggregate principal amount of 5.125% senior notes due April 2024.
-
In May of 2021, we repaid all outstanding commercial paper borrowings, which along with cash had been used to finance the fourth quarter 2020 repayments of two senior notes with total principal of $1.13 billion.
-
On March 1, 2021, we repaid the $1.0 billion outstanding aggregate principal amount of 5.125% senior notes due March 2021.
On February 24, 2021, MPC’s board of directors approved our plan to strategically reposition the Martinez refinery to a renewable diesel facility. Converting the Martinez facility from refining petroleum to manufacturing renewable fuels signals our strong commitment to producing a substantial level of lower carbon-intensity fuels in California. As envisioned, the Martinez facility would start producing approximately 260 million gallons per year of renewable diesel by the second half of 2022, with pretreatment capabilities coming online in 2023. The facility is expected to be capable of producing approximately 730 million gallons per year by the end of 2023.
The Dickinson, North Dakota, renewable fuels facility began operations at the end of 2020 and reached full design operating capacity in the second quarter of 2021. The facility has the capacity to produce 184 million gallons per year of renewable diesel from corn oil, soybean oil, fats, and greases. The produced renewable diesel generates federal RINs and Low Carbon Fuel Standard (“LCFS”) credits when sold in California or similar markets. These instruments are used to help meet our Renewable Fuel Standard and LCFS compliance obligations as a petroleum fuel producer.
Results
Select results for continuing operations are reflected in the following table.
| Three Months Ended September 30, | Nine Months Ended September 30, | |||||||||||||||||||||||||
| (In millions) | 2021 | 2020 | 2021 | 2020 | ||||||||||||||||||||||
| Income (loss) from continuing operations by segment | ||||||||||||||||||||||||||
| Refining & Marketing | $ | 509 | $ | (1,569) | $ | 135 | $ | (3,610) | ||||||||||||||||||
| Midstream | 1,042 | 960 | 2,991 | 2,734 | ||||||||||||||||||||||
| Corporate | (186) | (197) | (523) | (625) | ||||||||||||||||||||||
| Items not allocated to segments: | ||||||||||||||||||||||||||
| LCM inventory valuation adjustment | — | 530 | — | (1,185) | ||||||||||||||||||||||
| Impairment and idling expenses(a) | (25) | (433) | (81) | (9,595) | ||||||||||||||||||||||
| Restructuring expense | — | (348) | — | (348) | ||||||||||||||||||||||
| Transaction-related costs(b) | — | — | — | (8) | ||||||||||||||||||||||
| Income (loss) from continuing operations | 1,340 | (1,057) | 2,522 | (12,637) | ||||||||||||||||||||||
| Net interest and other financial costs | 328 | 359 | 1,053 | 1,032 | ||||||||||||||||||||||
| Income (loss) from continuing operations before income taxes | 1,012 | (1,416) | 1,469 | (13,669) | ||||||||||||||||||||||
| Provision (benefit) for income taxes on continuing operations | (18) | (436) | 21 | (2,237) | ||||||||||||||||||||||
| Income (loss) from continuing operations, net of tax | $ | 1,030 | $ | (980) | $ | 1,448 | $ | (11,432) |
(a) 2021 includes impairments of equity method investments and long-lived assets and charges incurred to idle certain assets. 2020 includes impairment of goodwill, equity method investments and long lived assets.
(b) 2020 includes costs incurred in connection with the Midstream strategic review.
Select results for discontinued operations are reflected in the following table.
| Three Months Ended September 30, | Nine Months Ended September 30, | |||||||||||||||||||||||||
| (In millions) | 2021 | 2020 | 2021 | 2020 | ||||||||||||||||||||||
| Income from discontinued operations | ||||||||||||||||||||||||||
| Speedway | $ | — | $ | 456 | $ | 613 | $ | 1,282 | ||||||||||||||||||
| LCM inventory valuation adjustment | — | — | — | (25) | ||||||||||||||||||||||
| Gain on sale of assets | — | — | 11,682 | — | ||||||||||||||||||||||
| Transaction-related costs(a) | — | (18) | (46) | (75) | ||||||||||||||||||||||
| Income from discontinued operations | — | 438 | 12,249 | 1,182 | ||||||||||||||||||||||
| Net interest and other financial costs | — | 5 | 6 | 15 | ||||||||||||||||||||||
| Income from discontinued operations before income taxes | — | 433 | 12,243 | 1,167 | ||||||||||||||||||||||
| Provision for income taxes on discontinued operations | — | 62 | 3,795 | 286 | ||||||||||||||||||||||
| Income from discontinued operations, net of tax | $ | — | $ | 371 | $ | 8,448 | $ | 881 |
(a) Costs related to the Speedway separation.
The following table includes net income (loss) per diluted share data.
| Three Months Ended September 30, | Nine Months Ended September 30, | |||||||||||||||||||||||||
| 2021 | 2020 | 2021 | 2020 | |||||||||||||||||||||||
| Net income (loss) per diluted share | ||||||||||||||||||||||||||
| Continuing operations | $ | 1.09 | $ | (1.93) | $ | 0.79 | $ | (16.93) | ||||||||||||||||||
| Discontinued operations | — | 0.57 | 13.02 | 1.35 | ||||||||||||||||||||||
| Net income (loss) attributable to MPC | $ | 1.09 | $ | (1.36) | $ | 13.81 | $ | (15.58) |
Net income (loss) attributable to MPC was $694 million, or $1.09 per diluted share, in the third quarter of 2021 compared to $(886) million, or $(1.36) per diluted share, for the third quarter of 2020 and $8.96 billion, or $13.81 per diluted share, in the first nine months of 2021 compared to $(10.11) billion, or $(15.58) per diluted share, in the first nine months of 2020.
For the third quarter of 2021, the change was largely due to increases in average refined product sales prices and volumes and the absence of impairment and restructuring expenses recognized in the third quarter of 2020, partially offset by the absence of both an LCM benefit recognized and income from discontinued operations, due to the sale of the Speedway business on May 14, 2021, in the third quarter of 2020.
For the first nine months of 2021, the change is primarily due to the gain on the sale of Speedway, the absence of impairment expenses and an LCM inventory charge in the first nine months of 2020 and increases in average refined product sales prices and volumes, partially offset by a partial period of income from discontinued operations due to the sale of the Speedway business on May 14, 2021.
See Note 4 to the unaudited consolidated financial statements for additional information on discontinued operations.
Refer to the Results of Operations section for a discussion of consolidated financial results and segment results for the third quarter of 2021 as compared to the third quarter of 2020 and the first nine months of 2021 compared to the first nine months of 2020.
MPLX
We owned approximately 647 million MPLX common units at September 30, 2021 with a market value of $18.43 billion based on the September 30, 2021 closing price of $28.47 per common unit.
On November 2, 2021, MPLX declared a cash distribution for the third quarter of 2021, totaling $1.31 billion, or $1.28 per common unit, consisting of a base quarterly distribution amount of $0.7050 per common unit and a special distribution amount of $0.5750 per common unit. This distribution will be paid on November 19, 2021 to common unitholders of record on November 12, 2021. MPC’s portion of this distribution is approximately $829 million.
We received limited partner distributions of $1.34 billion from MPLX in the nine months ended September 30, 2021 and $1.35 billion in the nine months ended September 30, 2020.
During the nine months ended September 30, 2021, MPLX repurchased 17,563,855 MPLX common units at an average cost per unit of $26.79 and paid $465 million of cash, with an additional $5 million of cash paid in early October in connection with the settlement of certain late September repurchases. As of September 30, 2021, $497 million remained available under the authorization for future unit repurchases.
See Note 5 to the unaudited consolidated financial statements for additional information on MPLX.
Liquidity
Our liquidity, excluding MPLX, totaled $18.29 billion at September 30, 2021 consisting of:
| September 30, 2021 | ||||||||||||||||||||
| (In millions) | Total Capacity | Outstanding Borrowings | Available Capacity | |||||||||||||||||
| Bank revolving credit facility(a) | $ | 5,000 | $ | 1 | $ | 4,999 | ||||||||||||||
| Trade receivables facility | 100 | — | 100 | |||||||||||||||||
| Total | $ | 5,100 | $ | 1 | $ | 5,099 | ||||||||||||||
| Cash and cash equivalents and short-term investments(b) | 13,187 | |||||||||||||||||||
| Total liquidity | $ | 18,286 |
(a)Outstanding borrowings include $1 million in letters of credit outstanding under this facility.
(b)Excludes cash and cash equivalents of MPLX of $39 million.
On September 30, 2021, we entered into a new trade receivables securitization agreement with a lender, which provides for a $100 million trade receivables securitization facility. This facility replaces a similar facility that expired on July 16, 2021.
As of September 30, 2021, $1.61 billion is recorded as an income tax receivable in other current assets, $388 million was utilized to offset our third quarter cash tax payment obligation to the IRS, and $302 million has been recorded as an offset to our accrued taxes due in the fourth quarter of 2021. Additionally, on October 8, 2021, MPC received $1.55 billion of the refund from the IRS and expects to receive the remaining income tax receivable of $59 million in the first half of 2022.
MPLX’s liquidity totaled $3.67 billion at September 30, 2021. As of September 30, 2021, MPLX had cash and cash equivalents of $39 million, $3.5 billion available under its $3.5 billion revolving credit agreement and $130 million available through its intercompany loan agreement with MPC.
OVERVIEW OF SEGMENTS
Refining & Marketing
Refining & Marketing segment income from operations depends largely on our refinery throughputs, Refining & Marketing margin, refining operating costs, refining planned turnarounds, distribution costs, and depreciation expenses.
Refining & Marketing margin is the difference between the prices of refined products sold and the costs of crude oil and other charge and blendstocks refined, including the costs to transport these inputs to our refineries and the costs of products purchased for resale. The crack spread is a measure of the difference between market prices for refined products and crude oil, commonly used by the industry as a proxy for the refining margin. Crack spreads can fluctuate significantly, particularly when prices of refined products do not move in the same direction as the cost of crude oil. As a performance benchmark and a comparison with other industry participants, we calculate Gulf Coast, Mid-Continent and West Coast crack spreads that we believe most closely track our operations and slate of products. The following are used for these crack spread calculations:
-
The Gulf Coast crack spread uses three barrels of MEH crude producing two barrels of USGC CBOB gasoline and one barrel of USGC ULSD. In the first quarter of 2021, we transitioned to MEH crude from LLS crude;
-
The Mid-Continent crack spread uses three barrels of WTI crude producing two barrels of Chicago CBOB gasoline and one barrel of Chicago ULSD; and
-
The West Coast crack spread uses three barrels of ANS crude producing two barrels of LA CARBOB and one barrel of LA CARB Diesel.
Our refineries can process significant amounts of sweet and sour crude oil, which typically can be purchased at a discount to crude oil referenced in our Gulf Coast, Mid-Continent and West Coast crack spreads. The amount of these discounts, which we refer to as the sweet differential and sour differential, can vary significantly, causing our Refining & Marketing margin to differ from blended crack spreads. In general, larger sweet and sour differentials will enhance our Refining & Marketing margin.
Future crude oil differentials will be dependent on a variety of market and economic factors, as well as U.S. energy policy.
The following table provides sensitivities showing an estimated change in annual net income due to potential changes in market conditions.
| (In millions, after-tax) | ||||||||
| Blended crack spread sensitivity(a) (per $1.00/barrel change) | $ | 838 | ||||||
| Sour differential sensitivity(b) (per $1.00/barrel change) | 396 | |||||||
| Sweet differential sensitivity(c) (per $1.00/barrel change) | 381 | |||||||
| Natural gas price sensitivity(d) (per $1.00/MMBtu) | 275 |
(a)Crack spread based on 40 percent MEH, 40 percent WTI and 20 percent ANS with Gulf Coast, Mid-Continent and West Coast product pricing, respectively, and assumes all other differentials and pricing relationships remain unchanged.
(b)Sour crude oil basket consists of the following crudes: ANS, Argus Sour Crude Index, Maya and Western Canadian Select. We expect approximately 51 percent of the crude processed at our refineries in 2021 will be sour crude.
(c)Sweet crude oil basket consists of the following crudes: Bakken, Brent, MEH, WTI-Cushing and WTI-Midland. We expect approximately 49 percent of the crude processed at our refineries in 2021 will be sweet crude.
(d)This is consumption-based exposure for our Refining & Marketing segment and does not include the sales exposure for our Midstream segment.
In addition to the market changes indicated by the crack spreads, the sour differential and the sweet differential, our Refining & Marketing margin is impacted by factors such as:
-
the selling prices realized for refined products;
-
the types of crude oil and other charge and blendstocks processed;
-
our refinery yields;
-
the cost of products purchased for resale;
-
the impact of commodity derivative instruments used to hedge price risk;
-
the potential impact of LCM adjustments to inventories in periods of declining prices; and
-
the potential impact of LIFO liquidation charges due to draw-downs from historic inventory levels.
Refining & Marketing segment income from operations is also affected by changes in refinery operating costs and refining planned turnaround costs in addition to committed distribution costs. Changes in operating costs are primarily driven by the cost of energy used by our refineries, including purchased natural gas, and the level of maintenance costs. Refining planned turnarounds, requiring temporary shutdown of certain refinery operating units, are periodically performed at each refinery. Distribution costs primarily include long-term agreements with MPLX, which as discussed below include minimum commitments to MPLX, and will negatively impact income from operations in periods when throughput or sales are lower or refineries are idled.
We have various long-term, fee-based commercial agreements with MPLX. Under these agreements, MPLX, which is reported in our Midstream segment, provides transportation, storage, distribution and marketing services to our Refining & Marketing segment. Certain of these agreements include commitments for minimum quarterly throughput and distribution volumes of crude oil and refined products and minimum storage volumes of crude oil, refined products and other products. Certain other agreements include commitments to pay for 100 percent of available capacity for certain marine transportation and refining logistics assets.
Midstream
Our Midstream segment transports, stores, distributes and markets crude oil and refined products, principally for our Refining & Marketing segment. The profitability of our pipeline transportation operations primarily depends on tariff rates and the volumes shipped through the pipelines. The profitability of our marine operations primarily depends on the quantity and availability of our vessels and barges. The profitability of our light product terminal operations primarily depends on the throughput volumes at these terminals. The profitability of our fuels distribution services primarily depends on the sales volumes of certain refined products. The profitability of our refining logistics operations depends on the quantity and availability of our refining logistics assets. A majority of the crude oil and refined product shipments on our pipelines and marine vessels and the refined product throughput at our terminals serve our Refining & Marketing segment and our refining logistics assets and fuels distribution services are used solely by our Refining & Marketing segment. As discussed above in the Refining & Marketing section, MPLX, which is reported in our Midstream segment, has various long-term, fee-based commercial agreements related to services provided to our Refining & Marketing segment. Under these agreements, MPLX has received various commitments of minimum throughput, storage and distribution volumes as well as commitments to pay for all available capacity of certain assets. The volume of crude oil that we transport is directly affected by the supply of, and refiner demand for, crude oil in the markets served directly by our crude oil pipelines, terminals and marine operations. Key factors in this supply and demand balance are the production levels of crude oil by producers in various regions or fields, the availability and cost of alternative modes of transportation, the volumes of crude oil processed at refineries and refinery and transportation system maintenance levels. The volume of refined products that we transport, store, distribute and market is directly affected by the production levels of, and user demand for, refined products in the markets served by our refined product pipelines and marine operations. In most of our markets, demand for gasoline and distillate peaks during the summer driving season, which extends from May through
September of each year, and declines during the fall and winter months. As with crude oil, other transportation alternatives and system maintenance levels influence refined product movements.
Our Midstream segment also gathers and processes natural gas and NGLs. NGL and natural gas prices are volatile and are impacted by changes in fundamental supply and demand, as well as market uncertainty, availability of NGL transportation and fractionation capacity and a variety of additional factors that are beyond our control. Our Midstream segment profitability is affected by prevailing commodity prices primarily as a result of processing or conditioning at our own or third‑party processing plants, purchasing and selling or gathering and transporting volumes of natural gas at index‑related prices and the cost of third‑party transportation and fractionation services. To the extent that commodity prices influence the level of natural gas drilling by our producer customers, such prices also affect profitability.
RESULTS OF OPERATIONS
The following discussion includes comments and analysis relating to our results of operations. This discussion should be read in conjunction with Item 1. Financial Statements and is intended to provide investors with a reasonable basis for assessing our historical operations, but should not serve as the only criteria for predicting our future performance.
Consolidated Results of Operations
| Three Months Ended September 30, | Nine Months Ended September 30, | |||||||||||||||||||||||||||||||||||||
| (In millions) | 2021 | 2020 | Variance | 2021 | 2020 | Variance | ||||||||||||||||||||||||||||||||
| Revenues and other income: | ||||||||||||||||||||||||||||||||||||||
| Sales and other operating revenues(a) | $ | 32,321 | $ | 17,408 | $ | 14,913 | $ | 84,647 | $ | 51,807 | $ | 32,840 | ||||||||||||||||||||||||||
| Income (loss) from equity method investments | 122 | 117 | 5 | 306 | (1,037) | 1,343 | ||||||||||||||||||||||||||||||||
| Net gain on disposal of assets | — | 1 | (1) | 3 | 6 | (3) | ||||||||||||||||||||||||||||||||
| Other income | 170 | 22 | 148 | 366 | 69 | 297 | ||||||||||||||||||||||||||||||||
| Total revenues and other income | 32,613 | 17,548 | 15,065 | 85,322 | 50,845 | 34,477 | ||||||||||||||||||||||||||||||||
| Costs and expenses: | ||||||||||||||||||||||||||||||||||||||
| Cost of revenues (excludes items below) | 29,563 | 16,673 | 12,890 | 77,824 | 48,517 | 29,307 | ||||||||||||||||||||||||||||||||
| LCM inventory valuation adjustment | — | (530) | 530 | — | 1,185 | (1,185) | ||||||||||||||||||||||||||||||||
| Impairment expense | — | 433 | (433) | — | 8,280 | (8,280) | ||||||||||||||||||||||||||||||||
| Depreciation and amortization | 836 | 830 | 6 | 2,551 | 2,526 | 25 | ||||||||||||||||||||||||||||||||
| Selling, general and administrative expenses | 681 | 673 | 8 | 1,881 | 2,080 | (199) | ||||||||||||||||||||||||||||||||
| Restructuring expenses | — | 348 | (348) | — | 348 | (348) | ||||||||||||||||||||||||||||||||
| Other taxes | 193 | 178 | 15 | 544 | 546 | (2) | ||||||||||||||||||||||||||||||||
| Total costs and expenses | 31,273 | 18,605 | 12,668 | 82,800 | 63,482 | 19,318 | ||||||||||||||||||||||||||||||||
| Income (loss) from continuing operations | 1,340 | (1,057) | 2,397 | 2,522 | (12,637) | 15,159 | ||||||||||||||||||||||||||||||||
| Net interest and other financial costs | 328 | 359 | (31) | 1,053 | 1,032 | 21 | ||||||||||||||||||||||||||||||||
| Income (loss) from continuing operations before income taxes | 1,012 | (1,416) | 2,428 | 1,469 | (13,669) | 15,138 | ||||||||||||||||||||||||||||||||
| Provision (benefit) for income taxes on continuing operations | (18) | (436) | 418 | 21 | (2,237) | 2,258 | ||||||||||||||||||||||||||||||||
| Income (loss) from continuing operations, net of tax | 1,030 | (980) | 2,010 | 1,448 | (11,432) | 12,880 | ||||||||||||||||||||||||||||||||
| Income from discontinued operations, net of tax | — | 371 | (371) | 8,448 | 881 | 7,567 | ||||||||||||||||||||||||||||||||
| Income (loss) from equity method investments | 1,030 | (609) | 1,639 | 9,896 | (10,551) | 20,447 | ||||||||||||||||||||||||||||||||
| Less net income (loss) attributable to: | ||||||||||||||||||||||||||||||||||||||
| Redeemable noncontrolling interest | 38 | 20 | 18 | 79 | 61 | 18 | ||||||||||||||||||||||||||||||||
| Noncontrolling interests | 298 | 257 | 41 | 853 | (501) | 1,354 | ||||||||||||||||||||||||||||||||
| Net income (loss) attributable to MPC | $ | 694 | $ | (886) | $ | 1,580 | $ | 8,964 | $ | (10,111) | $ | 19,075 |
(a)In accordance with discontinued operations accounting, Speedway sales to retail customers and net results are reflected in Income from discontinued operations, net of tax and Refining & Marketing intercompany sales to Speedway are now presented as third party sales through the close of the sale on May 14, 2021.
Third Quarter 2021 Compared to Third Quarter 2020
Net income attributable to MPC increased $1.58 billion in the third quarter of 2021 compared to the third quarter of 2020 largely due to increases in refined product sales prices and volumes in the third quarter of 2021 and the absence of impairment and restructuring expenses, partially offset by the absence of an LCM inventory benefit, in the third quarter of 2020.
Revenues and other income increased $15.07 billion primarily due to:
-
increased sales and other operating revenues of $14.91 billion primarily due to increased Refining & Marketing segment average refined product sales prices of $0.90 per gallon and increased refined product sales volumes of 338 mbpd; and
-
increased other income of $148 million primarily due to higher income on RIN sales.
Costs and expenses increased $12.67 billion primarily due to:
-
increased cost of revenues of $12.89 billion mainly due to higher crude oil and refined product raw material costs;
-
the absence of an LCM benefit of $530 million in the third quarter of 2020;
-
decreased impairment expenses of $433 million primarily related to the repositioning of the Martinez refinery in the third quarter of 2020; and
-
decreased restructuring expenses of $348 million related to the idling of the Martinez and Gallup refineries and costs related to our workforce reduction in the third quarter of 2020.
Net interest and other financial costs decreased $31 million largely due to decreased interest expense due to lower MPC and MPLX borrowings, partially offset by $15 million of pension settlement losses.
We recorded a combined federal, state and foreign income tax benefit of $18 million for the three months ended September 30, 2021, which was lower than the tax computed at the U.S. statutory rate primarily due to certain permanent tax benefits related to net income attributable to noncontrolling interests, state taxes, and an increase in benefit related to NOL carryback provided under the CARES Act. We recorded a combined federal, state and foreign income tax benefit of $436 million for the three months ended September 30, 2020, which was higher than the tax computed at the U.S. statutory rate primarily due to certain permanent tax benefits related to net income attributable to noncontrolling interests, state taxes and a change in estimate related to the expected NOL carryback provided under the CARES Act offset by non-tax deductible goodwill impairment.
Noncontrolling interests increased $41 million primarily due to an increase in MPLX’s net income.
Nine Months Ended September 30, 2021 Compared to Nine Months Ended September 30, 2020
Net income attributable to MPC increased $19.08 billion in the first nine months of 2021 compared to the first nine months of 2020 primarily due to the gain on the sale of Speedway, the absence of impairment expenses and an LCM inventory charge in the first nine months of 2020 and increases in average refined product sales prices and volumes, partially offset by a partial period of income from discontinued operations due to the sale of the Speedway business on May 14, 2021.
Revenues and other income increased $34.48 billion primarily due to:
-
increased sales and other operating revenues of $32.84 billion primarily due to increased average refined product sales prices of $0.73 per gallon and increased refined product sales volumes of 144 mbpd;
-
increased income from equity method investments of $1.34 billion largely due to impairments of equity method investments of $1.32 billion recorded in the first nine months of 2020 primarily driven by the effects of COVID-19 and the decline in commodity prices; and
-
increased other income of $297 million primarily due to higher income on RIN sales.
Costs and expenses increased $19.32 billion primarily due to:
-
increased cost of revenues of $29.31 billion primarily due to higher crude oil and refined product raw material costs;
-
the absence of an LCM charge of $1.19 billion primarily driven by the effects of COVID-19 and the decline in commodity prices in the prior year;
-
decreased impairment expense of $8.28 billion due to impairments recorded for goodwill and long-lived assets in the first nine months of 2020 primarily driven by the effects of COVID-19 and the decline in commodity prices in the prior year;
-
decreased selling, general and administrative expenses of $199 million largely due to cost reductions realized from our 2020 workforce reduction and other cost control efforts; and
-
decreased restructuring expenses of $348 million related to the idling of the Martinez and Gallup refineries and costs related to our workforce reduction in the third quarter of 2020.
Net interest and other financial costs increased $21 million largely due to pension settlement losses of $64 million, partially offset by decreased interest expense due to lower MPLX and MPC borrowings.
We recorded a combined federal, state and foreign income tax expense of $21 million for the nine months ended September 30, 2021, which was lower than the tax computed at the U.S. statutory rate primarily due to certain permanent tax benefits related to net income attributable to noncontrolling interests and a change in benefit related to the NOL carryback provided under the CARES Act offset by state taxes. We recorded a combined federal, state and foreign income tax benefit of $2.24 billion for the nine months ended September 30, 2020, which was lower than the tax computed at the U.S. statutory rate due to a significant amount of our pre-tax loss consisting of non-tax deductible goodwill impairment charges, partially offset by the tax rate differential resulting from the expected NOL carryback provided under the CARES Act. Additionally, our non-controlling interest in MPLX generally provides an effective tax rate benefit since the tax associated with these ownership interests is paid by those interests, but this benefit was lower for the nine months ended September 30, 2020 due to impairment charges recorded by MPLX.
Net income attributable to noncontrolling interests increased $1.35 billion primarily due to an increase in MPLX’s net income largely due to impairment expense recognized during the first nine months of 2020.
Segment Results
Refining & Marketing
The following includes key financial and operating data for the third quarter of 2021 compared to the third quarter of 2020 and the nine months ended September 30, 2021 compared to the nine months ended September 30, 2020.
(a)Includes intersegment sales to Midstream and sales destined for export.
| Three Months Ended September 30, | Nine Months Ended September 30, | |||||||||||||||||||||||||
| 2021 | 2020 | 2021 | 2020 | |||||||||||||||||||||||
| Refining & Marketing Operating Statistics | ||||||||||||||||||||||||||
| Net refinery throughput (mbpd) | 2,836 | 2,536 | 2,753 | 2,601 | ||||||||||||||||||||||
| Refining & Marketing margin, excluding LIFO liquidation charge(a)(b)(c) | $ | 14.51 | $ | 8.28 | $ | 12.46 | $ | 9.46 | ||||||||||||||||||
| LIFO liquidation charge | — | (1.10) | — | (0.36) | ||||||||||||||||||||||
| Refining & Marketing margin per barrel(a)(b) | 14.51 | 7.18 | 12.46 | 9.10 | ||||||||||||||||||||||
| Less: | ||||||||||||||||||||||||||
| Refining operating costs per barrel, excluding storm impacts(c) | 4.97 | 5.41 | 4.89 | 5.85 | ||||||||||||||||||||||
| Storm impacts on refining operating cost(d) | 0.07 | — | 0.07 | — | ||||||||||||||||||||||
| Distribution costs per barrel | 5.02 | 5.61 | 5.08 | 5.35 | ||||||||||||||||||||||
| Refining planned turnaround costs per barrel | 0.78 | 1.01 | 0.50 | 1.02 | ||||||||||||||||||||||
| Depreciation and amortization per barrel | 1.77 | 1.96 | 1.87 | 1.95 | ||||||||||||||||||||||
| Plus: | ||||||||||||||||||||||||||
| Other per barrel(e) | 0.05 | 0.08 | 0.13 | 0.01 | ||||||||||||||||||||||
| Refining & Marketing segment income (loss) per barrel | $ | 1.95 | $ | (6.73) | $ | 0.18 | $ | (5.06) | ||||||||||||||||||
| Fees paid to MPLX included in distribution costs above | $ | 3.23 | $ | 3.81 | $ | 3.40 | $ | 3.63 |
(a)Sales revenue less cost of refinery inputs and purchased products, divided by net refinery throughput.
(b)See “Non-GAAP Measures” section for reconciliation and further information regarding this non-GAAP measure.
(c)Includes refining operating costs and major maintenance costs. Excludes planned turnaround and depreciation and amortization expense.
(d)Storms in the first and third quarters of 2021 resulted in higher costs, including maintenance and repairs.
(e)Includes income (loss) from equity method investments, net gain (loss) on disposal of assets and other income.
The following table presents certain benchmark prices in our marketing areas and market indicators that we believe are helpful in understanding the results of our Refining & Marketing segment. The benchmark crack spreads below do not reflect the market cost of RINs necessary to meet EPA renewable volume obligations for attributable products under the Renewable Fuel Standard.
| Three Months Ended September 30, | Nine Months Ended September 30, | |||||||||||||||||||||||||
| Benchmark Spot Prices (dollars per gallon) | 2021 | 2020 | 2021 | 2020 | ||||||||||||||||||||||
| Chicago CBOB unleaded regular gasoline | $ | 2.19 | $ | 1.15 | $ | 1.97 | $ | 1.05 | ||||||||||||||||||
| Chicago ULSD | 2.14 | 1.17 | 1.98 | 1.16 | ||||||||||||||||||||||
| USGC CBOB unleaded regular gasoline | 2.15 | 1.15 | 1.94 | 1.07 | ||||||||||||||||||||||
| USGC ULSD | 2.08 | 1.16 | 1.91 | 1.18 | ||||||||||||||||||||||
| LA CARBOB | 2.29 | 1.33 | 2.12 | 1.27 | ||||||||||||||||||||||
| LA CARB diesel | 2.17 | 1.24 | 1.98 | 1.28 | ||||||||||||||||||||||
| Market Indicators (dollars per barrel) | ||||||||||||||||||||||||||
| WTI | $ | 70.52 | $ | 40.92 | $ | 65.04 | $ | 38.21 | ||||||||||||||||||
| MEH | 71.17 | — | 65.95 | — | ||||||||||||||||||||||
| LLS | — | 42.49 | — | 40.15 | ||||||||||||||||||||||
| ANS | 72.69 | 42.75 | 67.52 | 41.41 | ||||||||||||||||||||||
| Crack Spreads: | ||||||||||||||||||||||||||
| Mid-Continent WTI 3-2-1 | $ | 13.53 | $ | 5.55 | $ | 11.27 | 5.88 | |||||||||||||||||||
| USGC MEH 3-2-1 | 10.70 | — | 8.47 | — | ||||||||||||||||||||||
| USGC LLS 3-2-1 | — | 3.28 | — | 4.15 | ||||||||||||||||||||||
| West Coast ANS 3-2-1 | 14.60 | 9.21 | 12.92 | 9.76 | ||||||||||||||||||||||
| Blended 3-2-1(a) | 12.61 | 5.57 | 10.48 | 6.15 | ||||||||||||||||||||||
| Crude Oil Differentials: | ||||||||||||||||||||||||||
| Sweet | $ | (0.49) | $ | (0.59) | $ | (0.59) | $ | (1.00) | ||||||||||||||||||
| Sour | (4.62) | (2.26) | (3.62) | (3.64) |
(a) Blended 3-2-1 Mid-Continent/USGC/West Coast crack spread is 40/40/20 percent in 2021. Blended 3-2-1 Mid-Continent/USGC/West Coast crack spread is 38/38/24 percent in 2020. These blends are based on our refining capacity by region in each period. Beginning in the first quarter of 2021, the prompt price for USGC was transitioned from LLS to MEH.
Third Quarter 2021 Compared to Third Quarter 2020
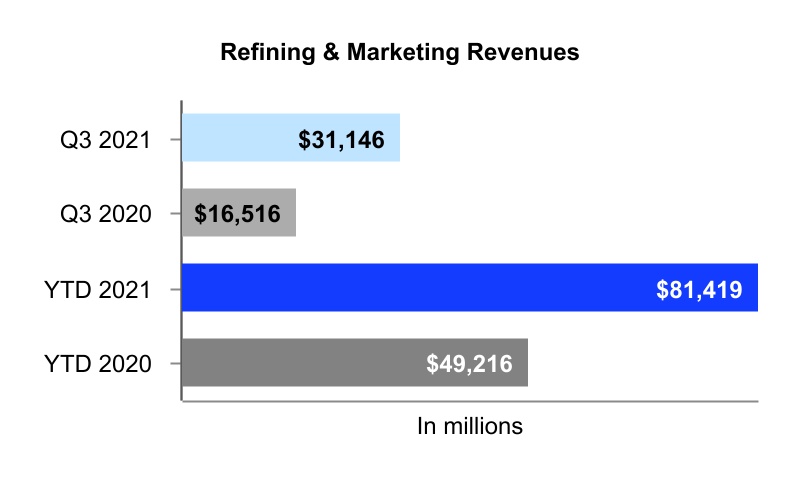
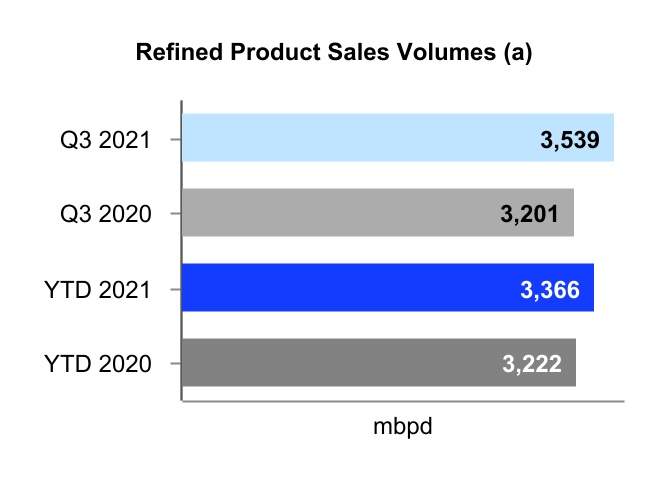
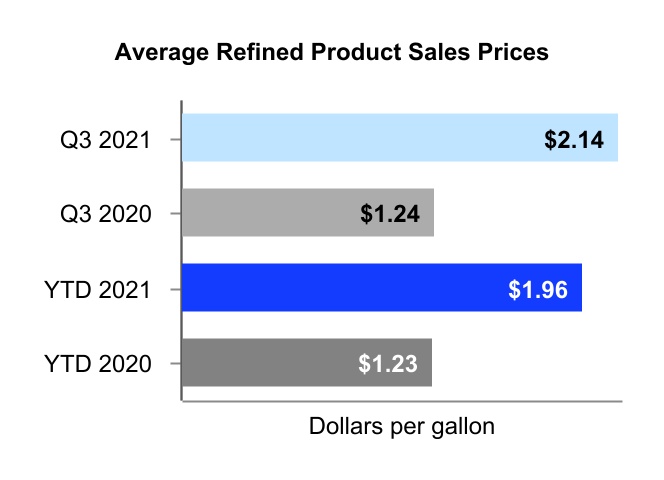
Refining & Marketing segment revenues increased $14.63 billion primarily due to increased average refined product sales prices of $0.90 per gallon and increased refined product sales volumes of 338 mbpd.
Net refinery throughputs increased 300 mbpd during the third quarter of 2021, primarily due to continuing industry recovery from the impact of COVID-19 in 2020.
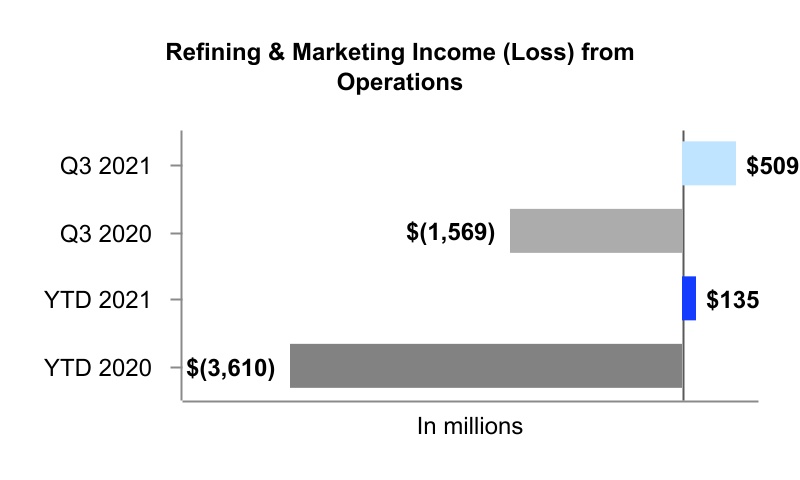
Refining & Marketing segment income from operations increased $2.08 billion primarily due to higher blended crack spreads and reduced refining planned turnaround costs, partially offset by increased refining operating costs, excluding depreciation and amortization.
Refining & Marketing margin was $14.51 per barrel for the third quarter of 2021 compared to $8.28 per barrel, excluding LIFO liquidation charge, for the third quarter of 2020. Refining & Marketing margin is affected by our performance against the market indicators shown earlier, which use spot market values and an estimated mix of crude purchases and product sales. Based on the market indicators and our crude oil throughput, we estimate a net positive impact of approximately $2 billion on Refining & Marketing margin for the third quarter of 2021 compared to the third quarter of 2020, primarily due to higher crack spreads. Our reported Refining & Marketing margin differs from market indicators due to the mix of crudes purchased and their costs, the effect of market structure on our crude oil acquisition prices, the effect of RIN prices on the crack spread, and other items like refinery yields, other feedstock variances, fuel margin from sales to direct dealers and, for the third quarter of 2020, a LIFO liquidation charge of $256 million. These factors had an estimated net negative effect of approximately $50 million on Refining & Marketing segment income in the third quarter of 2021 compared to the third quarter of 2020.
For the three months ended September 30, 2021, refining operating costs, excluding depreciation and amortization and storm impacts, increased $33 million compared to the three months ended September 30, 2020 primarily due to an increase in energy costs largely as a result of higher natural gas prices. On a per barrel basis, refining operating costs decreased $0.44 due to higher throughputs during the quarter.
Distribution costs, excluding depreciation and amortization, decreased $1 million and include fees paid to MPLX of $844 million and $889 million for the third quarter of 2021 and 2020, respectively. On a per barrel basis, distribution costs, excluding depreciation and amortization, decreased $0.59 per barrel due to higher throughput.
Refining planned turnaround costs decreased $29 million, or $0.23 per barrel, due to the timing of turnaround activity.
Depreciation and amortization decreased $0.19 per barrel primarily due to higher throughput.
Nine Months Ended September 30, 2021 Compared to Nine Months Ended September 30, 2020
Refining & Marketing segment revenues increased $32.20 billion primarily due to increased average refined product sales prices of $0.73 per gallon and higher refined product sales volumes, which increased 144 mbpd.
Net refinery throughputs increased 152 mbpd in the first nine months of 2021, primarily due to continuing industry recovery from the impact of COVID-19 in 2020.
Refining & Marketing segment income from operations increased $3.75 billion primarily driven by higher blended crack spreads and reduced refining operating and refining planned turnaround costs.
Refining & Marketing margin was $12.46 per barrel for the first nine months of 2021 compared to $9.46 per barrel, excluding LIFO liquidation charge, for the first nine months of 2020. Refining & Marketing margin is affected by the market indicators shown earlier, which use spot market values and an estimated mix of crude purchases and product sales. Based on the market indicators and our crude oil throughput, we estimate a net positive impact of approximately $3 billion on Refining & Marketing margin for the first nine months of 2021 compared to the first nine months of 2020, primarily due to higher crack spreads. Our reported Refining & Marketing margin differs from market indicators due to the mix of crudes purchased and their costs, market structure on our crude oil acquisition prices, RIN prices on the crack spread, and other items like refinery yields, other feedstock variances, direct dealer fuel margin and, for the first nine months of 2020, a LIFO liquidation charge of $256 million. These factors had an estimated net positive effect of approximately $10 million on Refining & Marketing segment income in the first nine months of 2021 compared to the first nine months of 2020.
For the nine months ended September 30, 2021, refining operating costs, excluding depreciation and amortization and storm impacts, decreased $492 million, or $0.96 per barrel, compared to the nine months ended September 30, 2020 as we took actions to reduce costs in response to the economic effects of COVID-19, including idling portions of our refining capacity, partially offset by an increase in energy costs largely as a result of higher natural gas prices.
Distribution costs, excluding depreciation and amortization, were $3.82 billion for the first nine months of 2021 and 2020 and include fees paid to MPLX of $2.56 billion and $2.59 billion for the first nine months of 2021 and 2020, respectively. On a per barrel basis, distribution costs, excluding depreciation and amortization, decreased $0.27 per barrel due to higher throughput.
Refining planned turnaround costs decreased $347 million, or $0.52 per barrel, due to the timing of turnaround activity.
Depreciation and amortization decreased $0.08 per barrel as increased costs were offset by higher throughput.
Supplemental Refining & Marketing Statistics
| Three Months Ended September 30, | Nine Months Ended September 30, | ||||||||||||||||||||||
| 2021 | 2020 | 2021 | 2020 | ||||||||||||||||||||
| Refining & Marketing Operating Statistics | |||||||||||||||||||||||
| Crude oil capacity utilization percent(a) | 93 | 84 | 90 | 82 | |||||||||||||||||||
| Refinery throughputs (mbpd): | |||||||||||||||||||||||
| Crude oil refined | 2,684 | 2,390 | 2,594 | 2,446 | |||||||||||||||||||
| Other charge and blendstocks | 152 | 146 | 159 | 155 | |||||||||||||||||||
| Net refinery throughput | 2,836 | 2,536 | 2,753 | 2,601 | |||||||||||||||||||
| Sour crude oil throughput percent | 45 | 49 | 47 | 50 | |||||||||||||||||||
| Sweet crude oil throughput percent | 55 | 51 | 53 | 50 | |||||||||||||||||||
| Refined product yields (mbpd): | |||||||||||||||||||||||
| Gasoline | 1,451 | 1,311 | 1,404 | 1,305 | |||||||||||||||||||
| Distillates | 968 | 872 | 944 | 908 | |||||||||||||||||||
| Propane | 53 | 50 | 51 | 51 | |||||||||||||||||||
| Feedstocks and petrochemicals | 272 | 230 | 265 | 266 | |||||||||||||||||||
| Heavy fuel oil | 32 | 21 | 32 | 28 | |||||||||||||||||||
| Asphalt | 93 | 92 | 94 | 83 | |||||||||||||||||||
| Total | 2,869 | 2,576 | 2,790 | 2,641 | |||||||||||||||||||
| Refined product export sales volumes (mbpd)(b) | 294 | 389 | 256 | 331 |
(a)Based on calendar-day capacity, which is an annual average that includes down time for planned maintenance and other normal operating activities.
(b)Represents fully loaded export cargoes for each time period. These sales volumes are included in the total sales volume amounts.
Midstream
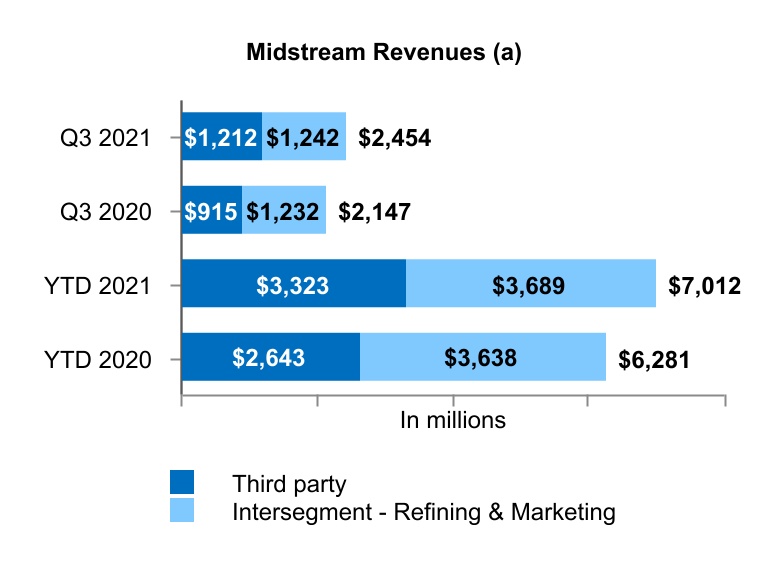
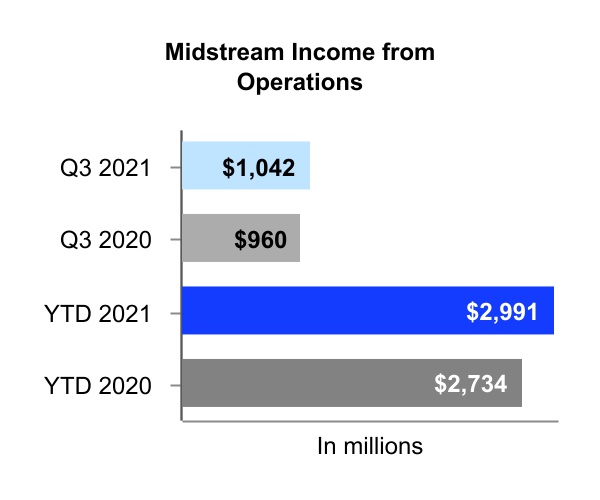
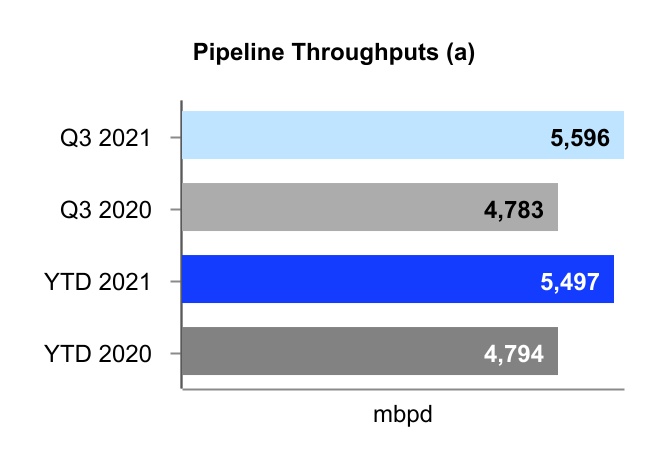
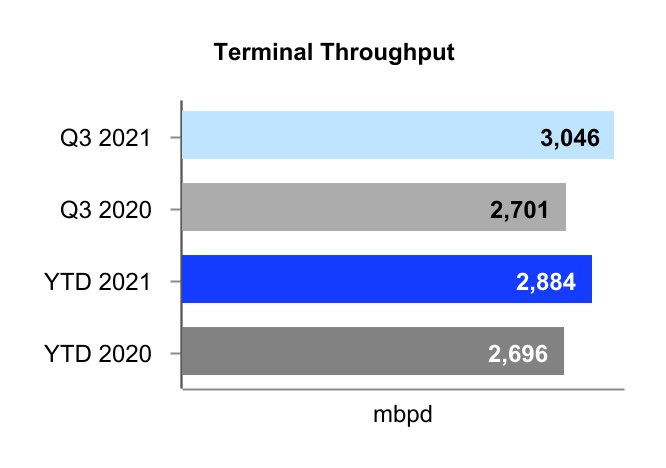
The following includes key financial and operating data for the third quarter of 2021 compared to the third quarter of 2020 and the nine months ended September 30, 2021 compared to the nine months ended September 30, 2020.
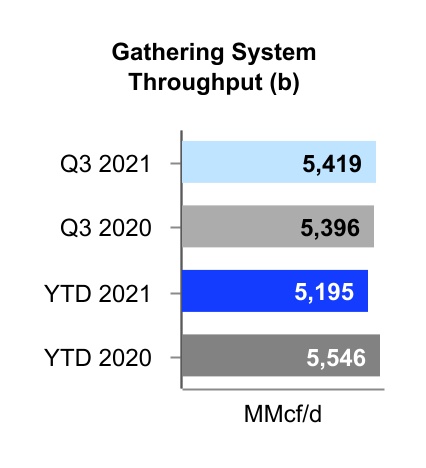
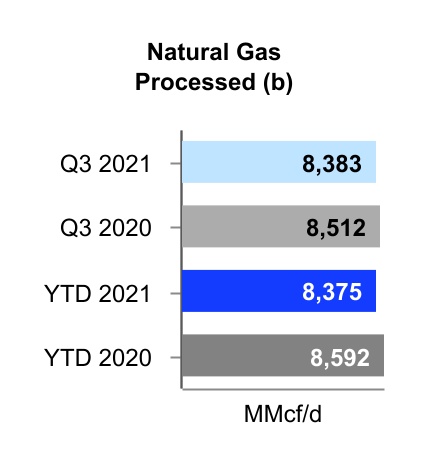
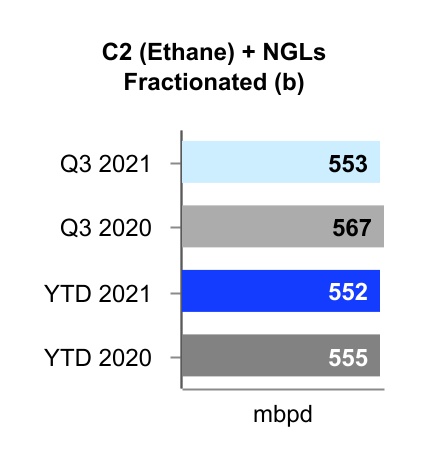
(a)On owned common-carrier pipelines, excluding equity method investments.
(b)Includes amounts related to unconsolidated equity method investments on a 100 percent basis.
| Three Months Ended September 30, | Nine Months Ended September 30, | |||||||||||||||||||||||||
| Benchmark Prices | 2021 | 2020 | 2021 | 2020 | ||||||||||||||||||||||
| Natural Gas NYMEX HH ($ per MMBtu) | $ | 4.31 | $ | 2.13 | $ | 3.34 | $ | 1.92 | ||||||||||||||||||
| C2 + NGL Pricing ($ per gallon)(a) | $ | 0.96 | $ | 0.45 | $ | 0.81 | $ | 0.40 |
(a)C2 + NGL pricing based on Mont Belvieu prices assuming an NGL barrel of approximately 35 percent ethane, 35 percent propane, 6 percent iso-butane, 12 percent normal butane and 12 percent natural gasoline.
Third Quarter 2021 Compared to Third Quarter 2020
Midstream segment revenue and segment income from operations increased $307 million and $82 million, respectively. Results for the quarter benefited from higher revenue, primarily due to higher natural gas prices and higher pipeline throughput, in addition to lower operating expenses.
Nine Months Ended September 30, 2021 Compared to Nine Months Ended September 30, 2020
Midstream segment revenue and segment income from operations increased $731 million and $257 million, respectively. Results benefited from higher revenue, primarily due to higher natural gas prices and higher pipeline and terminal throughputs, in addition to lower operating expenses in the first nine months of 2021.
Corporate
| Key Financial Information (in millions) | Three Months Ended September 30, | Nine Months Ended September 30, | ||||||||||||||||||||||||
| 2021 | 2020 | 2021 | 2020 | |||||||||||||||||||||||
| Corporate(a) | (186) | (197) | (523) | (625) |
(a)Corporate costs consist primarily of MPC’s corporate administrative expenses and costs related to certain non-operating assets, except for corporate overhead expenses attributable to MPLX, which are included in the Midstream segment.
Third Quarter 2021 Compared to Third Quarter 2020
Corporate costs decreased $11 million largely due to cost reductions realized from our 2020 workforce reduction and other cost control efforts.
Nine Months Ended September 30, 2021 Compared to Nine Months Ended September 30, 2020
Corporate costs decreased $102 million largely due to cost reductions realized from our 2020 workforce reduction and other cost control efforts.
Items not Allocated to Segments
| Key Financial Information (in millions) | Three Months Ended September 30, | Nine Months Ended September 30, | ||||||||||||||||||||||||
| 2021 | 2020 | 2021 | 2020 | |||||||||||||||||||||||
| Items not allocated to segments: | ||||||||||||||||||||||||||
| LCM inventory valuation adjustment | $ | — | $ | 530 | $ | — | $ | (1,185) | ||||||||||||||||||
| Impairment and idling expenses | (25) | (433) | (81) | (9,595) | ||||||||||||||||||||||
| Restructuring expense | — | (348) | — | (348) | ||||||||||||||||||||||
| Transaction-related costs(a) | — | — | — | (8) | ||||||||||||||||||||||
| Total items not allocated to segments: | $ | (25) | $ | (251) | $ | (81) | $ | (11,136) |
(a)2020 includes costs incurred in connection with the Midstream strategic review. Costs incurred in 2020 in connection with the Speedway separation are included in discontinued operations. See Note 4 to the unaudited consolidated financial statements for additional information on discontinued operations.
Third Quarter 2021 Compared to Third Quarter 2020
Total items not allocated to segments included impairment expense of $433 million and an LCM benefit of $530 million in the third quarter of 2020.
Nine Months Ended September 30, 2021 Compared to Nine Months Ended September 30, 2020
In the first nine months of 2021, total items not allocated to segments included impairment expense of $81 million related to the divestiture, abandonment or closure of certain assets within our Midstream segment. During the first nine months of 2020, we recorded impairment charges of approximately $9.60 billion, which includes $8.28 billion related to goodwill and long-lived assets and $1.32 billion related to equity method investments, and an LCM charge of $1.19 billion primarily driven by the effects of COVID-19 and the decline in commodity prices.
Non-GAAP Financial Measure
Management uses a financial measure to evaluate our operating performance that is calculated and presented on the basis of a methodology other than in accordance with GAAP. We believe this non-GAAP financial measure is useful to investors and analysts to assess our ongoing financial performance because, when reconciled to its most comparable GAAP financial measure, it provides improved comparability between periods through the exclusion of certain items that we believe are not indicative of our core operating performance and that may obscure our underlying business results and trends. This measure should not be considered a substitute for, or superior to, measures of financial performance prepared in accordance with GAAP, and our calculation thereof may not be comparable to similarly titled measures reported by other companies. The non-GAAP financial measure we use is as follows:
Refining & Marketing Margin
Refining & Marketing margin is defined as sales revenue less the cost of refinery inputs and purchased products and excludes other items as reflected in the table below.
Reconciliation of Refining & Marketing income from operations to Refining & Marketing gross margin and Refining & Marketing margin
| Three Months Ended September 30, | Nine Months Ended September 30, | ||||||||||||||||||||||||||||
| (in millions) | 2021 | 2020 | 2021 | 2020 | |||||||||||||||||||||||||
| Refining & Marketing income (loss) from operations(a) | $ | 509 | $ | (1,569) | $ | 135 | $ | (3,610) | |||||||||||||||||||||
| Plus (Less): | |||||||||||||||||||||||||||||
| Selling, general and administrative expenses | 540 | 518 | 1,495 | 1,576 | |||||||||||||||||||||||||
| LCM inventory valuation adjustment | — | 530 | — | (1,185) | |||||||||||||||||||||||||
| (Income) loss from equity method investments | (8) | (16) | (27) | 6 | |||||||||||||||||||||||||
| Net gain on disposal of assets | (3) | (1) | (6) | — | |||||||||||||||||||||||||
| Other income | (146) | (1) | (289) | (9) | |||||||||||||||||||||||||
| Refining & Marketing gross margin | 892 | (539) | 1,308 | (3,222) | |||||||||||||||||||||||||
| Plus (Less): | |||||||||||||||||||||||||||||
| Operating expenses (excluding depreciation and amortization) | 2,527 | 2,408 | 7,107 | 7,481 | |||||||||||||||||||||||||
| LCM inventory valuation adjustment | — | (530) | — | 1,185 | |||||||||||||||||||||||||
| Depreciation and amortization | 462 | 456 | 1,406 | 1,392 | |||||||||||||||||||||||||
| Gross margin excluded from and other income included in Refining & Marketing margin(b) | (58) | (101) | (353) | (285) | |||||||||||||||||||||||||
| Other taxes included in Refining & Marketing margin | (38) | (19) | (104) | (62) | |||||||||||||||||||||||||
| Refining & Marketing margin(a) | 3,785 | 1,675 | 9,364 | 6,489 | |||||||||||||||||||||||||
| LIFO liquidation charge | — | 256 | — | 256 | |||||||||||||||||||||||||
| Refining & Marketing margin, excluding LIFO liquidation charge | $ | 3,785 | $ | 1,931 | $ | 9,364 | $ | 6,745 |
(a)LCM inventory valuation adjustments are excluded from Refining & Marketing income from operations and Refining & Marketing margin.
(b)Reflects the gross margin, excluding depreciation and amortization, of other related operations included in the Refining & Marketing segment and processing of credit card transactions on behalf of certain of our marketing customers, net of other income.
LIQUIDITY AND CAPITAL RESOURCES
Cash Flows
Our consolidated cash and cash equivalents balance for continuing operations was approximately $5.87 billion at September 30, 2021 compared to $415 million at December 31, 2020. Cash and cash equivalents for discontinued operations was $140 million at December 31, 2020. Net cash provided by (used in) operating activities, investing activities and financing activities are presented in the following table.
| Nine Months Ended September 30, | ||||||||||||||
| (In millions) | 2021 | 2020 | ||||||||||||
| Net cash provided by (used in): | ||||||||||||||
| Operating activities - continuing operations | $ | 3,546 | $ | (141) | ||||||||||
| Operating activities - discontinued operations | (2,860) | 1,232 | ||||||||||||
| Total Operating activities | 686 | 1,091 | ||||||||||||
| Investing activities - continuing operations | (7,965) | (2,552) | ||||||||||||
| Investing activities - discontinued operations | 21,314 | (272) | ||||||||||||
| Total investing activities | 13,349 | (2,824) | ||||||||||||
| Financing activities | (8,716) | 922 | ||||||||||||
| Total increase (decrease) in cash | $ | 5,319 | $ | (811) |
Net cash provided by operating activities decreased $405 million in the first nine months of 2021 compared to the first nine months of 2020. The change in net cash provided by continuing operations is primarily due to an increase in operating results and a favorable change in working capital of $183 million when comparing the change in working capital in both periods. Net cash used in discontinued operations, which reflects the results of the Speedway business, decreased $4.09 billion mainly due to the sale of Speedway on May 14, 2021, tax payments related to the gain on sale and working capital changes. Changes in working capital exclude changes in short-term debt.
Changes in working capital, excluding changes in short-term debt, were a net $307 million use of cash in the first nine months of 2021 compared to a net $490 million use of cash in the first nine months of 2020.
For the first nine months of 2021, changes in working capital were a net $307 million use of cash primarily due to the effects of increasing energy commodity prices and volumes at the end of the period on working capital. Accounts payable increased primarily due to increases in crude prices and volumes. Current receivables increased primarily due to higher crude and refined product prices and volumes. Inventories increased primarily due to increases in refined product and crude inventories.
For the first nine months of 2020, changes in working capital, excluding the LCM reserve and changes in short-term debt, were a net $490 million use of cash primarily due to the effects of decreasing energy commodity prices and volumes at the end of the period on working capital. Accounts payable decreased primarily due to decreases in crude prices and volumes. Current receivables decreased primarily due to lower crude prices and lower refined product prices and volumes. Excluding the LCM reserve, inventories decreased due to decreases in crude and refined product inventories.
Net cash provided by investing activities was $13.35 billion in the first nine months of 2021 compared to net cash used in investing activities of $2.82 billion in the first nine months of 2020. The change in net cash used by continuing operations is primarily due to purchases of short-term investments of $9.46 billion, partially offset by a decrease in additions to property, plant and equipment of $1.35 billion and maturities and sales of short-term investments. The change in net cash provided by discontinued operations is primarily due to proceeds from the sale of Speedway of $21.38 billion.
The consolidated statements of cash flows exclude changes to the consolidated balance sheets that did not affect cash. A reconciliation of additions to property, plant and equipment per the consolidated statements of cash flows to reported total capital expenditures and investments follows.
| Nine Months Ended September 30, | ||||||||||||||
| (In millions) | 2021 | 2020 | ||||||||||||
| Additions to property, plant and equipment per the consolidated statements of cash flows | $ | 983 | $ | 2,330 | ||||||||||
| Increase (decrease) in capital accruals | 31 | (426) | ||||||||||||
| Total capital expenditures | 1,014 | 1,904 | ||||||||||||
| Investments in equity method investees (excludes acquisitions) | 150 | 436 | ||||||||||||
| Total capital expenditures and investments | $ | 1,164 | $ | 2,340 |
Financing activities were a net $8.72 billion use of cash in the first nine months of 2021 compared to a net $922 million source of cash in the first nine months of 2020.
-
MPC borrowed $7.41 billion and repaid $8.44 billion under its commercial paper program in the first nine months of 2021.
-
Long-term debt borrowings and repayments were a net $3.30 billion use of cash in the first nine months of 2021 compared to a net $3.02 billion source of cash in the first nine months of 2020. During the first nine months of 2021, MPC repaid $1.3 billion of senior notes, borrowed and repaid $3.65 billion under its revolving credit facility and borrowed and repaid $4.65 billion under its trade receivables facility. MPLX redeemed $1.75 billion of senior notes and had net payments of $175 million under its revolving credit facility.
During the first nine months of 2020, MPC issued $2.5 billion of senior notes, borrowed and repaid $3.5 billion under its revolving credit facility and borrowed and repaid $1.23 billion under its trade receivables facility. MPLX issued $3.0 billion of senior notes, which were used to repay $1.0 billion of outstanding borrowings under its term loan, to repay $1.0 billion of floating rate senior notes, and to redeem $450 million of senior notes, and had net borrowings of $95 million under its revolving credit facility.
-
Cash used in common stock repurchases, including fees and expenses, totaled $1.91 billion in the first nine months of 2021. See the “Capital Requirements” section for further discussion of our stock repurchases.
-
Cash used in repurchases of noncontrolling interests was $465 million in the first nine months of 2021 related to the repurchase of MPLX common units. See Note 5 to the unaudited consolidated financial statements for further discussion of MPLX.
Derivative Instruments
See Item 3. Quantitative and Qualitative Disclosures about Market Risk for a discussion of derivative instruments and associated market risk.
Capital Resources
MPC, Excluding MPLX
We control MPLX through our ownership of the general partner, however, the creditors of MPLX do not have recourse to MPC’s general credit through guarantees or other financial arrangements. The assets of MPLX can only be used to settle its own obligations and its creditors have no recourse to our assets. Therefore, in the following table, we present the liquidity of MPC, excluding MPLX. MPLX liquidity is discussed in the following section.
Our liquidity, excluding MPLX, totaled $18.29 billion at September 30, 2021 consisting of:
| September 30, 2021 | ||||||||||||||||||||
| (In millions) | Total Capacity | Outstanding Borrowings | Available Capacity | |||||||||||||||||
| Bank revolving credit facility(a) | $ | 5,000 | $ | 1 | $ | 4,999 | ||||||||||||||
| Trade receivables facility | 100 | — | 100 | |||||||||||||||||
| Total | $ | 5,100 | $ | 1 | $ | 5,099 | ||||||||||||||
| Cash and cash equivalents and short-term investments(b) | 13,187 | |||||||||||||||||||
| Total liquidity | $ | 18,286 |
(a)Outstanding borrowings include $1 million in letters of credit outstanding under this facility.
(b)Excludes cash and cash equivalents of MPLX of $39 million.
On May 14, 2021, we completed the sale of Speedway, our company-owned and operated retail transportation fuel and convenience store business, to 7-Eleven for cash proceeds of $21.38 billion. This transaction resulted in a pretax gain of $11.68 billion ($8.02 billion after income taxes) after deducting the book value of the net assets and certain other adjustments. We utilized a portion of the Speedway sale proceeds to structurally reduce debt and the remaining proceeds are included in our liquidity as cash and cash equivalents and short-term investments.
Because of the alternatives available to us, including internally generated cash flow and access to capital markets and a commercial paper program, we believe that our short-term and long-term liquidity is adequate to fund not only our current operations, but also our near-term and long-term funding requirements, including capital spending programs, the repurchase of shares of our common stock, dividend payments, defined benefit plan contributions, repayment of debt maturities and other amounts that may ultimately be paid in connection with contingencies.
MPC intends to redeem of all of the $1.25 billion outstanding aggregate principal amount of MPC's 4.5% senior notes due May 1, 2023 and the $850 million outstanding aggregate principal amount of MPC’s 4.75% senior notes due December 15, 2023, including the portion of such notes for which Andeavor LLC, a wholly-owned subsidiary of MPC, is the obligor. The notes are expected to be redeemed on December 2, 2021, at a price equal to par, plus a make-whole premium calculated in accordance with the terms of the senior notes and accrued and unpaid interest to, but not including, the redemption date. MPC expects to fund the redemption amount with cash on hand.
Effective June 18, 2021, we terminated our $1.0 billion unsecured 364-day revolving credit facility due in September 2021 and on June 23, 2021, we reduced the capacity under our trade receivables securitization facility from $750 million to $100 million. On September 30, 2021, we entered into a new trade receivables securitization agreement with a lender, which provides for a $100 million trade receivables securitization facility. This facility replaces our previous trade receivables securitization facility that expired on July 16, 2021.
As of September 30, 2021, $1.61 billion is recorded as an income tax receivable in other current assets, $388 million was utilized to offset our third quarter cash tax payment obligation to the IRS, and $302 million has been recorded as an offset to our accrued taxes due in the fourth quarter of 2021. Additionally, on October 8, 2021, MPC received $1.55 billion of the refund from the IRS and expects to receive the remaining income tax receivable of $59 million in the first half of 2022.
We have a commercial paper program that allows us to have a maximum of $2.0 billion in commercial paper outstanding. We do not intend to have outstanding commercial paper borrowings in excess of available capacity under our bank revolving credit facility. At September 30, 2021, we had no borrowings outstanding under the commercial paper program.
The MPC credit agreement and trade receivables facility contain representations and warranties, affirmative and negative covenants and events of default that we consider usual and customary for agreements of these types. The financial covenant included in the MPC credit agreement requires us to maintain, as of the last day of each fiscal quarter, a ratio of Consolidated Net Debt to Total Capitalization (as defined in the MPC credit agreements) of no greater than 0.65 to 1.00. As of September 30, 2021, we were in compliance with the covenants contained in the MPC bank revolving credit facility and our trade receivables facility, including the financial covenant with a ratio of Consolidated Net Debt to Total Capitalization of 0.13 to 1.00.
Our intention is to maintain an investment-grade credit profile. As of September 30, 2021, the credit ratings on our senior unsecured debt are as follows.
| Company | Rating Agency | Rating | ||||||
| MPC | Moody’s | Baa2 (stable outlook) | ||||||
| Standard & Poor’s | BBB (negative outlook) | |||||||
| Fitch | BBB (stable outlook) |
The ratings reflect the respective views of the rating agencies. There can be no assurance that these ratings will continue for any given period of time. The ratings may be revised or withdrawn entirely by the rating agencies if, in their respective judgments, circumstances so warrant.
The MPC credit agreement does not contain credit rating triggers that would result in the acceleration of interest, principal or other payments in the event that our credit ratings are downgraded. However, any downgrades of our senior unsecured debt could increase the applicable interest rates, yields and other fees payable thereunder and may limit our flexibility to obtain financing in the future, including to refinance existing indebtedness. In addition, a downgrade of our senior unsecured debt rating to below investment-grade levels could, under certain circumstances, impact our ability to purchase crude oil on an unsecured basis and could result in us having to post letters of credit under existing transportation services or other agreements.
See Note 19 to the unaudited consolidated financial statements for further discussion of our debt.
MPLX
MPLX’s liquidity totaled $3.67 billion at September 30, 2021 consisting of:
| September 30, 2021 | ||||||||||||||||||||
| (In millions) | Total Capacity | Outstanding Borrowings | Available Capacity | |||||||||||||||||
| MPLX LP - bank revolving credit facility | $ | 3,500 | $ | — | $ | 3,500 | ||||||||||||||
| MPC intercompany loan agreement | 1,500 | 1,370 | 130 | |||||||||||||||||
| Total | $ | 5,000 | $ | 1,370 | $ | 3,630 | ||||||||||||||
| Cash and cash equivalents | 39 | |||||||||||||||||||
| Total liquidity | $ | 3,669 |
On September 3, 2021 MPLX redeemed, at par value, all of the $1 billion aggregate principal amount of floating rate senior notes due September 2022. MPLX primarily funded the redemption with borrowings under the MPC intercompany loan agreement.
The MPLX credit agreement contains certain representations and warranties, affirmative and restrictive covenants and events of default that we consider to be usual and customary for an agreement of this type. The financial covenant requires MPLX to maintain a ratio of Consolidated Total Debt as of the end of each fiscal quarter to Consolidated EBITDA (both as defined in the MPLX credit agreement) for the prior four fiscal quarters of no greater than 5.0 to 1.0 (or 5.5 to 1.0 during the six-month period following certain acquisitions). Consolidated EBITDA is subject to adjustments for certain acquisitions completed and capital projects undertaken during the relevant period. Other covenants restrict MPLX and/or certain of its subsidiaries from incurring debt, creating liens on assets and entering into transactions with affiliates. As of September 30, 2021, MPLX was in compliance with the covenants, including the financial covenant with a ratio of Consolidated Total Debt to Consolidated EBITDA of 3.64 to 1.0.
Our intention is to maintain an investment-grade credit profile for MPLX. As of September 30, 2021, the credit ratings on MPLX’s senior unsecured debt are as follows.
| Company | Rating Agency | Rating | ||||||
| MPLX | Moody’s | Baa2 (stable outlook) | ||||||
| Standard & Poor’s | BBB (negative outlook) | |||||||
| Fitch | BBB (stable outlook) |
The ratings reflect the respective views of the rating agencies. There can be no assurance that these ratings will continue for any given period of time. The ratings may be revised or withdrawn entirely by the rating agencies if, in their respective judgments, circumstances so warrant.
The agreements governing MPLX’s debt obligations do not contain credit rating triggers that would result in the acceleration of interest, principal or other payments in the event that MPLX credit ratings are downgraded. However, any downgrades of MPLX senior unsecured debt to below investment grade ratings could increase the applicable interest rates, yields and other fees payable under such agreements. In addition, a downgrade of MPLX senior unsecured debt ratings to below investment-grade levels may limit MPLX’s ability to obtain future financing, including to refinance existing indebtedness.
See Note 19 to the unaudited consolidated financial statements for further discussion of MPLX’s debt.
Capital Requirements
Capital Investment Plan
MPC's capital investment plan for 2021 totals approximately $1.4 billion for capital projects and investments, excluding capitalized interest, potential acquisitions and MPLX’s capital investment plan. MPC’s capital investment plan includes all of the planned capital spending for Refining & Marketing and Corporate, as well as a portion of the planned capital investments in Midstream and Speedway’s capital spending through the close of the sale on May 14, 2021, which is now reported separately as discontinued operations. The remainder of the planned capital spending for Midstream reflects the capital investment plan for MPLX. The plan, which initially reflected a total of $1.0 billion, is currently estimated to be approximately $650 million. We continuously evaluate our capital investment plan and make changes as conditions warrant.
Capital expenditures and investments for MPC and MPLX are summarized below.
| Nine Months Ended September 30, | ||||||||||||||
| (In millions) | 2021 | 2020 | ||||||||||||
| Capital expenditures and investments:(a) | ||||||||||||||
| MPC continuing operations, excluding MPLX | ||||||||||||||
| Refining & Marketing | $ | 538 | $ | 995 | ||||||||||
| Midstream - Other | 42 | 193 | ||||||||||||
| Corporate and Other(b) | 72 | 61 | ||||||||||||
| Total MPC continuing operations, excluding MPLX | $ | 652 | $ | 1,249 | ||||||||||
| MPC discontinued operations - Speedway | $ | 177 | $ | 200 | ||||||||||
| Midstream - MPLX | $ | 464 | $ | 1,006 |
(a) Capital expenditures exclude changes in capital accruals.
(b) Excludes capitalized interest of $48 million and $85 million for the nine months ended September 30, 2021 and 2020, respectively.
Capital expenditures and investments in affiliates during the nine months ended September 30, 2021, were primarily for Refining & Marketing and Midstream segment projects. Major Refining & Marketing projects include the conversion of the Martinez facility from a petroleum refinery to a renewable fuels manufacturing facility, the South Texas Asset Repositioning project, which is intended to optimize operations and reduce costs at our Galveston Bay refinery, and other projects that we expect will help us reduce future operating costs.
Major Midstream projects primarily include gas gathering and processing projects in the Marcellus and Southwest regions, the expansion of crude gathering systems, and the reversal of the Capline crude pipeline.
Other Capital Requirements
During the nine months ended September 30, 2021, we contributed $801 million to our funded pension plans. During the third quarter of 2021, we made a $575 million voluntary pension contribution. We may choose to make additional contributions to our pension plans.
On October 27, 2021, our board of directors approved a dividend of $0.58 per share on common stock. The dividend is payable December 10, 2021, to shareholders of record as of the close of business on November 17, 2021.
On November 2, 2021, MPLX declared a cash distribution for the third quarter of 2021, totaling $1.31 billion, or $1.28 per common unit, consisting of a base quarterly distribution amount of $0.7050 per common unit and a special distribution amount of $0.5750 per common unit. This distribution will be paid on November 19, 2021 to common unitholders of record on November 12, 2021. MPC’s portion of this distribution is approximately $829 million.
We may, from time to time, repurchase our senior notes in the open market, in tender offers, in privately-negotiated transactions or otherwise in such volumes, at such prices and upon such other terms as we deem appropriate.
Share Repurchases
In connection with the Speedway sale, our board of directors approved an additional $7.1 billion share repurchase authorization bringing total share repurchase authorizations to $10.0 billion prior to the completion of the June tender offer discussed below.
During the third quarter of 2021, MPC repurchased approximately 16 million shares of its common stock at an average cost per share of $58.78 and paid $928 million of cash, with an additional $50 million of cash paid in early October in connection with the settlement of certain late September repurchases.
During the second quarter of 2021, MPC completed a modified Dutch auction tender offer, purchasing 15,573,365 shares of its common stock at a purchase price of $63.00 per share, for an aggregate purchase price of approximately $981 million, excluding fees and expenses related to the tender offer.
Since January 1, 2012, our board of directors has approved $25.05 billion in total share repurchase authorizations and we have repurchased a total of $17.01 billion of our common stock.
During the nine months ended September 30, 2021, MPLX repurchased 17,563,855 MPLX common units at an average cost per unit of $26.79 and paid $465 million of cash, with an additional $5 million of cash paid in early October in connection with the settlement of certain late September purchases. As of September 30, 2021, $497 million remained available under the authorization for future unit repurchases.
We may utilize various methods to effect the repurchases, which could include open market repurchases, negotiated block transactions, tender offers, accelerated share repurchases or open market solicitations for shares, some of which may be effected through Rule 10b5-1 plans. The timing and amount of future repurchases, if any, will depend upon several factors, including market and business conditions, and such repurchases may be discontinued at any time.
Contractual Cash Obligations
As of September 30, 2021, our contractual cash obligations included long-term debt, capital and operating lease obligations, purchase obligations and other long-term liabilities. During the first nine months of 2021, our long-term debt commitments decreased approximately $5.28 billion primarily due to the repayment of $1.3 billion of MPC senior notes, net repayment of $1.0 billion under the MPC commercial paper program, the redemption of $1.75 billion of MPLX senior notes and net repayment of $175 million under the MPLX revolving credit facility.
During the first nine months of 2021, we terminated a transportation services agreement with a total commitment of approximately $560 million through the year 2028. There were no other material changes to our contractual cash obligations outside the ordinary course of business since December 31, 2020.
Off-Balance Sheet Arrangements
Off-balance sheet arrangements comprise those arrangements that may potentially impact our liquidity, capital resources and results of operations, even though such arrangements are not recorded as liabilities under GAAP. Our off-balance sheet arrangements are limited to indemnities and guarantees that are described below. Although these arrangements serve a variety of our business purposes, we are not dependent on them to maintain our liquidity and capital resources, and we are not aware of any circumstances that are reasonably likely to cause the off-balance sheet arrangements to have a material adverse effect on our liquidity and capital resources.
We have provided various guarantees related to equity method investees. These arrangements are described in Note 24 to the unaudited consolidated financial statements.
ENVIRONMENTAL MATTERS AND COMPLIANCE COST****S
We have incurred and may continue to incur substantial capital, operating and maintenance, and remediation expenditures as a result of environmental laws and regulations. If these expenditures, as with all costs, are not ultimately reflected in the prices of our products and services, our operating results will be adversely affected. We believe that substantially all of our competitors must comply with similar environmental laws and regulations. However, the specific impact on each competitor may vary depending on a number of factors, including the age and location of its operating facilities, marketing areas, production processes and whether it is also engaged in the petrochemical business or the marine transportation of crude oil and refined products.
There have been no significant changes to our environmental matters and compliance costs during the nine months ended September 30, 2021.
CRITICAL ACCOUNTING ESTIMATES
As of September 30, 2021, there have been no significant changes to our critical accounting estimates since our Annual Report on Form 10-K for the year ended December 31, 2020.
ACCOUNTING STANDARDS NOT YET ADOPTED
We have not identified any recent accounting pronouncements that are expected to have a material impact on our financial condition, results of operations or cash flows upon adoption.
Previous: Item 1. FINANCIAL STATEMENTS · Next: Item 3. QUANTITATIVE AND QUALITATIVE DISCLOSURES ABOUT MARKET RISK