 filings.tools
Item 7. Management’s Discussion and Analysis of Financial Condition and Results of Operations
128K characters. Original on sec.gov · Markdown
Item 7. Management’s Discussion and Analysis of Financial Condition and Results of Operations
The following discussion and analysis of the financial condition and results of operations of Nasdaq refers to the year-over-year comparison for the fiscal years ended December 31, 2023 and December 31, 2022 and should be read in conjunction with our consolidated financial statements and related notes included in this Form 10-K, as well as the discussion under “Item 1A. Risk Factors.” For further discussion of our growth strategy, products and services, and competitive strengths, see “Item 1. Business.”
Discussion of fiscal year 2022 items and the year-over year comparison of changes in our financial condition and results of operations as of and for the fiscal years ended December 31, 2022 and December 31, 2021 can be found in Part II, “Item 7. Management’s Discussion and Analysis of Financial Condition and Results of Operations” of our Annual Report on Form 10-K for the fiscal year ended December 31, 2022, which was previously filed with the SEC on February 23, 2023. For the Financial Technology segment, which was impacted by the new divisional structure subsequent to the Adenza acquisition, the comparisons presented in this discussion and analysis also include the year-over-year comparison of results of operations for the fiscal years ended December 31, 2022 and December 31, 2021.
Business Segments
Our organizational structure aligns our businesses with the foundational shifts that are driving the evolution of the global financial system. Following the acquisition of Adenza, we further refined the divisional structure into Capital Access Platforms, Financial Technology and Market Services reportable segments. All prior periods have been restated to conform to the current period presentation. See Note 1, “Organization and Nature of Operations,” and Note 19, “Business Segments,” to the consolidated financial statements for further discussion of our reportable segments and geographic data, as well as how management allocates resources, assesses performance and manages these businesses as three separate segments. See “Part I, Item 1. Business” for additional discussion on recent developments and highlights.
Nasdaq’s Operating Results
The following tables summarize our financial performance for the year ended December 31, 2023 compared to the same period in 2022 and for the year ended December 31, 2022 when compared to the same period in 2021. The comparability of our results of operations between reported periods is impacted by the acquisition of Adenza in November 2023. See “2023 Acquisition,” of Note 4, “Acquisitions,” to the consolidated financial statements for further discussion. For a detailed discussion of our results of operations, see “Segment Operating Results” below.
| Year Ended December 31, | Percentage Change | ||||||||||||||||||||||
| 2023 | 2022 | 2021 | 2023 vs. 2022 | 2022 vs. 2021 | |||||||||||||||||||
| (in millions, except per share amounts) | |||||||||||||||||||||||
| Revenues less transaction-based expenses | $ | 3,895 | $ | 3,582 | $ | 3,420 | 8.7 | % | 4.7 | % | |||||||||||||
| Operating expenses | 2,317 | 2,018 | 1,979 | 14.8 | % | 2.0 | % | ||||||||||||||||
| Operating income | 1,578 | 1,564 | 1,441 | 0.9 | % | 8.5 | % | ||||||||||||||||
| Net income attributable to Nasdaq | $ | 1,059 | $ | 1,125 | $ | 1,187 | (5.9) | % | (5.2) | % | |||||||||||||
| Diluted earnings per share | $ | 2.08 | $ | 2.26 | $ | 2.35 | (8.0) | % | (3.8) | % | |||||||||||||
| Cash dividends declared per common share | $ | 0.86 | $ | 0.78 | $ | 0.70 | 10.3 | % | 11.4 | % |
In countries with currencies other than the U.S. dollar, revenues and expenses are translated using monthly average exchange rates. Impacts on our revenues less transaction-based expenses and operating income associated with fluctuations in foreign currency are discussed in more detail under “Item 7A. Quantitative and Qualitative Disclosures about Market Risk.”
The following chart summarizes our ARR (in millions):
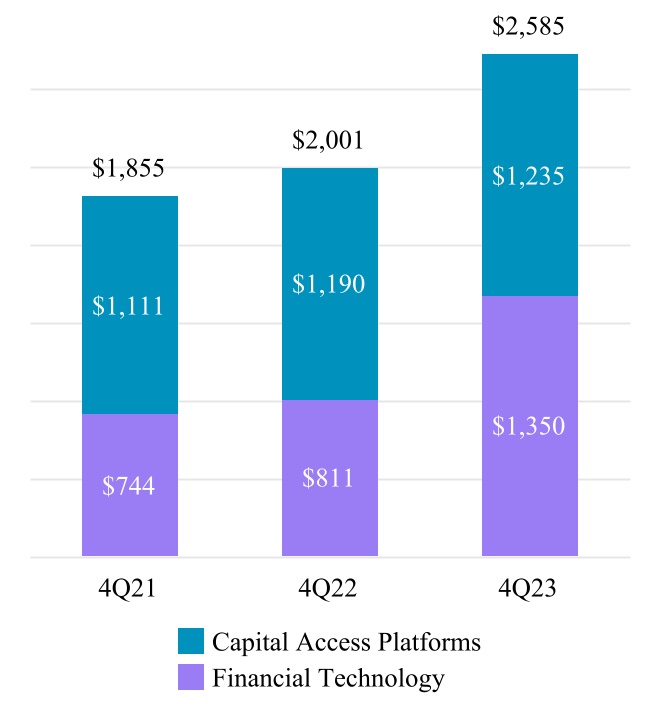
ARR for a given period is the current annualized value derived from subscription contracts with a defined contract value. This excludes contracts that are not recurring, are one-time in nature, or where the contract value fluctuates based on defined metrics. ARR is currently one of our key performance metrics to assess the health and trajectory of our recurring business. ARR does not have any standardized definition and is therefore unlikely to be comparable to similarly titled measures presented by other companies. ARR should be viewed independently of revenue and deferred revenue and is not intended to be combined with or to replace either of those items. For Adenza recurring revenue contracts, the amount included in ARR is consistent with the amount that we invoice the customer during the current period. Additionally, for Adenza recurring revenue contracts that include annual values that increase over time, we include in ARR only the annualized value of components of the contract that are considered active as of the date of the ARR calculation. We do not include the future committed increases in the contract value as of the date of the ARR calculation. ARR is not a forecast and the active contracts at the end of a reporting period used in calculating ARR may or may not be extended or renewed by our customers.
The ARR chart includes:
| ▪ | Proprietary market data subscriptions and annual listing fees within our Data & Listing Services business, index data subscriptions and guaranteed minimum on futures contracts within our Index business and subscription contracts under our Workflow & Insights business. | |||||||
| ▪ | SaaS subscription and support contracts related to Verafin, surveillance, market technology, AxiomSL, Calypso and trade management services, excluding one-time service requests. |
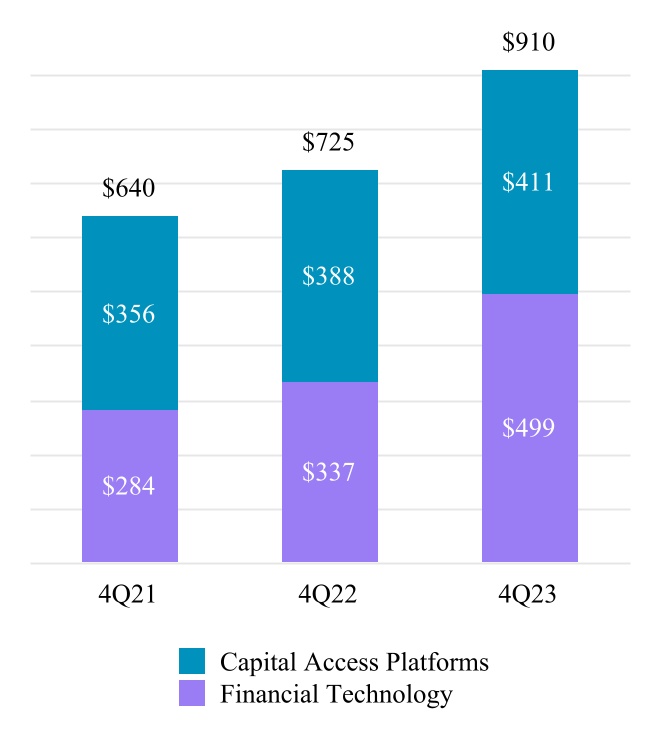
The following chart summarizes our quarterly annualized SaaS revenues for Solutions, which comprises our Capital Access Platforms and Financial Technology segments, for December 31, 2023, 2022 and 2021 (in millions):
Segment Operating Results
The following table presents our revenues by segment:
| Year Ended December 31, | Percentage Change | ||||||||||||||||||||||||||||
| 2023 | 2022 | 2021 | 2023 vs. 2022 | 2022 vs. 2021 | |||||||||||||||||||||||||
| (in millions) | |||||||||||||||||||||||||||||
| Capital Access Platforms | $1,770 | $1,682 | $1,566 | 5.2 | % | 7.4 | % | ||||||||||||||||||||||
| Financial Technology | 1,099 | 864 | 772 | 27.2 | % | 11.9 | % | ||||||||||||||||||||||
| Market Services, net | 987 | 988 | 1,005 | (0.1) | % | (1.7) | % | ||||||||||||||||||||||
| Other revenues | 39 | 48 | 77 | (18.8) | % | (37.7) | % | ||||||||||||||||||||||
| Total revenues less transaction-based expenses | $ | 3,895 | $ | 3,582 | $ | 3,420 | 8.7 | % | 4.7 | % |
The following chart presents our Capital Access Platforms, Financial Technology and Market Services segments as a percentage of our total revenues, less transaction-based expenses. 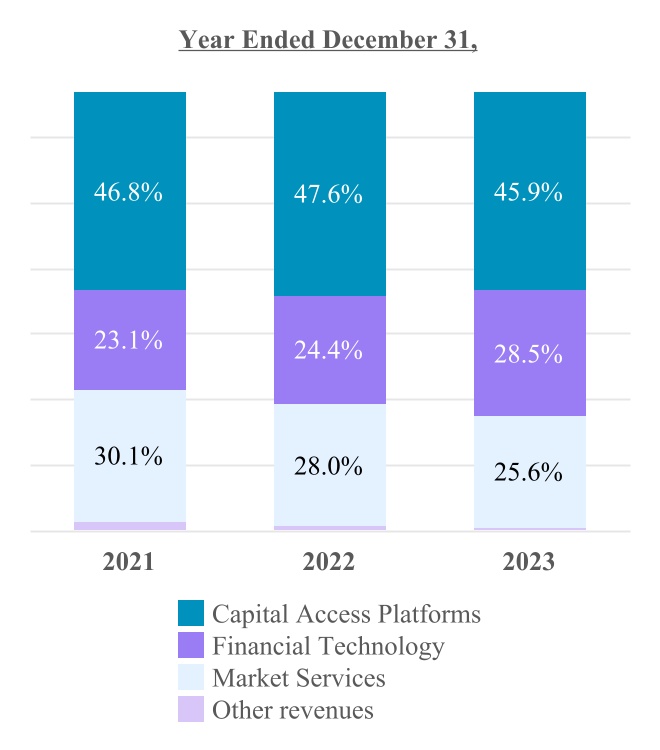
CAPITAL ACCESS PLATFORMS
The following table presents revenues from our Capital Access Platforms segment:
| Year Ended December 31, | Percentage Change | |||||||||||||||||||||||||
| 2023 | 2022 | 2021 | 2023 vs. 2022 | 2022 vs. 2021 | ||||||||||||||||||||||
| (in millions) | ||||||||||||||||||||||||||
| Data & Listing Services | $ | 749 | $ | 727 | $ | 678 | 3.0 | % | 7.2 | % | ||||||||||||||||
| Index | 528 | 486 | 459 | 8.6 | % | 5.9 | % | |||||||||||||||||||
| Workflow & Insights | 493 | 469 | 429 | 5.1 | % | 9.3 | % | |||||||||||||||||||
| Total Capital Access Platforms | $ | 1,770 | $ | 1,682 | $ | 1,566 | 5.2 | % | 7.4 | % |
Data & Listing Services Revenues
The following table presents key drivers from our Data & Listing Services business:
| Year Ended December 31, | ||||||||||||||||||||
| 2023 | 2022 | 2021 | ||||||||||||||||||
| IPOs | ||||||||||||||||||||
| The Nasdaq Stock Market - operating companies | 103 | 87 | 319 | |||||||||||||||||
| The Nasdaq Stock Market - SPACs | 27 | 74 | 433 | |||||||||||||||||
| Exchanges that comprise Nasdaq Nordic and Nasdaq Baltic | 7 | 38 | 174 | |||||||||||||||||
| Total new listings | ||||||||||||||||||||
| The Nasdaq Stock Market | 330 | 366 | 1,000 | |||||||||||||||||
| Exchanges that comprise Nasdaq Nordic and Nasdaq Baltic | 23 | 63 | 207 | |||||||||||||||||
| Number of listed companies | ||||||||||||||||||||
| The Nasdaq Stock Market | 4,044 | 4,230 | 4,178 | |||||||||||||||||
| Exchanges that comprise Nasdaq Nordic and Nasdaq Baltic | 1,218 | 1,251 | 1,235 | |||||||||||||||||
| As of December 31, | ||||||||||||||||||||
| 2023 | 2022 | 2021 | ||||||||||||||||||
| ARR (in millions) | $ | 682 | $ | 664 | $ | 627 |
In the tables above:
-
Number of total listed companies on The Nasdaq Stock Market for the years ended December 31, 2023, 2022 and 2021 included 600, 528 and 441 ETPs, respectively.
-
IPOs, new listings (which includes IPOs) and total listed companies for exchanges that comprise Nasdaq Nordic and Nasdaq Baltic represent companies listed on the Nasdaq Nordic and Nasdaq Baltic exchanges and companies on the alternative markets of Nasdaq First North.
Data & Listing Services revenues increased in 2023 compared with 2022 primarily due to an increase in proprietary data revenues driven largely by higher international demand and annual listing fee growth, partially offset by lower initial listings fees.
Index Revenues
The following table presents key drivers from our Index business:
| As of or Three Months Ended December 31, | ||||||||||||||||||||
| 2023 | 2022 | 2021 | ||||||||||||||||||
| Number of licensed ETPs | 388 | 379 | 362 | |||||||||||||||||
| TTM change in period end ETP AUM tracking Nasdaq indices (in billions) | ||||||||||||||||||||
| Beginning balance | $ | 315 | $ | 424 | $ | 359 | ||||||||||||||
| Net appreciation (depreciation) | 128 | (142) | 83 | |||||||||||||||||
| Net impact of ETP sponsor switches | (1) | (1) | (92) | |||||||||||||||||
| Net inflows | 31 | 34 | 74 | |||||||||||||||||
| Ending balance | $ | 473 | $ | 315 | $ | 424 | ||||||||||||||
| Quarterly average ETP AUM tracking Nasdaq indices (in billions) | $ | 436 | $ | 326 | $ | 400 | ||||||||||||||
| ARR | $ | 72 | $ | 68 | $ | 67 |
In the table above, TTM represents trailing twelve months.
Index revenues increased in 2023 compared with 2022 primarily due to higher AUM in exchange traded products linked to Nasdaq indices.
Workflow & Insights Revenues
The following table presents key drivers from our Workflow & Insights business:
| As of or Three Months Ended December 31 | |||||||||||||||||
| 2023 | 2022 | 2021 | |||||||||||||||
| (in millions) | |||||||||||||||||
| ARR | $ | 481 | $ | 458 | $ | 417 | |||||||||||
| Quarterly annualized SaaS revenues | 411 | 388 | 356 |
Workflow & Insights revenues increased in 2023 compared with 2022 due to an increase in both analytics and corporate solutions revenues. The increase in analytics revenues was primarily due to the growth in our eVestment and Solovis product offerings. The increase in our corporate solutions revenues was primarily due to continued demand for our ESG solutions.
FINANCIAL TECHNOLOGY
The following table presents revenues from our Financial Technology segment:
| Year Ended December 31, | Percentage Change | |||||||||||||||||||||||||
| 2023 | 2022 | 2021 | 2023 vs. 2022 | 2022 vs. 2021 | ||||||||||||||||||||||
| (in millions) | ||||||||||||||||||||||||||
| Financial Crime Management Technology | $ | 223 | $ | 176 | $ | 104 | 26.7 | % | 69.2 | % | ||||||||||||||||
| Regulatory Technology | 212 | 130 | 127 | 63.1 | % | 2.4 | % | |||||||||||||||||||
| Capital Markets Technology | 664 | 558 | 541 | 19.0 | % | 3.1 | % | |||||||||||||||||||
| Total Financial Technology | $ | 1,099 | $ | 864 | $ | 772 | 27.2 | % | 11.9 | % | ||||||||||||||||
Financial Crime Management Technology Revenues
The following table presents key drivers for Financial Crime Management Technology business:
| As of or Twelve Months Ended December 31, | ||||||||||||||||||||||||||
| 2023 | 2022 | 2021 | ||||||||||||||||||||||||
| (in millions) | ||||||||||||||||||||||||||
| ARR | $ | 226 | $ | 182 | $ | 149 | ||||||||||||||||||||
| Quarterly annualized SaaS revenues | 226 | 182 | 149 |
Financial Crime Management Technology revenues increased in 2023 compared with 2022 and 2022 compared with 2021 due to an increase in demand related to new sales to existing clients and new customer acquisitions. The 2022 increase was also driven by a $28 million purchase price adjustment from the Verafin acquisition on deferred revenue in 2021 and the inclusion of a full year of Verafin revenues in 2022.
Regulatory Technology Revenues
The following table presents key drivers for Regulatory Technology business:
| As of or Twelve Months Ended December 31, | ||||||||||||||||||||||||||
| 2023 | 2022 | 2021 | ||||||||||||||||||||||||
| (in millions) | ||||||||||||||||||||||||||
| ARR | $ | 325 | $ | 130 | $ | 120 | ||||||||||||||||||||
| Quarterly annualized SaaS revenues | 165 | 116 | 104 |
Regulatory Technology revenues increased in 2023 compared with 2022 primarily due to the inclusion of revenues from our acquisition of Adenza and strong performance from our surveillance offerings in new sales to existing clients and new customer acquisitions. The strong performance of our surveillance offerings was also the key driver of the increase in 2022 compared with 2021.
Capital Markets Technology Revenues
The following table presents key drivers for Capital Markets Technology business:
| As of or Three Months Ended December 30, | ||||||||||||||||||||
| 2023 | 2022 | 2021 | ||||||||||||||||||
| (in millions) | ||||||||||||||||||||
| ARR | $ | 799 | $ | 499 | $ | 475 | ||||||||||||||
| Quarterly annualized SaaS revenues | 108 | 39 | 31 | |||||||||||||||||
Capital Markets Technology revenues increased in 2023 compared with 2022 and 2022 compared with 2021. The increase in 2023 was primarily due to the inclusion of revenues from our acquisition of Adenza, higher trade management services revenues mainly driven by demand for colocation and connectivity services and higher market technology revenues due to higher support revenues and higher professional services fees. The increase in 2022 was primarily due to higher trade management services revenues associated with increased demand for connectivity services, partially offset by lower market technology revenues. The decrease in market technology revenues in 2022 was due to the successful completion of long-term contracts in 2021 and the unfavorable impact of changes in foreign exchange rates of $10 million, partially offset by growth in SaaS-based revenues.
MARKET SERVICES
The following table presents revenues from our Market Services segment:
| Year Ended December 31, | Percentage Change | |||||||||||||||||||||||||
| 2023 | 2022 | 2021 | 2023 vs. 2022 | 2022 vs. 2021 | ||||||||||||||||||||||
| (in millions) | ||||||||||||||||||||||||||
| Market Services | $ | 3,156 | $ | 3,632 | $ | 3,471 | (13.1) | % | 4.6 | % | ||||||||||||||||
| Transaction-based expenses: | ||||||||||||||||||||||||||
| Transaction rebates | (1,838) | (2,092) | (2,168) | (12.1) | % | (3.5) | % | |||||||||||||||||||
| Brokerage, clearance and exchange fees | (331) | (552) | (298) | (40.0) | % | 85.2 | % | |||||||||||||||||||
| Total Market Services, net | $ | 987 | $ | 988 | $ | 1,005 | (0.1) | % | (1.7) | % |
Our Market Services segment includes equity derivatives trading, cash equity trading, Nordic fixed income trading & clearing, U.S. Tape plans and other revenues. The following tables present net revenues by product from our Market Services segment:
| Year Ended December 31, | Percentage Change | |||||||||||||||||||||||||
| 2023 | 2022 | 2021 | 2023 vs. 2022 | 2022 vs. 2021 | ||||||||||||||||||||||
| (in millions) | ||||||||||||||||||||||||||
| U.S. Equity Derivative Trading | $ | 374 | $ | 371 | $ | 343 | 0.8 | % | 8.2 | % | ||||||||||||||||
| Cash Equity Trading | 397 | 397 | 429 | — | % | (7.5) | % | |||||||||||||||||||
| U.S. Tape plans | 141 | 149 | 155 | (5.4) | % | (3.9) | % | |||||||||||||||||||
| Other | 75 | 71 | 78 | 5.6 | % | (9.0) | % | |||||||||||||||||||
| Total Market Services, net | $ | 987 | $ | 988 | $ | 1,005 | (0.1) | % | (1.7) | % |
In the table above, Other includes Nordic fixed income trading & clearing, Nordic derivatives and Canadian cash equities trading.
U.S. Equity Derivative Trading
The following tables present total revenues, transaction-based expenses, and total revenues less transaction-based expenses as well as key drivers from our U.S. Equity Derivative Trading business:
| Year Ended December 31, | Percentage Change | |||||||||||||||||||||||||
| 2023 | 2022 | 2021 | 2023 vs. 2022 | 2022 vs. 2021 | ||||||||||||||||||||||
| (in millions) | ||||||||||||||||||||||||||
| U.S. Equity Derivative Trading Revenues | $ | 1,257 | $ | 1,252 | $ | 1,367 | 0.4 | % | (8.4) | % | ||||||||||||||||
| Section 31 fees | 55 | 89 | 32 | (38.2) | % | 178.1 | % | |||||||||||||||||||
| Transaction-based expenses: | ||||||||||||||||||||||||||
| Transaction rebates | (879) | (878) | (1,018) | 0.1 | % | (13.8) | % | |||||||||||||||||||
| Section 31 fees | (55) | (89) | (32) | (38.2) | % | 178.1 | % | |||||||||||||||||||
| Brokerage and clearance fees | (4) | (3) | (6) | 33.3 | % | (50.0) | % | |||||||||||||||||||
| U.S. Equity derivative trading revenues, net | $ | 374 | $ | 371 | $ | 343 | 0.8 | % | 8.2 | % |
Section 31 fees are recorded as U.S. equity derivative and cash equity trading revenues with a corresponding amount recorded in transaction-based expenses. We are assessed these fees from the SEC and pass them through to our customers in the form of incremental fees. Pass-through fees can increase or decrease due to rate changes by the SEC, our percentage of the overall industry volumes processed on our systems, and differences in actual dollar value traded. Section 31 fees decreased in 2023 compared with 2022 primarily due to lower average SEC fee rates. Since the amount recorded in revenues is equal to the amount recorded as Section 31 fees, there is no impact on our net revenues.
| Year Ended December 31, | |||||||||||||||||
| 2023 | 2022 | 2021 | |||||||||||||||
| U.S. equity options | |||||||||||||||||
| Total industry average daily volume (in millions) | 40.4 | 38.2 | 37.2 | ||||||||||||||
| Nasdaq PHLX matched market share | 11.3 | % | 11.6 | % | 12.4 | % | |||||||||||
| The Nasdaq Options Market matched market share | 6.1 | % | 8.0 | % | 8.1 | % | |||||||||||
| Nasdaq BX Options matched market share | 3.3 | % | 2.8 | % | 1.4 | % | |||||||||||
| Nasdaq ISE Options matched market share | 5.9 | % | 5.7 | % | 6.6 | % | |||||||||||
| Nasdaq GEMX Options matched market share | 2.4 | % | 2.3 | % | 4.3 | % | |||||||||||
| Nasdaq MRX Options matched market share | 2.0 | % | 1.6 | % | 1.6 | % | |||||||||||
| Total matched market share executed on Nasdaq’s exchanges | 31.0 | % | 32.0 | % | 34.4 | % |
U.S. equity derivative trading revenues, transaction rebates, in which we credit a portion of the execution charge to the market participant, and U.S. equity derivative trading revenues less transaction-based expenses remained relatively flat in 2023 compared with 2022 primarily due to higher industry trading volumes, partially offset by lower overall matched market share executed on Nasdaq’s exchanges and lower gross capture rate.
Cash Equity Trading Revenues
The following tables present total revenues, transaction-based expenses, and total revenues less transaction-based expenses as well as key drivers and other metrics from our Cash Equity Trading business:
| Year Ended December 31, | Percentage Change | ||||||||||||||||||||||||||||
| 2023 | 2022 | 2021 | 2023 vs. 2022 | 2022 vs. 2021 | |||||||||||||||||||||||||
| (in millions) | |||||||||||||||||||||||||||||
| Cash Equity Trading Revenues | $ | 1,355 | $ | 1,605 | 1,578 | (15.6) | % | 1.7 | % | ||||||||||||||||||||
| Section 31 fees | 253 | 436 | 229 | (42.0) | % | 90.4 | % | ||||||||||||||||||||||
| Transaction-based expenses: | |||||||||||||||||||||||||||||
| Transaction rebates | (939) | (1,184) | (1,118) | (20.7) | % | 5.9 | % | ||||||||||||||||||||||
| Section 31 fees | (253) | (436) | (229) | (42.0) | % | 90.4 | % | ||||||||||||||||||||||
| Brokerage and clearance fees | (19) | (24) | (31) | (20.8) | % | (22.6) | % | ||||||||||||||||||||||
| Cash equity trading revenues, net | $ | 397 | $ | 397 | $ | 429 | — | % | (7.5) | % |
See the discussion in "U.S. Equity Derivative Trading" for an explanation of Section 31 fees for 2023 as compared to 2022. Since the amount recorded in revenues is equal to the amount recorded as Section 31 fees, there is no impact on our net revenues.
| Year Ended December 31, | |||||||||||||||||
| 2023 | 2022 | 2021 | |||||||||||||||
| Total U.S.-listed securities | |||||||||||||||||
| Total industry average daily share volume (in billions) | 11.0 | 11.9 | 11.4 | ||||||||||||||
| Matched share volume (in billions) | 455.6 | 522.8 | 491.9 | ||||||||||||||
| The Nasdaq Stock Market matched market share | 15.8 | % | 16.2 | % | 15.8 | % | |||||||||||
| Nasdaq BX matched market share | 0.4 | % | 0.5 | % | 0.6 | % | |||||||||||
| Nasdaq PSX matched market share | 0.3 | % | 0.8 | % | 0.7 | % | |||||||||||
| Total matched market share executed on Nasdaq’s exchanges | 16.5 | % | 17.5 | % | 17.1 | % | |||||||||||
| Market share reported to the FINRA/Nasdaq Trade Reporting Facility | 36.7 | % | 35.2 | % | 34.9 | % | |||||||||||
| Total market share | 53.2 | % | 52.7 | % | 52.0 | % | |||||||||||
| Nasdaq Nordic and Nasdaq Baltic securities | |||||||||||||||||
| Average daily number of equity trades executed on Nasdaq’s exchanges | 666,411 | 908,813 | 1,036,523 | ||||||||||||||
| Total average daily value of shares traded (in billions) | $ | 4.5 | $ | 5.4 | $ | 6.4 | |||||||||||
| Total market share executed on Nasdaq’s exchanges | 71.0 | % | 71.5 | % | 76.9 | % |
In the tables above, total market share includes transactions executed on The Nasdaq Stock Market’s, Nasdaq BX’s and Nasdaq PSX’s systems plus trades reported through the FINRA/Nasdaq Trade Reporting Facility.
Cash equity trading revenues decreased in 2023 compared with 2022 primarily due to lower industry trading volumes, lower overall U.S. matched market share executed on Nasdaq’s exchanges, as well as lower gross capture rates.
Cash equity trading revenues less transaction-based expenses remained flat in 2023 compared with 2022 primarily due to lower industry trading volumes and lower overall U.S. matched market share executed on Nasdaq’s exchanges, partially offset by higher U.S. capture rate.
Transaction rebates decreased in 2023 compared with 2022. For The Nasdaq Stock Market and Nasdaq PSX, we credit a portion of the per share execution charge to the market participant that provides the liquidity, and for Nasdaq BX, we credit a portion of the per share execution charge to the market participant that takes the liquidity. The decrease was primarily due to lower rebate capture rate, lower U.S.
industry volumes, and lower U.S. matched market share executed on Nasdaq's exchanges.
U.S. Tape Plans
The following table presents revenues from our U.S. Tape plans business:
| Year Ended December 31, | Percentage Change | |||||||||||||||||||||||||
| 2023 | 2022 | 2021 | 2023 vs. 2022 | 2022 vs. 2021 | ||||||||||||||||||||||
| (in millions) | ||||||||||||||||||||||||||
| U.S. Tape plans | $ | 141 | $ | 149 | $ | 155 | (5.4) | % | (3.9) | % |
U.S. Tape plans revenues decreased in 2023 compared with 2022 primarily due to lower market share and usage.
Other
Other includes Nordic fixed income trading and clearing, Nordic derivatives and Canadian cash equities trading. The following tables present revenue and a key driver from our Other business:
| Year Ended December 31, | Percentage Change | |||||||||||||||||||||||||
| 2023 | 2022 | 2021 | 2023 vs. 2022 | 2022 vs. 2021 | ||||||||||||||||||||||
| (in millions) | ||||||||||||||||||||||||||
| Other | $ | 75 | $ | 71 | $ | 78 | 5.6 | % | (9.0) | % |
In the table above, other includes transaction rebates of $20 million, $30 million, and $32 million in 2023, 2022, and 2021 respectively.
| Year Ended December 31, | |||||||||||||||||
| 2023 | 2022 | 2021 | |||||||||||||||
| Nasdaq Nordic and Nasdaq Baltic options and futures | |||||||||||||||||
| Total average daily volume of options and futures contracts | 301,320 | 296,626 | 287,182 |
In the tables above, Nasdaq Nordic and Nasdaq Baltic total average daily volume of options and futures contracts include Finnish option contracts traded on Eurex for which Nasdaq and Eurex have a revenue sharing arrangement.
Other revenues increased in 2023 compared with 2022 primarily due to increased revenues in our Nordic derivatives trading, higher collateral management services revenues, partially offset by lower revenue from Canadian cash equities trading.
OTHER REVENUES
For the years ended December 31, 2023, 2022 and 2021, other revenues include revenues related to our European power trading and clearing business, following our announcement in June 2023 to sell this business to the European Energy Exchange, subject to regulatory approval. Prior to June 2023, these revenues were included in our Market Services and Capital Access Platforms segments. Also for the years ended December 31, 2023, 2022 and 2021, other revenues include a transitional services agreement associated with a divested business. For the year ended December 31, 2022 and 2021, other revenues also include
revenues related to our Nordic broker services business for which we completed the wind-down in June 2022. Prior to June 2022, these revenues were included in our Market Services segment. Additionally, for the year ended December 31, 2021, other revenues include revenues associated with the NPM business which we contributed in July 2021 to a standalone, independent company, of which we own the largest minority interest, together with a consortium of third-party financial institutions. Prior to July 2021, these revenues were included in our Capital Access Platforms segment.
EXPENSES
Operating Expenses
The following table presents our operating expenses:
| Year Ended December 31, | Percentage Change | ||||||||||||||||||||||||||||
| 2023 | 2022 | 2021 | 2023 vs. 2022 | 2022 vs. 2021 | |||||||||||||||||||||||||
| (in millions) | |||||||||||||||||||||||||||||
| Compensation and benefits | $ | 1,082 | $ | 1,003 | $ | 938 | 7.9% | 6.9% | |||||||||||||||||||||
| Professional and contract services | 128 | 140 | 144 | (8.6)% | (2.8)% | ||||||||||||||||||||||||
| Computer operations and data communications | 233 | 207 | 186 | 12.6% | 11.3% | ||||||||||||||||||||||||
| Occupancy | 129 | 104 | 109 | 24.0% | (4.6)% | ||||||||||||||||||||||||
| General, administrative and other | 113 | 125 | 85 | (9.6)% | 47.1% | ||||||||||||||||||||||||
| Marketing and advertising | 47 | 51 | 57 | (7.8)% | (10.5)% | ||||||||||||||||||||||||
| Depreciation and amortization | 323 | 258 | 278 | 25.2% | (7.2)% | ||||||||||||||||||||||||
| Regulatory | 34 | 33 | 64 | 3.0% | (48.4)% | ||||||||||||||||||||||||
| Merger and strategic initiatives | 148 | 82 | 87 | 80.5% | (5.7)% | ||||||||||||||||||||||||
| Restructuring charges | 80 | 15 | 31 | 433.3% | (51.6)% | ||||||||||||||||||||||||
| Total operating expenses | $ | 2,317 | $ | 2,018 | $ | 1,979 | 14.8% | 2.0% |
The increase in compensation and benefits expense for the year ended December 31, 2023 compared with the same period in 2022 was primarily driven by increased headcount. The increase in the year ended December 31, 2023 was partially offset by a favorable impact from foreign exchange rates of $12 million.
Headcount, including employees of non-wholly owned consolidated subsidiaries, increased to 8,525 employees as of December 31, 2023 from 6,377 as of December 31, 2022, primarily due to our acquisition of Adenza.
Professional and contract services expense decreased in 2023 compared with 2022 primarily due to reduced consulting costs and reduced legal fees.
Computer operations and data communications expense increased in 2023 compared with 2022 primarily due to higher costs related to our cloud initiatives.
Occupancy expense increased in 2023 compared with 2022 primarily due to a review of our real estate and facility capacity requirements due to our new and evolving work models initiated in the first quarter of 2023. As a result of this ongoing review, for the year ended December 31, 2023, we recorded $18 million in impairment charges and exit related costs following the abandonment of leased office space.
General, administrative and other expense decreased in 2023 compared with the same period in 2022 primarily due to an insurance recovery related to a legal matter in 2023 and a loss on extinguishment of debt recorded in 2022.
Marketing and advertising expense decreased in 2023 compared with 2022 primarily due to lower client incentives resulting from lower IPO activity.
Depreciation and amortization expense increased in 2023 compared with 2022 primarily due to an increase in amortization due to the intangible assets acquired as part of the Adenza acquisition.
Regulatory expense remained relatively flat in 2023 compared with 2022.
We have pursued various strategic initiatives and completed acquisitions and divestitures in recent years, which have resulted in expenses which would not have otherwise been incurred. These expenses generally include integration costs, as well as legal, due diligence and other third-party transaction costs and vary based on the size and frequency of the activities described above. The increase for the year ended December 31, 2023 compared with 2022 primarily reflects higher expenses related to the Adenza acquisition.
Restructuring charges increased in 2023 compared with 2022 as a result of charges from our 2022 divisional alignment program as well as the launch of our 2023 Adenza restructuring program. See Note 20, “Restructuring Charges,” to the consolidated financial statements for further discussion. By 2025, we expect to achieve benefits of the 2022 divisional alignment program through combined annual run-rate operating efficiencies and revenue synergies of approximately $30 million annually. We expect to achieve $80 million of net expense synergies two years following the closing of the Adenza acquisition.
Non-operating Income and Expenses
The following table presents our non-operating income and expenses:
| Year Ended December 31, | Percentage Change | |||||||||||||||||||||||||
| 2023 | 2022 | 2021 | 2023 vs. 2022 | 2022 vs. 2021 | ||||||||||||||||||||||
| (in millions) | ||||||||||||||||||||||||||
| Interest income | $ | 115 | $ | 7 | $ | 1 | 1,542.9 | % | 600.0 | % | ||||||||||||||||
| Interest expense | (284) | (129) | (125) | 120.2 | % | 3.2 | % | |||||||||||||||||||
| Net interest expense | (169) | (122) | (124) | 38.5 | % | (1.6) | % | |||||||||||||||||||
| Net gain on divestiture of business | — | — | 84 | — | % | (100.0) | % | |||||||||||||||||||
| Other income (loss) | (1) | 2 | 81 | (150.0) | % | (97.5) | % | |||||||||||||||||||
| Net income (loss) from unconsolidated investees | (7) | 31 | 52 | (122.6) | % | (40.4) | % | |||||||||||||||||||
| Total non-operating income (expenses) | $ | (177) | $ | (89) | $ | 93 | 98.9 | % | (195.7) | % |
The following table presents our interest expense:
| Year Ended December 31, | Percentage Change | |||||||||||||||||||||||||
| 2023 | 2022 | 2021 | 2023 vs. 2022 | 2022 vs. 2021 | ||||||||||||||||||||||
| (in millions) | ||||||||||||||||||||||||||
| Interest expense on debt | $ | 272 | $ | 120 | $ | 115 | 126.7 | % | 4.3 | % | ||||||||||||||||
| Accretion of debt issuance costs and debt discount | 9 | 7 | 7 | 28.6 | % | — | % | |||||||||||||||||||
| Other fees | 3 | 2 | 3 | 50.0 | % | (33.3) | % | |||||||||||||||||||
| Interest expense | $ | 284 | $ | 129 | $ | 125 | 120.2 | % | 3.2 | % |
Interest income increased in 2023 compared with 2022 primarily due to a higher average cash balance during the period between the issuance of the senior unsecured notes in June 2023 and the closing of the Adenza acquisition, and an increase in interest rates.
Interest expense increased in 2023 compared with 2022 primarily due to debt issued in June 2023 to finance the Adenza acquisition as well as an increase in interest rates. See “Financing of the Adenza Acquisition,” of Note 9, “Debt Obligations,” to the consolidated financial statements for further discussion.
The net gain on divestiture of business in 2021 relates to the sale of our U.S. Fixed Income business, which was part of our FICC business within our Market Services segment. We recognized a pre-tax gain on the sale of $84 million, net of disposal costs.
Other income (loss) primarily represents realized and unrealized gains and losses from strategic investments related to our corporate venture program.
Net income (loss) from unconsolidated investees decreased in 2023 compared with 2022 primarily due to lower income recognized from our equity method investments in OCC and NPM. See “Equity Method Investments,” of Note 6, “Investments,” to the consolidated financial statements for further discussion.
Tax Matters
The following table presents our income tax provision and effective tax rate:
| Year Ended December 31, | Percentage Change | |||||||||||||||||||||||||
| 2023 | 2022 | 2021 | 2023 vs. 2022 | 2022 vs. 2021 | ||||||||||||||||||||||
| (in millions) | ||||||||||||||||||||||||||
| Income tax provision | $ | 344 | $ | 352 | $ | 347 | (2.3) | % | 1.4 | % | ||||||||||||||||
| Effective tax rate | 24.6 | % | 23.9 | % | 22.6 | % |
For further discussion of our tax matters, see Note 17, “Income Taxes,” to the consolidated financial statements.
NON-GAAP FINANCIAL MEASURES
In addition to disclosing results determined in accordance with U.S. GAAP, we also provide non-GAAP net income attributable to Nasdaq and non-GAAP diluted earnings per share in this Annual Report on Form 10-K. Management uses this non-GAAP information internally, along with U.S. GAAP information, in evaluating our performance and in making financial and operational decisions. We believe our presentation of these measures provides investors with greater transparency and supplemental data relating to our financial condition and results of operations. In addition, we believe the presentation of these measures is useful to investors for period-to-period comparisons of our ongoing operating performance.
These measures are not in accordance with, or an alternative to, U.S. GAAP, and may be different from non-GAAP measures used by other companies. In addition, other companies, including companies in our industry, may calculate such measures differently, which reduces their usefulness as comparative measures. Investors should not rely on any single financial measure when evaluating our business. This non-GAAP information should be considered as supplemental in nature and is not meant as a substitute for our operating results in accordance with U.S. GAAP. We recommend investors review the U.S. GAAP financial measures included in this Annual Report on Form 10-K, including our consolidated financial statements and the notes thereto. When viewed in conjunction with our U.S. GAAP results and the accompanying reconciliation, we believe these non-GAAP measures provide greater transparency and a more complete understanding of factors affecting our business than U.S. GAAP measures alone.
We understand that analysts and investors regularly rely on non-GAAP financial measures, such as non-GAAP net income attributable to Nasdaq and non-GAAP diluted earnings per share, to assess operating performance. We use non-GAAP net income attributable to Nasdaq and non-GAAP diluted earnings per share because they highlight trends more clearly in our business that may not otherwise be apparent when relying solely on U.S. GAAP financial measures, since these measures eliminate from our results specific financial items that have less bearing on our ongoing operating performance. We believe that excluding the following items from the non-GAAP net income attributable to Nasdaq provides a more meaningful analysis of Nasdaq’s ongoing operating performance and comparisons in Nasdaq’s performance between periods:
*•*Amortization expense of acquired intangible assets: We amortize intangible assets acquired in connection with various acquisitions. Intangible asset amortization expense can vary from period to period due to episodic acquisitions completed, rather than from our ongoing business operations. As such, if intangible asset amortization is included in performance measures, it is more difficult to assess the day-to-day operating performance of the businesses and the relative operating performance of the businesses between periods.
*•*Merger and strategic initiatives expense: We have pursued various strategic initiatives and completed acquisitions and divestitures in recent years that have resulted in expenses which would not have otherwise been incurred. The frequency and the amount of such expenses vary significantly based on the size, timing and complexity of the transaction. These expenses primarily include integration costs, as well as legal, due diligence and other third-party transaction costs. The increase for the year ended December 31, 2023 compared to 2022 primarily reflects costs related to the Adenza acquisition.
*•*Restructuring charges: In the fourth quarter of 2023, following the closing of the Adenza acquisition, our management approved, committed to and initiated a restructuring program, “Adenza Restructuring” to optimize our efficiencies as a combined organization. In October 2022, following our September 2022 announcement to realign our segments and leadership, we initiated a divisional alignment program with a focus on realizing the full potential of this structure. In 2019, we initiated the transition of certain technology platforms to advance our strategic opportunities as a technology and analytics provider and continue the realignment of certain business areas. The 2019 restructuring plan was completed in June 2021. See Note 20, “Restructuring Charges,” to the consolidated financial statements for further discussion of our 2023 Adenza restructuring program, our 2022 divisional alignment program and our 2019 restructuring plan.
-
Net loss (income) from unconsolidated investees: We exclude our share of the earnings and losses of our equity method investments, primarily our equity interest in OCC and NPM. This provides a more meaningful analysis of Nasdaq’s ongoing operating performance or comparisons in Nasdaq’s performance between periods. See “Equity Method Investments,” of Note 6, “Investments,” to the consolidated financial statements for further discussion.
-
Other items: We have excluded certain other charges or gains, including certain tax items, that are the result of other non-comparable events to measure operating performance. We believe the exclusion of such amounts allows management and investors to better understand the ongoing financial results of Nasdaq. Other significant items include:
**◦**Lease asset impairments: For 2023, this includes impairment charges related to our operating lease assets and leasehold improvements associated with vacating certain leased office space, which are recorded in occupancy and depreciation and amortization expense in our Consolidated Statements of Income.
◦Extinguishment of debt: For 2022 and 2021 this includes a loss on extinguishment of debt, which is recorded under general, administrative and other expense in our Consolidated Statements of Income.
◦Legal and regulatory matters: For 2023 and 2022, this includes accruals related to certain legal matters. For 2023, these charges were partially offset by insurance recoveries related to certain legal matters. The charges and related insurance recoveries are recorded in professional and contract services and general, administrative and other expense in the Consolidated Statements of Income. For 2022 and 2021, this also includes a charge related to an administrative fine imposed by the SFSA. related to the clearing default that occurred in 2018. This charge was included in regulatory expense in the Consolidated Statements of Income.
◦Net gain on divestiture of business: For 2021, this represents our pre-tax net gain of $84 million on the sale of our U.S. Fixed Income business.
**◦**Pension settlement charge: For 2023, we terminated our U.S. pension plan and recorded a partial settlement charge under compensation and benefits in the Consolidated Statements of Income. See Note 10, “Retirement Plans,” to the consolidated financial statements for further discussion.
**◦**Other loss (income): For 2023, this includes certain financing costs related to the Adenza acquisition. For 2023, 2022 and 2021 this also includes net gains and losses from strategic investments entered into through our corporate venture program, which are included in other income (loss) in our Consolidated Statements of Income.
*•*Significant tax items: The non-GAAP adjustment to the income tax provision for all periods primarily includes the tax impact of each non-GAAP adjustment. In addition, for the year ended December 31, 2021, the non-GAAP adjustment to the income tax provision includes adjustments related to return-to-provision.
The following tables present reconciliations between U.S. GAAP net income attributable to Nasdaq and diluted earnings per share and non-GAAP net income attributable to Nasdaq and diluted earnings per share:
| Year Ended December 31, | ||||||||||||||
| 2023 | 2022 | 2021 | ||||||||||||
| (in millions, except per share amounts) | ||||||||||||||
| U.S. GAAP net income attributable to Nasdaq | $ | 1,059 | $ | 1,125 | $ | 1,187 | ||||||||
| Non-GAAP adjustments: | ||||||||||||||
| Amortization expense of acquired intangible assets | 206 | 153 | 170 | |||||||||||
| Merger and strategic initiatives expense | 148 | 82 | 87 | |||||||||||
| Restructuring charges | 80 | 15 | 31 | |||||||||||
| Lease asset impairments | 25 | — | — | |||||||||||
| Extinguishment of debt | — | 16 | 33 | |||||||||||
| Net loss (income) from unconsolidated investees | 7 | (29) | (52) | |||||||||||
| Legal and regulatory matters | 12 | 26 | 44 | |||||||||||
| Net gain on divestiture of business | — | — | (84) | |||||||||||
| Pension settlement charge | 9 | — | — | |||||||||||
| Other | 21 | 2 | (82) | |||||||||||
| Total non-GAAP adjustments | 508 | 265 | 147 | |||||||||||
| Total non-GAAP tax adjustments | (134) | (66) | (61) | |||||||||||
| Total non-GAAP adjustments, net of tax | 374 | 199 | 86 | |||||||||||
| Non-GAAP net income attributable to Nasdaq | $ | 1,433 | $ | 1,324 | $ | 1,273 | ||||||||
| U.S. GAAP effective tax rate | 24.6 | % | 23.9 | % | 22.6 | % | ||||||||
| Total adjustments from non-GAAP tax rate | 0.4 | % | 0.1 | % | 1.7 | % | ||||||||
| Non-GAAP effective tax rate | 25.0 | % | 24.0 | % | 24.3 | % | ||||||||
| Weighted-average common shares outstanding for diluted earnings per share | 508.4 | 497.9 | 505.1 | |||||||||||
| U.S. GAAP diluted earnings per share | $ | 2.08 | $ | 2.26 | $ | 2.35 | ||||||||
| Total adjustments from non-GAAP net income | 0.74 | 0.40 | 0.17 | |||||||||||
| Non-GAAP diluted earnings per share | $ | 2.82 | $ | 2.66 | $ | 2.52 |
LIQUIDITY AND CAPITAL RESOURCES
Historically, we have funded our operating activities and met our commitments through cash generated by operations, augmented by the periodic issuance of debt. Currently, our cost and availability of funding remain healthy. We continue to prudently assess our capital deployment strategy through balancing acquisitions, internal investments, debt repayments, and shareholder return activity, including share repurchases and dividends.
We expect that our current cash and cash equivalents combined with cash flows provided by operating activities, supplemented with our borrowing capacity and access to additional financing, including our revolving credit facility and our commercial paper program, provides us additional flexibility to meet our ongoing obligations and the capital deployment strategic actions described above, while allowing us to invest in activities and product development that support the long-term growth of our operations.
Principal factors that could affect the availability of our internally-generated funds include:
-
deterioration of our revenues in any of our business segments;
-
changes in regulatory and working capital requirements; and
-
an increase in our expenses.
Principal factors that could affect our ability to obtain cash from external sources include:
-
operating covenants contained in our credit facilities that limit our total borrowing capacity;
-
credit rating downgrades, which could limit our access to additional debt;
-
a significant decrease in the market price of our common stock; and
-
volatility or disruption in the public debt and equity markets.
The following table summarizes selected measures of our liquidity and capital resources:
| December 31, 2023 | December 31, 2022 | |||||||||||||
| (in millions) | ||||||||||||||
| Cash and cash equivalents | $ | 453 | $ | 502 | ||||||||||
| Financial investments | 188 | 181 | ||||||||||||
| Working capital | 71 | (231) |
Cash and Cash Equivalents
Cash and cash equivalents includes all non-restricted cash in banks and highly liquid investments with original maturities of 90 days or less at the time of purchase. The balance retained in cash and cash equivalents is a function of anticipated or possible short-term cash needs, prevailing interest rates, our investment policy, and alternative investment choices. As of December 31, 2023, our cash and cash equivalents of $453 million were primarily invested in money market funds, commercial paper, municipal bonds and bank deposits.
Repatriation of Cash
Our cash and cash equivalents held outside of the U.S. in various foreign subsidiaries totaled $236 million as of December 31, 2023 and $275 million as of December 31, 2022. The remaining balance held in the U.S. totaled $217 million as of December 31, 2023 and $227 million as of December 31, 2022.
Cash Flow Analysis
The following table summarizes the changes in cash flows:
| Year Ended December 31, | |||||||||||||||||
| 2023 | 2022 | 2021 | |||||||||||||||
| Net cash provided by (used in): | (in millions) | ||||||||||||||||
| Operating activities | $ | 1,696 | $ | 1,706 | $ | 1,083 | |||||||||||
| Investing activities | (5,994) | 49 | (2,653) | ||||||||||||||
| Financing activities | 4,220 | 1,036 | 1,418 |
Net Cash Provided by Operating Activities
Net cash provided by operating activities primarily consists of net income adjusted for certain non-cash items, including depreciation and amortization expense, expense associated with share-based compensation, deferred income taxes and the effects of changes in working capital. Changes in working capital include changes in accounts receivable and deferred revenue which are impacted by the timing of customer billings and related collections from our customers; accounts payable and accrued expenses due to timing of payments; accrued personnel costs, which are impacted by employee performance targets and the timing of payments related to employee bonus incentives; and Section 31 fees payable to the SEC, which is impacted by the changes in SEC fee rates and the timing of collections from customers and payments to the SEC.
Net cash provided by operating activities decreased $10 million for 2023 compared with 2022, excluding the impact of the Adenza acquisition, which is reflected in net cash provided by (used in) investing activities. The decrease was primarily driven by changes in our working capital and timing of various payments and receipts of $(129) million, partially offset by an increase of $119 million driven by the increase in net income adjusted for certain noncash operating activities. The changes in working capital primarily included a decrease in Section 31 fees payable to the SEC, partially offset by lower receivables largely due to a decrease in Section 31 fees receivable as well as timing of collection and an increase in accounts payable and accrued expenses primarily due to an increase in our accrued interest payable from issuances of senior unsecured notes in connection with the Adenza acquisition. Non-cash charges in 2023 primarily included $323 million of depreciation and amortization and $122 million of share-based compensation.
Net Cash Provided by (Used in) Investing Activities
Net cash used in investing activities for the year ended December 31, 2023 primarily related to $5,766 million paid for the acquisition of Adenza, net of cash and cash equivalents acquired, purchases of property and equipment of
$158 million, net purchases of investments related to default funds and margin deposits of $74 million and $3 million from other investing activities, partially offset by proceeds from the sales and redemptions of trading securities, net of $7 million.
Net cash provided by investing activities for the year ended December 31, 2022 primarily related to net proceeds from sales and redemptions of default funds and margin deposits of $211 million and proceeds of $33 million from other investing activities, partially offset by purchases of property and equipment of $152 million and $41 million cash used for acquisitions, net of cash and cash equivalents acquired.
Net Cash Provided by Financing Activities
Net cash provided by financing activities for the year ended December 31, 2023 primarily related to $5,608 million proceeds from issuances of senior unsecured notes and the 2023 Term Loan, in connection with the Adenza acquisition, net of debt issuance costs, partially offset by $441 million of dividend payments to our shareholders, $371 million from repayments of our commercial paper, net, $269 million in repurchases of common stock and $260 million relating to partial repayment of the 2023 Term Loan.
Net cash provided by financing activities for the year ended December 31, 2022 primarily related to an increase in default funds and margin deposits of $2,440 million, proceeds of $541 million from the issuances of long-term-debt and proceeds of $238 million from the issuances of our commercial paper, net, partially offset by $1,097 million related to the repayment of our 2022 and 2024 Notes, $383 million of dividend payments to our shareholders, $325 million of repurchases of common stock pursuant to the ASR agreement and $308 million in other repurchases of common stock.
See Note 4, “Acquisitions,” to the consolidated financial statements for further discussion.
See Note 9, “Debt Obligations,” to the consolidated financial statements for further discussion of our debt obligations.
See “Share Repurchase Program,” and “Cash Dividends on Common Stock,” of Note 12, “Nasdaq Stockholders’ Equity,” to the consolidated financial statements for further discussion of our share repurchase program and cash dividends declared and paid on our common stock.
Financial Investments
Our financial investments totaled $188 million as of December 31, 2023 and $181 million as of December 31, 2022. Of these securities, $168 million as of December 31, 2023 and $161 million as of December 31, 2022 are assets primarily utilized to meet regulatory capital requirements, mainly for our clearing operations at Nasdaq Clearing. See Note 6, “Investments,” to the consolidated financial statements for further discussion.
Regulatory Capital Requirements
Clearing Operations Regulatory Capital Requirements
We are required to maintain minimum levels of regulatory capital for the clearing operations of Nasdaq Clearing. The level of regulatory capital required to be maintained is dependent upon many factors, including market conditions and creditworthiness of the counterparty. As of December 31, 2023, our required regulatory capital of $123 million was primarily comprised of highly rated European government debt securities that are included in financial investments in the Consolidated Balance Sheets.
Broker-Dealer Net Capital Requirements
Our broker-dealer subsidiaries, Nasdaq Execution Services, NFSTX, LLC, and Nasdaq Capital Markets Advisory, are subject to regulatory requirements intended to ensure their general financial soundness and liquidity. These requirements obligate these subsidiaries to comply with minimum net capital requirements. As of December 31, 2023, the combined required minimum net capital totaled $1 million and the combined excess capital totaled $27 million, substantially all of which is held in cash and cash equivalents in the Consolidated Balance Sheets. The required minimum net capital is included in restricted cash and cash equivalents in the Consolidated Balance Sheets.
Nordic and Baltic Exchange Regulatory Capital Requirements
The entities that operate trading venues in the Nordic and Baltic countries are each subject to local regulations and are required to maintain regulatory capital intended to ensure their general financial soundness and liquidity. As of December 31, 2023, our required regulatory capital of $37 million was primarily invested in European government bills and mortgage bonds and Icelandic government bonds that are included in financial investments in the Consolidated Balance Sheets and cash, which is included in restricted cash and cash equivalents in the Consolidated Balance Sheets.
Other Capital Requirements
We operate several other businesses which are subject to local regulation and are required to maintain certain levels of regulatory capital. As of December 31, 2023, other required regulatory capital of $16 million, primarily related to Nasdaq Central Securities Depository, was primarily invested in European government debt securities that are included in financial investments in the Consolidated Balance Sheets.
Equity and dividends
Share Repurchase Program
See “Share Repurchase Program,” of Note 12, “Nasdaq Stockholders’ Equity,” to the consolidated financial statements for further discussion of our share repurchase program.
Cash Dividends on Common Stock
The following table presents our quarterly cash dividends paid per common share on our outstanding common stock:
| 2023 | 2022 | ||||||||||
| First quarter | $ | 0.20 | $ | 0.18 | |||||||
| Second quarter | 0.22 | 0.20 | |||||||||
| Third quarter | 0.22 | 0.20 | |||||||||
| Fourth quarter | 0.22 | 0.20 | |||||||||
| Total | $ | 0.86 | $ | 0.78 |
See “Cash Dividends on Common Stock,” of Note 12, “Nasdaq Stockholders’ Equity,” to the consolidated financial statements for further discussion of the dividends.
Debt Obligations
The following table summarizes our debt obligations by contractual maturity:
| Maturity Date | December 31, 2023 | December 31, 2022 | ||||||||||||||||||
| (in millions) | ||||||||||||||||||||
| Short-term debt: | ||||||||||||||||||||
| Commercial paper | $ | 291 | $ | 664 | ||||||||||||||||
| Total short-term debt | $ | 291 | $ | 664 | ||||||||||||||||
| Long-term debt - senior unsecured notes: | ||||||||||||||||||||
| 2025 Notes | June 2025 | 497 | — | |||||||||||||||||
| 2026 Notes | June 2026 | 499 | 498 | |||||||||||||||||
| 2028 Notes | June 2028 | 991 | — | |||||||||||||||||
| 2029 Notes | March 2029 | 658 | 637 | |||||||||||||||||
| 2030 Notes | February 2030 | 658 | 637 | |||||||||||||||||
| 2031 Notes | January 2031 | 645 | 644 | |||||||||||||||||
| 2032 Notes | February 2032 | 819 | — | |||||||||||||||||
| 2033 Notes | July 2033 | 674 | 653 | |||||||||||||||||
| 2034 Notes | February 2034 | 1,239 | — | |||||||||||||||||
| 2040 Notes | December 2040 | 644 | 644 | |||||||||||||||||
| 2050 Notes | April 2050 | 487 | 486 | |||||||||||||||||
| 2052 Notes | March 2052 | 541 | 541 | |||||||||||||||||
| 2053 Notes | August 2053 | 738 | — | |||||||||||||||||
| 2063 Notes | June 2063 | 738 | — | |||||||||||||||||
| 2023 Term Loan | November 2026 | 339 | — | |||||||||||||||||
| 2022 Revolving Credit Facility | December 2027 | (4) | (5) | |||||||||||||||||
| Total long-term debt | $ | 10,163 | $ | 4,735 | ||||||||||||||||
| Total debt obligations | $ | 10,454 | $ | 5,399 |
For the year ended December 31, 2023, the weighted average interest rate on our debt obligations was approximately 3.5%. This rate can fluctuate based on changes in interest rates for our variable rate debts, changes in foreign currency exchange rates and changes in the amount and duration of outstanding debt.
In December 2022, Nasdaq amended and restated its previously issued $1.25 billion five-year revolving credit facility, with a new maturity date of December 16, 2027. In addition to the 2022 Revolving Credit Facility, we also have other credit facilities primarily to support our Nasdaq Clearing operations in Europe, as well as to provide a cash pool credit line for one subsidiary. These European credit facilities, which are available in multiple currencies, totaled $191 million as of December 31, 2023 and $184 million as of December 31, 2022 in available liquidity, none of which was utilized.
Financing of the Adenza Acquisition
In June 2023, Nasdaq issued six series of notes for total proceeds of $5,016 million, net of debt issuance costs of $38 million, with various maturity dates ranging from 2025 to 2063. During the second half of 2023, we incurred an additional $6 million in debt issuance costs, for a total net proceeds from the issuance of the six series of notes of $5,010 million as of December 31, 2023. The net proceeds from these notes were used to finance the majority of the cash consideration due in connection with the Adenza acquisition.
In addition, in connection with the financing of the Adenza acquisition, we entered into the 2023 Term Loan agreement. The 2023 Term Loan provided us with the ability to borrow up to $600 million to finance a portion of the cash consideration for the Adenza acquisition and other amounts incurred in connection with this transaction. Under the 2023 Term Loan, borrowings bear interest on the principal amount outstanding at a variable interest rate based on the SOFR plus an applicable margin that varies with Nasdaq’s debt rating. On November 1, 2023, we borrowed $599 million, net of fees, under this term loan towards payment of the cash consideration due in connection with the Adenza acquisition. We made a partial repayment during the fourth quarter of $260 million. As of December 31, 2023, we had $339 million outstanding under this term loan.
As of December 31, 2023, we were in compliance with the covenants of all of our debt obligations.
See Note 9, “Debt Obligations,” to the consolidated financial statements for further discussion of our debt obligations.
Contractual Obligations and Contingent Commitments
Nasdaq has contractual obligations to make future payments under debt obligations by contract maturity, minimum rental commitments under non-cancelable operating leases and other obligations. The following table shows these contractual obligations as of December 31, 2023:
| Payments Due by Period | |||||||||||||||||
| (in millions) | Total | <1 year | 1-3 years | 3-5 years | 5+ years | ||||||||||||
| Debt obligation by contractual maturity | $ | 16,759 | $ | 714 | $ | 2,103 | $ | 1,651 | $ | 12,291 | |||||||
| Operating lease obligations | 616 | 84 | 133 | 113 | 286 | ||||||||||||
| Purchase obligations | 442 | 92 | 130 | 92 | 128 | ||||||||||||
| Total | $ | 17,817 | $ | 890 | $ | 2,366 | $ | 1,856 | $ | 12,705 |
In the preceding table:
-
Debt obligations by contractual maturity include both principal and interest obligations. As of December 31, 2023, an interest rate of 4.8% was used to compute the amount of the contractual obligations for interest on the 2022 Revolving Credit Facility and 6.7% was used to compute the amount of the contractual obligations for interest on the 2023 Term Loan. For our Euro denominated notes interest is calculated on an actual basis while all other debt is calculated on a 360-day basis at the contractual fixed rate multiplied by the aggregate principal amount as of December 31, 2023. See Note 9, “Debt Obligations,” to the consolidated financial statements for further discussion.
-
Operating lease obligations represent our undiscounted operating lease liabilities as of December 31, 2023, as well as legally binding minimum lease payments for leases signed but not yet commenced. See Note 16, “Leases,” to the consolidated financial statements for further discussion of our leases.
-
Purchase obligations primarily represent minimum outstanding obligations due under software license agreements, of which the majority relates to our multi-year AWS partnership contract.
Off-Balance Sheet Arrangements
For discussion of off-balance sheet arrangements see:
-
Note 15, “Clearing Operations,” to the consolidated financial statements for further discussion of our non-cash default fund contributions and margin deposits received for clearing operations; and
-
Note 18, “Commitments, Contingencies and Guarantees,” to the consolidated financial statements for further discussion of:
◦Guarantees issued and credit facilities available;
◦Other guarantees; and
◦Routing brokerage activities.
Quantitative and Qualitative Disclosures About Market Risk
As a result of our operating, investing and financing activities, we are exposed to market risks such as interest rate risk and foreign currency exchange rate risk. We are also exposed to credit risk as a result of our normal business activities.
We have implemented policies and procedures to measure, manage, monitor and report risk exposures, which are reviewed regularly by management and the board of directors. We identify risk exposures and monitor and manage such risks on a daily basis.
We perform sensitivity analyses to determine the effects of market risk exposures. We may use derivative instruments solely to hedge financial risks related to our financial positions or risks that are incurred during the normal course of business. We do not use derivative instruments for speculative purposes.
Interest Rate Risk
We are subject to the risk of fluctuating interest rates in the normal course of business. Our exposure to market risk for changes in interest rates relates primarily to our financial investments and debt obligations, which are discussed below.
Financial Investments
As of December 31, 2023, our investment portfolio was primarily comprised of highly rated European government debt securities, which pay a fixed rate of interest. These securities are subject to interest rate risk and the fair value of these securities will decrease if market interest rates increase. If market interest rates were to increase immediately and uniformly by a hypothetical 100 basis points from levels as of December 31, 2023, the fair value of this portfolio would decline by $3 million.
Debt Obligations
As of December 31, 2023, substantially all of our debt obligations were fixed-rate obligations. Interest rates on certain tranches of notes are subject to adjustment to the extent our debt rating is downgraded below investment grade, as further discussed in Note 9, “Debt Obligations,” to the consolidated financial statements. While changes in interest rates will have no impact on the interest we pay on fixed-rate obligations, we are exposed to changes in interest rates as a result of the borrowings under our 2022 Revolving Credit Facility, our commercial paper program and the 2023 Term Loan as these facilities have a variable interest rate. As of December 31, 2023, we have $291 million outstanding borrowings under our commercial paper program and $339 million outstanding under the 2023 Term Loan. A hypothetical 100 basis points increase in interest rates on our outstanding commercial paper and our 2023 Term Loan would increase our annual interest expense by approximately $6 million based on borrowings as of December 31, 2023.
We may utilize interest rate swap agreements to achieve a desired mix of variable and fixed rate debt.
Foreign Currency Exchange Rate Risk
We are subject to foreign currency exchange rate risk. Our primary transactional exposure to foreign currency denominated revenues less transaction-based expenses and operating income for the years ended December 31, 2023 and 2022 are presented in the following tables:
| Euro | Swedish Krona | Canadian Dollar | Other Foreign Currencies | U.S. Dollar | Total | |||||||||||||||||||||||||||||||||
| (in millions, except currency rate) | ||||||||||||||||||||||||||||||||||||||
| Year Ended December 31, 2023 | ||||||||||||||||||||||||||||||||||||||
| Average foreign currency rate to the U.S. dollar | 1.081 | 0.094 | 0.741 | # | N/A | N/A | ||||||||||||||||||||||||||||||||
| Percentage of revenues less transaction-based expenses | 6.6% | 4.0% | 0.8% | 3.0% | 85.6% | 100.0% | ||||||||||||||||||||||||||||||||
| Percentage of operating income | 10.7% | (3.8)% | (7.0)% | (8.3)% | 108.4% | 100.0% | ||||||||||||||||||||||||||||||||
| Impact of a 10% adverse currency fluctuation on revenues less transaction-based expenses | $(26) | $(15) | $(3) | $(12) | $— | |||||||||||||||||||||||||||||||||
| Impact of a 10% adverse currency fluctuation on operating income | $(17) | $(6) | $(11) | $(13) | $— |
| Euro | Swedish Krona | Canadian Dollar | Other Foreign Currencies | U.S. Dollar | Total | |||||||||||||||||||||||||||||||||||||||
| (in millions, except currency rate) | ||||||||||||||||||||||||||||||||||||||||||||
| Year Ended December 31, 2022 | ||||||||||||||||||||||||||||||||||||||||||||
| Average foreign currency rate to the U.S. dollar | 1.054 | 0.099 | 0.768 | # | N/A | N/A | ||||||||||||||||||||||||||||||||||||||
| Percentage of revenues less transaction-based expenses | 6.2% | 5.1% | 0.9% | 3.2% | 84.6% | 100.0% | ||||||||||||||||||||||||||||||||||||||
| Percentage of operating income | 10.1% | (2.8)% | (5.9)% | (4.7)% | 103.3% | 100.0% | ||||||||||||||||||||||||||||||||||||||
| Impact of a 10% adverse currency fluctuation on revenues less transaction-based expenses | $(22) | $(18) | $(3) | $(12) | $— | |||||||||||||||||||||||||||||||||||||||
| Impact of a 10% adverse currency fluctuation on operating income | $(16) | $(4) | $(9) | $(8) | $— | |||||||||||||||||||||||||||||||||||||||
__________
Represents multiple foreign currency rates.
N/A Not applicable.
The adverse impacts shown above should be viewed individually by currency and not in aggregate due to the correlation between changes in exchanges rates for certain currencies.
Our investments in foreign subsidiaries are exposed to volatility in currency exchange rates through translation of the foreign subsidiaries’ net assets or equity to U.S. dollars. Substantially all of our foreign subsidiaries operate in functional currencies other than the U.S. dollar. The financial statements of these subsidiaries are translated into U.S. dollars for consolidated reporting using a current rate of exchange, with net gains or losses recorded in accumulated other comprehensive loss within stockholders’ equity in the Consolidated Balance Sheets.
Our primary exposure to net assets in foreign currencies as of December 31, 2023 is presented in the following table:
| Net Assets | Impact of a 10% Adverse Currency Fluctuation | |||||||||||||
| (in millions) | ||||||||||||||
| Swedish Krona | $ | 3,012 | $ | 301 | ||||||||||
| Norwegian Krone | 144 | 14 | ||||||||||||
| British Pound | 140 | 14 | ||||||||||||
| Canadian Dollar | 102 | 10 | ||||||||||||
| Australian Dollar | 96 | 10 | ||||||||||||
| Euro | 60 | 6 |
In the table above, Swedish Krona includes goodwill of $2,230 million and intangible assets, net of $498 million.
Credit Risk
Credit risk is the potential loss due to the default or deterioration in credit quality of customers or counterparties. We are exposed to credit risk from third parties, including customers, counterparties and clearing agents. These parties may default on their obligations to us due to bankruptcy, lack of liquidity, operational failure or other reasons. We limit our exposure to credit risk by evaluating the counterparties with which we make investments and execute agreements. For our investment portfolio, our objective is to invest in securities to preserve principal while maximizing yields, without significantly increasing risk. Credit risk associated with investments is minimized substantially by ensuring that these financial assets are placed with governments which have investment grade ratings, well-capitalized financial institutions and other creditworthy counterparties.
Our subsidiary, Nasdaq Execution Services, may be exposed to credit risk due to the default of trading counterparties in connection with the routing services it provides for our trading customers. System trades in cash equities routed to other market centers for members of our cash equity exchanges are routed by Nasdaq Execution Services for clearing to the NSCC. In this function, Nasdaq Execution Services is to be neutral by the end of the trading day, but may be exposed to intraday risk if a trade extends beyond the trading day and into the next day, thereby leaving Nasdaq Execution Services susceptible to counterparty risk in the period between accepting the trade and routing it to the clearinghouse. In this interim period, Nasdaq Execution Services is not novating like a clearing broker but instead is subject to the short-term risk of counterparty failure before
the clearinghouse enters the transaction. Once the clearinghouse officially accepts the trade for novation, Nasdaq Execution Services is legally removed from trade execution risk. However, Nasdaq has membership obligations to NSCC independent of Nasdaq Execution Services’ arrangements.
Pursuant to the rules of the NSCC and Nasdaq Execution Services’ clearing agreement, Nasdaq Execution Services is liable for any losses incurred due to a counterparty or a clearing agent’s failure to satisfy its contractual obligations, either by making payment or delivering securities. Adverse movements in the prices of securities that are subject to these transactions can increase our credit risk. However, we believe that the risk of material loss is limited, as Nasdaq Execution Services’ customers are not permitted to trade on margin and NSCC rules limit counterparty risk on self-cleared transactions by establishing credit limits and capital deposit requirements for all brokers that clear with NSCC. Historically, Nasdaq Execution Services has never incurred a liability due to a customer’s failure to satisfy its contractual obligations as counterparty to a system trade. Credit difficulties or insolvency, or the perceived possibility of credit difficulties or insolvency, of one or more larger or visible market participants could also result in market-wide credit difficulties or other market disruptions.
We have credit risk related to transaction and subscription-based revenues that are billed to customers on a monthly or quarterly basis, in arrears. Our potential exposure to credit losses on these transactions is represented by the receivable balances in our Consolidated Balance Sheets. We review and evaluate changes in the status of our counterparties’ creditworthiness. Credit losses such as those described above could adversely affect our consolidated financial position and results of operations.
We also are exposed to credit risk through our clearing operations with Nasdaq Clearing. See Note 15, “Clearing Operations,” to the consolidated financial statements for further discussion. Our clearinghouse holds material amounts of clearing member cash deposits, which are held or invested primarily to provide security of capital while minimizing credit, market and liquidity risks. While we seek to achieve a reasonable rate of return, we are primarily concerned with preservation of capital and managing the risks associated with these deposits. As the clearinghouse may pass on interest revenues (minus costs) to the members, this could include negative or reduced yield due to market conditions. The following is a summary of the risks associated with these deposits and how these risks are mitigated.
*•*Credit Risk. When the clearinghouse has the ability to hold cash collateral at a central bank, the clearinghouse utilizes its access to the central bank system to minimize credit risk exposures. When funds are not held at a central bank, we seek to substantially mitigate credit risk by ensuring that investments are primarily placed in large, highly rated financial institutions, highly rated government debt instruments and other creditworthy counterparties.
*•*Liquidity Risk. Liquidity risk is the risk a clearinghouse may not be able to meet its payment obligations in the right currency, in the right place and the right time. To mitigate this risk, the clearinghouse monitors liquidity requirements closely and maintains funds and assets in a manner which minimizes the risk of loss or delay in the access by the clearinghouse to such funds and assets. For example, holding funds with a central bank where possible or investing in highly liquid government debt instruments serves to reduce liquidity risks.
*•*Interest Rate Risk. Interest rate risk is the risk that interest rates rise causing the value of purchased securities to decline. If we were required to sell securities prior to maturity, and interest rates had risen, the sale of the securities might be made at a loss relative to the latest market price. Our clearinghouse seeks to manage this risk by making short term investments of members’ cash deposits. In addition, the clearinghouse investment guidelines allow for direct purchases or repurchase agreements with short dated maturities of high quality sovereign debt (for example, European government and U.S. Treasury securities), central bank certificates and multilateral development bank debt instruments.
*•*Security Issuer Risk. Security issuer risk is the risk that an issuer of a security defaults on its payment when the security matures. This risk is mitigated by limiting allowable investments and collateral under reverse repurchase agreements to high quality sovereign, government agency or multilateral development bank debt instruments.
Critical Accounting Policies and Estimates
The preparation of financial statements and related disclosures in conformity with U.S. GAAP requires management to make judgments, assumptions, and estimates that affect the amounts reported in the consolidated financial statements and accompanying notes. Note 2, “Summary of Significant Accounting Policies,” to the consolidated financial statements describes the significant accounting policies and methods used in the preparation of the consolidated financial statements. The accounting policies described below are significantly affected by critical accounting estimates. Such accounting policies require significant judgments, assumptions, and estimates used in the preparation of the consolidated financial statements, and actual results could differ materially from the amounts reported based on these policies.
Revenue Recognition
As part of our market technology product offering, we enter into certain long-term contracts with customers to develop customized technology solutions, license the right to use software and provide support and other services to our customers which results in these contracts containing multiple performance obligations. We allocate the contract transaction price to each performance obligation using our best estimate of the standalone selling price of each distinct
good or service in the contract. In instances where standalone selling price is not directly observable, such as when we do not sell the product or service separately, we determine the standalone selling price predominantly through an expected cost plus a margin approach.
We generally recognize revenue over time as our customers simultaneously receive and consume the benefits provided by our performance because our customer controls the asset for which we are creating, our performance does not create an asset with alternative use, and we have a right to payment for performance completed to date. For these services, we recognize revenue over time using costs incurred to date relative to total estimated costs at completion to measure progress toward satisfying our performance obligation. Incurred costs represent work performed, which corresponds with, and thereby depicts, the transfer of control to the customer.
Accounting for our long-term contracts requires judgment relative to assessing risks and their impact on the estimate of revenues and costs. Our estimates are impacted by factors such as the potential for schedule and technical issues, productivity and the complexity of work performed. Revenue and cost estimates for our long-term contracts are reviewed and reassessed at least quarterly. When adjustments in estimated total contract costs are required, any changes in the estimated revenues from prior estimates are recognized in the current period for the effect of such change. If estimates of total costs to be incurred on a contract exceed estimates of total revenues, a provision for the entire estimated loss on the contract is recorded in the period in which the loss is determined.
Due to the significance of judgment in the estimation process, as discussed above, changes in assumptions and estimates may adversely or positively affect financial performance in future periods.
For further discussion related to recognition of these revenues, see “Revenue From Contracts with Customers - Revenue Recognition - Market Technology,” of Note 2, “Summary of Significant Accounting Policies,” to the consolidated financial statements.
Business combination
We account for business acquisitions under the acquisition method of accounting. The assets acquired and liabilities assumed in connection with business acquisitions are recorded at the date of acquisition at their estimated fair values, with any excess of the purchase price over the estimated fair values of the net assets acquired recorded as goodwill. Within one year from the date of acquisition, we may update the value allocated to the assets acquired and liabilities assumed, and the resulting goodwill balance, based on information received regarding the valuation of such assets and liabilities that was not available at the time of purchase.
We use various methods to determine fair value depending on the type of assets acquired and liabilities assumed. We make estimates and assumptions about projected future cash flows including, but not limited to, forecasted revenue, cash flows, attrition rates, long term growth rates, royalty rates, EBITDA margin and discount rates.
Significant judgment is required in estimating the fair value of assets acquired and liabilities assumed and in assigning useful lives to certain definite-lived intangible and tangible assets. Accordingly, we may engage third-party valuation specialists to assist in these determinations. The fair value estimates are based on available information as of the acquisition date and assumptions deemed reasonable by management but are inherently uncertain.
See Note 4, “Acquisitions,” to the consolidated financial statements for further discussion of the Adenza Acquisition.
During 2023, 2022 and 2021, we have not recorded any material measurement period adjustments to purchase price allocations.
Goodwill, Indefinite-Lived Intangible Assets and Related Impairment Testing
Goodwill represents the excess of purchase price over the value assigned to the net assets, including identifiable intangible assets, of a business acquired. Goodwill is allocated to our reporting units based on the assignment of the fair values of each reporting unit of the acquired company. We recognize specifically identifiable intangibles, such as customer relationships, technology, exchange and clearing registrations, trade names and licenses when a specific right or contract is acquired. Goodwill and intangible assets deemed to have indefinite useful lives, primarily exchange and clearing registrations, are not amortized but instead are tested for impairment at least annually as of October 1 and more frequently whenever events or changes in circumstances indicate that the fair value of the asset may be less than its carrying amount, such as changes in the business climate, poor indicators of operating performance or the sale or disposition of a significant portion of a reporting unit.
In November 2023, following the acquisition of Adenza, we refined our divisional structure. Our three previous reportable segments, Market Platforms, Capital Access Platforms and Anti-Financial Crime, have been changed to align with our new corporate structure that includes the following three segments: Capital Access Platforms, Financial Technology and Market Services. Under ASC 350-20, “Intangibles Goodwill and Other,” when a company reorganizes its reporting structure, an impairment test must be performed both before and after the change, and goodwill must be reassigned to reporting units. Accordingly, goodwill was reassigned based on relative fair value of each reporting unit.
We perform our goodwill impairment test at the reporting unit level. For 2023, we performed the goodwill impairment test under our previous organizational structure which included three reporting units: Market Platforms, Capital Access Platforms and Anti-Financial Crime segments and under our current organization structure, which includes the following three reporting units: Capital Access Platforms, Financial Technology and Market Services segments.
When testing goodwill and indefinite-lived intangible assets for impairment, we have the option of first performing a qualitative assessment to determine whether it is more likely than not that the fair value of a reporting unit or indefinite-lived intangible asset is less than their respective carrying amounts as the basis to determine if it is necessary to perform a quantitative impairment test. If we choose not to complete a qualitative assessment, or if the initial assessment indicates that it is more likely than not that the carrying amount of a reporting unit or the carrying amount of an indefinite-lived intangible asset exceeds their respective estimated fair values, a quantitative test is required. Our decision to perform a qualitative impairment assessment in a given year is influenced by a number of factors, including but not limited to, the size of the reporting unit’s goodwill, the significance of the excess of the reporting unit’s estimated fair value or the indefinite-lived intangible asset’s fair value over their respective carrying amounts at the last quantitative assessment date, and the amount of time in between quantitative fair value assessments.
In performing a quantitative impairment test, we compare the fair value of each reporting unit and indefinite-lived intangible asset with their respective carrying amounts. The fair value of each reporting unit is estimated using a combination of a discounted cash flow valuation, which incorporates assumptions regarding future growth rates, terminal values, and discount rates, as well as guideline public company valuations, which incorporates relevant trading multiples of comparable companies and other factors. The estimates and assumptions used consider historical performance and are consistent with the assumptions used in determining future profit plans for each reporting unit, which are approved by our board of directors. The fair value of indefinite-lived intangible assets is primarily determined on the basis of estimated discounted value, using the Greenfield Approach for exchange and clearing registrations and licenses, and the relief from royalty approach or excess earnings approach for trade names, both of which incorporate assumptions regarding future revenue projections and discount rates. If the carrying amounts of the reporting unit or the indefinite-lived intangible asset exceed their respective fair values, an impairment charge is recognized in an amount equal to the difference, limited to the total amount of goodwill allocated to that reporting unit or the total carrying value of the indefinite-lived intangible asset.
The following table presents the balances of goodwill for our reportable segments pre-segment realignment at the time of our 2023 annual impairment test:
| October 1, 2023 | |||||
| (in millions) | |||||
| Market Platforms | $ | 2,845 | |||
| Capital Access Platforms | 4,138 | ||||
| Anti-Financial Crime | 1,005 | ||||
| $ | 7,988 |
The following table presents the balances of goodwill for our reportable segments post segment realignment, excluding the goodwill acquired as part of the Adenza acquisition. The carrying value of goodwill was reassigned to our new reportable segments based on a relative fair value allocation approach.
| October 1, 2023 | |||||
| (in millions) | |||||
| Capital Access Platforms | $ | 4,138 | |||
| Financial Technology | 1,922 | ||||
| Market Services | 1,928 | ||||
| $ | 7,988 |
In 2023 and 2022, we elected to perform a quantitative impairment test for goodwill and indefinite-lived intangible assets. In conducting the quantitative assessment, we determined that the fair value of our goodwill for each of our reporting units and the fair value of our indefinite-lived intangible assets sufficiently exceed their respective carrying amounts. As a result, there were no goodwill or indefinite-lived intangible assets impairment charges recorded in any of those years.
Although we believe our estimates of fair value are reasonable, the determination of certain valuation inputs is subject to management’s judgment. Changes in these inputs could materially affect the results of our impairment review. If our forecasts of cash flows or other key inputs are negatively revised in the future, the estimated fair value of each reporting unit and of our indefinite-lived intangible assets would be adversely impacted, potentially leading to an impairment in the future that could materially affect our operating results.
Subsequent to our annual impairment test, no indications of impairment were identified.
Other Long-Lived Assets and Related Impairment
We review our other long-lived assets, such as finite-lived intangible assets, property and equipment, and operating lease assets for potential impairment when there is evidence that events or changes in circumstances indicate that the carrying amount of an asset may not be recoverable. The carrying amount of an asset is not recoverable if it exceeds the sum of the undiscounted cash flows expected to result from the use and eventual disposition of the asset. Fair value of finite-lived intangible assets and property and equipment is based on various valuation techniques. Any required impairment loss is measured as the amount by which the carrying amount of the asset exceeds its fair value and is recorded as a reduction in the carrying amount of the related asset and a charge to operating results.
There were no material finite-lived intangible assets impairment charges in 2023 and 2022. We recorded an impairment charge of $14 million in 2021 related to a finite-lived intangible asset for customer relationships associated with the wind down of a previous acquisition included in depreciation and amortization expense in the Consolidated Statements of Income.
We recorded pre-tax, non-cash property and equipment asset impairment charges of $12 million in 2023, $14 million in 2022 and $4 million in 2021. See Note 20, “Restructuring Charges,” to the consolidated financial statements for a discussion of these plans.
In the first quarter of 2023, we initiated a review of our real estate and facility capacity requirements due to our new and evolving work models. As a result of this ongoing review, we recorded impairment charges of $23 million in 2023 of which $18 million related to operating lease asset impairment and exit costs and is included in occupancy expense in the Consolidated Statements of Income and $5 million related to impairment of leasehold improvements, which are recorded in depreciation and amortization expense in the Consolidated Statements of Income. We fully impaired our lease assets for locations that we vacated with no intention to sublease. Substantially all of the property, equipment and leasehold improvements associated with the vacated leased office space were fully impaired as there are no expected future cash flows for these items.
No material impairments were recorded to reduce the carrying value of our other long-lived assets during 2023, 2022 or 2021.
Income Taxes
Estimates and judgments are required in the calculation of certain tax liabilities and in the determination of the recoverability of certain deferred tax assets, which arise from net operating loss carryforwards, tax credit carryforwards and temporary differences between the tax and financial statement recognition of revenues and expenses. Our deferred tax assets are reduced by a valuation allowance if it is more likely than not that some portion or all of the recorded deferred tax assets will not be realized in future periods. Management is required to determine whether a tax position is more likely than not to be sustained upon examination, including resolution of any related appeals or litigation processes, based on the technical merits of the position. Once it is determined that a position meets the recognition thresholds, the position is measured to determine the amount of benefit to be recognized in the consolidated financial statements.
In assessing the need for a valuation allowance, we consider all available evidence including past operating results, the existence of cumulative losses in the most recent fiscal years, estimates of future taxable income and the feasibility of tax planning strategies. In the event that we change our determination as to the amount of deferred tax assets that can be realized, we will adjust our valuation allowance with a corresponding impact to the provision for income taxes in the period in which such determination is made.
In addition, the calculation of our tax liabilities involves uncertainties in the application of tax regulations in the U.S. and other tax jurisdictions. We recognize potential liabilities for anticipated tax audit issues in such jurisdictions based on our estimate of whether, and the extent to which, additional taxes and interest may be due. While we believe that our tax liabilities reflect the probable outcome of identified tax uncertainties, it is reasonably possible that the ultimate resolution of any tax matter may be greater or less than the amount accrued. If events occur and the payment of these amounts ultimately proves unnecessary, the reversal of the liabilities would result in tax benefits being recognized in the period when we determine the liabilities are no longer necessary. If our estimate of tax liabilities proves to be less than the ultimate assessment, a further charge to expense would result.
Previous: Item 6. [Reserved] · Next: Item 7A. Quantitative and Qualitative Disclosures About Market Risk