 filings.tools
Item 5. Market for Registrant’s Common Equity, Related Stockholder Matters and Issuer Purchases of Equity Securities
6K characters. Original on sec.gov · Markdown
Item 5. Market for Registrant’s Common Equity, Related Stockholder Matters and Issuer Purchases of Equity Securities
The Company’s common stock is traded on the NASDAQ Stock Market LLC (“NASDAQ”) under the symbol NTAP.
Price Range of Common Stock
The price range per share of common stock presented below represents the highest and lowest intraday sales prices for the Company’s common stock on the NASDAQ during each quarter of our two most recent fiscal years.
| Fiscal 2021 | Fiscal 2020 | |||||||||||||||
|---|---|---|---|---|---|---|---|---|---|---|---|---|---|---|---|---|
| High | Low | High | Low | |||||||||||||
| First Quarter | $ | 49.65 | $ | 39.81 | $ | 73.69 | $ | 58.04 | ||||||||
| Second Quarter | $ | 48.94 | $ | 40.08 | $ | 59.84 | $ | 44.55 | ||||||||
| Third Quarter | $ | 70.64 | $ | 43.92 | $ | 65.38 | $ | 55.00 | ||||||||
| Fourth Quarter | $ | 78.77 | $ | 58.83 | $ | 60.96 | $ | 34.66 |
Holders
As of June 2, 2021 there were 456 holders of record of our common stock.
Dividends
The Company paid cash dividends of $0.48 per outstanding common share in each quarter of fiscal 2021 for an aggregate of $427 million, $0.48 per outstanding common share in each quarter of fiscal 2020 for an aggregate of $439 million, and $0.40 per outstanding common share in each quarter of fiscal 2019 for an aggregate of $403 million. In the first quarter of fiscal 2022, the Company declared a cash dividend of $0.50 per share of common stock, payable on July 28, 2021 to shareholders of record as of the close of business on July 9, 2021.
Performance Graph
The following graph shows a comparison of cumulative total shareholder return, calculated on a dividend reinvested basis, of an investment of $100 for the Company, the S&P 500 Index, the S&P 500 Information Technology Index and the S&P 1500 Technology Hardware & Equipment Index for the five years ended April 30, 2021. The comparisons in the graphs below are based upon historical data and are not indicative of, nor intended to forecast, future performance of our common stock. The graph and related information shall not be deemed “soliciting material” or be deemed to be “filed” with the SEC, nor shall such information be incorporated by reference into any past or future filing with the SEC, except to the extent that such filing specifically states that such graph and related information are incorporated by reference into such filing.
COMPARISON OF FIVE YEAR CUMULATIVE TOTAL RETURN
Among NetApp, Inc., the S&P 500 Index, the S&P 500 Information Technology Index and the S&P 1500 Technology Hardware & Equipment Index*
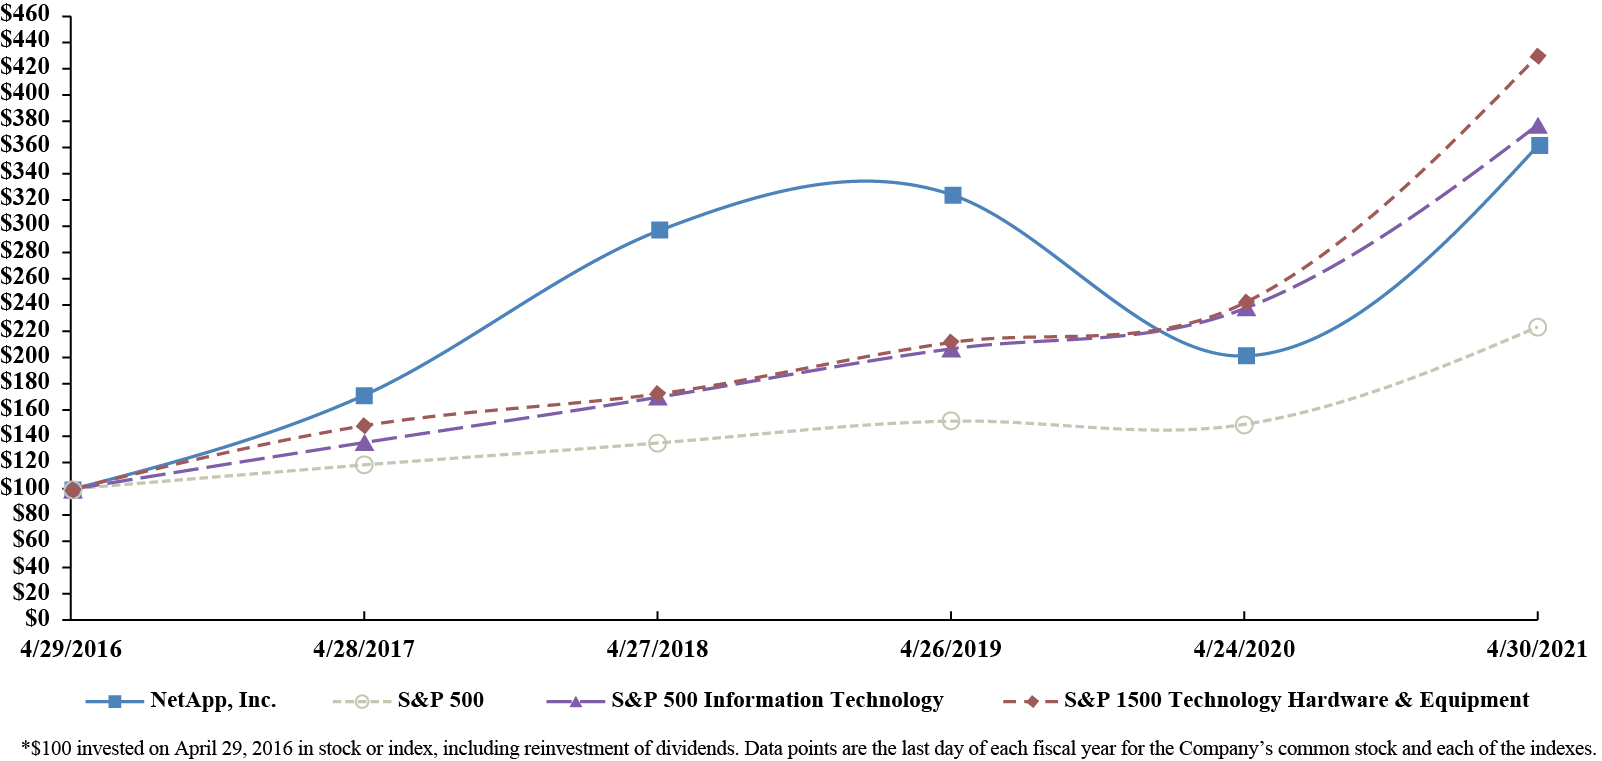
*$100 invested on April 29, 2016 in stock or index, including reinvestment of dividends. Data points are the last day of each fiscal year for the Company’s common stock and each of the indexes.
| April 2016 | April 2017 | April 2018 | April 2019 | April 2020 | April 2021 | |||||||||||||||||||
|---|---|---|---|---|---|---|---|---|---|---|---|---|---|---|---|---|---|---|---|---|---|---|---|---|
| NetApp, Inc. | $ | 100.00 | $ | 172.47 | $ | 296.45 | $ | 323.40 | $ | 200.91 | $ | 361.06 | ||||||||||||
| S&P 500 Index | $ | 100.00 | $ | 117.92 | $ | 134.66 | $ | 151.27 | $ | 148.91 | $ | 223.20 | ||||||||||||
| S&P 500 Information Technology Index | $ | 100.00 | $ | 135.36 | $ | 169.58 | $ | 206.69 | $ | 236.93 | $ | 376.88 | ||||||||||||
| S&P 1500 Technology Hardware & Equipment Index | $ | 100.00 | $ | 148.11 | $ | 172.45 | $ | 211.24 | $ | 241.57 | $ | 429.57 |
We believe that a number of factors may cause the market price of our common stock to fluctuate significantly. See Item 1A. – Risk Factors.
Purchases of Equity Securities by the Issuer and Affiliated Purchasers
The following table provides information with respect to the shares of common stock repurchased by us during the three months ended April 30, 2021:
| Total Number of Shares | Approximate Dollar Value | |||||||||||||||
|---|---|---|---|---|---|---|---|---|---|---|---|---|---|---|---|---|
| Total Number | Average | Purchased as Part of | of Shares That May Yet | |||||||||||||
| of Shares | Price Paid | Publicly Announced | Be Purchased Under The | |||||||||||||
| Period | Purchased | per Share | Program | Repurchase Program | ||||||||||||
| (Shares in thousands) | (Shares in thousands) | (Dollars in millions) | ||||||||||||||
| January 30, 2021 - February 26, 2021 | 200 | $ | 68.54 | 339,269 | $ | 413 | ||||||||||
| February 27, 2021 - March 26, 2021 | 525 | $ | 67.02 | 339,794 | $ | 378 | ||||||||||
| March 27, 2021 - April 30, 2021 | 352 | $ | 74.16 | 340,146 | $ | 352 | ||||||||||
| Total | 1,077 | $ | 69.63 |
In May 2003, our Board of Directors approved a stock repurchase program. As of April 30, 2021, our Board of Directors had authorized the repurchase of up to $13.6 billion of our common stock under our stock repurchase program, and on May 28, 2021, authorized an additional $500 million. Since inception of the program through April 30, 2021, we repurchased a total of 340 million shares of our common stock for an aggregate purchase price of $13.3 billion. Under this program, we may purchase shares of our outstanding common stock through solicited or unsolicited transactions in the open market, in privately negotiated transactions, through accelerated share repurchase programs, pursuant to a Rule 10b5-1 plan or in such other manner as deemed appropriate by our management. The stock repurchase program may be suspended or discontinued at any time, and it was suspended for the first half of fiscal 2021 due to the economic impact of the COVID-19 pandemic. We reinitiated our stock repurchase program in the third quarter of fiscal 2021.
Previous: Item 4. Mine Safety Disclosures · Next: Item 6. Selected Financial Data