 filings.tools
NVR (NVR) 10-K risk factor changes: FY2011 vs FY2010
The 2011-12-31 10-K against the 2010-12-31 one, compared heading by heading and sentence by sentence. One of these filings carries no fiscal year tag, so its year is the calendar year of the period end.
Item 1A23 rewritten16 added7 removed100 unchanged
All filing items864 rewritten513 added426 removed1,396 unchanged
Summary
counted, not written
- Item 1A lists 14 risk factor headings: 0 new, 0 reworded and 14 unchanged since FY2010. 1 heading from FY2010 no longer appears.
- Sentence by sentence, 513 added, 426 removed, 864 rewritten and 1,396 unchanged across 21 items that differ.
New Item 1A headings (0)
No risk factor heading in this filing is absent from FY2010.
Removed Item 1A headings (1)
- Our current indebtedness may impact our future operations.
A heading is new when no FY2010 heading matches it after ignoring case and punctuation, and reworded when it shares at least 60 percent of its words with one that went away. All current risk factor headings.
Sentences by item
21 items, with every count and a link to each item that changed
Underlined words on a shaded ground are new in FY2011; struck-through words were in FY2010. Sentences that are wholly new or wholly gone are labelled rather than marked.
Item 1A. Risk Factors.
23 rewritten, 16 added, 7 removed, 100 unchanged
Some of the statements in this Form 10-K, as well as statements made by us in periodic press releases or other public communications, constitute “forward-looking statements” within the meaning of the Private Securities Litigation Reform Act of 1995, Section 27A of the Securities Act of 1933, as amended, and Section 21E of the Securities Exchange Act of [removed: 1934.][added: 1934, as amended.]
Forward looking statements contained in this document include those regarding market trends, NVR’s financial position, business strategy, the outcome of pending litigation, [added: investigations or similar contingencies,] projected plans and objectives of management for future operations.
Such risk factors include, but are not limited to the following: general economic and business conditions (on both a national and regional level); interest rate changes; access to suitable financing by NVR and NVR’s customers; [added: increased regulation in the mortgage banking industry; the ability of our mortgage banking subsidiary to sell loans it originates into the secondary market;] competition; the availability and cost of land and other raw materials used by NVR in its homebuilding operations; shortages of labor; weather related slow-downs; building moratoriums; governmental regulation; fluctuation and volatility of stock and other financial markets; mortgage financing availability; and other factors over which NVR has little or no control.
NVR undertakes no obligation to update such forward-looking [removed: statements.][added: statements except as required by law.]
| | [removed: •] [added: •] | | the availability of mortgage financing; |
| | [removed: •] [added: •] | | actual and expected direction of interest rates, which affect our costs, the availability of construction financing, and long-term financing for potential purchasers of homes; |
| | [removed: •] [added: •] | | the availability of adequate land in desirable locations on favorable terms; |
| | [removed: •] [added: •] | | unexpected changes in customer preferences; and |
| | [removed: •] [added: •] | | changes in the national economy and in the local economies of the markets in which we have operations. |
The homebuilding industry has continued to experience a significant downturn as a result of [removed: declining] [added: low] consumer confidence driven by an economic recession, high unemployment levels, affordability issues and uncertainty as to the stability of home prices.
A continued downturn in the homebuilding industry could [removed: result in] [added: have] a material adverse effect on our sales [removed: (fewer] [added: either through fewer] gross sales and/or higher cancellation [removed: rates),] [added: rates, which could have a material adverse effect on our] profitability, stock performance, ability to service our debt obligations and future cash flows.
We must, in the ordinary course of our business, continuously seek and make acquisitions of lots for expansion into new markets as well as for replacement and expansion within our current markets, which is [added: generally] accomplished by us entering fixed price purchase agreements and paying forfeitable deposits under the purchase agreement to developers for the contractual right to acquire the lots.
We sell all of the loans we originate into the secondary mortgage market generally within 30 [added: to 60] days from origination.
Our mortgage [removed: segment] [added: banking business] sells all of the loans it originates into the secondary market usually within 30 [added: to 60] days from the date of closing, and has up to approximately [removed: $100] [added: $25] million available in a repurchase agreement to fund mortgage closings.
In the event that [added: other] disruptions to the secondary markets similar to [added: this and to] those which occurred during 2007 and 2008 continue to tighten or eliminate the available liquidity within the secondary markets for mortgage loans, or the underwriting requirements by our secondary market investors continue to become more stringent, our ability to sell future mortgages could decline and we could be required, among other things, to fund our commitments to our buyers with our own financial resources, which is limited, or require our home buyers to find another source of financing.
In particular, approximately [removed: 37%] [added: 35%] of our home settlements during [removed: 2010] [added: 2011] occurred in the Washington, D.C. and Baltimore, MD metropolitan areas, which accounted for [removed: 47%] [added: approximately 46%] of our homebuilding revenues in [removed: 2010.][added: 2011.]
Our [removed: homebuilding] [added: mortgage banking] operations are dependent in part on the [removed: availability and] [added: availability,] cost [added: and other terms] of [removed: working capital financing,] [added: mortgage financing facilities,] and may be adversely affected by [removed: a] [added: any] shortage or [removed: an increase in the] [added: increased] cost of such financing.
In addition, we have from time to time been subject to, and may also be subject in the future to, periodic delays in our homebuilding projects due to building moratoriums in the areas in which we [removed: operate.]
We are an approved seller/servicer of [removed: FNMA,] [added: FNMA mortgage loans and an approved lender/seller of] GNMA, FHLMC, [removed: FHA and] VA [added: and FHA] mortgage loans, and are subject to all of those agencies’ rules and regulations.
| | [removed: •] [added: •] | | for suitable and desirable lots at acceptable prices; |
| | [removed: •] [added: •] | | from selling incentives offered by competing builders within and across developments; and |
| | [removed: •] [added: •] | | from the existing home resale market. |
[removed: The homebuilding business has from time to time experienced building material and labor shortages,] including shortages in insulation, drywall, certain carpentry work and concrete, as well as fluctuating lumber prices and supply.
| --- | --- |
##### [Table of Contents](#toc)
| --- | --- | --- | --- |
| --- | --- | --- | --- |
| --- | --- | --- | --- |
##### [Table of Contents](#toc)
In October 2011, Bank of America discontinued their correspondent lending program.
As a result, this reduced the number of investors available in our loan sale distribution channels, increasing the loan volume of the remaining correspondent investors and in turn lengthening the time period it takes for us to sell loans and increasing our inventory of mortgages held for sale at December 31, 2011.
##### [Table of Contents](#toc)
##### [Table of Contents](#toc)
operate.
| --- | --- | --- | --- |
| --- | --- | --- | --- |
| --- | --- | --- | --- |
The homebuilding business has from time to time experienced building material and labor shortages,
##### [Table of Contents](#toc)
| | | | |
Our cancellation rate was approximately 14% in both 2010 and 2009 and was 23% in 2008.
Our mortgage banking operations are dependent on the availability, cost and other terms of mortgage financing facilities, and may be adversely affected by any shortage or increased cost of such financing.
Our current indebtedness may impact our future operations.
Our existing indebtedness contains financial and other restrictive covenants and any future indebtedness may also contain covenants.
These covenants include, or could include, limitations on our ability, and the ability of our subsidiaries, to incur additional indebtedness, pay cash dividends and make distributions, make loans and investments, enter into transactions with affiliates, effect certain asset sales, incur certain liens, merge or consolidate with any other person, or transfer all or substantially all of our properties and assets.
Substantial losses by us or other action or inaction by us or our subsidiaries could result in the violation of one or more of these covenants which could result in decreased liquidity or a default on our current or future indebtedness, thereby having a material adverse effect on our sales, profitability, stock performance, ability to service our debt obligations and future cash flows.
Item 7. Management’s Discussion and Analysis of Financial Condition and Results of Operations.
251 rewritten, 142 added, 123 removed, 352 unchanged
[added: | |] (dollars in thousands, except per share data) [added: |]
Results of Operations for the Years Ended December 31, [removed: 2010, 2009] [added: 2011, 2010] and [removed: 2008][added: 2009]
[added: |] _Mid Atlantic:_ [added: | |] Maryland, Virginia, West Virginia and Delaware [added: |]
[added: |] _North East:_ [added: | |] New Jersey and eastern Pennsylvania [added: |]
[added: |] _Mid East:_ [added: | |] Kentucky, New York, Ohio, western [removed: Pennsylvania and] [added: Pennsylvania,] Indiana [added: and Illinois |]
[added: |] _South East:_ [added: | |] North Carolina, South Carolina, Tennessee and Florida [added: |]
However, [removed: current] economic conditions and the continued downturn of the homebuilding industry have exerted pressure on our developers’ ability to obtain acquisition and development financing or to raise equity investments to finance land development activity, potentially constraining our supply of finished lots.
Once we acquire control of any raw ground, we [removed: will] determine whether to sell the raw parcel to a developer and enter into a fixed price purchase agreement with the developer to purchase the finished lots, or whether [removed: we will] [added: to] hire a developer to develop the land on our behalf.
As of December 31, [removed: 2010,] [added: 2011,] we controlled approximately [removed: 50,400] [added: 48,200] lots under purchase agreements with deposits in cash and letters of credit totaling approximately [removed: $174,300] [added: $202,300] and [removed: $6,600,] [added: $3,200,] respectively.
Included in the number of controlled lots are approximately [removed: 10,300] [added: 10,600] lots for which we have recorded a contract land deposit impairment reserve of approximately [removed: $73,500] [added: $70,300] as of December 31, [removed: 2010.][added: 2011.]
Further, as of December 31, [removed: 2010,] [added: 2011,] we had approximately $78,000 in land under development, that once fully developed will result in approximately [removed: 890] [added: 800] lots.
Current Business [removed: Environment][added: Environment and Key Financial Results]
The homebuilding environment [removed: in 2010] remained challenging [added: throughout 2011] as it continued to be impacted by the economic downturn [added: and uncertainty] that [removed: began] [added: has been experienced over the past] several [removed: years prior.][added: years.]
[removed: Although we believe we have once again begun to experience some pricing stabilization in several of our markets as we enter 2011, we] [added: We] believe that significant economic uncertainties remain which could result in continued [removed: sales and] [added: sales,] pricing [added: and gross margin] pressure over the next several quarters.
Despite these ongoing economic uncertainties, we believe that we are well positioned to [added: withstand this market uncertainty and] take advantage of opportunities that may arise due to the strength of our balance sheet and liquidity.
| | | Year Ended December 31, | | | | | | | | | | | [added: | | | | | | | | | | | |]
| | | [removed: 2010] [added: 2011] | | | | [removed: 2009] [added: 2010] | | | | [removed: 2008] [added: 2009] | | |
| Revenues | | $ | [removed: 2,980,758] [added: 2,611,195] | | | $ | [removed: 2,683,467] [added: 2,980,758] | | | $ | [removed: 3,638,702] [added: 2,683,467] | |
| Cost of sales | | $ | [removed: 2,438,292] [added: 2,165,625] | | | $ | [removed: 2,185,733] [added: 2,438,292] | | | $ | [removed: 3,181,010] [added: 2,185,733] | |
| Gross profit margin percentage | | | [removed: 18.2] [added: 17.1] | % | | | [removed: 18.5] [added: 18.2] | % | | | [removed: 12.6] [added: 18.5] | % |
| Selling, general and administrative expenses | | $ | [removed: 257,394] [added: 264,266] | | | $ | [removed: 233,152] [added: 257,394] | | | $ | [removed: 308,739] [added: 233,152] | |
| Settlements (units) | | | [removed: 10,030] [added: 8,487] | | | | [removed: 9,042] [added: 10,030] | | | | [removed: 10,741] [added: 9,042] | |
| Average settlement price | | $ | [removed: 297.1] [added: 307.5] | | | $ | [removed: 296.4] [added: 297.1] | | | $ | [removed: 338.4] [added: 296.4] | |
| New orders (units) | | | [removed: 9,415] [added: 9,247] | | | | [removed: 9,409] [added: 9,415] | | | | [removed: 8,760] [added: 9,409] | |
| Average new order price | | $ | [removed: 304.0] [added: 304.1] | | | $ | [removed: 292.7] [added: 304.0] | | | $ | [removed: 311.3] [added: 292.7] | |
| Backlog (units) | | | [removed: 2,916] [added: 3,676] | | | | [removed: 3,531] [added: 2,916] | | | | [removed: 3,164] [added: 3,531] | |
| Average backlog price | | $ | [removed: 328.6] [added: 315.8] | | | $ | [removed: 304.9] [added: 328.6] | | | $ | [removed: 316.9] [added: 304.9] | |
| New order cancellation rate | | | 14 | % | | | 14 | % | | | [removed: 23] [added: 14] | % |
Homebuilding revenues for 2010 increased 11% from 2009, as a result of an 11%, [removed: or 988 unit,] increase in the number of homes settled.
[removed: The increase in the number of homes settled was primarily attributable to the impact of the] federal homebuyer tax credit which resulted in strong first quarter sales and increased settlements through the second quarter of 2010 as compared to the same period in 2009.
Homebuilding revenues for [removed: 2009] [added: 2011] decreased [removed: 26%] [added: 12%] from [removed: 2008,] [added: 2010,] as a result of a [removed: 16%, or 1,699 unit,] [added: 15%] decrease in the number of homes [removed: settled and] [added: settled, offset partially by] a [removed: 12% decrease] [added: 4% increase] in the average settlement [removed: price.][added: price year over year.]
[removed: Since] [added: From] the first quarter of 2010, we experienced a consistent decline in the number of new orders across all of our markets in each of the second, third and fourth quarters of 2010 compared to the respective periods in 2009.
The increase in the average price of new orders [added: year over year,] was attributable to a product mix shift away from our attached products to our detached product which generally sell at higher price points.
[removed: We expect to] [added: As discussed in the _Overview_ section above, we] continue to face selling pressure [removed: over the next several quarters] [added: in most of our markets] due to continuing economic [removed: uncertainties, including] [added: uncertainty, driven by] low consumer confidence and high unemployment [removed: rates, as discussed in the Overview section above.][added: rates.]
[removed: New] [added: Segment new] orders in [removed: 2009] [added: 2011] increased [removed: by 7%] [added: 5%] compared to [removed: 2008,] [added: 2010,] while the average sales price of new orders decreased [removed: 6%] [added: 5%] year over year.
[removed: In addition, new] [added: New] orders [removed: in 2009] were favorably impacted by [removed: higher absorption rates, offsetting] the [removed: 17% decrease] [added: increase] in the [removed: average] number of active communities year over year.
The increase in SG&A expenses was attributable to an approximate $13,500 increase in stock-based compensation costs in 2010 compared to the same period in 2009, due to the grant of non-qualified stock options and restricted share units under the 2010 Equity Incentive Plan, offset partially by a reversal of approximately $6,600 in stock-based compensation expense previously recorded to [removed: SG&A expense as we adjusted our stock option forfeiture estimates to our actual forfeiture experience.]
SG&A expense was also higher due to an approximate $5,600 increase in management incentive costs as 2009 incentive [added: plans were limited to payouts of 50% of incentive earned, while no similar restrictions were imposed on 2010 incentive compensation.]
Expressed as the total of all cancellations during the period as a percentage of gross sales during the period, our cancellation rate was approximately 14% in [removed: both] [added: each of 2011,] 2010 and [removed: 2009, and 23% in 2008.][added: 2009.]
[removed: During] [added: Of a reporting quarter’s opening backlog, 6% during 2011 and] 2010, [removed: 2009] and [removed: 2008, approximately 6%,] 7% [removed: and 10%] [added: during 2009,] of [removed: a reporting quarter’s] [added: that] opening backlog [added: balance] cancelled during the fiscal [removed: quarter, respectively.][added: quarter.]
| --- | --- |
| --- | --- |
##### [Table of Contents](#toc)
Additionally, we controlled approximately 6,700 lots through joint venture limited liability corporations with an aggregate investment of approximately $89,500.
Of the lots controlled by the joint ventures, approximately 2,700 were not under contract at December 31, 2011.
The sluggish economy and high unemployment rates continue to weigh on consumer confidence and in turn, suppress housing demand.
In addition, new home sales and selling prices continue to be pressured by market uncertainty surrounding home prices and by a more restrictive mortgage lending environment.
As a result, our new orders, net of cancellations (“new orders”), for 2011 were down 2% from the prior year while our average new order selling price of $304.1 remained flat year over year.
Gross profit margins in 2011 within our homebuilding business were negatively impacted by pricing pressure and increased construction and sales incentive costs year over year, declining to 17.1% from 18.2% in 2010.
##### [Table of Contents](#toc)
Consolidated revenues totaled $2,659,149 for 2011, a decrease of 13% from $3,041,892 in 2010.
Net income declined 37% to $129,420 in 2011 from the prior year and diluted earnings per share declined 31% to $23.01 year over year.
Further, our expectation of continued sales and pricing pressures has been factored into the impairment analysis of our homebuilding inventory, land under development and contract land deposits.
We assess our land under development, including land under development held in joint ventures, and contract land deposits each quarter for impairment on a community-by-community basis by considering, among other items, overall market and economic conditions, and analyzing, as applicable, current sales absorption levels and recent sales’ gross profit.
At this time, we do not believe that any of the land under development is impaired, and we consider the allowance for losses on contract land deposits reflected on the December 31, 2011 balance sheet to be adequate.
Further, we believe that our homebuilding inventory is stated at the lower of cost or market.
Average settlement prices in the current year were favorably impacted by an 8% higher average price of homes in the beginning backlog entering 2011 compared to the same period in 2010.
The increase in the number of homes settled was primarily attributable to the impact of the
##### [Table of Contents](#toc)
New orders in 2011 decreased 2% when compared to the prior year, while the average sales price of new orders remained flat year over year.
We expect to face continued sales and pricing pressure over the next several quarters until we see economic stability and improved consumer confidence levels.
Gross profit margins in 2011 declined to 17.1% from 18.2% in 2010.
As discussed in the _Overview_ section above, gross profit margins in 2011 were negatively impacted by pricing pressure and increased construction and sales incentive costs.
SG&A expenses in 2011 increased approximately $6,900, or 3%, compared to 2010 and as a percentage of revenue increased to 10.1% in 2011 from 8.6% in the prior year.
The increase in SG&A expenses was primarily attributable to an approximate $10,500 increase in equity-based compensation costs in 2011 compared to 2010.
The increase in equity-based compensation resulted primarily from the favorable impact in 2010 of a reversal of approximately $6,600 in equity-based compensation expense related to an adjustment of our stock option forfeiture estimates to our actual forfeiture experience, while there was no forfeiture adjustment recorded in 2011.
In addition, the increase in equity-based compensation expense in 2011 resulted from incurring a full year of expense in 2011 for non-qualified stock options and restricted share units granted in the second quarter of 2010 under the 2010 Equity Incentive Plan.
This increase in SG&A expenses was partially offset by an approximate $4,100 decrease in personnel costs, primarily driven by a $7,800 decline in management incentives year over year.
SG&A expenses increased as a percentage of revenue due to the aforementioned 12% decrease in revenues year over year.
##### [Table of Contents](#toc)
SG&A expense as we adjusted our stock option forfeiture estimates to our actual forfeiture experience.
Backlog units and dollars increased approximately 26% to 3,676 and 21% to $1,160,879, respectively, as of December 31, 2011 compared to 2,916 and $958,287 as of December 31, 2010.
The increase in backlog units was primarily attributable to the decreased settlement activity in 2011 as discussed above.
Backlog dollars were favorably impacted by the backlog unit increase, offset partially by a 4% decline in the average price of homes in backlog in 2011 compared to 2010.
##### [Table of Contents](#toc)
| | | 2011 | | | | | | | | 2010 | | | | | | | | 2009 | | | | | | |
##### [Table of Contents](#toc)
| --- | --- | --- | --- | --- | --- | --- | --- | --- | --- | --- | --- | --- | --- | --- | --- | --- | --- | --- | --- | --- | --- | --- | --- | --- |
| | | 2011 | | | | | | | | 2010 | | | | | | | | 2009 | | | | | | |
| | | Units | | | | Average Price | | | | Units | | | | Average Price | | | | Units | | | | Average Price | | |
In addition, we controlled approximately 1,100 lots through joint ventures.
The market stabilization we had experienced toward the end of 2009 and into the first quarter of 2010 was negatively impacted by the April 30, 2010 expiration of the federal homebuyer tax credit.
After April 30, 2010, new home sales experienced sharp declines, providing evidence that rather than increasing overall demand, the tax credit may have merely accelerated existing demand.
The current home sales environment continues to be adversely impacted by high inventory levels, low consumer confidence driven by high unemployment rates, and a highly restrictive mortgage lending environment that has made it more difficult for our customers to obtain mortgage financing.
Our new orders for 2010 remained flat with new orders in 2009, however, new housing demand declined in both the third and fourth quarters of 2010 from the higher new order results experienced in the first two quarters of 2010.
In addition, cancellation rates increased to 18% in both the third and fourth quarters of 2010, compared to 14% and 15% in the third and fourth quarters of 2009, respectively, and 12% in the second quarter of 2010.
Consolidated revenues totaled $3,041,892 for 2010, an increase of 11% from $2,743,848 in 2009.
The increase in revenues was driven by increased home settlements primarily resulting from the expiration of the federal homebuyer tax credit in the second quarter of 2010.
Net income and diluted earnings per share in 2010 each increased 7% from 2009.
Gross profit margins within our homebuilding business declined slightly to 18.2% in 2010 from 18.5% in 2009.
As of December 31, 2010, our cash and cash equivalents balance totaled approximately $1,200,000.
In addition, during 2010, we redeemed the remaining $133,370 of our outstanding senior notes upon their maturity and repurchased approximately $417,080 of our common stock.
| | | | | | | | | | | | | |
| --- | --- | --- | --- | --- | --- | --- | --- | --- | --- | --- | --- | --- |
The decrease in the number of units settled was primarily attributable to our beginning backlog units being approximately 39%, or 1,981 units, lower entering 2009 compared to the backlog unit balance entering 2008, offset partially by a higher backlog turnover rate period over period.
Average settlement prices were impacted primarily by a 15% lower
average price of homes in the beginning backlog entering 2009 compared to the same period in 2008, coupled with a 9% decline in the average sales price of new orders for the first six months of 2009 as compared to the same period in 2008.
The increase in new orders in 2009 was in part attributable to a 47% increase in new orders in the fourth quarter of 2009 compared to the same period in 2008, a period in which we experienced a significant drop-off in new orders due to a sharp decline in overall economic conditions.
We believe new orders in 2009 were also favorably impacted by the first-time homebuyer federal tax credit as well as by a decrease in the cancellation rate to 14% in 2009 from 23% in 2008.
During 2009, to meet affordability issues in many of our markets, we altered our product offerings to provide smaller, lower priced products.
Gross profit margins in 2009 improved to 18.5% compared to 12.6% in 2008 primarily due to a favorable variance in contract land deposit impairment charges year over year.
In 2009 we recognized the recovery of approximately $6,500, or 24 basis points, of contract land deposits previously determined to be uncollectible.
In 2008 we recognized a contract land deposit impairment charge of approximately $165,000, or 454 basis points.
Gross profit margins in 2009 were also favorably impacted as a result of us exiting a significant number of poor performing communities in 2008 which were producing lower gross profit margins.
In addition, gross profit margins in 2009 were favorably impacted by lower lumber and certain other commodity costs as well as by cost control measures implemented to reduce subcontractor and material costs in prior periods.
plans were limited to payouts of 50% of incentive earned, while no similar restrictions are imposed on 2010 incentive compensation.
SG&A expenses in 2009 decreased approximately $75,600 compared to 2008, but increased slightly as a percentage of revenue to 8.7% in 2009 from 8.5% in 2008.
The decrease in SG&A expenses was primarily attributable to a $36,300 decrease in selling and marketing costs in 2009 compared to 2008 due to a 17% decrease in the average number of active communities year over year to 355 in 2009 from 427 in 2008.
In addition, personnel costs were down approximately $26,900 due primarily to 24% decrease in average staffing levels year over year.
Backlog units and dollars were 3,531 and $1,076,437, respectively, as of December 31, 2009 compared to 3,164 and $1,002,795 as of December 31, 2008.
Net new order and settlement activity during 2009 resulted in the increase in backlog units year over year.
_Consolidated Homebuilding — Other Charges_
We reassessed our goodwill and intangible asset balances for impairment in the fourth quarter of 2008, as a result of the continuing declines in new orders and backlog in 2008, and the continuing deterioration of the homebuilding environment in each of our markets spurred further in 2008 by the credit crisis in the latter part of 2008.
As a result of that assessment, we determined that the goodwill and intangible assets related to our Rymarc Homes and Fox Ridge Homes operations were fully impaired and we wrote-off a total of $11,686 related to such assets in 2008.
We completed the annual assessment of the intangible asset balance in 2010 and 2009 and determined that there was no impairment.
of capital.
| | | | | | | Average | | | | | | | | Average | | | | | | | | Average | | |
The segment’s
_2009 versus 2008_
Revenues for the Mid Atlantic segment, which represents approximately 62% of total homebuilding revenues for the year, decreased approximately $500,500, or 23%, in 2009 compared to 2008.
An excerpt. Shown here: 40 of 251 rewritten, 40 of 142 added and 40 of 123 removed. The counts are complete. For every sentence, read Item 7. Management’s Discussion and Analysis of Financial Condition and Results of Operations. in the FY2011 filing and the FY2010 filing.
Item 7A. Quantitative and Qualitative Disclosure About Market Risk.
20 rewritten, 18 added, 10 removed, 12 unchanged
NVRM also sells all of its [removed: mortgage servicing rights] [added: mortgages held for sale] on a servicing released basis.
NVRM [removed: generates operating liquidity primarily through the] [added: has available a] mortgage Repurchase Agreement, which provides for loan repurchases up to [removed: $100,000,] [added: $25,000,] subject to certain sub limits.
Advances under the Repurchase Agreement carry a Pricing Rate based on the LIBOR Rate plus the LIBOR Margin, or the Default Pricing Rate, as determined under the Repurchase Agreement, provided that the Pricing Rate shall not be less than [removed: 4.5%.][added: 3.75%.]
The following table represents the contractual balances of our on-balance sheet financial instruments at the expected maturity dates, as well as the fair values of those on-balance sheet financial instruments at December 31, [removed: 2010.][added: 2011.]
[added: | | | | | | |] Maturities (000’s) [added: | | | | | | | | | | | | | | | | | | | | | | |]
| | | [removed: 2011 | | | |] 2012 | | | | 2013 | | | | 2014 | | | | 2015 | | | | Thereafter | | | | Total | | | | [added: Fair] Value | | |
| Mortgage banking segment | | | | | | | | | | | | | | | | | | | | | | | | | | | | | [removed: | | | |]
| _Interest rate sensitive assets:_ | | | | | | | | | | | | | | | | | | | | | | | | | | | | | [removed: | | | |]
| Average interest rate | | | [removed: 4.2 | % | | |] — | | | | — | | | | — | | | | — | | | | — | | | | [removed: 4.2] [added: —] | [removed: %] | | | | |
| _Interest rate sensitive liabilities:_ | | | | | | | | | | | | | | | | | | | | | | | | | | | | | [removed: | | | |]
| Variable rate repurchase agreement | | [removed: $] | [removed: 90,338 | | | |] — | | | | — | | | | — | | | | — | | | | — | | | [removed: $] | [removed: 90,338] [added: —] | | | [removed: $] | [removed: 90,338] [added: —] | |
| Average interest rate [removed: (a)] | | | [removed: 4.1] [added: 4.0] | % | | | — | | | | — | | | | — | | | | — | | | | [removed: — | | | | 4.1] [added: 4.0] | % | | | | |
| _Other:_ | | | | | | | | | | | | | | | | | | | | | | | | | | | | | [removed: | | | |]
| Forward trades of mortgage-backed securities [removed: (b)] [added: (a)] | | $ | [removed: 4,904 | | | | —] [added: (2,430] | [added: )] | | | — | | | | — | | | | — | | | | — | | | $ | [removed: 4,904] [added: (2,430] | [added: )] | | $ | [removed: 4,904] [added: (2,430] | [added: )] |
| Forward loan commitments [removed: (b) | | | 557 |] [added: (a)] | | [added: $] | [removed: —] [added: 833] | | | | — | | | | — | | | | — | | | | — | | | [added: $] | [removed: 557] [added: 833] | | | [added: $] | [removed: 557] [added: 833] | |
| Homebuilding segment | | | | | | | | | | | | | | | | | | | | | | | | | | | | | [removed: | | | |]
| Interest-bearing deposits | | $ | [removed: 1,163,623 | | | | —] [added: 442,693] | | | | — | | | | — | | | | — | | | | — | | | $ | [removed: 1,163,623] [added: 442,693] | | | $ | [removed: 1,163,623] [added: 442,693] | |
| Average interest rate | | | 0.3 | % | | | — | | | | — | | | | — | | | | — | | | | [removed: — | | | |] 0.3 | % | | | | |
| Average interest rate | | | [removed: 13.1 | % | | |] 13.2 | % | | | 13.3 | % | | | 13.9 | % | | | [removed: 14.1] | [removed: %] | | | | | | | [removed: 13.2] [added: 13.3] | % | | | | |
| [removed: (b) |] [added: (a)] | Represents the fair value recorded pursuant to ASC 815, _Derivatives and Hedging_. |
| --- | --- |
##### [Table of Contents](#toc)
At December 31, 2011 there was no debt outstanding under the Repurchase Agreement.
The table does not include the debt of our consolidated joint venture as it is non-recourse to us.
##### [Table of Contents](#toc)
| | | | | | | | | | | | | | | | | | | | | | | | | | | | | |
| --- | --- | --- | --- | --- | --- | --- | --- | --- | --- | --- | --- | --- | --- | --- | --- | --- | --- | --- | --- | --- | --- | --- | --- | --- | --- | --- | --- | --- |
| | | | | | | | | | | | | | | | | | | | | | | | | | | | | |
| Mortgage loans held for sale | | $ | 250,826 | | | | — | | | | — | | | | — | | | | — | | | $ | 250,826 | | | $ | 252,352 | |
| | | | | | | | | | | | | | | | | | | | | | | | | | | | | |
| | | | | | | | | | | | | | | | | | | | | | | | | | | | | |
| | | | | | | | | | | | | | | | | | | | | | | | | | | | | |
| _Interest rate sensitive assets:_ | | | | | | | | | | | | | | | | | | | | | | | | | | | | |
| | | | | | | | | | | | | | | | | | | | | | | | | | | | | |
| _Interest rate sensitive liabilities:_ | | | | | | | | | | | | | | | | | | | | | | | | | | | | |
| Fixed rate obligations , including interest | | $ | 609 | | | $ | 644 | | | $ | 725 | | | $ | — | | | $ | — | | | $ | 1,978 | | | $ | 1,978 | |
| --- | --- |
##### [Table of Contents](#toc)
Under the Repurchase Agreement, we may enter into separate agreements with the Buyers party to the Repurchase Agreement, adjusting the Pricing Rate in effect.
The average Pricing Rate on outstanding balances at December 31, 2010 was 4.1%.
| | | | | | | | | | | | | | | | | | | | | | | | | | | | | | | Fair | | |
| --- | --- | --- | --- | --- | --- | --- | --- | --- | --- | --- | --- | --- | --- | --- | --- | --- | --- | --- | --- | --- | --- | --- | --- | --- | --- | --- | --- | --- | --- | --- | --- | --- |
| Mortgage loans held for sale | | $ | 181,697 | | | | — | | | | — | | | | — | | | | — | | | | — | | | $ | 181,697 | | | $ | 177,244 | |
| | | | | | | | | | | | | | | | | | | | | | | | | | | | | | | | | |
| Fixed rate obligations | | $ | 346 | | | $ | 644 | | | $ | 644 | | | $ | 669 | | | $ | 56 | | | $ | — | | | $ | 2,359 | | | $ | 2,359 | |
| | | |
| --- | --- | --- |
| (a) | | Average interest rate is net of credits received for compensating cash balances. |
Item 1. Business.
27 rewritten, 11 added, 7 removed, 95 unchanged
While we operate in multiple locations in [removed: fourteen] [added: fifteen] states, primarily in the eastern part of the United States, approximately [removed: 37%] [added: 35%] of our home settlements in [removed: 2010] [added: 2011] occurred in the Washington, D.C. and Baltimore, MD metropolitan areas, which accounted for [removed: 47%] [added: approximately 46%] of our [removed: 2010] [added: 2011] homebuilding revenues.
The Ryan Homes product is currently sold in [removed: twenty-three] [added: twenty-five] metropolitan areas located in Maryland, Virginia, West Virginia, Pennsylvania, New York, North Carolina, South Carolina, Ohio, New Jersey, Delaware, Kentucky, [removed: Indiana] [added: Indiana, Illinois] and Florida.
[removed: In] [added: During] 2010, our average price [removed: of a settled unit] was approximately $297,100.
Historically, we generally have not engaged in land development (see discussion below on our [removed: recent] limited land development activities).
[removed: Once we acquire control of any raw ground, we will determine] whether to sell the raw parcel to a developer and enter into a fixed price purchase agreement with the [added: developer to purchase the finished lots, or whether to hire a developer to develop the land on our behalf.]
As of December 31, [removed: 2010,] [added: 2011,] we controlled approximately [removed: 50,400] [added: 48,200] lots under purchase agreements with deposits in cash and letters of credit totaling approximately [removed: $174.3] [added: $202.3] million and [removed: $6.6 million] [added: $3.2 million,] respectively.
Included in the number of controlled lots are approximately [removed: 10,300] [added: 10,600] lots for which we have recorded a contract land deposit impairment reserve of approximately [removed: $73.5] [added: $70.3] million as of December 31, [removed: 2010.][added: 2011.]
In addition, we had an aggregate investment totaling approximately [removed: $37] [added: $89.5] million in [removed: three] [added: four] separate joint venture limited liability corporations (“JVs”), [removed: through which we controlled] [added: expected to produce] approximately [removed: 1,100] [added: 6,700] lots.
Further, as of December 31, [removed: 2010,] [added: 2011,] we directly [removed: acquired four] [added: owned three] separate raw parcels of land, zoned for their intended use, with a current cost basis, including development costs, of approximately [removed: $78] [added: $78.0] million that we intend to develop into approximately [removed: 890] [added: 800] finished lots for use in our homebuilding operations.
See Note 3 [added: and Note 4] to the consolidated financial statements included herein for additional information regarding JVs and land under [removed: development.][added: development, respectively.]
[removed: The current] [added: New] home sales [removed: environment continues] [added: also continue] to be adversely impacted by [removed: high inventory levels; low consumer confidence driven by high unemployment rates; and] a highly restrictive mortgage lending environment that has made it more difficult for our customers to obtain mortgage financing.
Our homes combine [removed: traditional] [added: traditional, colonial,] or [removed: colonial] [added: cottage] exterior designs with contemporary interior designs and amenities, generally include two to four bedrooms and range from approximately 1,000 to 7,300 square feet.
During [removed: 2010,] [added: 2011,] the prices at which we settled homes ranged from approximately [removed: $97,000] [added: $103,000] to [removed: $1.7] [added: $2.3] million and averaged approximately [removed: $297,100.][added: $307,500.]
| _Mid East:_ | | Kentucky, New York, Ohio, western [removed: Pennsylvania and] [added: Pennsylvania,] Indiana [added: and Illinois] |
Backlog totaled [removed: 2,916] [added: 3,676] units and approximately [removed: $1.0] [added: $1.2] billion at December 31, [removed: 2010] [added: 2011] compared to backlog of [removed: 3,531] [added: 2,916] units and approximately [removed: $1.1] [added: $1.0] billion at December 31, [removed: 2009.][added: 2010.]
Expressed as the total of all cancellations during the period as a percentage of gross sales during the period, our cancellation rate was approximately [removed: 14%,] 14% [removed: and 23%] in [removed: 2010, 2009] [added: each of 2011, 2010] and [removed: 2008, respectively.][added: 2009.]
[removed: During] [added: Of a reporting quarter’s opening backlog, 6% during 2011 and] 2010, [removed: 2009] and [removed: 2008, approximately 6%,] 7% [removed: and 10%] [added: during 2009,] of [removed: a reporting quarter’s] [added: that] opening backlog [added: balance] cancelled during the fiscal [removed: quarter, respectively.][added: quarter.]
All of these regulations have increased the cost to produce and market our products, and in some instances, have delayed our developers’ [removed: abilities] [added: ability] to deliver [removed: us] finished [removed: lots.][added: lots to us.]
[removed: Historically] [added: Historically,] we have been one of the market leaders in each of the markets where we build homes.
In [removed: 2010,] [added: 2011,] NVRM closed approximately [removed: 8,600] [added: 7,000] loans with an aggregate principal amount of approximately [removed: $2.2] [added: $1.9] billion as compared to approximately [removed: 8,000] [added: 8,600] loans with an aggregate principal amount of approximately [removed: $2.1] [added: $2.2] billion in [removed: 2009.][added: 2010.]
NVRM sells all of the mortgage loans it closes to investors in the secondary markets on a servicing released basis, typically within 30 [added: to 60] days from the loan closing.
NVRM is an approved seller/servicer for [removed: FNMA,] [added: FNMA mortgage loans and an approved lender/seller of] GNMA, FHLMC, VA and FHA mortgage loans.
NVRM is an approved seller/servicer of [removed: FNMA,] [added: FNMA mortgage loans and an approved lender/seller of] GNMA, FHLMC, [removed: FHA and] VA [added: and FHA] mortgage loans, and is subject to all of those agencies’ rules and regulations.
NVRM’s mortgage loans in process that have not closed (“Pipeline”) at December 31, [removed: 2010] [added: 2011] and [removed: 2009,] [added: 2010,] had an aggregate principal balance of approximately [removed: $670] [added: $790] million and [removed: $770] [added: $670] million, respectively.
NVRM’s cancellation rate was approximately 29% in [removed: 2010.][added: 2011.]
During [removed: 2009] [added: 2010] and [removed: 2008,] [added: 2009,] NVRM’s loan cancellation rates were approximately [removed: 35%] [added: 29%] and [removed: 49%,] [added: 35%,] respectively.
At December 31, [removed: 2010,] [added: 2011,] we employed [removed: 2,822] [added: 2,765] full-time persons, of whom [removed: 1,076] [added: 1,077] were officers and management personnel, [removed: 174] [added: 182] were technical and construction personnel, [removed: 580] [added: 619] were sales personnel, [removed: 490] [added: 477] were administrative personnel and [removed: 502] [added: 410] were engaged in various other service and labor activities.
| --- | --- |
In 2011, our average price of a settled unit was approximately $307,500.
Once we acquire control of any raw ground, we determine
##### [Table of Contents](#toc)
Of the lots controlled by the JVs, approximately 2,700 were not under contract at December 31, 2011.
The homebuilding environment remains challenging as it continues to be impacted by the economic downturn and uncertainty that has existed in the U.S. throughout the past six years.
The sluggish economy and high unemployment rates continue to weigh on consumer confidence and in turn, suppress housing demand, despite what have been historically low mortgage rates in 2011.
We expect to continue to see market volatility, pricing pressure and reduced demand for new homes until there is economic stability and improved consumer confidence.
##### [Table of Contents](#toc)
##### [Table of Contents](#toc)
##### [Table of Contents](#toc)
developer to purchase the finished lots, or whether we will hire a developer to develop the land on our behalf.
During 2010 the homebuilding environment continued to be negatively impacted by economic uncertainty.
The market stabilization we experienced toward the end of 2009 and into the first quarter of 2010 was negatively impacted by the April 30, 2010 expiration of the federal homebuyer tax credit.
After April 30, 2010, new home sales experienced sharp declines, providing evidence that rather than increasing overall demand, the tax credit may have merely accelerated existing demand.
During 2009, our average price was approximately $296,400.
The subcontractors’ work is performed under the supervision of our employees who monitor quality control.
However, in certain markets in which we operate, we believe that our growth has been hampered by the longer time periods necessary for our developers to obtain the necessary governmental approvals.
Item 3. Legal Proceedings.
7 rewritten, 12 added, 8 removed, 9 unchanged
On July 18, 2007, former and current employees filed lawsuits against [removed: the Company] [added: us] in the Court of Common Pleas in Allegheny County, Pennsylvania and Hamilton County, Ohio, in Superior Court in Durham County, North Carolina, and in the Circuit Court in Montgomery County, Maryland, and on July 19, 2007 in the Superior Court in New Jersey, alleging that we incorrectly classified our sales and marketing representatives as being exempt from overtime wages.
The [removed: two] [added: three] courts to most recently consider similar claims against other homebuilders have acknowledged the DOL’s position that sales and marketing representatives were properly classified as exempt from overtime wages and the only court to have directly addressed the exempt status of such employees concluded that the DOL’s position was valid.
Because we are unable to determine the likelihood of an unfavorable outcome of [removed: this case,] [added: these cases,] or the amount of damages, if any, we have not recorded any associated liabilities [removed: in] [added: on] the accompanying [removed: condensed,] consolidated balance sheets.
In June 2010, we received a Request for Information from the United States Environmental Protection Agency [removed: (the “EPA”)] [added: (“EPA”)] pursuant to Section 308 of the Clean Water Act.
The request [removed: seeks] [added: sought] information about storm water discharge practices in connection with homebuilding projects completed or underway by [removed: us.][added: us in New York and New Jersey.]
We [removed: have been cooperating] [added: cooperated] with this request, [removed: have] [added: and] provided information to the [removed: EPA and intend to continue cooperating with the EPA’s inquiries.][added: EPA.]
In the opinion of management, and based on advice of legal counsel, this litigation is not expected to have a material adverse effect on our financial [removed: position or] [added: position,] results of [removed: operations.][added: operations or cash flows.]
| --- | --- |
We have since been informed by the United States Department of Justice (“DOJ”) that the EPA forwarded the information on the matter to the DOJ, and the DOJ requested that we meet with the government to discuss the status of the case.
A meeting took place in late January 2012 with representatives from both the EPA and DOJ.
It is not yet known what next steps, if any, the DOJ will take in the matter.
We intend to continue cooperating with any future EPA and/or DOJ inquiries.
In August 2011, the Wage and Hour Division of the U.S. Department of Labor (“DOL”) notified us that it was initiating an investigation to determine our compliance with the Fair Standards Labor Act (“FSLA”).
In the notice, the DOL requested certain information, including payroll data for a two year period and multiple community-specific items related to our homebuilding operations.
We have cooperated with this information request, have either provided or made available the information that the DOL has requested and expect to continue to cooperate with the DOL’s investigation.
We believe that our payroll practices are in compliance with the FSLA.
At this time, we cannot predict the outcome of this investigation, nor can we reasonably estimate the potential costs that may be associated with its eventual resolution.
Legal costs incurred in connection with outstanding litigation are expensed as incurred.
##### [Table of Contents](#toc)
In April 2010, NVRM received a Report of Examination (“ROE”) from the Office of the Commissioner of Banks of the State of North Carolina (the “NCCOB”) reporting certain findings that resulted from the NCCOB’s examination of selected files relating to loans originated by us in North Carolina between August 1, 2006 and August 31, 2009.
The ROE alleged that certain of the loan files reflected violations of North Carolina and/or U.S. lending or consumer protection laws.
The ROE requested that we correct or otherwise address the alleged violations and in some instances requested that we undertake an examination of all of our other loans in North Carolina to determine whether similar alleged violations may have occurred, and if so, to take corrective action.
We responded to the ROE by letter dated June 10, 2010, contesting the findings and allegations, providing factual information to correct certain of the findings, and refuting the NCCOB’s interpretation of applicable law.
On November 15, 2010, the NCCOB provided a written response to our June 10, 2010 letter
closing certain alleged violations while reasserting certain others.
On January 12, 2011, we responded to the NCCOB’s November 15, 2010 letter providing additional factual information to address the remaining findings and refuting the NCCOB’s interpretation of applicable law.
Accordingly, while the outcome of the matter is currently not determinable, we do not expect resolution of the matter to have a material adverse effect on our financial position.
Cover and table of contents
46 rewritten, 25 added, 29 removed, 21 unchanged
UNITED [removed: STATES][added: STATES]
[removed: SECURITIES] [added: SECURITIES] AND EXCHANGE COMMISSION
| [removed: þ |] [added: x] | ANNUAL REPORT PURSUANT TO SECTION 13 OR 15(d) OF THE SECURITIES EXCHANGE ACT OF 1934 |
For the fiscal year ended December 31, [removed: 2010][added: 2011]
| [removed: o |] [added: ¨] | TRANSITION REPORT PURSUANT TO SECTION 13 OR 15(d) OF THE SECURITIES EXCHANGE ACT OF 1934 |
For the transition period from [removed: ____ to _______________][added: to]
[removed: (Exact] [added: (Exact] Name of Registrant as Specified in its [removed: Charter)][added: Charter)]
| [removed: (State] [added: (State] or Other Jurisdiction [removed: of Incorporation] [added: of Incorporation] or [removed: Organization)] [added: Organization)] | | [removed: (IRS Employer Identification Number)] [added: (IRS Employer Identification Number)] |
| [removed: 11700] [added: 11700] Plaza America Drive, Suite [removed: 500 Reston, Virginia] [added: 500 Reston, Virginia] | | [removed: 20190] [added: 20190] |
| [removed: (Address] [added: (Address] of Principal Executive [removed: Offices)] [added: Offices)] | | [removed: (Zip Code)] [added: (Zip Code)] |
[removed: Registrant’s] [added: Registrant’s] telephone number, including area code: (703) [removed: 956-4000][added: 956-4000]
[removed: Securities] [added: Securities] registered pursuant to Section 12(b) of the [removed: Act:][added: Act:]
| [removed: Title] [added: Title] of each [removed: class] [added: class] | | [removed: Name] [added: Name] of each exchange on which [removed: registered] [added: registered] |
[removed: Securities] [added: Securities] registered pursuant to Section 12(g) of the Act: [removed: None][added: None]
Yes [removed: þ] [added: x] No [removed: o][added: ¨]
Yes [removed: o] [added: ¨] No [removed: þ][added: x]
Indicate by check mark if disclosure of delinquent filers pursuant to Item 405 of Regulation S-K (§229.405) is not contained herein, and will not be contained, to the best of registrant’s knowledge, in definitive proxy or information statements incorporated by reference in Part III of this Form 10-K or any amendment to this Form 10-K. [added: x]
See the definitions of “large accelerated filer,” “accelerated filer” and “smaller reporting company” in Rule [removed: 12-2] [added: 12b-2] of the Exchange Act.
| [removed: Large accelerated] [added: Non-accelerated] filer [removed: þ] | [removed: Accelerated filer o] | [removed: Non-accelerated filer o] [added: ¨] (Do not check if a Smaller Reporting Company) | [added: |] Smaller Reporting Company [removed: o] | [added: | ¨ |]
The aggregate market value of the voting stock held by non-affiliates of NVR, Inc. on June 30, [removed: 2010,] [added: 2011,] the last business day of NVR, Inc.’s most recently completed second fiscal quarter, was approximately [removed: $3,693,820,000.][added: $3,840,650,000.]
As of February [removed: 21, 2011] [added: 17, 2012] there were [removed: 5,893,203] [added: 5,058,781] total shares of common stock outstanding.
[removed: DOCUMENTS] [added: DOCUMENTS] INCORPORATED BY [removed: REFERENCE][added: REFERENCE]
Portions of the Proxy Statement of NVR, Inc. to be filed with the Securities and Exchange Commission pursuant to Regulation 14A of the Securities Exchange Act of 1934 on or prior to April 30, [removed: 2011] [added: 2012] are incorporated by reference into Part III of this report.
| | | | | Page | [added: | |]
| PART I | | | | | [added: | |]
[removed: Item] [added: | Item] 1A. [added: | | [Risk Factors](#tx250145_2) | | | 6 | |]
[removed: Unresolved] [added: | Item 1B. | | [Unresolved] Staff [removed: Comments 11][added: Comments](#tx250145_3) | | | 11 | |]
[removed: Legal Proceedings 12][added: | Item 3. | | [Legal Proceedings](#tx250145_5) | | | 12 | |]
| | | [removed: Executive] [added: [Executive] Officers of the [removed: Registrant] [added: Registrant](#tx250145_7)] | | [added: |] 13 | [added: |]
| PART II | | | | | [added: | |]
[removed: Market] [added: | Item 5. | | [Market] for [removed: Registrants’] [added: Registrant’s] Common Equity, Related Stockholder Matters and Issuer Purchases of Equity [removed: Securities 14][added: Securities](#tx250145_8) | | | 13 | |]
[removed: Selected] [added: | Item 6. | | [Selected] Financial [removed: Data 15][added: Data](#tx250145_9) | | | 15 | |]
[removed: Management’s] [added: | Item 7. | | [Management’s] Discussion and Analysis of Financial Condition and Results of [removed: Operations 16][added: Operations](#tx250145_10) | | | 16 | |]
[removed: Quantitative] [added: | Item 7A. | | [Quantitative] and Qualitative Disclosure About Market [removed: Risk 39][added: Risk](#tx250145_11) | | | 37 | |]
[removed: Financial] [added: | Item 8. | | [Financial] Statements and Supplementary [removed: Data 42][added: Data](#tx250145_12) | | | 40 | |]
[removed: Changes] [added: | Item 9. | | [Changes] in and Disagreements with Accountants on Accounting and Financial [removed: Disclosure 42][added: Disclosure](#tx250145_13) | | | 40 | |]
[removed: Controls] [added: | Item 9A. | | [Controls] and [removed: Procedures 42][added: Procedures](#tx250145_14) | | | 40 | |]
[removed: Item] [added: | Item] 9B. [added: | | [Other Information](#tx250145_15) | | | 40 | |]
| PART III | | | | | [added: | |]
[removed: Directors,] [added: | Item 10. | | [Directors,] Executive Officers, and Corporate [removed: Governance 43][added: Governance](#tx250145_16) | | | 41 | |]
10-K 1 d250145d10k.htm 10-K
##### [Table of Contents](#toc)
| --- | --- |
| --- | --- |
Yes x No ¨
Yes x No ¨
| | | | | | | |
| --- | --- | --- | --- | --- | --- | --- |
| Large accelerated filer | | x | | Accelerated filer | | ¨ |
| | | | | | | |
Yes ¨ No x
##### [Table of Contents](#toc)
| | | | | | | |
| --- | --- | --- | --- | --- | --- | --- |
| | | | | | | |
| | | | | | | |
| Item 1. | | [Business](#tx250145_1) | | | 2 | |
| Item 2. | | [Properties](#tx250145_4) | | | 11 | |
| Item 4. | | [Mine Safety Disclosures](#tx250145_6) | | | 13 | |
| | | | | | | |
| | | | | | | |
| | | | | | | |
| | | | | | | |
| | | | | | | |
##### [Table of Contents](#toc)
10-K 1 w79861e10vk.htm 10-K
| | | |
| --- | --- | --- |
| --- | --- | --- | --- |
| | | | | |
| --- | --- | --- | --- | --- |
Item 1.
Business 2
Risk Factors 6
Item 1B.
Item 2.
Properties 11
Item 3.
Item 4.
\[Removed and Reserved\] 13
Item 5.
Item 6.
Item 7.
Item 7A.
Item 8.
Item 9.
Item 9A.
Other Information 42
Item 10.
Executive Compensation 43
Item 12.
Item 13.
Item 14.
Item 15.
An excerpt. Shown here: 40 of 46 rewritten, all 25 added and all 29 removed. The counts are complete. For every sentence, read Cover and table of contents in the FY2011 filing and the FY2010 filing.
Item 1B. Unresolved Staff Comments.
0 rewritten, 1 added, 0 removed, 1 unchanged
| --- | --- |
Item 2. Properties.
5 rewritten, 3 added, 3 removed, 5 unchanged
Each of these leases contains various options for extensions of the lease and [added: for the purchase of the facility.]
The [removed: Portland,] [added: Portland lease expires in 2014, the] Thurmont and Farmington leases expire in [removed: 2014, and] [added: 2019,] the Kings Mountain and Burlington County leases expire in 2022 and 2023, [removed: respectively.][added: respectively, and the Darlington lease expires in 2025.]
The [removed: new] [added: Dayton] facility [removed: will contain] [added: contains] approximately 100,000 square feet of manufacturing [removed: space and production from the Dayton facility is expected to begin by the end of 2011.][added: space.]
Due to the economic downturn and the related decline in our homebuilding activity, our current plant utilization has dropped to approximately [removed: 40%] [added: 31%] of total capacity.
We also, in connection with both our homebuilding and mortgage banking businesses, lease office space in multiple locations for homebuilding divisional offices and mortgage banking and title services branches under leases expiring at various times through [removed: 2018,] [added: 2019,] none of which are individually material to our business.
| --- | --- |
In March 2011, we purchased a manufacturing facility in Dayton, Ohio and began production in June 2011.
##### [Table of Contents](#toc)
for the purchase of the facility.
The Darlington lease expires in 2025.
We expect to purchase a new manufacturing facility in the first quarter of 2011 in Dayton, OH.
Item 4. Mine Safety Disclosures.
5 rewritten, 4 added, 2 removed, 14 unchanged
| Name | | Age | | [removed: | |] Positions |
| Paul C. Saville | | [removed: | 55 |] [added: 56] | | President and Chief Executive Officer of NVR |
| Robert A. Goethe | | [removed: | 56 |] [added: 57] | | President of NVRM |
| Dennis M. Seremet | | [removed: | 56 |] [added: 57] | | Senior Vice President, Chief Financial Officer and Treasurer of NVR |
| Robert W. Henley | | [removed: | 44 |] [added: 45] | | Vice President and Controller of NVR |
| --- | --- |
None.
| | | | | |
| --- | --- | --- | --- | --- |
| | | | | | | |
| --- | --- | --- | --- | --- | --- | --- |
Item 5. Market for Registrant’s Common Equity, Related Stockholder Matters and Issuer Purchases of Equity Securities.
14 rewritten, 17 added, 14 removed, 14 unchanged
The following table sets forth the high and low prices per share for our common stock for each fiscal quarter during the years ended December 31, [removed: 2010] [added: 2011] and [removed: 2009:][added: 2010:]
As of the close of business on February [removed: 21, 2011,] [added: 17, 2012,] there were [removed: 364] [added: 351] shareholders of record.
We have never paid a cash dividend on our shares of common [removed: stock.][added: stock and have no current intentions to do so in the future.]
We had [removed: one] [added: two] repurchase [removed: authorization] [added: authorizations] outstanding during the quarter ended December 31, [removed: 2010.][added: 2011.]
On July [removed: 29, 2010] [added: 28, 2011] (“July [added: Authorization”) and on December 14, 2011 (“December] Authorization”), we publicly announced the Board of Directors’ approval for us to repurchase up to an aggregate of $300 million [added: per authorization,] of our common stock in one or more open market and/or privately negotiated transactions.
The following table provides information regarding common stock repurchases for the quarter ended December 31, [removed: 2010:][added: 2011:]
| | | | | | | | | | | | | | | Maximum Number (or | | | [removed: | | |]
| | | | | | | | | | | Total Number of | | | | Approximate Dollar | | | [removed: | | |]
| | | | | | | | | | | Shares [removed: Purchased as] [added: Purchased] | | | | Value) of [removed: Shares | | |] [added: Shares that] | | |
| | | [added: Total Number] | | | | [removed: Average Price] [added: Average] | | | | [removed: Part] [added: as Part] of Publicly | | | [removed: that May] [added: | May] Yet Be | | | [removed: | | | |]
| | | [removed: Total Number of] [added: of Shares] | | | | [removed: Paid] [added: Price Paid] | | | | Announced [removed: Plans or] [added: Plans] | | | | Purchased Under the | | | [removed: | | |]
| Period | | [removed: Shares Purchased] [added: Purchased] | | | | per Share | | | | [removed: Programs] [added: or Programs] | | | | Plans or Programs | | | [removed: | | |]
The following chart graphs our performance in the form of cumulative total return to holders of our Common Stock since December 31, [removed: 2005] [added: 2006] in comparison to the Dow/Home Construction Index and the Dow Jones Industrial Index for that same [removed: period.][added: period, assuming that $100 was invested in NVR stock and the indices on December 31, 2006.]
[removed: ][added: 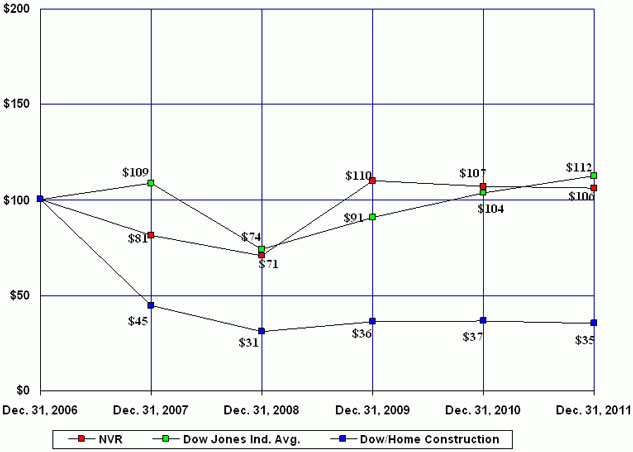]
| --- | --- |
| _2011_ | | | | | | | | |
| Fourth Quarter | | $ | 692.19 | | | $ | 554.71 | |
| Third Quarter | | $ | 760.37 | | | $ | 555.58 | |
| Second Quarter | | $ | 788.79 | | | $ | 701.00 | |
| First Quarter | | $ | 804.32 | | | $ | 674.07 | |
##### [Table of Contents](#toc)
The repurchase authorizations do not have expiration dates.
| | | | | | | | | | | | | | | | | |
| --- | --- | --- | --- | --- | --- | --- | --- | --- | --- | --- | --- | --- | --- | --- | --- | --- |
| October 1 - 31, 2011 | | | 38,323 | | | $ | 591.65 | | | | 38,323 | | | $ | 19,897,000 | |
| November 1 - 30, 2011 | | | — | | | $ | — | | | | — | | | $ | 19,897,000 | |
| December 1 - 31, 2011 | | | — | | | $ | — | | | | — | | | $ | 319,897,000 | |
| | | | | | | | | | | | | | | | | |
| Total | | | 38,323 | | | $ | 591.65 | | | | 38,323 | | | | | |
| | | | | | | | | | | | | | | | | |
##### [Table of Contents](#toc)
| _2009_ | | | | | | | | |
| Fourth Quarter | | $ | 742.00 | | | $ | 607.00 | |
| Third Quarter | | $ | 698.28 | | | $ | 477.41 | |
| Second Quarter | | $ | 533.89 | | | $ | 416.24 | |
| First Quarter | | $ | 500.05 | | | $ | 310.69 | |
The July Authorization does not have an expiration date.
| | | | | | | | | | | | | | | | | | | | |
| --- | --- | --- | --- | --- | --- | --- | --- | --- | --- | --- | --- | --- | --- | --- | --- | --- | --- | --- | --- |
| October 1 - 31, 2010 | | | — | | | | — | | | | — | | | $ | 148,986,000 | | | | |
| November 1 - 30, 2010 | | | 52,216 | | | $ | 627.94 | | | | 52,216 | | | $ | 116,198,000 | | | | |
| December 1 - 31, 2010 | | | 11,300 | | | $ | 619.33 | | | | 11,300 | | | $ | 109,200,000 | | | | |
| Total | | | 63,516 | | | $ | 626.41 | | | | 63,516 | | | | | | | | |
The Dow/Home Construction Index is comprised of NVR, Inc., Pulte Homes, Inc., DR Horton, Inc., Lennar Corp., Toll Brothers, Inc., MDC Holdings, Inc., KB Home, Ryland Group, Inc., Meritage Homes Corp., Standard Pacific Corp., Skyline Corp. and M/I Homes, Inc.
Assumes that $100 was invested in NVR stock and the indices on December 31, 2005.
Item 6. Selected Financial Data.
16 rewritten, 5 added, 3 removed, 15 unchanged
[added: | |] (dollars in thousands, except per share amounts) [added: |]
| | | [removed: 2010] [added: 2011] | | | | [removed: 2009] [added: 2010] | | | | [removed: 2008] [added: 2009] | | | | [removed: 2007] [added: 2008] | | | | [removed: 2006] [added: 2007] | | |
| Revenues | | $ | [removed: 2,980,758] [added: 2,611,195] | | | $ | [removed: 2,683,467] [added: 2,980,758] | | | $ | [removed: 3,638,702] [added: 2,683,467] | | | $ | [removed: 5,048,187] [added: 3,638,702] | | | $ | [removed: 6,036,236] [added: 5,048,187] | |
| Gross profit | | | [removed: 542,466] [added: 445,570] | | | | [removed: 497,734] [added: 542,466] | | | | [removed: 457,692] [added: 497,734] | | | | [removed: 821,128] [added: 457,692] | | | | [removed: 1,334,971] [added: 821,128] | |
| _Mortgage Banking [removed: data__:_] [added: data_ _:_] | | | | | | | | | | | | | | | | | | | | |
| Mortgage banking fees | | | [removed: 61,134] [added: 47,954] | | | | [removed: 60,381] [added: 61,134] | | | | [removed: 54,337] [added: 60,381] | | | | [removed: 81,155] [added: 54,337] | | | | [removed: 97,888] [added: 81,155] | |
| Interest income | | | [removed: 5,411] [added: 5,702] | | | | [removed: 2,979] [added: 5,411] | | | | [removed: 3,955] [added: 2,979] | | | | [removed: 4,900] [added: 3,955] | | | | [removed: 7,704] [added: 4,900] | |
| Interest expense | | | [removed: 1,126] [added: 875] | | | | [removed: 1,184] [added: 1,126] | | | | [removed: 754] [added: 1,184] | | | | [removed: 681] [added: 754] | | | | [removed: 2,805] [added: 681] | |
| Income from continuing operations | | $ | [removed: 206,005] [added: 129,420] | | | $ | [removed: 192,180] [added: 206,005] | | | $ | [removed: 100,892] [added: 192,180] | | | $ | [removed: 333,955] [added: 100,892] | | | $ | [removed: 587,412] [added: 333,955] | |
| Income from continuing operations per diluted share (1) | | $ | [removed: 33.42] [added: 23.01] | | | $ | [removed: 31.26] [added: 33.42] | | | $ | [removed: 17.04] [added: 31.26] | | | $ | [removed: 54.14] [added: 17.04] | | | $ | [removed: 88.05] [added: 54.14] | |
| Homebuilding inventory | | $ | [removed: 431,329] [added: 533,150] | | | $ | [removed: 418,718] [added: 431,329] | | | $ | [removed: 400,570] [added: 418,718] | | | $ | [removed: 688,854] [added: 400,570] | | | $ | [removed: 733,616] [added: 688,854] | |
| Contract land deposits, net | | | [removed: 100,786] [added: 131,930] | | | | [removed: 49,906] [added: 100,786] | | | | [removed: 29,073] [added: 49,906] | | | | [removed: 188,528] [added: 29,073] | | | | [removed: 402,170] [added: 188,528] | |
| Total assets | | | [removed: 2,260,061] [added: 1,779,485] | | | | [removed: 2,395,770] [added: 2,260,061] | | | | [removed: 2,103,236] [added: 2,395,770] | | | | [removed: 2,194,416] [added: 2,103,236] | | | | [removed: 2,473,808] [added: 2,194,416] | |
| Notes and loans payable | | | [removed: 92,089] [added: 1,613] | | | | [removed: 147,880] [added: 92,089] | | | | [removed: 210,389] [added: 147,880] | | | | [removed: 286,283] [added: 210,389] | | | | [removed: 356,632] [added: 286,283] | |
| Shareholders’ equity | | | [removed: 1,740,374] [added: 1,374,799] | | | | [removed: 1,757,262] [added: 1,740,374] | | | | [removed: 1,373,789] [added: 1,757,262] | | | | [removed: 1,129,375] [added: 1,373,789] | | | | [removed: 1,152,074] [added: 1,129,375] | |
| (1) | [removed: |] For the years ended December 31, [added: 2011,] 2010, 2009, [removed: 2008, 2007] [added: 2008] and [removed: 2006,] [added: 2007,] income from continuing operations per diluted share was computed based on [added: 5,623,817;] 6,164,617; 6,148,769; [removed: 5,920,285; 6,167,795] [added: 5,920,285] and [removed: 6,671,571] [added: 6,167,795] shares, respectively, which represents the weighted average number of shares and share equivalents outstanding for each year. |
| --- | --- |
| --- | --- |
##### [Table of Contents](#toc)
| | | 2011 | | | | 2010 | | | | 2009 | | | | 2008 | | | | 2007 | | |
| --- | --- |
| --- | --- | --- | --- | --- | --- | --- | --- | --- | --- | --- | --- | --- | --- | --- | --- | --- | --- | --- | --- | --- |
| | | |
| --- | --- | --- |
Item 8. Financial Statements and Supplementary Data.
0 rewritten, 1 added, 2 removed, 1 unchanged
| --- | --- |
| | | |
| --- | --- | --- |
Item 9. Changes in and Disagreements with Accountants on Accounting and Financial Disclosure.
0 rewritten, 1 added, 2 removed, 1 unchanged
| --- | --- |
| | | |
| --- | --- | --- |
Item 9A. Controls and Procedures.
4 rewritten, 1 added, 2 removed, 5 unchanged
Based on that evaluation, the principal executive officer and principal financial officer concluded that the design and operation of these disclosure controls and procedures as of December 31, [removed: 2010] [added: 2011] were effective to provide reasonable assurance that information required to be disclosed in our reports under the Securities and Exchange Act of 1934 is recorded, processed, summarized and reported within the time periods specified in the Securities and Exchange Commission’s rules and forms and that such information is accumulated and communicated to our management, including our principal executive officer and principal financial officer, as appropriate, to allow timely decisions regarding required disclosure.
Under the supervision and with the participation of our management, including our principal executive officer and principal financial officer, we conducted an evaluation of the effectiveness of our internal control over financial reporting based on the framework in _Internal Control [removed: —] [added: –] Integrated Framework_ issued by the Committee of Sponsoring Organizations of the Treadway Commission.
Based on our evaluation under the framework in _Internal Control [removed: —] [added: –] Integrated Framework_, our management concluded that our internal control over financial reporting was effective as of December 31, [removed: 2010.][added: 2011.]
Our internal control over financial reporting as of December 31, [removed: 2010] [added: 2011] has been audited by KPMG LLP, an independent registered public accounting firm, as stated in their attestation report which is included herein.
| --- | --- |
| | | |
| --- | --- | --- |
Item 9B. Other Information.
1 rewritten, 2 added, 2 removed, 1 unchanged
[removed: | | |] None. [removed: |]
| --- | --- |
##### [Table of Contents](#toc)
| | | |
| --- | --- | --- |
Item 10. Directors, Executive Officers, and Corporate Governance.
1 rewritten, 1 added, 2 removed, 1 unchanged
Item 10 is hereby incorporated by reference to our Proxy Statement expected to be filed with the Securities and Exchange Commission on or prior to April 30, [removed: 2011.][added: 2012.]
| --- | --- |
| | | |
| --- | --- | --- |
Item 11. Executive Compensation.
1 rewritten, 1 added, 2 removed, 0 unchanged
Item 11 is hereby incorporated by reference to our Proxy Statement expected to be filed with the Securities and Exchange Commission on or prior to April 30, [removed: 2011.][added: 2012.]
| --- | --- |
| | | |
| --- | --- | --- |
Item 12. Security Ownership of Certain Beneficial Owners and Management and Related Stockholder Matters.
8 rewritten, 6 added, 14 removed, 5 unchanged
Security ownership of certain beneficial owners and management is hereby incorporated by reference to our Proxy Statement expected to be filed with the Securities and Exchange Commission on or prior to April 30, [removed: 2011.][added: 2012.]
The table below sets forth information as of the end of our [removed: 2010] [added: 2011] fiscal year for (i) all equity compensation plans approved by our shareholders and (ii) all equity compensation plans not approved by our shareholders:
| Equity compensation plans [added: not] approved by security holders [removed: (1)] | | | [removed: 533,638] [added: 340,047] | | | $ | [removed: 469.99] [added: 585.93] | | | | [removed: 270,247] [added: —] | |
| Equity compensation plans [removed: not] approved by security holders [added: (1)] | | | [removed: 669,514] [added: 552,138] | | | $ | [removed: 458.02] [added: 476.97] | | | | [removed: —] [added: 239,646] | |
| (1) | [removed: |] This category includes the restricted share units (“RSUs”) authorized by the 2010 Equity Incentive Plan, which was approved by our shareholders at the May 4, 2010 Annual Meeting. At December 31, [removed: 2010,] [added: 2011,] there are [removed: 149,727] [added: 154,483] RSUs outstanding, issued at a $0 exercise price. Of the total [removed: 270,247] [added: 239,646] shares remaining available for future issuance, up to [removed: 90,273] [added: 85,517] may be issued as RSUs. [added: The weighted-average exercise price of outstanding options under security holder approved plans excluding outstanding RSUs was $662.26.] |
Equity compensation plans approved by our shareholders include the NVR, Inc. Management Long-Term Stock Option Plan; the NVR, Inc. 1998 Management Long-Term Stock Option Plan; the 1998 Directors’ [removed: Long-Term Stock Option Plan; and the 2010 Equity Incentive Plan.]
[added: The only equity compensation plan that] was not approved by our shareholders is the NVR, Inc. 2000 Broadly-Based Stock Option Plan.
See Note [removed: 9] [added: 10] in the accompanying consolidated financial statements for a description of each of our equity compensation plans.
| --- | --- |
| Plan category | | Number of securities to be issued upon exercise of outstanding options, warrants and rights | | | | Weighted-average exercise price of outstanding options, warrants and rights | | | | Number of securities remaining available for future issuance under equity compensation plans (excluding securities reflected in the first column) | | |
| Total | | | 892,185 | | | $ | 518.50 | | | | 239,646 | |
| --- | --- |
##### [Table of Contents](#toc)
Long-Term Stock Option Plan; and the 2010 Equity Incentive Plan.
| | | | | | | | | | | Number of | | |
| | | | | | | | | | | securities | | |
| | | | | | | | | | | remaining available | | |
| | | Number of | | | | | | | | for future issuance | | |
| | | securities to be | | | | | | | | under equity | | |
| | | issued upon | | | | Weighted-average | | | | compensation plans | | |
| | | exercise of | | | | exercise price of | | | | (excluding | | |
| | | outstanding | | | | outstanding | | | | securities | | |
| | | options, warrants | | | | options, warrants | | | | reflected in the | | |
| Plan category | | and rights | | | | and rights | | | | first column) | | |
| Total | | | 1,203,152 | | | $ | 463.33 | | | | 270,247 | |
| --- | --- | --- |
The only equity compensation plan that
| | | |
Item 13. Certain Relationships and Related Transactions, and Director Independence.
1 rewritten, 1 added, 2 removed, 0 unchanged
Item 13 is hereby incorporated by reference to our Proxy Statement expected to be filed with the Securities and Exchange Commission on or prior to April 30, [removed: 2011.][added: 2012.]
| --- | --- |
| | | |
| --- | --- | --- |
Item 14. Principal Accountant Fees and Services.
1 rewritten, 1 added, 2 removed, 1 unchanged
Item 14 is hereby incorporated by reference to our Proxy Statement expected to be filed with the Securities and Exchange Commission on or prior to April 30, [removed: 2011.][added: 2012.]
| --- | --- |
| | | |
| --- | --- | --- |
Item 15. Exhibits and Financial Statement Schedules.
433 rewritten, 244 added, 190 removed, 743 unchanged
| 2. | [removed: |] Exhibits |
| [removed: _Number_] [added: _Exhibit Number_] | | _Description_ |
| 10.13* | | The NVR, Inc. 2010 Equity Incentive Plan. Filed as exhibit 10.1 to NVR’s Form S-8 [added: (No. 333-166512)] filed on May 4, 2010 and incorporated herein by reference. |
| [removed: 10.19*] [added: 10.18*] | | The Form of Non-Qualified Stock Option Agreement under the NVR, Inc. 2000 Broadly Based Stock Option Plan. Filed as Exhibit 10.1 to NVR’s Form 8-K filed January 3, 2008 and incorporated herein by reference. |
| [removed: 10.20*] [added: 10.19*] | | The Form of Non-Qualified Stock Option Agreement under the 1998 Directors’ [removed: Long-Term] [added: Long- Term] Stock Option Plan. Filed as Exhibit 10.34 to NVR’s Annual Report on Form 10-K for the period ended December 31, 2007 and incorporated herein by reference. |
| [removed: 10.22*] [added: 10.20*] | | Summary of [removed: 2011] [added: 2012] Named Executive Officer annual incentive compensation plan. Filed herewith. |
| * | [removed: |] Exhibit is a management contract or compensatory plan or arrangement. |
| [removed: |] NVR, Inc. | | | | [added: |]
| | [added: |] By: | [added: |] /s/ Paul C. Saville | [removed: | |]
| | | [added: | |] Paul C. Saville | [removed: | |]
| | | [added: | |] _President and Chief Executive Officer_ | [removed: | |]
| /s/ Dwight C. Schar [removed: Dwight C. Schar] | | Chairman | | February [removed: 25, 2011] [added: 22, 2012] |
| /s/ C. E. Andrews [removed: C. E. Andrews] | | Director | | February [removed: 25, 2011] [added: 22, 2012] |
| /s/ Robert C. Butler [removed: Robert C. Butler] | | Director | | February [removed: 25, 2011] [added: 22, 2012] |
| /s/ Timothy M. Donahue [removed: Timothy M. Donahue] | | Director | | February [removed: 25, 2011] [added: 22, 2012] |
| /s/ Alfred E. Festa [removed: Alfred E. Festa] | | Director | | February [removed: 25, 2011] [added: 22, 2012] |
| /s/ Manuel H. Johnson [removed: Manuel H. Johnson] | | Director | | February [removed: 25, 2011] [added: 22, 2012] |
| /s/ William A. Moran [removed: William A. Moran] | | Director | | February [removed: 25, 2011] [added: 22, 2012] |
| /s/ David A. Preiser [removed: David A. Preiser] | | Director | | February [removed: 25, 2011] [added: 22, 2012] |
| /s/ W. Grady Rosier [removed: W. Grady Rosier] | | Director | | February [removed: 25, 2011] [added: 22, 2012] |
| /s/ John M. Toups [removed: John M. Toups] | | Director | | February [removed: 25, 2011] [added: 22, 2012] |
| /s/ Paul W. Whetsell [removed: Paul W. Whetsell] | | Director | | February [removed: 25, 2011] [added: 22, 2012] |
| /s/ Paul C. Saville [removed: Paul C. Saville] | | Principal Executive Officer | | February [removed: 25, 2011] [added: 22, 2012] |
| /s/ Dennis M. Seremet [removed: Dennis M. Seremet] | | Principal Financial Officer | | February [removed: 25, 2011] [added: 22, 2012] |
| /s/ Robert W. Henley [removed: Robert W. Henley] | | Principal Accounting Officer | | February [removed: 25, 2011] [added: 22, 2012] |
We have audited the accompanying consolidated balance sheets of NVR, Inc. and subsidiaries as of December 31, [removed: 2010] [added: 2011] and [removed: 2009,] [added: 2010,] and the related consolidated statements of income, shareholders’ equity and cash flows for each of the years in the three-year period ended December 31, [removed: 2010.][added: 2011.]
In our opinion, the consolidated financial statements referred to above present fairly, in all material respects, the financial position of NVR, Inc. as of December 31, [removed: 2010] [added: 2011] and [removed: 2009,] [added: 2010,] and the results of their operations and their cash flows for each of the years in the three-year period ended December 31, [removed: 2010,] [added: 2011,] in conformity with U.S. generally accepted accounting principles.
We also have audited, in accordance with the standards of the Public Company Accounting Oversight Board (United States), NVR, Inc.’s internal control over financial reporting as of December 31, [removed: 2010,] [added: 2011,] based on criteria established in _Internal Control [removed: —] [added: –] Integrated Framework_ issued by the Committee of Sponsoring Organizations of the Treadway Commission (COSO), and our report dated February [removed: 25, 2011] [added: 22, 2012] expressed an unqualified opinion on the effectiveness of the Company’s internal control over financial reporting_._
We have audited NVR, Inc.’s internal control over financial reporting as of December 31, [removed: 2010,] [added: 2011,] based on criteria established in _Internal Control [removed: —] [added: –] Integrated Framework_ issued by the Committee of Sponsoring Organizations of the Treadway Commission (COSO).
In our opinion, NVR, Inc. maintained, in all material respects, effective internal control over financial reporting as of December 31, [removed: 2010,] [added: 2011,] based on criteria established in _Internal Control [removed: —] [added: –] Integrated Framework_ issued by the Committee of Sponsoring Organizations of the Treadway Commission.
We also have audited, in accordance with the standards of the Public Company Accounting Oversight Board (United States), the consolidated balance sheets of NVR, Inc. as of December 31, [removed: 2010] [added: 2011] and [removed: 2009,] [added: 2010,] and the related consolidated statements of income, shareholders’ equity and cash flows for each of the years in the three-year period ended December 31, [removed: 2010,] [added: 2011,] and our report dated February [removed: 25, 2011] [added: 22, 2012] expressed an unqualified opinion on those consolidated financial statements.
| | | [added: 2011 | | | |] 2010 | | | | 2009 | | |
| Cash and cash equivalents | | [removed: $] | [added: 475,566 | | | |] 1,190,731 | | | [removed: $] | 1,248,689 | |
| Marketable securities | | | — | | | | [added: — | | | |] 219,535 | |
| Receivables | | | [removed: 6,948] [added: 6,789] | | | | [removed: 7,995] [added: 6,948] | |
| Lots and housing units, covered under sales agreements with customers | | | [removed: 275,272] [added: 363,833] | | | | [removed: 337,523] [added: 275,272] | |
| Unsold lots and housing units | | | [removed: 70,542] [added: 82,578] | | | | [removed: 73,673] [added: 70,542] | |
| Land under development | | | [removed: 78,058] [added: 78,045] | | | | [removed: —] [added: 78,058] | |
| Manufacturing materials and other | | | [removed: 7,457] [added: 8,694] | | | | [removed: 7,522] [added: 7,457] | |
| [removed: Assets related to consolidated] [added: Consolidated] variable interest entities | | | [added: 20,182 | | | |] 22,371 | | | | 70,430 | |
| --- | --- |
| 1. | Financial Statements |
| --- | --- |
_NVR, Inc.-Consolidated Financial Statements_
Reports of Independent Registered Public Accounting Firm
| --- | --- |
| 3.1 | | Restated Articles of Incorporation of NVR, Inc. (“NVR”). Filed as Exhibit 3.1 to NVR’s Annual Report on Form 10-K for the year ended December 31, 2010 and incorporated herein by reference. |
| 3.2 | | Bylaws, as amended, of NVR, Inc. Filed as Exhibit 3.2 to NVR’s Annual Report on Form 10-K for the year ended December 31, 2010 and incorporated herein by reference. |
##### [Table of Contents](#toc)
##### [Table of Contents](#toc)
| --- | --- |
##### [Table of Contents](#toc)
| Dwight C. Schar | | | | |
| C. E. Andrews | | | | |
| Robert C. Butler | | | | |
| Timothy M. Donahue | | | | |
| /s/ Thomas D. Eckert | | Director | | February 22, 2012 |
| Thomas D. Eckert | | | | |
| Alfred E. Festa | | | | |
| Manuel H. Johnson | | | | |
| William A. Moran | | | | |
| David A. Preiser | | | | |
| W. Grady Rosier | | | | |
| John M. Toups | | | | |
| Paul W. Whetsell | | | | |
| Paul C. Saville | | | | |
##### [Table of Contents](#toc)
| Dennis M. Seremet | | | | |
| Robert W. Henley | | | | |
##### [Table of Contents](#toc)
February 22, 2012
##### [Table of Contents](#toc)
February 22, 2012
##### [Table of Contents](#toc)
| | | 2011 | | | | 2010 | | |
| | | | 533,150 | | | | 431,329 | |
| Assets related to consolidated variable interest entity | | | 20,182 | | | | 22,371 | |
| | | | 1,501,318 | | | | 2,056,273 | |
| Total assets | | $ | 1,779,485 | | | $ | 2,260,061 | |
| | | | | | | |
| 1. | | Financial Statements _NVR, Inc. — Consolidated Financial Statements_ Reports of Independent Registered Public Accounting Firm Consolidated Balance Sheets Consolidated Statements of Income Consolidated Statements of Shareholders’ Equity Consolidated Statements of Cash Flows Notes to Consolidated Financial Statements |
| --- | --- | --- |
| | | |
| _Exhibit_ | | |
| 3.1 | | Restated Articles of Incorporation of NVR, Inc. (“NVR”). Filed herewith. |
| 3.2 | | Bylaws, as amended, of NVR, Inc. Filed herewith. |
| 10.18 | | Director Resignation Agreement with all Class II director nominees and current Class I directors, dated February 22, 2010. Filed as Exhibit 10.1 to NVR’s Form 8-K filed February 23, 2010 and incorporated herein by reference. |
| 10.21 | | Repurchase Agreement dated August 5, 2008 among NVR Finance and U.S. Bank National Association, as Agent, and other lenders party thereto. Filed as Exhibit 10.1 to NVR’s Form 8-K filed on August 8, 2008 and incorporated herein by reference. |
| 10.23 | | First Amendment to Repurchase Agreement dated August 5, 2008 among NVR Finance and U.S. Bank National Association, as agent and a Buyer, and the other Buyers. Filed as Exhibit 10.1 to NVR’s Form 8-K filed August 7, 2009 and incorporated herein by reference. |
| 10.24 | | Second Amendment to Master Repurchase Agreement dated July 30, 2010 among U.S. Bank National Association, as Agent and a Buyer, the other Buyers party hereto and NVR Mortgage Finance, Inc., as Seller. Filed as Exhibit 10.6 to NVR’s Quarterly report on Form 10-Q for the Quarter ended June 30, 2010 and incorporated herein by reference. |
| | | | | |
| --- | --- | --- | --- | --- |
February 25, 2011
| | | | 431,329 | | | | 418,718 | |
| | | | 2,056,273 | | | | 2,335,727 | |
| | | | 416,178 | | | | 606,858 | |
| --- | --- | --- | --- | --- | --- | --- | --- | --- | --- | --- | --- | --- |
| Goodwill and intangible asset impairment | | | — | | | | — | | | | (11,686 | ) |
| | | | | | | Additional | | | | | | | | | | | | Deferred | | | | Deferred | | | | | | |
| | | Common | | | | Paid-in | | | | Retained | | | | Treasury | | | | Compensation | | | | Compensation | | | | | | |
| _Balance, December 31, 2007_ | | $ | 206 | | | $ | 663,631 | | | $ | 3,529,995 | | | $ | (3,064,457 | ) | | $ | (75,636 | ) | | $ | 75,636 | | | $ | 1,129,375 | |
| Net income | | | — | | | | — | | | | 100,892 | | | | — | | | | — | | | | — | | | | 100,892 | |
| Stock-based compensation | | | — | | | | 41,204 | | | | — | | | | — | | | | — | | | | — | | | | 41,204 | |
| Gain on extinguishment of debt | | | — | | | | — | | | | (251 | ) |
| Impairment of goodwill and intangible assets | | | — | | | | — | | | | 11,686 | |
| (Increase) decrease in inventories | | | (8,783 | ) | | | (18,148 | ) | | | 288,284 | |
| Purchase of NVR common stock for deferred compensation plan | | | — | | | | — | | | | (128 | ) |
| Redemption of senior notes | | | (133,370 | ) | | | (29,950 | ) | | | (36,405 | ) |
1.
_Marketable Securities_
As of December 31, 2010 and 2009 the Company held marketable securities totaling $0 and $219,535, respectively.
These securities, which are debt securities issued by U.S. government agencies, are classified by the Company as held to maturity and are measured at amortized cost and mature within one year.
applicable (see below).
For the year ended December 31, 2008, the Company incurred pre-tax charges of approximately $165,000.
Land under development includes the land acquisition costs, direct improvement costs, capitalized interest, where applicable, and real estate taxes.
In January 2010, the Financial Accounting Standards Board (“FASB”) issued Accounting Standards Update (“ASU”) No. 2010-06, _Fair Value Measurements and Disclosures (Topic 820) — Improving Disclosures about Fair Value Measurements_, which amends ASC 820 to require the disclosure of additional information related to fair value measurement and provide clarification to existing requirements for fair value measurement disclosure.
ASU 2010-06 was effective for the Company beginning January 1, 2010.
The Company’s disclosures conform to the requirements of ASU 2010-06.
See Note 11 herein for additional discussion of fair value measurements.
In June 2009, the FASB issued SFAS No. 166, _Accounting for Transfers of Financial Assets_, as codified in ASC 860, _Transfers and Servicing_, which changes the conditions for reporting a transfer of a portion of a financial asset as a sale and requires additional year-end and interim disclosures.
An excerpt. Shown here: 40 of 433 rewritten, 40 of 244 added and 40 of 190 removed. The counts are complete. For every sentence, read Item 15. Exhibits and Financial Statement Schedules. in the FY2011 filing and the FY2010 filing.