 filings.tools
Item 5. Market for Registrant’s Common Equity, Related Stockholder Matters and Issuer Purchases of Equity Securities
6K characters. Original on sec.gov · Markdown
Item 5. Market for Registrant’s Common Equity, Related Stockholder Matters and Issuer Purchases of Equity Securities
| --- | --- |
Our common stock is traded on the New York Stock Exchange under the symbol “ORCL.” According to the records of our transfer agent, we had 9,575 stockholders of record as of May 31, 2018. The following table sets forth the low and high sale prices per share of our common stock, based on the last daily sale, in each of our last eight fiscal quarters.
| Fiscal 2018 | Fiscal 2017 | |||||||||||||||
| Low Sale Price | High Sale Price | Low Sale Price | High Sale Price | |||||||||||||
| Fourth Quarter | $ | 44.79 | $ | 52.97 | $ | 42.44 | $ | 45.73 | ||||||||
| Third Quarter | $ | 46.63 | $ | 52.75 | $ | 38.45 | $ | 43.17 | ||||||||
| Second Quarter | $ | 47.92 | $ | 52.80 | $ | 37.93 | $ | 41.25 | ||||||||
| First Quarter | $ | 44.68 | $ | 51.17 | $ | 38.44 | $ | 41.77 |
We declared and paid cash dividends totaling $0.76 and $0.64 per outstanding common share over the course of fiscal 2018 and fiscal 2017, respectively.
In June 2018, our Board of Directors declared a quarterly cash dividend of $0.19 per share of our outstanding common stock payable on July 31, 2018 to stockholders of record as of the close of business on July 17, 2018. We currently expect to continue paying comparable cash dividends on a quarterly basis; however, future declarations of dividends and the establishment of future record and payment dates are subject to the final determination of our Board of Directors.
For equity compensation plan information, please refer to Item 12 in Part III of this Annual Report.
Stock Repurchase Program
Our Board of Directors has approved a program for us to repurchase shares of our common stock. On December 14, 2017 and February 2, 2018, we announced that our Board of Directors approved expansions of our stock repurchase program totaling $24.0 billion. As of May 31, 2018, approximately $17.8 billion remained available for stock repurchases pursuant to our stock repurchase program.
Our stock repurchase authorization does not have an expiration date and the pace of our repurchase activity will depend on factors such as our working capital needs, our cash requirements for acquisitions and dividend payments, our debt repayment obligations or repurchases of our debt, our stock price, and economic and market conditions. Our stock repurchases may be effected from time to time through open market purchases or pursuant to a Rule 10b5-1 plan. Our stock repurchase program may be accelerated, suspended, delayed or discontinued at any time.
The following table summarizes the stock repurchase activity for the three months ended May 31, 2018 and the approximate dollar value of shares that may yet be purchased pursuant to our stock repurchase program:
| (in millions, except per share amounts) | Total Number of Shares Purchased | Average Price Paid per Share | Total Number of Shares Purchased as Part of Publicly Announced Program | Approximate Dollar Value of Shares that May Yet Be Purchased Under the Program | ||||||||||||
| March 1, 2018—March 31, 2018 | 35.5 | $ | 48.68 | 35.5 | $ | 21,120.5 | ||||||||||
| April 1, 2018—April 30, 2018 | 33.8 | $ | 45.72 | 33.8 | $ | 19,576.4 | ||||||||||
| May 1, 2018—May 31, 2018 | 37.2 | $ | 46.46 | 37.2 | $ | 17,848.4 | ||||||||||
| Total | 106.5 | $ | 46.97 | 106.5 | ||||||||||||
Table of Contents
Index to Financial Statements
Stock Performance Graph and Cumulative Total Return
The graph below compares the cumulative total stockholder return on our common stock with the cumulative total return of the S&P 500 Index and the S&P Information Technology Index for each of the last five fiscal years ended May 31, 2018, assuming an investment of $100 at the beginning of such period and the reinvestment of any dividends. The comparisons in the graphs below are based upon historical data and are not indicative of, nor intended to forecast, future performance of our common stock.
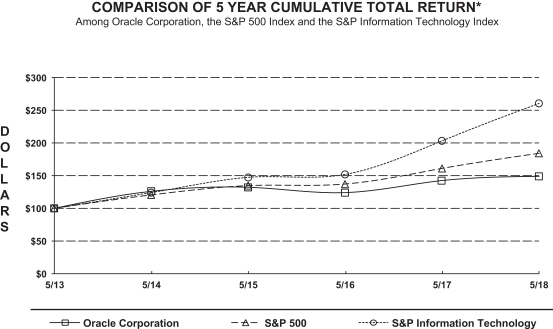
*$100 INVESTED ON MAY 31, 2013 IN STOCK OR
INDEX-INCLUDING REINVESTMENT OF DIVIDENDS
| 5/13 | 5/14 | 5/15 | 5/16 | 5/17 | 5/18 | |||||||||||||||||||
| Oracle Corporation | 100.0 | 126.1 | 132.1 | 124.0 | 142.3 | 148.8 | ||||||||||||||||||
| S&P 500 Index | 100.0 | 120.5 | 134.7 | 137.0 | 160.9 | 184.1 | ||||||||||||||||||
| S&P Information Technology Index | 100.0 | 123.9 | 147.2 | 151.8 | 203.1 | 260.4 |
COMPARISON OF 5 YEAR CUMULATIVE TOTAL RETURN” Among Oracle Corporation, the S&P 500 Index and the S&P Information Technology Index
Table of Contents
Index to Financial Statements
Previous: Item 4. Mine Safety Disclosures · Next: Item 6. Selected Financial Data