 filings.tools
O'Reilly Automotive (ORLY) 10-K risk factor changes: FY2018 vs FY2017
The 2018-12-31 10-K against the 2017-12-31 one, compared heading by heading and sentence by sentence. One of these filings carries no fiscal year tag, so its year is the calendar year of the period end.
Item 1A4 rewritten3 added2 removed142 unchanged
All filing items767 rewritten249 added249 removed1,870 unchanged
Summary
counted, not written
- Item 1A headings could not be compared: only 0 carried over between the two years, which usually means one filing was read wrongly, so none is reported as new or removed.
- Sentence by sentence, 249 added, 249 removed, 767 rewritten and 1,870 unchanged across 18 items that differ.
Sentences by item
22 items, with every count and a link to each item that changed
Underlined words on a shaded ground are new in FY2018; struck-through words were in FY2017. Sentences that are wholly new or wholly gone are labelled rather than marked.
Item 1A. Risk Factors
4 rewritten, 3 added, 2 removed, 142 unchanged
Online and mobile platforms may allow customers to quickly compare prices and product assortments between us and a range of competitors, which [removed: could result in pricing pressure.]
We cannot be sure that our growth plans for [removed: 2018] [added: 2019] and beyond will be achieved.
[removed: A failure to comply with these restrictions could result in a default under our financing obligations] or could require us to obtain waivers from our lenders for failure to comply with these restrictions.
As [removed: these and other] tax laws and related regulations [added: and interpretations] change, our financial condition, results of operations and cash flows could be materially impacted.
could result in pricing pressure.
| • | expose us to fluctuations in interest rates, including changes that may result from the implementation of new benchmark rates that replace LIBOR. |
A failure to comply with these restrictions could result in a default under our financing obligations
| • | expose us to fluctuations in interest rates. |
The final transition impacts of the Tax Act may differ materially from the estimates provided elsewhere in this report due to, among other things, changes in interpretations of the Tax Act, any legislative action to address questions that arise because of the Tax Act, any changes in accounting standards for income taxes or related interpretations in response to the Tax Act, or any updates or changes to estimates the Company has utilized to calculate the transition impacts.
Item 7. Management’s Discussion and Analysis of Financial Condition and Results of Operations
181 rewritten, 53 added, 61 removed, 347 unchanged
| • | our results of operations for the years ended December 31, [removed: 2017, 2016] [added: 2018, 2017] and [removed: 2015;] [added: 2016;] |
| • | our quarterly results for the years ended December 31, [removed: 2017,] [added: 2018,] and [removed: 2016;] [added: 2017;] and |
In addition, statements contained within this annual report that are not historical facts are forward-looking statements, such as statements discussing, among other things, expected growth, store development, integration and expansion strategy, business strategies, [removed: the impact of the U.S. Tax Cuts and Jobs Act,] future revenues and future performance.
Such statements are subject to risks, uncertainties and assumptions, including, but not limited to, the economy in general, inflation, [added: tariffs,] product demand, the market for auto parts, competition, weather, risks associated with the performance of acquired businesses, our ability to hire and retain qualified employees, consumer debt levels, our increased debt levels, credit ratings on public debt, governmental regulations, [added: information security and cyber attacks,] terrorist activities, war and the threat of war.
Please refer to the “Risk Factors” section of [removed: this] [added: our] annual report on Form 10-K for the year ended December 31, [removed: 2017,] [added: 2018,] for additional factors that could materially affect our financial performance.
As of December 31, [removed: 2017,] [added: 2018,] we operated [removed: 5,019] [added: 5,219] stores in 47 states.
[removed: We have ongoing initiatives aimed at tailoring] [added: g] our product offering to adjust to customers’ changing preferences, and we also have initiatives focused on marketing and training to educate customers on the advantages of ongoing vehicle maintenance, as well as “purchasing up” on the value spectrum.
| • | Number of Miles Driven – The number of total miles driven in the U.S. influences the demand for repair and maintenance products sold within the automotive aftermarket. In total, vehicles in the U.S. are driven approximately three trillion miles per year, resulting in ongoing wear and tear and a corresponding continued demand for the repair and maintenance products necessary to keep these vehicles in operation. According to the Department of Transportation, the number of total miles driven in the U.S. increased [removed: 1.2%, 2.4%] [added: 0.3%, 1.2%] and [removed: 3.5%] [added: 2.4%] in [removed: 2017, 2016] [added: 2018, 2017] and [removed: 2015,] [added: 2016,] respectively, and we expect to continue to see modest improvements in total miles driven in the U.S., supported by an increasing number of registered vehicles on the road, resulting in continued demand for automotive aftermarket products. |
| • | Number of U.S. Registered Vehicles, New Light Vehicle Registrations and Average Vehicle Age – The total number of vehicles on the road and the average age of the vehicle population heavily influence the demand for products sold within the automotive aftermarket industry. As reported by The Auto Care Association, the total number of registered vehicles increased [removed: 7%] [added: 8.5%] from [removed: 2006] [added: 2007] to [removed: 2016,] [added: 2017,] bringing the number of light vehicles on the road to [removed: 264] [added: 270] million by the end of [removed: 2016.] [added: 2017.] For the year ended December 31, [removed: 2017,] [added: 2018,] the seasonally adjusted annual rate of light vehicle sales in the U.S. (“SAAR”) was approximately [removed: 17.8] [added: 17.5] million, contributing to the continued growth in the total number of registered vehicles on the road. In the past decade, vehicle scrappage rates have remained relatively stable, ranging from [removed: 4.3%] [added: 4.2%] to 5.7% annually. As a result, over the past decade, the average age of the U.S. vehicle population has increased, growing [removed: 22%,] [added: 21.9%,] from [removed: 9.5] [added: 9.6] years in [removed: 2006] [added: 2007] to [removed: 11.6] [added: 11.7] years in [removed: 2016.] [added: 2017.] We believe this increase in average age can be attributed to better engineered and manufactured vehicles, which can be reliably driven at higher mileages due to better quality power trains and interiors and exteriors, and the consumer’s willingness to invest in maintaining these higher-mileage, better built vehicles. As the average age of vehicles on the road increases, a larger percentage of miles are being driven by vehicles that are outside of a manufacturer warranty. These out-of-warranty, older vehicles generate strong demand for automotive aftermarket products as they go through more routine maintenance cycles, have more frequent mechanical failures and generally require more maintenance than newer vehicles. We believe consumers will continue to invest in these reliable, higher-quality, higher-mileage vehicles and these investments, along with an increasing total light vehicle fleet, will support continued demand for automotive aftermarket products. |
| • | Unemployment – Unemployment, underemployment, the threat of future joblessness and the uncertainty surrounding the overall economic health of the U.S. have a negative impact on consumer confidence and the level of consumer discretionary spending. Long-term trends of high unemployment have historically impeded the growth of annual miles driven, as well as decrease consumer discretionary spending, both of which negatively impact demand for products sold in the automotive aftermarket industry. As of December 31, [removed: 2016,] [added: 2017,] the U.S. unemployment rate was [removed: 4.7%,] [added: 4.1%,] and as of December 31, [removed: 2017,] [added: 2018,] the U.S. unemployment rate decreased to [removed: 4.1%.] [added: 3.9%.] We believe total employment should remain at healthy levels supporting the trend of modest growth in total miles driven in the U.S. and the continued demand for automotive aftermarket products. |
| • | Under the Company’s share repurchase program, as approved by our Board of Directors in January of 2011, we may, from time to time, repurchase shares of our common stock, solely through open market purchases effected through a broker dealer at prevailing market prices, based on a variety of factors such as price, corporate trading policy requirements and overall market conditions. Our Board of Directors may increase or otherwise modify, renew, suspend or terminate the share repurchase program at any time, without prior notice. As announced on [removed: May 10, 2017, September 1, 2017, and] February 7, 2018, [added: and November 13, 2018,] our Board of Directors each time approved a resolution to increase the authorization amount under our share repurchase program by an additional $1.00 billion, resulting in a cumulative authorization amount of [removed: $10.75] [added: $11.75] billion. Each additional authorization is effective for a three\-year period, beginning on its respective announcement date. As of February [removed: 28, 2018,] [added: 27, 2019,] we had repurchased approximately [removed: 67.4] [added: 73.1] million shares of our common stock at an aggregate cost of [removed: $9.32] [added: $11.02] billion under this program. |
[removed: | • | On April 5, 2017, we entered into a new credit agreement.] The [removed: new credit agreement provided] [added: Credit Agreement provides] for a [added: five-year] $1.20 billion unsecured revolving credit facility [added: (the “Revolving Credit Facility”)] arranged by JPMorgan Chase Bank, N.A., which is scheduled to mature in April 2022. [removed: |]
| • | On [removed: August] [added: May] 17, [removed: 2017,] [added: 2018,] we issued [removed: $750] [added: $500] million aggregate principal amount of unsecured [removed: 3.600%] [added: 4.350%] Senior Notes due [removed: 2027 (“3.600%] [added: 2028 (“4.350%] Senior Notes due [removed: 2027”)] [added: 2028”)] at a price to the public of [removed: 99.840%] [added: 99.732%] of their face value with [removed: UMB,] [added: UMB Bank,] N.A. as trustee. Interest on the [removed: 3.600%] [added: 4.350%] Senior Notes due [removed: 2027] [added: 2028] is payable on [removed: March] [added: June] 1 and [removed: September] [added: December] 1 of each year, [removed: beginning] [added: which began] on [removed: March] [added: December] 1, 2018, and is computed on the basis of a 360\-day year. |
The following table includes income statement data as a percentage of sales for the years ended December 31, [removed: 2017, 2016] [added: 2018, 2017] and [removed: 2015:][added: 2016:]
| | [removed: 2017] [added: 2018] | | | [removed: 2016] [added: 2017] | | | [removed: 2015] [added: 2016] | |
| Cost of goods sold, including warehouse and distribution expenses | [removed: 47.4] [added: 47.2] | | | [removed: 47.5] [added: 47.4] | | | [removed: 47.7] [added: 47.5] | |
| Gross profit | [removed: 52.6] [added: 52.8] | | | [removed: 52.5] [added: 52.6] | | | [removed: 52.3] [added: 52.5] | |
| Selling, general and administrative expenses | [removed: 33.4] [added: 33.8] | | | [removed: 32.7] [added: 33.4] | | | [removed: 33.2] [added: 32.7] | |
| Operating income [removed: (1)] | [removed: 19.2] [added: 19.0] | | | [removed: 19.8] [added: 19.2] | | | [removed: 19.0] [added: 19.8] | |
| Interest expense | [removed: (1.0] [added: (1.3] | ) | | [removed: (0.8] [added: (1.0] | ) | | [removed: (0.7] [added: (0.8] | ) |
| Interest income | — | | | [removed: 0.1] [added: —] | | | [removed: —] [added: 0.1] | |
| Income before income taxes [added: (1)] | [removed: 18.2] [added: 17.8] | | | [removed: 19.1] [added: 18.2] | | | [removed: 18.3] [added: 19.1] | |
| Provision for income taxes | [removed: 5.6] [added: 3.9] | | | [removed: 7.0] [added: 5.6] | | | [removed: 6.6] [added: 7.0] | |
| Net income | [removed: 12.6] [added: 13.9] | % | | [removed: 12.1] [added: 12.6] | % | | [removed: 11.7] [added: 12.1] | % |
Sales for the year ended December 31, 2017, increased $385 [removed: million] [added: million, or 4%,] to $8.98 billion from $8.59 billion for the same period [removed: one year ago, representing an increase of 4%.][added: in 2016.]
Comparable store sales are calculated based on the change in sales [removed: of] [added: for] stores open at least one year and exclude sales of specialty machinery, sales to independent parts [removed: stores,] [added: stores and] sales to Team [removed: Members and sales from Leap Day during the year ended December 31, 2016.][added: Members.]
| [removed: Sales] [added: Decline] in [removed: 2016] [added: sales] for stores that have closed | [removed: (5] [added: (7] | | ) |
We believe the increased sales achieved by our stores were the result of store growth, sales from the 48 acquired Bond [added: Auto Parts (“Bond”)] stores, the high levels of customer service provided by our well-trained and technically proficient Team Members, superior inventory availability, including same day and over-night access to inventory in our regional distribution centers, enhanced services and programs offered in our stores, a broader selection of product offerings in most stores with a dynamic catalog system to identify and source parts, a targeted promotional and advertising effort through a variety of media and localized promotional events, continued improvement in the merchandising and store layouts of our stores, compensation programs for all store Team Members that provide incentives for performance and our continued focus on serving both DIY and professional service provider customers.
Our comparable store sales increase for the year ended December 31, 2017, was driven by increases in average ticket values for both DIY and professional service provider customers, partially offset by negative customer transaction counts from both our DIY and [added: professional service provider customers.]
The improvement in average ticket values was the result of the increasing complexity and cost of replacement parts necessary to maintain the current population of [removed: better engineered] [added: better-engineered] and more technically advanced [removed: vehicles.][added: vehicles and same SKU inflation.]
Gross profit for the year ended December 31, 2017, increased [added: 5%] to $4.72 billion (or 52.6% of sales) from $4.51 billion (or 52.5% of sales) for the same period [removed: one year ago, representing an increase of 5%.][added: in 2016.]
The increase in gross profit dollars for the year ended December 31, 2017, was primarily a result of sales from new stores, the increase in comparable store sales at existing stores and sales from the 48 acquired Bond stores, partially offset by [removed: prior year] gross profit dollars generated from one additional day due to Leap [removed: Day.][added: Day for the same period one year prior.]
The increase in gross profit as a percentage of sales for the year ended December 31, 2017, was primarily due to a smaller non-cash [removed: last-in, first-out (“LIFO”)] [added: LIFO] impact, partially offset by a lower merchandise margin and higher inventory shrinkage.
The smaller LIFO impact is the result of fewer product acquisition cost improvements during the year ended December 31, 2017, compared [removed: to the same period one year ago.][added: 2016.]
Selling, general and administrative expenses (“SG&A”) for the year ended December 31, [removed: 2017,] [added: 2018,] increased [added: 8%] to [removed: $3.00] [added: $3.22] billion (or [removed: 33.4%] [added: 33.8%] of sales) from [removed: $2.81] [added: $3.00] billion (or [removed: 32.7%] [added: 33.4%] of sales) for the same period [removed: one year ago, representing an increase of 7%.][added: in 2017.]
The increase in total SG&A dollars for the year ended December 31, 2017, was primarily the result of additional Team Members, facilities and vehicles to support our increased sales and store count, partially offset by a $9.1 million benefit from the reduction in our legal accrual following the expiration of the statute of limitations related to a legacy claim and [removed: prior year] incremental SG&A expenses incurred from one additional day due to Leap [removed: Day.][added: Day for the same period one year prior.]
The increase in SG&A as a percentage of sales for the year ended December 31, 2017, was primarily due to deleverage of store operating costs on soft comparable store sales during the [removed: current period.][added: year ended December 31, 2017.]
As a result of the impacts discussed above, operating income for the year ended December 31, 2017, increased [added: 2%] to $1.73 billion (or 19.2% of sales) from $1.70 billion (or 19.8% of sales) for the same period [removed: one year ago, representing an increase of 2%.][added: in 2016.]
Total other expense for the year ended December 31, 2017, increased [added: 41%] to $88 million (or 1.0% of sales), from $62 million (or 0.7% of sales) for the same period [removed: one year ago, representing an increase of 41%.][added: in 2016.]
Our provision for income taxes for the year ended December 31, 2017, decreased [added: 16%] to $504 million (30.8% effective tax rate) from $600 million (36.6% effective tax rate) for the same period [removed: one year ago, representing a decrease of 16%.][added: in 2016.]
We have ongoing initiatives aimed at tailorin
| • | After the close of business on December 31, 2018, we completed an asset purchase of Bennett Auto Supply, Inc. (“Bennett”), a privately held automotive parts supplier. The asset purchase included 33 stores that were not included in the Company’s 2018 store count and were not operated by the Company in 2018, and a warehouse located in southern Florida. |
2018 Compared to 2017
Online sales, resulting from ship-to-home orders and pickup in-store orders, for stores open at least one year, are included in the comparable store sales calculation.
| Sales for stores opened throughout 2018 | 120 | | |
During the year ended December 31, 2018, DIY transaction counts also continued to be pressured by increased gas prices and other inflationary impacts, resulting in an increased deferral of vehicle maintenance and repairs over the short term.
As of December 31, 2018, we operated 5,219 stores in 47 states compared to 5,019 stores in 47 states at December 31, 2017.
After the close of business on December 31, 2018, we acquired the 33 Bennett stores that were not included in our 2018 store count and were not operated by the Company in 2018.
We anticipate new store growth will be 200 to 210 net, new store openings in 2019 and will net an additional 20 stores, as we will merge 13 of the acquired 33 Bennett stores into existing O’Reilly stores during 2019.
The increase in distribution expenses was primarily due to wage pressure and increased transportation costs, as compared to 2017.
During the year ended December 31, 2018, we did not realize net acquisition cost decreases, and as a result, we did not record a LIFO charge.
The increase in total SG&A dollars for the year ended December 31, 2018, was primarily the result of additional Team Members, facilities and vehicles to support our increased sales and store count, the planned allocation of a portion of the tax savings realized as a result of the U.S. Tax Cuts and Jobs Act, enacted in December 2017 (the “Tax Act”) and unfavorable comparison to a 2017 benefit of $9.1 million from the reduction in our legal accrual following the expiration of the statute of limitations related to a legacy claim.
The increase in SG&A as a percentage of sales for the year ended December 31, 2018, was primarily due to our tax savings allocation initiatives and the 2017 legal accrual benefit.
The decreases in our provision for income taxes and our effective tax rate for the year ended December 31, 2018, were primarily the result of the lower federal corporate tax rate set forth by the Tax Act, partially offset by a $53 million benefit in 2017 from the required revaluation of our deferred income tax liabilities based on the lower federal corporate tax rate set forth by the Tax Act and lower excess tax benefits from share-based compensation in 2018, as compared 2017.
During the year ended December 31, 2018 and 2017, excess tax benefits from share-based compensation were approximately $35 million and $49 million, respectively.
Due to the revaluation of our deferred income tax liabilities in 2017, our diluted earnings per common share for the year ended December 31, 2017, included a one-time benefit of $0.59.
Online sales, resulting from ship-to-home orders and pickup in-store orders, for stores open at least one year, are included in the comparable store sales calculation.
Additionally, decreased demand or changes in buying patterns could impact our ability to meet the
The increase in net cash provided by operating activities in 2018 compared to 2017 was primarily due to increased operating income, reduced cash taxes paid, due to the Tax Act, and a reduction of accounts receivable, due to the business day timing of year-end 2018, as compared to 2017.
The smaller increase in our accounts payable to inventory ratio in 2017
After the close of business on December 31, 2018, we acquired the 33 Bennett stores that were not included in our 2018 store count and were not operated by the Company in 2018.
| | 2018 | | | | 2017 | | |
| Rent expense | 317,283 | | | | 298,614 | | |
| (1) | Prior period amount has been reclassified to conform to current period presentation, due to the Company’s adoption of a new accounting standard during the first quarter ended March 31, 2017. See Note 1 “Summary of Significant Accounting Policies” to the Consolidated Financial Statements of the annual report on Form 10-K for the year ended December 31, 2017. |
| | 2018 | | | | 2017 | | |
| Long-term debt principal and interest payments (1) | | $ | 4,273,542 | | | $ | 141,414 | | | $ | 1,077,183 | | | $ | 1,056,936 | | | $ | 1,998,009 | |
| Future minimum lease payments under operating leases (2) | | 2,429,044 | | | | 309,743 | | | | 557,091 | | | | 447,607 | | | | 1,114,603 | | |
| Self-insurance reserves (3) | | 157,538 | | | | 77,012 | | | | 48,864 | | | | 19,255 | | | | 12,407 | | |
| Total contractual cash obligations | | $ | 7,037,788 | | | $ | 705,833 | | | $ | 1,683,138 | | | $ | 1,523,798 | | | $ | 3,125,019 | |
from the date of issuance.
If the price of O’Reilly’s stock, which was a
authority, experience with previous tax audits and applicable tax law rulings.
| | Fiscal 2018 | | | | | | | | | | | | | | |
| Comparable store sales | 3.4 | | % | | 4.6 | | % | | 3.9 | | % | | 3.3 | | % |
| Sales | $ | 2,282,681 | | | $ | 2,456,073 | | | $ | 2,482,717 | | | $ | 2,314,957 | |
| Gross profit | 1,201,258 | | | | 1,288,638 | | | | 1,315,755 | | | | 1,234,315 | | |
| Operating income | 422,846 | | | | 479,150 | | | | 485,148 | | | | 428,040 | | |
| Net income | 304,906 | | | | 353,073 | | | | 366,151 | | | | 300,357 | | |
| Earnings per share – basic (1) | $ | 3.65 | | | $ | 4.32 | | | $ | 4.54 | | | $ | 3.76 | |
In July of 2018, the FASB issued ASU No. 2018-11, “Leases (Topic 842): Targeted Improvement” (“ASU 2018-11”), to provide an additional, optional transition method for adopting ASU 2016-02, which allows for an entity to choose to apply the new lease standard at adoption date and recognize a cumulative-effective adjustment to the opening balance of retained earnings in the period of adoption, while comparative periods presented will continue to be in accordance with current U.S. GAAP Topic 840.
professional service provider customers.
We anticipate new store growth will be 200 net, new store openings in 2018.
2016 Compared to 2015
| Sales for stores opened throughout 2016 and sales from acquired Bond stores | 106 | | |
| Sales from Leap Day | 24 | | |
Customer transaction counts for both DIY and professional service provider customers increased for the year ended December 31, 2016, despite the added pressure from the better engineered, more technically advanced vehicles requiring less frequent repairs.
The increase in customer transaction counts was supported by an increase in miles driven, and the corresponding increase in vehicle maintenance, lower year-over-year gas prices and decreasing unemployment levels, creating an overall positive macroeconomic environment.
The increase in our DIY customer transaction counts benefited from our continued focus on ensuring our stores are staffed with knowledgeable parts professionals to assist our DIY customers during high DIY traffic periods, such as nights and weekends.
The
increase in our professional service provider customer transaction counts benefited from the continued growth of our less mature markets and our better parts and service availability.
As of December 31, 2016, we operated 4,829 stores in 47 states compared to 4,571 stores in 44 states at December 31, 2015.
Product acquisition cost improvements are the result of our ongoing negotiations with our suppliers to improve our inventory purchase costs based on our increasing scale.
The non-cash LIFO impact is the result of these continued product acquisition cost reductions, and due to these reductions, we fully depleted our LIFO reserve in 2013.
Our policy is to not write up inventory in excess of replacement cost, and accordingly, we were effectively valuing our inventory at replacement cost.
The increase in total SG&A dollars for the year ended December 31, 2016, was primarily the result of additional Team Members, facilities and vehicles to support our increased sales and store count and one additional day due to Leap Day.
The decrease in SG&A as a percentage of sales for the year ended December 31, 2016, was primarily the result of increased leverage of store occupancy costs on comparable store sales growth and a $19 million litigation loss charge in 2015, resulting from an adverse verdict in a contract dispute with a former service provider.
The increase in our provision for income taxes for the year ended December 31, 2016, was the result of higher taxable income in 2016, primarily driven by our strong operating results, and higher effective tax rates.
The increase in our effective tax rate for the year ended December 31, 2016, was primarily due to a larger amount of favorable resolutions of historical tax matters in 2015, compared to 2016, and a smaller benefit in 2016 from the realization of employment tax credits.
revolving credit facility.
Net inventory investment reflects our investment in inventory, net of the amount of accounts payable to suppliers.
The increase in net cash provided by operating activities in 2016 compared to 2015 was primarily due to an increase in net income and a greater decrease in net inventory investment, partially offset by a decrease in income taxes payable.
Our accounts payable to inventory ratio was 105.7%, 99.1% and 94.6% as of December 31, 2016, 2015 and 2014, respectively.
The larger increase in our accounts payable to inventory ratio in 2016 was primarily attributable to incrementally better terms from our suppliers and additional suppliers participating in our supplier financing programs.
The decrease from income taxes payable in 2016, compared to the increase in income taxes payable in 2015, was primarily the result of a prepaid income taxes position at the end of 2016, versus an income taxes payable position at the end of 2015.
The new Credit Agreement provides for a five-year $1.20 billion unsecured revolving credit facility (the “Revolving Credit Facility”) arranged by JPMorgan Chase Bank, N.A., which is scheduled to mature in April 2022.
In conjunction with the closing of the new Credit Agreement, the Company’s previous credit agreement, which was originally entered into on January 14, 2011, as amended, was terminated (the “Terminated Credit Agreement”), and all outstanding loans and commitments, including the guarantees of each of the subsidiary guarantors, under the Terminated Credit Agreement were terminated and replaced by the loans and commitments under the new Credit Agreement.
None of our subsidiaries are guarantors or obligors under the new Credit Agreement.
As of December 31, 2016, we had no outstanding borrowings under our terminated unsecured revolving credit facility.
Interest on the
| | 2017 | | | | 2016 | | | | 2015 | | |
| Long-term debt principal and interest payments (1) | | $ | 3,749,456 | | | $ | 123,845 | | | $ | 245,440 | | | $ | 1,628,581 | | | $ | 1,751,590 | |
| Future minimum lease payments under operating leases (2) | | 2,367,161 | | | | 293,317 | | | | 535,669 | | | | 433,506 | | | | 1,104,669 | | |
| Self-insurance reserves (3) | | 147,661 | | | | 71,695 | | | | 47,306 | | | | 18,490 | | | | 10,170 | | |
| Total contractual cash obligations | | $ | 6,318,646 | | | $ | 543,225 | | | $ | 828,415 | | | $ | 2,080,577 | | | $ | 2,866,429 | |
increased costs through higher retail prices for the affected products.
| | Fiscal 2016 | | | | | | | | | | | | | | |
| Comparable store sales | 6.1 | | % | | 4.3 | | % | | 4.2 | | % | | 4.8 | | % |
| Sales | $ | 2,096,150 | | | $ | 2,176,689 | | | $ | 2,220,955 | | | $ | 2,099,302 | |
| Gross profit | 1,097,579 | | | | 1,127,179 | | | | 1,170,026 | | | | 1,114,227 | | |
| Operating income | 418,626 | | | | 425,061 | | | | 447,809 | | | | 407,710 | | |
An excerpt. Shown here: 40 of 181 rewritten, 40 of 53 added and 40 of 61 removed. The counts are complete. For every sentence, read Item 7. Management’s Discussion and Analysis of Financial Condition and Results of Operations in the FY2018 filing and the FY2017 filing.
Item 7A. Quantitative and Qualitative Disclosures about Market Risk
6 rewritten, 0 added, 0 removed, 3 unchanged
We are subject to interest rate risk to the extent we borrow against our unsecured revolving credit facility (the “Revolving Credit Facility”) with variable interest rates based on either [removed: a] [added: an Alternative] Base Rate or [removed: Eurodollar] [added: Adjusted LIBO] Rate, as defined in the credit agreement governing the Revolving Credit Facility.
As of December 31, [removed: 2017,] [added: 2018,] we had outstanding borrowings under our Revolving Credit Facility in the amount of [removed: $346] [added: $287] million, at the weighted-average variable interest rate of [removed: 2.675%.][added: 4.560%.]
At this borrowing level, a [removed: 0.25%] [added: 0.50%] increase in interest rates would have had an unfavorable annual impact on our pre-tax earnings and cash flows in the amount of [removed: $0.9] [added: $1.4] million.
We had outstanding fixed rate debt of [removed: $2.65] [added: $3.15] billion and [removed: $1.90] [added: $2.65] billion as of December 31, [removed: 2017] [added: 2018] and [removed: 2016,] [added: 2017,] respectively.
The fair value of our fixed rate debt was estimated at [removed: $2.73] [added: $3.12] billion and [removed: $1.98] [added: $2.73] billion as of December 31, [removed: 2017] [added: 2018] and [removed: 2016,] [added: 2017,] respectively, which was determined by reference to quoted market prices.
As of December 31, [removed: 2017,] [added: 2018,] our cash and cash equivalents totaled [removed: $46] [added: $31] million.
Item 1. Business
88 rewritten, 54 added, 39 removed, 396 unchanged
At December 31, [removed: 2017,] [added: 2018,] we operated [removed: 5,019] [added: 5,219] stores in 47 states.
In [removed: 2017,] [added: 2018,] we derived approximately [removed: 58%] [added: 57%] of our sales from our DIY customers and approximately [removed: 42%] [added: 43%] of our sales from our professional service provider customers.
We believe we will continue to have a competitive advantage on the professional service provider portion of our business, due to our systems, knowledge and experience serving the professional service provider side of the automotive aftermarket, supported by our approximately [removed: 780] [added: 790] full-time sales staff dedicated solely to calling upon and servicing the professional service provider customer.
We require our Professional Parts People to undergo extensive and ongoing training and to be knowledgeable, particularly with respect to hard part repairs, in order to better serve the technically-oriented professional [added: service provider customers with whom they interact on a daily basis.]
We currently operate 27 regional DCs, which provide our stores with same-day or overnight access to an average of [removed: 157,000] [added: 156,000] stock keeping units (“SKUs”), many of which are hard-to-find items not typically stocked by other auto parts retailers.
To augment our robust distribution network, we operate [removed: 331] [added: a total of 342] Hub stores that also provide delivery service and same-day access to an average of [removed: 48,000] [added: 66,000] SKUs [added: from a Super Hub or 42,000 SKUs from a Hub] to other stores within the surrounding area.
We have a strong management team comprised of [removed: 190] [added: 194] senior managers who average [removed: 19] [added: 20] years of service; [removed: 244] [added: 254] corporate managers who average 16 years of service; and [removed: 496] [added: 518] district managers who average [removed: 12] [added: 13] years of service.
Our management team has demonstrated the consistent ability to successfully execute our business plan and growth strategy by generating [removed: 25] [added: 26] consecutive years of record revenues and earnings and positive comparable store sales results since becoming a public company in April of 1993.
During [removed: 2017,] [added: 2018,] we opened [removed: 190] [added: 200] net, new [removed: stores] [added: stores,] and [added: in 2019,] we plan to open approximately 200 [added: to 210] net, new [removed: stores in 2018,] [added: stores,] which will increase our penetration in existing markets and allow for expansion into new, contiguous markets.
While we [removed: have faced,] [added: have,] and [removed: expect to] continue to face, aggressive competition in the more densely populated markets, we believe we have competed effectively, and are well positioned to continue to compete effectively, in such markets and to achieve our goal of continued profitable sales growth within these markets.
We believe that while competitive pricing is an essential component of successful growth in the automotive aftermarket business, it is customer satisfaction, whether of the DIY consumer or professional service provider, resulting from superior customer [removed: service] [added: service,] that generates increased sales and profitability.
The automotive aftermarket industry is still highly fragmented, and we believe the ability of national auto parts chains, [removed: such as ourselves,] [added: like O’Reilly,] to operate more efficiently and effectively than smaller independent [removed: operators] [added: operators,] will result in continued industry consolidation.
Our current prototype store design features optimized square footage, high ceilings, convenient interior store layouts, in-store signage, bright lighting, convenient [removed: ingress and] [added: ingress,] egress and parking, and dedicated counters to serve professional service provider customers, each designed to increase sales and operating efficiencies [removed: and] [added: to] enhance overall customer service.
Regardless of how our customers begin their interaction, whether in-store, over the telephone or [removed: electronically,] [added: digitally,] and complete their transaction, whether in-store or delivery to their home or business, our goal is to provide excellent customer service and a seamless experience.
We continue to [removed: enhance] [added: improve] the functionality of our websites to provide our customers with a user-friendly and convenient shopping experience, as well as a robust product and repair content information resource, which will continue to [removed: build] [added: enhance] the O’Reilly Brand.
As of January 31, [removed: 2018,] [added: 2019,] we employed [removed: 75,289] [added: 79,174] Team Members [removed: (45,440] [added: (49,476] full-time Team Members and [removed: 29,849] [added: 29,698] part-time Team Members), of whom [removed: 64,104] [added: 67,369] were employed at our stores, [removed: 8,148] [added: 8,372] were employed at our DCs and [removed: 3,037] [added: 3,433] were employed at our corporate and regional offices.
A union represents [removed: 49] [added: 48] stores [removed: (477] [added: (506] Team Members) in the Greater Bay Area in California and has for many years.
In addition, approximately [removed: 67] [added: 62] Team Members who drive over-the-road trucks in two of our DCs are represented by labor unions.
Our tradition for [removed: 61] [added: 62] years has been to treat all of our Team Members with honesty and respect and to commit significant resources to instill in them our “Live Green” culture, which emphasizes the importance of each Team Member’s contribution to the success of O’Reilly.
Our stores, on average, carry approximately 23,000 SKUs and average approximately [removed: 7,300] [added: 7,400] total square feet in size.
At December 31, [removed: 2017,] [added: 2018,] we had a total of approximately [removed: 37] [added: 38] million square feet in our [removed: 5,019] [added: 5,219] stores.
Our stores are served primarily by the nearest DC, which averages [removed: 157,000] [added: 156,000] SKUs, but also have same-day access to the broad selection of inventory available at one of our [removed: 331] [added: 342] Hub stores, [removed: which, on average, carry] [added: which are comprised of 84 Super Hubs that average] approximately [removed: 48,000] [added: 15,600 square feet and carry an average of 66,000] SKUs and [added: 258 Hubs that] average approximately [removed: 10,900] [added: 10,000] square feet [removed: in size.][added: and carry an average of 42,000 SKUs.]
The following table sets forth the geographic distribution and activity of our stores as of December 31, [removed: 2017] [added: 2018] and [removed: 2016:][added: 2017:]
| | | December 31, [removed: 2016] [added: 2017] | | | | | | [removed: 2017] [added: 2018] Net, New Stores | | | | | | December 31, [removed: 2017] [added: 2018] | | | | | | | |
| Illinois | | [removed: 186] [added: 193] | | | [removed: 3.9] [added: 3.8] | % | | [removed: 7] [added: 10] | | | [removed: 3.7] [added: 5.0] | % | | [removed: 193] [added: 203] | | | [removed: 3.8] [added: 3.9] | % | | [removed: 36.2] [added: 31.9] | % |
| Ohio | | [removed: 169] [added: 180] | | | [removed: 3.5] [added: 3.6] | % | | [removed: 11] [added: 16] | | | [removed: 5.8] [added: 8.0] | % | | [removed: 180] [added: 196] | | | [removed: 3.6] [added: 3.8] | % | | 43.4 | % |
| Tennessee | | [removed: 162] [added: 167] | | | [removed: 3.4] [added: 3.3] | % | | [removed: 5] [added: 9] | | | [removed: 2.6] [added: 4.5] | % | | [removed: 167] [added: 176] | | | [removed: 3.3] [added: 3.4] | % | | [removed: 46.7] [added: 46.8] | % |
| Oklahoma | | 121 | | | [removed: 2.5] [added: 2.4] | % | | — | | | 0.0 | % | | 121 | | | [removed: 2.4] [added: 2.3] | % | | [removed: 68.8] [added: 71.3] | % |
| Arkansas | | [removed: 107] [added: 110] | | | 2.2 | % | | [removed: 3] [added: 2] | | | [removed: 1.6] [added: 1.0] | % | | [removed: 110] [added: 112] | | | [removed: 2.2] [added: 2.1] | % | | 75.7 | % |
| South Carolina | | [removed: 91] [added: 104] | | | [removed: 1.9] [added: 2.1] | % | | [removed: 13] [added: 4] | | | [removed: 6.7] [added: 2.0] | % | | [removed: 104] [added: 108] | | | 2.1 | % | | 77.8 | % |
| Colorado | | [removed: 99] [added: 101] | | | [removed: 2.1] [added: 2.0] | % | | [removed: 2] [added: 1] | | | [removed: 1.1] [added: 0.5] | % | | [removed: 101] [added: 102] | | | 2.0 | % | | 79.8 | % |
| Iowa | | [removed: 73] [added: 74] | | | 1.5 | % | | [removed: 1] [added: 3] | | | [removed: 0.5] [added: 1.5] | % | | [removed: 74] [added: 77] | | | 1.5 | % | | [removed: 86.3] [added: 87.6] | % |
| Nevada | | [removed: 54] [added: 55] | | | 1.1 | % | | 1 | | | 0.5 | % | | [removed: 55] [added: 56] | | | 1.1 | % | | [removed: 91.5] [added: 92.3] | % |
| New Mexico | | [removed: 52] [added: 53] | | | 1.1 | % | | [removed: 1] [added: 3] | | | [removed: 0.5] [added: 1.5] | % | | [removed: 53] [added: 56] | | | 1.1 | % | | [removed: 92.6] [added: 91.2] | % |
| Idaho | | [removed: 40] [added: 42] | | | [removed: 0.8] [added: 0.9] | % | | 2 | | | [removed: 1.1] [added: 1.0] | % | | [removed: 42] [added: 44] | | | [removed: 0.9] [added: 0.8] | % | | [removed: 94.5] [added: 94.0] | % |
| Maine | | 35 | | | 0.7 | % | | — | | | 0.0 | % | | 35 | | | 0.7 | % | | [removed: 95.2] [added: 95.4] | % |
| Wyoming | | [removed: 20] [added: 21] | | | 0.4 | % | | [removed: 1] [added: —] | | | [removed: 0.5] [added: 0.0] | % | | 21 | | | 0.4 | % | | 97.9 | % |
| South Dakota | | [removed: 16] [added: 17] | | | 0.3 | % | | 1 | | | 0.5 | % | | [removed: 17] [added: 18] | | | 0.3 | % | | [removed: 98.5] [added: 98.6] | % |
| Alaska | | 15 | | | 0.3 | % | | — | | | 0.0 | % | | 15 | | | 0.3 | % | | [removed: 98.8] [added: 98.9] | % |
| North Dakota | | 15 | | | 0.3 | % | | — | | | 0.0 | % | | 15 | | | 0.3 | % | | [removed: 99.1] [added: 99.2] | % |
| • | many enhanced service programs, including battery and electrical testing, battery, wiper and bulb replacement and check engine light code extractions; |
In addition, after the close of business on December 31, 2018, we acquired the 33 Bennett Auto Supply, Inc. stores that were not included in our 2018 store count and were not operated by the Company in 2018.
During 2018, we relocated 18 stores and performed minor to major updates or renovations to approximately 1,000 additional stores.
| Texas | | 690 | | | 13.7 | % | | 16 | | | 8.0 | % | | 706 | | | 13.5 | % | | 13.5 | % |
| California | | 541 | | | 10.8 | % | | 12 | | | 6.0 | % | | 553 | | | 10.6 | % | | 24.1 | % |
| Georgia | | 196 | | | 3.9 | % | | 9 | | | 4.5 | % | | 205 | | | 3.9 | % | | 28.0 | % |
| Missouri | | 200 | | | 4.0 | % | | 1 | | | 0.5 | % | | 201 | | | 3.9 | % | | 35.8 | % |
| Florida | | 180 | | | 3.6 | % | | 20 | | | 10.0 | % | | 200 | | | 3.8 | % | | 39.6 | % |
| North Carolina | | 162 | | | 3.2 | % | | 11 | | | 5.5 | % | | 173 | | | 3.3 | % | | 50.1 | % |
| Michigan | | 162 | | | 3.2 | % | | 6 | | | 3.0 | % | | 168 | | | 3.2 | % | | 53.3 | % |
| Washington | | 156 | | | 3.1 | % | | — | | | 0.0 | % | | 156 | | | 3.0 | % | | 56.3 | % |
| Alabama | | 132 | | | 2.6 | % | | 7 | | | 3.5 | % | | 139 | | | 2.7 | % | | 59.0 | % |
| Arizona | | 137 | | | 2.7 | % | | 2 | | | 1.0 | % | | 139 | | | 2.7 | % | | 61.7 | % |
| Indiana | | 126 | | | 2.5 | % | | 11 | | | 5.5 | % | | 137 | | | 2.6 | % | | 64.3 | % |
| Minnesota | | 122 | | | 2.4 | % | | 3 | | | 1.5 | % | | 125 | | | 2.4 | % | | 66.7 | % |
| Louisiana | | 116 | | | 2.3 | % | | 5 | | | 2.5 | % | | 121 | | | 2.3 | % | | 69.0 | % |
| Wisconsin | | 120 | | | 2.4 | % | | 1 | | | 0.5 | % | | 121 | | | 2.3 | % | | 73.6 | % |
| Kentucky | | 88 | | | 1.8 | % | | 7 | | | 3.5 | % | | 95 | | | 1.7 | % | | 81.5 | % |
| Kansas | | 84 | | | 1.7 | % | | 1 | | | 0.5 | % | | 85 | | | 1.6 | % | | 83.1 | % |
| Mississippi | | 75 | | | 1.5 | % | | 3 | | | 1.5 | % | | 78 | | | 1.5 | % | | 84.6 | % |
| Virginia | | 74 | | | 1.5 | % | | 4 | | | 2.0 | % | | 78 | | | 1.5 | % | | 86.1 | % |
| Oregon | | 69 | | | 1.4 | % | | 1 | | | 0.5 | % | | 70 | | | 1.3 | % | | 88.9 | % |
| Utah | | 61 | | | 1.2 | % | | 3 | | | 1.5 | % | | 64 | | | 1.2 | % | | 90.1 | % |
| Nebraska | | 43 | | | 1.0 | % | | 2 | | | 1.0 | % | | 45 | | | 0.9 | % | | 93.2 | % |
| Massachusetts | | 32 | | | 0.6 | % | | 7 | | | 3.5 | % | | 39 | | | 0.7 | % | | 94.7 | % |
| New Hampshire | | 35 | | | 0.7 | % | | (3 | ) | | (1.5 | )% | | 32 | | | 0.6 | % | | 96.0 | % |
| Montana | | 27 | | | 0.5 | % | | 1 | | | 0.5 | % | | 28 | | | 0.5 | % | | 96.5 | % |
| Pennsylvania | | 17 | | | 0.3 | % | | 7 | | | 3.5 | % | | 24 | | | 0.5 | % | | 97.0 | % |
| Connecticut | | 12 | | | 0.2 | % | | 8 | | | 4.0 | % | | 20 | | | 0.4 | % | | 98.3 | % |
| West Virginia | | 15 | | | 0.3 | % | | — | | | 0.0 | % | | 15 | | | 0.3 | % | | 99.5 | % |
As of December 31, 2018, we had a total growth capacity of more than 615 stores in our distribution center network, which will increase by approximately 275 stores with the completion of our Twinsburg, Ohio, DC in 2019.
Further enhancing our distribution capabilities in 2020, we plan to relocate and merge our existing Nashville, Tennessee, and Knoxville, Tennessee, DCs into a larger facility located in Lebanon, Tennessee, providing a larger, more efficient facility to serve both markets, while also allowing us to convert the existing Knoxville, Tennessee, DC into a large Hub that will continue to provide same day parts availability in the attractive Knoxville market.
With our planned DC expansion during 2019, we expect to end the year in 2019 operating 28 DCs comprised of approximately 11.2 million operating square feet.
| | |
| --- | --- |
Johnson, age 53, Chief Executive Officer and Co-President, has been an O’Reilly Team Member for 36 years, which includes continuous years of service with a company acquired by O’Reilly.
Mr. Beckham’s
Mr. Andrews’s primary areas of responsibility are Human Resources and Training.
Mr. Andrews has over 25 years of human resources experience.
Mr. Andrews’s career includes human resource positions with Cargill, Inc. and Tyson Foods, Inc. before accepting a position with AutoNation.
service provider customers with whom they interact on a daily basis.
During 2017, we relocated 22 stores and renovated 25 stores.
| Texas | | 667 | | | 13.8 | % | | 23 | | | 12.1 | % | | 690 | | | 13.7 | % | | 13.7 | % |
| California | | 534 | | | 11.0 | % | | 7 | | | 3.7 | % | | 541 | | | 10.8 | % | | 24.5 | % |
| Missouri | | 195 | | | 4.0 | % | | 5 | | | 2.6 | % | | 200 | | | 4.0 | % | | 28.5 | % |
| Georgia | | 187 | | | 3.9 | % | | 9 | | | 4.7 | % | | 196 | | | 3.9 | % | | 32.4 | % |
| Florida | | 163 | | | 3.4 | % | | 17 | | | 8.9 | % | | 180 | | | 3.6 | % | | 39.8 | % |
| Michigan | | 158 | | | 3.3 | % | | 4 | | | 2.1 | % | | 162 | | | 3.2 | % | | 49.9 | % |
| North Carolina | | 155 | | | 3.2 | % | | 7 | | | 3.7 | % | | 162 | | | 3.2 | % | | 53.1 | % |
| Washington | | 155 | | | 3.2 | % | | 1 | | | 0.5 | % | | 156 | | | 3.1 | % | | 56.2 | % |
| Arizona | | 136 | | | 2.8 | % | | 1 | | | 0.5 | % | | 137 | | | 2.7 | % | | 58.9 | % |
| Alabama | | 125 | | | 2.6 | % | | 7 | | | 3.7 | % | | 132 | | | 2.6 | % | | 61.5 | % |
| Indiana | | 120 | | | 2.5 | % | | 6 | | | 3.2 | % | | 126 | | | 2.5 | % | | 64.0 | % |
| Minnesota | | 119 | | | 2.5 | % | | 3 | | | 1.6 | % | | 122 | | | 2.4 | % | | 66.4 | % |
| Wisconsin | | 118 | | | 2.4 | % | | 2 | | | 1.1 | % | | 120 | | | 2.4 | % | | 71.2 | % |
| Louisiana | | 109 | | | 2.3 | % | | 7 | | | 3.7 | % | | 116 | | | 2.3 | % | | 73.5 | % |
| Kentucky | | 77 | | | 1.6 | % | | 11 | | | 5.8 | % | | 88 | | | 1.8 | % | | 81.6 | % |
| Kansas | | 82 | | | 1.7 | % | | 2 | | | 1.1 | % | | 84 | | | 1.7 | % | | 83.3 | % |
| Mississippi | | 75 | | | 1.6 | % | | — | | | 0.0 | % | | 75 | | | 1.5 | % | | 84.8 | % |
| Virginia | | 66 | | | 1.4 | % | | 8 | | | 4.2 | % | | 74 | | | 1.5 | % | | 87.8 | % |
| Oregon | | 66 | | | 1.4 | % | | 3 | | | 1.6 | % | | 69 | | | 1.4 | % | | 89.2 | % |
| Utah | | 61 | | | 1.3 | % | | — | | | 0.0 | % | | 61 | | | 1.2 | % | | 90.4 | % |
| Nebraska | | 41 | | | 0.8 | % | | 2 | | | 1.1 | % | | 43 | | | 1.0 | % | | 93.6 | % |
| New Hampshire | | 38 | | | 0.8 | % | | (3 | ) | | (1.6 | )% | | 35 | | | 0.7 | % | | 95.9 | % |
| Massachusetts | | 30 | | | 0.6 | % | | 2 | | | 1.1 | % | | 32 | | | 0.6 | % | | 96.5 | % |
| Montana | | 27 | | | 0.6 | % | | — | | | 0.0 | % | | 27 | | | 0.5 | % | | 97.0 | % |
| Pennsylvania | | 12 | | | 0.2 | % | | 5 | | | 2.6 | % | | 17 | | | 0.3 | % | | 98.2 | % |
| West Virginia | | 12 | | | 0.2 | % | | 3 | | | 1.6 | % | | 15 | | | 0.3 | % | | 99.4 | % |
| Connecticut | | 5 | | | 0.1 | % | | 7 | | | 3.7 | % | | 12 | | | 0.2 | % | | 99.6 | % |
maintain inventory levels necessary for providing products to both the DIY and professional service provider portions of the automotive aftermarket.
Mr. Henslee has held the position of Chief Executive Officer since 2005.
In November 2017, Mr. Henslee was appointed to the Board of Directors.
Mr. Henslee has been nominated as Executive Vice Chairman of the Board and will serve in that role, subject to his election as a director at O’Reilly’s Annual Shareholders’ Meeting on May 8, 2018.
Mr. Johnson’s primary areas of responsibility are Merchandise, Logistics, Purchasing, Inventory Management, Pricing, Advertising, Information Technology, Legal, Risk Management, Loss Prevention, Human Resources and Finance.
of Store Operations and Sales.
Mr. Beckham’s O’Reilly career began as a Parts Specialist and progressed through the roles of Store Manager, District Manager, Regional Manager, Divisional Vice President, Vice President of Eastern Store Operations and Sales, Senior Vice President of Eastern Store Operations and Sales, and Senior Vice President of Central Store Operations.
in the retail industry.
David Wilbanks, age 46, Senior Vice President of Merchandise, has been an O’Reilly Team Member for five years.
* Includes continuous years of service with companies acquired by O’Reilly.
An excerpt. Shown here: 40 of 88 rewritten, 40 of 54 added and all 39 removed. The counts are complete. For every sentence, read Item 1. Business in the FY2018 filing and the FY2017 filing.
Item 3. Legal Proceedings
1 rewritten, 0 added, 7 removed, 3 unchanged
O’Reilly [removed: Automotive, Inc. and its subsidiaries (the “Company” or “O’Reilly”)] is currently involved in litigation incidental to the ordinary conduct of the Company’s business.
As previously reported, on June 18, 2015, a jury in Greene County, Missouri, returned an unfavorable verdict in a litigated contract dispute in the matter Meridian Creative Alliance vs. O’Reilly Automotive Stores, Inc. et.
al.
in the amount of $12.5 million.
As previously reported, the verdict was appealed, reversed in part and remanded to the trial court for a new trial.
The matter has been set for trial to commence May 7, 2018, in the Circuit Court of Greene County, Missouri.
The Company will continue to vigorously defend the matter.
As of December 31, 2017, the Company had accrued $18.6 million with respect to this matter.
Cover and table of contents
33 rewritten, 4 added, 4 removed, 72 unchanged
For the fiscal year ended December 31, [removed: 2017][added: 2018]
Indicate by check mark whether the registrant has submitted electronically [removed: and posted on its corporate Web site, if any,] every Interactive Data File required to be submitted [removed: and posted] pursuant to Rule 405 of Regulation S-T during the preceding 12 months (or for such shorter period that the registrant was required to submit [removed: and post] such files).
See definitions of “large accelerated filer,” “accelerated filer,” “smaller reporting company,” and [removed: emerging] [added: “emerging] growth company” in Rule 12b-2 of the Exchange Act.
| Non-accelerated filer ¨ [removed: (Do not check if a smaller reporting company)] | | Smaller reporting company ¨ |
At February [removed: 19, 2018,] [added: 18, 2019,] an aggregate of [removed: 83,670,900] [added: 78,375,610] shares of common stock of the registrant was outstanding.
At June 30, [removed: 2017,] [added: 2018,] the aggregate market value of the voting stock held by non-affiliates of the Company was [removed: $13,884,808,148] [added: $16,890,003,772] based on the last price of the common stock reported by The NASDAQ Global Select Market.
Portions of the definitive proxy statement for the [removed: 2018] [added: 2019] Annual Meeting of Shareholders to be filed with the Securities and Exchange Commission within 120 days after December 31, [removed: 2017,] [added: 2018,] are incorporated by reference into Part III.
FOR THE YEAR ENDED DECEMBER 31, [removed: 2017][added: 2018]
| [Item [removed: 1.](#sD4CFFC13C0C442CD0C9508CCE6ECF652)] [added: 1.](#s4166C04AE94F5B86C71F55D3BB56BEBD)] | [removed: [Business](#sD4CFFC13C0C442CD0C9508CCE6ECF652)] [added: [Business](#s4166C04AE94F5B86C71F55D3BB56BEBD)] | [removed: [2](#sD4CFFC13C0C442CD0C9508CCE6ECF652)] [added: [2](#s4166C04AE94F5B86C71F55D3BB56BEBD)] |
| [Item [removed: 1A.](#sA1289058A46598DA128C08CCEC0D7879)] [added: 1A.](#sB45E562DD8715792310B55D3C43A303E)] | [Risk [removed: Factors](#sA1289058A46598DA128C08CCEC0D7879)] [added: Factors](#sB45E562DD8715792310B55D3C43A303E)] | [removed: [15](#sA1289058A46598DA128C08CCEC0D7879)] [added: [15](#sB45E562DD8715792310B55D3C43A303E)] |
| [Item [removed: 1B.](#s5DBCDB2983E5E9181D2008CCEC13A45D)] [added: 1B.](#s217CDD4F0B7A08A926EE55D3C43AF2BD)] | [Unresolved Staff [removed: Comments](#s5DBCDB2983E5E9181D2008CCEC13A45D)] [added: Comments](#s217CDD4F0B7A08A926EE55D3C43AF2BD)] | [removed: [18](#s5DBCDB2983E5E9181D2008CCEC13A45D)] [added: [18](#s217CDD4F0B7A08A926EE55D3C43AF2BD)] |
| [Item [removed: 2.](#s1F2E29396309DD214E9308CCE798D2A0)] [added: 2.](#s5BC3C2C5F84C2747A31F55D3BF53C020)] | [removed: [Properties](#s1F2E29396309DD214E9308CCE798D2A0)] [added: [Properties](#s5BC3C2C5F84C2747A31F55D3BF53C020)] | [removed: [19](#s1F2E29396309DD214E9308CCE798D2A0)] [added: [19](#s5BC3C2C5F84C2747A31F55D3BF53C020)] |
| [Item [removed: 3.](#s592FEEE6E6A7DED0E83808CCEC7327BB)] [added: 3.](#s0C48E0BD7F3D5FDE713755D3C469D5A5)] | [Legal [removed: Proceedings](#s592FEEE6E6A7DED0E83808CCEC7327BB)] [added: Proceedings](#s0C48E0BD7F3D5FDE713755D3C469D5A5)] | [removed: [20](#s592FEEE6E6A7DED0E83808CCEC7327BB)] [added: [20](#s0C48E0BD7F3D5FDE713755D3C469D5A5)] |
| [Item [removed: 4.](#s5F89B8065FFE8C5BC33A08CCEC7892CF)] [added: 4.](#s8E5F63CCEE4BDB6B004E55D3C46D1C6E)] | [Mine Safety [removed: Disclosures](#s5F89B8065FFE8C5BC33A08CCEC7892CF)] [added: Disclosures](#s8E5F63CCEE4BDB6B004E55D3C46D1C6E)] | [removed: [20](#s5F89B8065FFE8C5BC33A08CCEC7892CF)] [added: [20](#s8E5F63CCEE4BDB6B004E55D3C46D1C6E)] |
| [Item [removed: 5.](#s787E80A5D0BB5F9C1F1408CCE7CCED76)] [added: 5.](#sE82CD63C57617D7F119755D3C1FA4976)] | [Market for Registrant’s Common Equity, Related Stockholder Matters and Issuer Purchases of Equity [removed: Securities](#s787E80A5D0BB5F9C1F1408CCE7CCED76)] [added: Securities](#sE82CD63C57617D7F119755D3C1FA4976)] | [removed: [21](#s787E80A5D0BB5F9C1F1408CCE7CCED76)] [added: [21](#sE82CD63C57617D7F119755D3C1FA4976)] |
| [Item [removed: 6.](#s1461EBADA182C1CED33708CCE5AA1D37)] [added: 6.](#sA41B5B3317CC6DD8727955D3BB1A8D94)] | [Selected Financial [removed: Data](#s1461EBADA182C1CED33708CCE5AA1D37)] [added: Data](#sA41B5B3317CC6DD8727955D3BB1A8D94)] | [removed: [23](#s1461EBADA182C1CED33708CCE5AA1D37)] [added: [23](#sA41B5B3317CC6DD8727955D3BB1A8D94)] |
| [Item [removed: 7.](#sCE2E2342C160F33546D908CCED33A443)] [added: 7.](#sB933966CC48AAFD0108155D3C50B64A2)] | [Management’s Discussion and Analysis of Financial Condition and Results of [removed: Operations](#sCE2E2342C160F33546D908CCED33A443)] [added: Operations](#sB933966CC48AAFD0108155D3C50B64A2)] | [removed: [25](#sCE2E2342C160F33546D908CCED33A443)] [added: [25](#sB933966CC48AAFD0108155D3C50B64A2)] |
| [Item [removed: 7A.](#sF1FC252F692F40551AA808CCE7438372)] [added: 7A.](#sD81F33EA685F0B750F0755D3C185BE92)] | [Quantitative and Qualitative Disclosures about Market [removed: Risk](#sF1FC252F692F40551AA808CCE7438372)] [added: Risk](#sD81F33EA685F0B750F0755D3C185BE92)] | [removed: [41](#sF1FC252F692F40551AA808CCE7438372)] [added: [40](#sD81F33EA685F0B750F0755D3C185BE92)] |
| [Item [removed: 8.](#s001ABB5D7C117A1A2DB108CCEF410D61)] [added: 8.](#sBFE780AEF540665D3A7F55D3C71E965B)] | [Financial Statements and Supplementary [removed: Data](#s001ABB5D7C117A1A2DB108CCEF410D61)] [added: Data](#sBFE780AEF540665D3A7F55D3C71E965B)] | [removed: [42](#s001ABB5D7C117A1A2DB108CCEF410D61)] [added: [41](#sBFE780AEF540665D3A7F55D3C71E965B)] |
| [Item [removed: 9.](#sC9F005E498DDC3A8E25E08CCF4CA2650)] [added: 9.](#sBCCEC304797D880DC26555D3CCAC31FF)] | [Changes in and Disagreements with Accountants on Accounting and Financial [removed: Disclosure](#sC9F005E498DDC3A8E25E08CCF4CA2650)] [added: Disclosure](#sBCCEC304797D880DC26555D3CCAC31FF)] | [removed: [71](#sC9F005E498DDC3A8E25E08CCF4CA2650)] [added: [70](#sBCCEC304797D880DC26555D3CCAC31FF)] |
| [Item [removed: 9A.](#s85DAC26892549CB87AB708CCF4EC0C6E)] [added: 9A.](#s61248C7724C156B87E2255D3CCC74E82)] | [Controls and [removed: Procedures](#s85DAC26892549CB87AB708CCF4EC0C6E)] [added: Procedures](#s61248C7724C156B87E2255D3CCC74E82)] | [removed: [71](#s85DAC26892549CB87AB708CCF4EC0C6E)] [added: [70](#s61248C7724C156B87E2255D3CCC74E82)] |
| [Item [removed: 9B.](#sE611BAD9B57D75F232AF08CCF51D9F42)] [added: 9B.](#s9DD08D189F32CF2BC35E55D3CCFAF270)] | [Other [removed: Information](#sE611BAD9B57D75F232AF08CCF51D9F42)] [added: Information](#s9DD08D189F32CF2BC35E55D3CCFAF270)] | [removed: [71](#sE611BAD9B57D75F232AF08CCF51D9F42)] [added: [70](#s9DD08D189F32CF2BC35E55D3CCFAF270)] |
| [PART [removed: III](#sFA46EFD51A829FD4E41408CCF53EB678)] [added: III](#s65B0F9F74B300828629255D3CD1B94F6)] | | |
| [Item [removed: 10.](#s1DB0DC57B63C53930D1408CCF570913E)] [added: 10.](#sE15BF1B09B73E7AD3EA755D3CD4C99C8)] | [Directors, Executive Officers and Corporate [removed: Governance](#s1DB0DC57B63C53930D1408CCF570913E)] [added: Governance](#sE15BF1B09B73E7AD3EA755D3CD4C99C8)] | [removed: [72](#s1DB0DC57B63C53930D1408CCF570913E)] [added: [71](#sE15BF1B09B73E7AD3EA755D3CD4C99C8)] |
| [Item [removed: 11.](#sF41BACA07CE919D1A73A08CCF5931962)] [added: 11.](#s674279E3D15B79F937BC55D3CD6ED1A0)] | [Executive [removed: Compensation](#sF41BACA07CE919D1A73A08CCF5931962)] [added: Compensation](#s674279E3D15B79F937BC55D3CD6ED1A0)] | [removed: [72](#sF41BACA07CE919D1A73A08CCF5931962)] [added: [71](#s674279E3D15B79F937BC55D3CD6ED1A0)] |
| [Item [removed: 12.](#sECAE01C00B10532CF0E308CCF5C4CE50)] [added: 12.](#s52432AEC752B072AB3B255D3CDA1E945)] | [Security Ownership of Certain Beneficial Owners and Management and Related Shareholder [removed: Matters](#sECAE01C00B10532CF0E308CCF5C4CE50)] [added: Matters](#s52432AEC752B072AB3B255D3CDA1E945)] | [removed: [72](#sECAE01C00B10532CF0E308CCF5C4CE50)] [added: [71](#s52432AEC752B072AB3B255D3CDA1E945)] |
| [Item [removed: 13.](#sF1747791B0BCEDBBC84008CCF5E50A3A)] [added: 13.](#sD3D9C9460335DB3EF07E55D3CDC215B7)] | [Certain Relationships and Related Transactions, and Director [removed: Independence](#sF1747791B0BCEDBBC84008CCF5E50A3A)] [added: Independence](#sD3D9C9460335DB3EF07E55D3CDC215B7)] | [removed: [73](#sF1747791B0BCEDBBC84008CCF5E50A3A)] [added: [72](#sD3D9C9460335DB3EF07E55D3CDC215B7)] |
| [Item [removed: 14.](#s73B902F823E8C226395C08CCF61859FB)] [added: 14.](#sEA1FC5F3E2EDAED9B18655D3CE0E9B65)] | [Principal Accounting Fees and [removed: Services](#s73B902F823E8C226395C08CCF61859FB)] [added: Services](#sEA1FC5F3E2EDAED9B18655D3CE0E9B65)] | [removed: [73](#s73B902F823E8C226395C08CCF61859FB)] [added: [72](#sEA1FC5F3E2EDAED9B18655D3CE0E9B65)] |
| [Item [removed: 15.](#sBEB4CE0A8F54335FA57D08CCF66A27DE)] [added: 15.](#s6535FD1F7F457CBAC02B55D3CE583DCC)] | [Exhibits and Financial Statement [removed: Schedules](#sBEB4CE0A8F54335FA57D08CCF66A27DE)] [added: Schedules](#s6535FD1F7F457CBAC02B55D3CE583DCC)] | [removed: [74](#sBEB4CE0A8F54335FA57D08CCF66A27DE)] [added: [73](#s6535FD1F7F457CBAC02B55D3CE583DCC)] |
| [Item [removed: 16](#sD7591C80223AD28BBD8E08CCF68C84D4)] [added: 16](#s6B9909349B2A48C416FD55D3CE77CD99)] | [Form 10-K [removed: Summary](#sD7591C80223AD28BBD8E08CCF68C84D4)] [added: Summary](#s6B9909349B2A48C416FD55D3CE77CD99)] | [removed: [77](#sD7591C80223AD28BBD8E08CCF68C84D4)] [added: [76](#s6B9909349B2A48C416FD55D3CE77CD99)] |
In addition, statements contained within this annual report that are not historical facts are forward-looking statements, such as statements discussing, among other things, expected growth, store development, integration and expansion strategy, business strategies, [removed: the impact of the U.S. Tax Cuts and Jobs Act,] future revenues and future performance.
Such statements are subject to risks, uncertainties and assumptions, including, but not limited to, the economy in general, inflation, [added: tariffs,] product demand, the market for auto parts, competition, weather, risks associated with the performance of acquired businesses, our ability to hire and retain qualified employees, consumer debt levels, our increased debt levels, credit ratings on public debt, governmental regulations, [added: information security and cyber attacks,] terrorist activities, war and the threat of war.
Please refer to the “Risk Factors” section of [removed: this] [added: our] annual report on Form 10-K for the year ended December 31, [removed: 2017,] [added: 2018,] for additional factors that could materially affect our financial performance.
10-K 1 orly-20181231x10xk.htm 10-K
| [PART I](#s62ECA38D3E63753919E455D3C37AE61D) | | |
| [PART II](#s359E4C4F79F79892D5BE55D3C4821C7F) | | |
| [PART IV](#sFB0CC5BB780042FA362155D3CE1B899B) | | |
10-K 1 orly-20171231x10xk.htm 10-K
| [PART I](#s5447EC551ACE73F5DABC08CCEB7C5306) | | |
| [PART II](#s6E20A06A499F6BFAD05E08CCECA8FEE7) | | |
| [PART IV](#s157FF1AA15B1A8ED300308CCF639C086) | | |
Item 2. Properties
9 rewritten, 3 added, 1 removed, 46 unchanged
As of December 31, [removed: 2017,] [added: 2018,] we operated 27 regional distribution centers (“DC”s), of which eight were leased (2.8 million operating square footage) and 19 were owned [removed: (8.0] [added: (8.1] million operating square footage) for total DC operating square footage of 10.8 million square feet.
The following table provides information regarding our DCs, returns facility and corporate offices as of December 31, [removed: 2017:][added: 2018:]
| Knoxville, TN | | Distribution Center [added: (to be relocated in 2020)] | | 150,766 | | | Owned | | |
| Nashville, TN | | Distribution Center [added: (to be relocated in 2020)] | | 315,977 | | | Leased | | [removed: 12/31/2018] [added: 12/31/2023] |
| Springfield, MO | | Corporate Offices | | [removed: 435,600] [added: 224,818] | | | Owned | | |
Of the [removed: 5,019] [added: 5,219] stores that we operated at December 31, [removed: 2017, 2,014] [added: 2018, 2,119] stores were owned, [removed: 2,930] [added: 3,026] stores were leased from unaffiliated parties and [removed: 75] [added: 74] stores were leased from [removed: entities, in which certain] [added: entities that include one or more] of our affiliated [removed: directors,] [added: directors] or members of [removed: our affiliated director’s] [added: their] immediate [removed: family, are affiliated.][added: family.]
The master lease agreements or modifications thereto expire on dates ranging from [removed: July 31, 2018,] [added: April 30, 2019,] to September 30, 2031.
The store servicing capability of our 27 existing DCs is approximately [removed: 5,715] [added: 5,835] stores, providing a growth capacity of more than [removed: 695 stores.][added: 615 stores, which will increase by approximately 275 stores with the completion of our Twinsburg, Ohio, DC in 2019.]
We believe the growth capacity in our 27 existing [removed: DCs] [added: DCs, along with the additional capacity of our new Twinsburg, Ohio, DC] will provide us with the DC infrastructure needed for near-term expansion.
| Lebanon, TN | | Distribution Center (to open in 2020) | | 410,000 | | | Owned | | |
| Twinsburg, OH | | Distribution Center (to open in 2019) | | 405,000 | | | Owned | | |
| | | | | 12,286,020 | | | | | |
| | | | | 11,681,802 | | | | | |
Item 5. Market For Registrant’s Common Equity, Related Stockholder Matters and Issuer Purchases of Equity Securities
10 rewritten, 7 added, 17 removed, 15 unchanged
As of February [removed: 21, 2018,] [added: 14, 2019,] the Company had approximately [removed: 244,000] [added: 351,000] shareholders of common stock based on the number of holders of record and an estimate of individual participants represented by security position listings.
There were no sales of unregistered securities during the year ended December 31, [removed: 2017.][added: 2018.]
The following table identifies all repurchases during the fourth quarter ended December 31, [removed: 2017,] [added: 2018,] of any of the Company’s securities registered under Section 12 of the Securities Exchange Act of 1934, as amended, by or on behalf of the Company or any affiliated purchaser (in thousands, except per share data):
| (1) | Under the Company’s share repurchase program, as approved by its Board of Directors on January 11, 2011, the Company may, from time to time, repurchase shares of its common stock, solely through open market purchases effected through a broker dealer at prevailing market prices, based on a variety of factors such as price, corporate trading policy requirements and overall market conditions not to exceed a dollar limit authorized by the Board of Directors. The Company’s Board of Directors may increase or otherwise modify, renew, suspend or terminate the share repurchase program at any time, without prior notice. As announced on [removed: November 16, 2016, May 10, 2017, September 1, 2017, and] February 7, 2018, [added: and November 13, 2018,] the Company’s Board of Directors each time approved a resolution to increase the authorization amount under the share repurchase program by an additional $1.0 billion, resulting in a cumulative authorization amount of [removed: $10.8] [added: $11.8] billion. Each additional authorization is effective for a three\-year period, beginning on its respective announcement date. The [removed: authorizations] [added: authorization] under the share repurchase program that currently [removed: have] [added: has] capacity [removed: are] [added: is] scheduled to expire on [removed: September 1, 2020, and February 7,] [added: November 13,] 2021. No other share repurchase programs existed during the twelve months ended December 31, [removed: 2017.] [added: 2018.] |
The Company repurchased a total of [removed: 9.3] [added: 6.1] million shares of its common stock under its publicly announced share repurchase program during the year ended December 31, [removed: 2017,] [added: 2018,] at an average price per share of [removed: $233.57,] [added: $282.80,] for a total investment of [removed: $2.2] [added: $1.7] billion.
Subsequent to the end of the year and through February [removed: 28, 2018,] [added: 27, 2019,] the Company repurchased an additional [removed: 1.1] [added: 0.8] million shares of its common stock, at an average price per share of [removed: $255.48,] [added: $342.95,] for a total investment of [removed: $289.9] [added: $268.9] million.
The Company has repurchased a total of [removed: 67.4] [added: 73.1] million shares of its common stock under its share repurchase program since the inception of the program in January of 2011 and through February [removed: 28, 2018,] [added: 27, 2019,] at an average price of [removed: $138.38,] [added: $150.73,] for a total aggregate investment of [removed: $9.3] [added: $11.0] billion.
The graph below shows the cumulative total shareholder return assuming the investment of $100, on December 31, [removed: 2012,] [added: 2013,] and the reinvestment of dividends thereafter, if any, in the Company’s common stock versus the Standard and Poor’s S&P 500 Retail Index (“S&P 500 Retail Index”) and the Standard and Poor’s S&P 500 Index (“S&P 500”).
[removed: ][added: 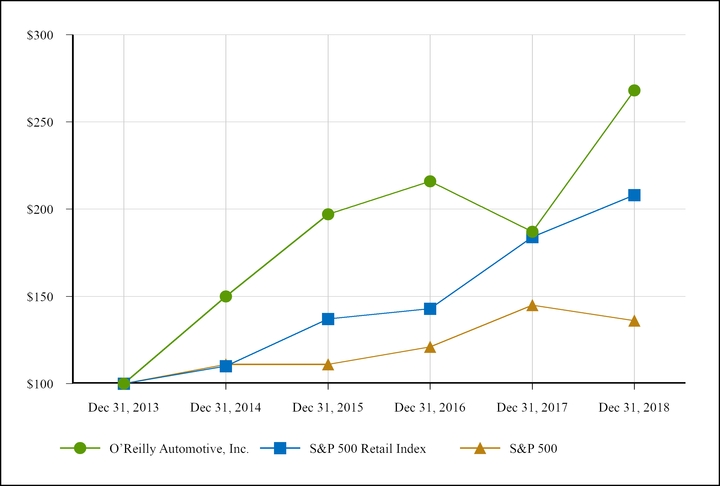]
| Company/Index | | [removed: 2012 | | | |] 2013 | | | | 2014 | | | | 2015 | | | | 2016 | | | | 2017 | | | [added: | 2018 | | |]
| October 1, 2018, to October 31, 2018 | | 277 | | | $ | 338.34 | | | 277 | | | $ | 370,701 | |
| November 1, 2018, to November 30, 2018 | | 472 | | | 339.35 | | | | 472 | | | 1,210,365 | | |
| December 1, 2018, to December 31, 2018 | | 617 | | | 338.84 | | | | 617 | | | $ | 1,001,436 | |
| Total as of December 31, 2018 | | 1,366 | | | $ | 338.92 | | | 1,366 | | | | | |
| O’Reilly Automotive, Inc. | | $ | 100 | | | $ | 150 | | | $ | 197 | | | $ | 216 | | | $ | 187 | | | $ | 268 | |
| S&P 500 Retail Index | | 100 | | | | 110 | | | | 137 | | | | 143 | | | | 184 | | | | 208 | | |
| S&P 500 | | $ | 100 | | | $ | 111 | | | $ | 111 | | | $ | 121 | | | $ | 145 | | | $ | 136 | |
The prices in the following table represent the high and low sales price for the Company’s common stock as reported by Nasdaq:
| | | | | | | | | | | | | | | | |
| --- | --- | --- | --- | --- | --- | --- | --- | --- | --- | --- | --- | --- | --- | --- | --- |
| | 2017 | | | | | | | | 2016 | | | | | | |
| | High | | | | Low | | | | High | | | | Low | | |
| First Quarter | $ | 282.81 | | | $ | 254.35 | | | $ | 276.64 | | | $ | 232.16 | |
| Second Quarter | 269.28 | | | | 216.04 | | | | 277.82 | | | | 253.32 | | |
| Third Quarter | 220.41 | | | | 172.85 | | | | 290.63 | | | | 271.33 | | |
| Fourth Quarter | 251.07 | | | | 202.72 | | | | 285.53 | | | | 253.00 | | |
| For the Year | $ | 282.81 | | | $ | 172.85 | | | $ | 290.63 | | | $ | 232.16 | |
| October 1, 2017, to October 31, 2017 | | 336 | | | $ | 209.12 | | | 336 | | | $ | 924,560 | |
| November 1, 2017, to November 30, 2017 | | 508 | | | 214.81 | | | | 508 | | | 815,367 | | |
| December 1, 2017, to December 31, 2017 | | 410 | | | 243.67 | | | | 410 | | | $ | 715,389 | |
| Total as of December 31, 2017 | | 1,254 | | | $ | 222.73 | | | 1,254 | | | | | |
| O’Reilly Automotive, Inc. | | $ | 100 | | | $ | 144 | | | $ | 215 | | | $ | 283 | | | $ | 311 | | | $ | 269 | |
| S&P 500 Retail Index | | 100 | | | | 144 | | | | 158 | | | | 197 | | | | 206 | | | | 265 | | |
| S&P 500 | | $ | 100 | | | $ | 130 | | | $ | 144 | | | $ | 143 | | | $ | 157 | | | $ | 187 | |
Item 6. Selected Financial Data
43 rewritten, 2 added, 3 removed, 42 unchanged
| Years ended December 31, | [added: 2018 | |] 2017 | | 2016 | | 2015 | | 2014 | | 2013 | | 2012 | | 2011 | | 2010 | | 2009 | | [removed: 2008 | |]
| Sales ($) | [added: 9,536,428 | |] 8,977,726 | | 8,593,096 | | 7,966,674 | | 7,216,081 | | 6,649,237 | | 6,182,184 | | 5,788,816 | | 5,397,525 | | 4,847,062 | | [removed: 3,576,553 | |]
| Cost of goods sold, including warehouse and distribution expenses | [added: 4,496,462 | |] 4,257,043 | | 4,084,085 | | 3,804,031 | | 3,507,180 | | 3,280,236 | | 3,084,766 | | 2,951,467 | | 2,776,533 | | 2,520,534 | | [removed: 1,948,627 | |]
| Gross profit | [added: 5,039,966 | |] 4,720,683 | | 4,509,011 | | 4,162,643 | | 3,708,901 | | 3,369,001 | | 3,097,418 | | 2,837,349 | | 2,620,992 | | 2,326,528 | | [removed: 1,627,926 | |]
| Selling, general and administrative expenses | [added: 3,224,782 | |] 2,995,283 | | 2,809,805 | | 2,648,622 | | 2,438,527 | | 2,265,516 | | 2,120,025 | | 1,973,381 | | 1,887,316 | | 1,788,909 | | [removed: 1,292,309 | |]
| Former CSK officer clawback | — | | — | | — | | — | | — | | — | | [removed: (2,798] [added: —] | [removed: )] | [removed: —] [added: (2,798] | [added: )] | — | | — | |
| Legacy CSK Department of Justice investigation charge | — | | — | | — | | — | | — | | — | | — | | [removed: 20,900] [added: —] | | [removed: —] [added: 20,900] | | — | |
| Operating income | [added: 1,815,184 | |] 1,725,400 | | 1,699,206 | | 1,514,021 | | 1,270,374 | | 1,103,485 | | 977,393 | | 866,766 | | 712,776 | | 537,619 | | [removed: 335,617 | |]
| Write-off of asset-based revolving credit agreement debt issuance costs | — | | — | | — | | — | | — | | — | | [removed: (21,626] [added: —] | [removed: )] | [removed: —] [added: (21,626] | [added: )] | — | | — | |
| Termination of interest rate swap agreements | — | | — | | — | | — | | — | | — | | [removed: (4,237] [added: —] | [removed: )] | [removed: —] [added: (4,237] | [added: )] | — | | — | |
| Gain on settlement of note receivable | — | | — | | — | | — | | — | | — | | — | | [removed: 11,639] [added: —] | | [removed: —] [added: 11,639] | | — | |
| Other income (expense), net | [added: (121,097 | ) |] (87,596 | ) | (62,015 | ) | (53,655 | ) | (48,192 | ) | (44,543 | ) | (35,872 | ) | (25,130 | ) | (35,042 | ) | (40,721 | ) | [removed: (33,085 | ) |]
| Total other income (expense) | [added: (121,097 | ) |] (87,596 | ) | (62,015 | ) | (53,655 | ) | (48,192 | ) | (44,543 | ) | (35,872 | ) | (50,993 | ) | (23,403 | ) | (40,721 | ) | [removed: (33,085 | ) |]
| Income before income taxes | [added: 1,694,087 | |] 1,637,804 | | 1,637,191 | | 1,460,366 | | 1,222,182 | | 1,058,942 | | 941,521 | | 815,773 | | 689,373 | | 496,898 | | [removed: 302,532 | |]
| Provision for income taxes (a)(b) | [added: 369,600 | |] 504,000 | | 599,500 | | 529,150 | | 444,000 | | 388,650 | | 355,775 | | 308,100 | | 270,000 | | 189,400 | | [removed: 116,300 | |]
| Net income ($) (a)(b) | [added: 1,324,487 | |] 1,133,804 | | 1,037,691 | | 931,216 | | 778,182 | | 670,292 | | 585,746 | | 507,673 | | 419,373 | | 307,498 | | [removed: 186,232 | |]
| Earnings per share – basic ($) | [added: 16.27 | |] 12.82 | | 10.87 | | 9.32 | | 7.46 | | 6.14 | | 4.83 | | 3.77 | | 3.02 | | 2.26 | | [removed: 1.50 | |]
| Weighted-average common shares outstanding – basic | [added: 81,406 | |] 88,426 | | 95,447 | | 99,965 | | 104,262 | | 109,244 | | 121,182 | | 134,667 | | 138,654 | | 136,230 | | [removed: 124,526 | |]
| Earnings per share – assuming dilution ($) | [added: 16.10 | |] 12.67 | | 10.73 | | 9.17 | | 7.34 | | 6.03 | | 4.75 | | 3.71 | | 2.95 | | 2.23 | | [removed: 1.48 | |]
| Weighted-average common shares outstanding – assuming dilution | [added: 82,280 | |] 89,502 | | 96,720 | | 101,514 | | 106,041 | | 111,101 | | 123,314 | | 136,983 | | 141,992 | | 137,882 | | [removed: 125,413 | |]
| Number of Team Members at year end | [added: 78,882 | |] 75,552 | | 74,580 | | 71,621 | | 67,569 | | 61,909 | | 53,063 | | 49,324 | | 46,858 | | 44,880 | | [removed: 40,735 | |]
| Number of stores at year end (c) | [added: 5,219 | |] 5,019 | | 4,829 | | 4,571 | | 4,366 | | 4,166 | | 3,976 | | 3,740 | | 3,570 | | 3,421 | | [removed: 3,285 | |]
| Total store square footage at year end (d) | [added: 38,455 | |] 36,685 | | 35,123 | | 33,148 | | 31,591 | | 30,077 | | 28,628 | | 26,530 | | 25,315 | | 24,200 | | [removed: 23,205 | |]
| Sales per weighted-average store (e)($) | [added: 1,842 | |] 1,807 | | 1,826 | | 1,769 | | 1,678 | | 1,614 | | 1,590 | | 1,566 | | 1,527 | | 1,424 | | [removed: 1,379 | |]
| Sales per weighted-average square foot (d)(f)($) | [added: 251 | |] 248 | | 251 | | 244 | | 232 | | 224 | | 224 | | 221 | | 216 | | 202 | | [removed: 201 | |]
| Percentage increase in comparable store sales [removed: (g)(h)] [added: (g)] | [added: 3.8 | % |] 1.4 | % | 4.8 | % | 7.5 | % | 6.0 | % | 4.6 | % | 3.5 | % | 4.6 | % | 8.8 | % | 4.8 | % | [removed: 1.3 | % |]
| Working capital [removed: (i)($)] [added: (h)($)] | [added: (350,918 | ) |] (249,694 | ) | (142,674 | ) | (36,372 | ) | 252,082 | | 430,832 | | 478,093 | | 1,028,330 | | 1,029,861 | | 900,857 | | [removed: 749,276 | |]
| Total assets [removed: (i)($)] [added: (h)($)] | [added: 7,980,789 | |] 7,571,885 | | 7,404,189 | | 6,676,684 | | 6,532,083 | | 6,057,895 | | 5,741,241 | | 5,494,174 | | 5,031,950 | | 4,695,536 | | [removed: 4,551,586 | |]
| Inventory turnover [removed: (j)] [added: (i)] | 1.4 | | [added: 1.4 | |] 1.5 | | 1.5 | | 1.4 | | 1.4 | | 1.4 | | 1.5 | | 1.4 | | 1.4 | | [removed: 1.6 | |]
| Accounts payable to inventory [removed: (k)] [added: (j)] | [added: 105.7 | % |] 106.0 | % | 105.7 | % | 99.1 | % | 94.6 | % | 86.6 | % | 84.7 | % | 64.4 | % | 44.3 | % | 42.8 | % | [removed: 46.9 | % |]
| Current portion of long-term debt and short-term debt ($) | — | | — | | — | | [added: — | |] 25 | | 67 | | 222 | | 662 | | 1,431 | | 106,708 | | [removed: 8,131 | |]
| Long-term debt, less current portion [removed: (i)($)] [added: (h)($)] | [added: 3,417,122 | |] 2,978,390 | | 1,887,019 | | 1,390,018 | | 1,388,397 | | 1,386,828 | | 1,087,789 | | 790,585 | | 357,273 | | 684,040 | | [removed: 724,564 | |]
| Shareholders’ equity ($) (a) | [added: 353,667 | |] 653,046 | | 1,627,136 | | 1,961,314 | | 2,018,418 | | 1,966,321 | | 2,108,307 | | 2,844,851 | | 3,209,685 | | 2,685,865 | | [removed: 2,282,218 | |]
| Capital expenditures ($) | [added: 504,268 | |] 465,940 | | 476,344 | | 414,020 | | 429,987 | | 395,881 | | 300,719 | | 328,319 | | 365,419 | | 414,779 | | [removed: 341,679 | |]
| Free cash flow [removed: (l)(m)($)] [added: (k)(l)($)] | [added: 1,188,584 | |] 889,059 | | 978,375 | | 868,390 | | 760,443 | | 512,145 | | 950,836 | | 790,672 | | 338,268 | | (129,579 | ) | [removed: (43,137 | ) |]
| (a) | During the year ended December 31, 2017, the Company adopted a new accounting standard that requires excess tax benefits related to share-based compensation payments to be recorded through the income statement. In compliance with the standard, the Company did not restate prior period amounts to conform to current period presentation. The Company recorded a cumulative effect adjustment to opening retained earnings, due to the adoption of the new accounting standard. See Note 1 “Summary of Significant Accounting Policies” to the Consolidated Financial Statements of [removed: this] [added: the] annual report on Form 10-K for [added: the year ended December 31, 2017, for] more information. |
| (b) | Following the enactment of the U.S. Tax Cuts and Jobs Act in December of 2017, the Company revalued its deferred income tax liabilities, which resulted in a one-time benefit to the Company’s Consolidated Statement of Income for the year ended December 31, [added: 2018 and] 2017. See Note [removed: 12] [added: 13] “Income Taxes” to the Consolidated Financial Statements of this annual report on Form 10-K for more information. |
| (c) | In 2008, [removed: 2012,] [added: 2012] and 2016, the Company acquired CSK Auto Corporation (“CSK”), [removed: and] materially all assets of VIP Parts, Tires & Service (“VIP”) and Bond Auto Parts (“Bond”), respectively. The 2008 CSK acquisition added 1,342 stores, the 2012 VIP acquisition added 56 [removed: stores,] [added: stores] and the 2016 Bond acquisition added 48 stores to the O’Reilly store count. [added: After the close of business on December 31, 2018, the Company acquired substantially all of the non-real estate assets of Bennett Auto Supply, Inc., including 33 stores that were not included in the 2018 store count and were not operated by the Company in 2018.] Financial results for these acquired companies have been included in the Company’s consolidated financial statements from the dates of the acquisitions forward. |
| (g) | Comparable store sales are calculated based on the change in sales of stores open at least one year and excludes sales of specialty machinery, sales to independent parts stores, sales to Team Members, sales from Leap Day during the years ended December 31, [removed: 2016, 2012] [added: 2016] and [removed: 2008,] [added: 2012,] and sales during the one to two week period certain CSK branded stores were closed for conversion. [added: Online sales, resulting from ship-to-home orders and pick-up-in-store orders, for stores open at least one year, are included in the comparable store sales calculation.] |
| [removed: (i)] [added: (h)] | Certain prior period amounts have been reclassified to conform to current period presentation, due to the Company’s adoption of new accounting standards during the fourth quarter ended December 31, 2015. See Note 1 “Summary of Significant Accounting Policies” to the Consolidated Financial Statements of the annual report on Form 10-K for the year ended December 31, 2015. |
| Years ended December 31, | 2018 | | 2017 | | 2016 | | 2015 | | 2014 | | 2013 | | 2012 | | 2011 | | 2010 | | 2009 | |
| Cash provided by operating activities (k) ($) | 1,727,555 | | 1,403,687 | | 1,510,713 | | 1,345,488 | | 1,190,430 | | 908,026 | | 1,251,555 | | 1,118,991 | | 703,687 | | 285,200 | |
| | |
| --- | --- |
| (h) | Comparable store sales for 2008 include sales for stores acquired in the CSK acquisition. Comparable store sales for stores operating on O’Reilly systems open at least one year increased 2.4% for the year ended December 31, 2008. Comparable store sales for stores operating on the legacy CSK system open at least one year decreased 1.7% for the portion of CSK’s sales in 2008 since the July 11, 2008, acquisition. |
An excerpt. Shown here: 40 of 43 rewritten, all 2 added and all 3 removed. The counts are complete. For every sentence, read Item 6. Selected Financial Data in the FY2018 filing and the FY2017 filing.
Item 8. Financial Statements and Supplementary Data
355 rewritten, 113 added, 102 removed, 609 unchanged
| [Management’s Report on Internal Control over Financial [removed: Reporting](#s4EB3DCF7DE579DCF5ADD08CCEF9698B4)] [added: Reporting](#s9D18FEBA59DACA6ED1BC55D3C772DA14)] | | | [removed: [43](#s4EB3DCF7DE579DCF5ADD08CCEF9698B4)] [added: [42](#s9D18FEBA59DACA6ED1BC55D3C772DA14)] |
| [Report of Independent Registered Public Accounting Firm: Internal Control over Financial [removed: Reporting](#s9DEBA182CA09C022DA3808CCEFB75787)] [added: Reporting](#s2887A289E6D542AC568B55D3C79FBFAE)] | | | [removed: [44](#s9DEBA182CA09C022DA3808CCEFB75787)] [added: [43](#s2887A289E6D542AC568B55D3C79FBFAE)] |
| [Report of Independent Registered Public Accounting Firm: Financial [removed: Statements](#s39EBEF6E080F8A8FE95908CCEFE82E7F)] [added: Statements](#sA66FD964D2CC9C96E2ED55D3C7C44D40)] | | | [removed: [45](#s39EBEF6E080F8A8FE95908CCEFE82E7F)] [added: [44](#sA66FD964D2CC9C96E2ED55D3C7C44D40)] |
| [Consolidated Balance [removed: Sheets](#sAF01B28B19314481237108CCE143A8C5)] [added: Sheets](#s5A36F2EFFEAB60F2AADA55D3B249D996)] | | | [removed: [46](#sAF01B28B19314481237108CCE143A8C5)] [added: [45](#s5A36F2EFFEAB60F2AADA55D3B249D996)] |
| [Consolidated Statements of [removed: Income](#s493B298C6482639913B008CCE1FEF331)] [added: Income](#s8BB1B274FC1F03A2291A55D3B29B814A)] | | | [removed: [47](#s493B298C6482639913B008CCE1FEF331)] [added: [46](#s8BB1B274FC1F03A2291A55D3B29B814A)] |
| [Consolidated Statements of Shareholders’ [removed: Equity](#s724266E410971611952C08CCE224C1E6)] [added: Equity](#sF106506D707B3D4FCFF255D3B2D9B473)] | | | [removed: [48](#s724266E410971611952C08CCE224C1E6)] [added: [47](#sF106506D707B3D4FCFF255D3B2D9B473)] |
| [Consolidated Statements of Cash [removed: Flows](#sDCE4491C2052997F634608CCE0A7DD97)] [added: Flows](#sD0D2C30902F27179C5AB55D3B32E6AD0)] | | | [removed: [49](#sDCE4491C2052997F634608CCE0A7DD97)] [added: [48](#sD0D2C30902F27179C5AB55D3B32E6AD0)] |
| [Notes to Consolidated Financial [removed: Statements](#s0DA36C05EBDD96F0D91108CCF0E253CC)] [added: Statements](#sD9684D37F2A4F2F8917B55D3C8D2A951)] | | | [removed: [50](#s0DA36C05EBDD96F0D91108CCF0E253CC)] [added: [49](#sD9684D37F2A4F2F8917B55D3C8D2A951)] |
Under the supervision and with the participation of the Company’s principal executive officer and principal financial officer, management assessed the effectiveness of the Company’s internal control over financial reporting as of December 31, [removed: 2017.][added: 2018.]
Based on this assessment, management believes that as of December 31, [removed: 2017,] [added: 2018,] the Company’s internal control over financial reporting is effective based on those criteria.
| Chief Executive Officer [added: and] | | | Executive Vice President and | |
| [removed: February 28, 2018] [added: Co-President] | | | Chief Financial Officer | |
We have audited O’Reilly Automotive, Inc. and subsidiaries’ internal control over financial reporting as of December 31, [removed: 2017,] [added: 2018,] based on criteria established in Internal Control-Integrated Framework issued by the Committee of Sponsoring Organizations of the Treadway Commission (2013 framework) (the “COSO criteria”).
In our opinion, O’Reilly Automotive, Inc. and subsidiaries (the “Company”) maintained, in all material respects, effective internal control over financial reporting as of December 31, [removed: 2017,] [added: 2018,] based on the COSO criteria.
We also have audited, in accordance with the standards of the Public Company Accounting Oversight Board (United States) (“PCAOB”), the consolidated balance sheets of the Company as of December 31, [removed: 2017 and 2016,] [added: 2018] and [added: 2017,] the related consolidated statements of income, shareholders’ equity and cash flows for each of the three years in the period ended December 31, [removed: 2017,] [added: 2018,] and the related notes and financial statement schedule listed in the Index at Item 15(a) and our report dated February [removed: 28, 2018,] [added: 27, 2019,] expressed an unqualified opinion thereon.
We have audited the accompanying consolidated balance sheets of O’Reilly Automotive, Inc. and Subsidiaries (the “Company”) as of December 31, [removed: 2017 and 2016,] [added: 2018] and [added: 2017,] the related consolidated statements of income, shareholders’ equity and cash flows for each of the three years in the period ended December 31, [removed: 2017,] [added: 2018,] and the related notes and financial statement schedule listed in the Index at Item 15(a) (collectively referred to as the [removed: “financial] [added: “consolidated financial] statements”).
In our opinion, the [added: consolidated] financial statements present fairly, in all material respects, the [removed: consolidated] financial position of the Company at December 31, [removed: 2017] [added: 2018] and [removed: 2016,] [added: 2017,] and the [removed: consolidated] results of its operations and its cash flows for each of the three years in the period ended December 31, [removed: 2017,] [added: 2018,] in conformity with U.S. generally accepted accounting principles.
We also have audited, in accordance with the standards of the Public Company Accounting Oversight Board (United States) (“PCAOB”), the Company’s internal control over financial reporting as of December 31, [removed: 2017,] [added: 2018,] based on criteria established in Internal Control-Integrated Framework issued by the Committee of Sponsoring Organizations of the Treadway Commission (2013 framework) and our report dated February [removed: 28, 2018,] [added: 27, 2019,] expressed an unqualified opinion thereon.
| | [added: 2018 | | | |] 2017 | | | | 2016 | | |
| Cash and cash equivalents [added: at end of the year] | $ | [added: 31,315 | | | $ |] 46,348 | | | $ | 146,598 | |
| Accounts receivable, less allowance for doubtful accounts [removed: $12,717] [added: $13,238] in [removed: 2017] [added: 2018] and [removed: $12,040] [added: $12,717] in [removed: 2016] [added: 2017] | [removed: 216,251] [added: 192,026] | | | | [removed: 197,274] [added: 216,251] | | |
| Amounts receivable from suppliers | [removed: 76,236] [added: 78,155] | | | | [removed: 82,105] [added: 76,236] | | |
| Inventory | [removed: 3,009,800] [added: 3,193,344] | | | | [removed: 2,778,976] [added: 3,009,800] | | |
| Other current assets | [removed: 49,037] [added: 48,262] | | | | [removed: 53,022] [added: 49,037] | | |
| Total current assets | [removed: 3,397,672] [added: 3,543,102] | | | | [removed: 3,257,975] [added: 3,397,672] | | |
| Property and equipment, at cost | [removed: 5,191,135] [added: 5,645,552] | | | | [removed: 4,832,342] [added: 5,191,135] | | |
| Less: accumulated depreciation and amortization | [removed: 1,847,329] [added: 2,058,550] | | | | [removed: 1,708,911] [added: 1,847,329] | | |
| Net property and equipment | [removed: 3,343,806] [added: 3,587,002] | | | | [removed: 3,123,431] [added: 3,343,806] | | |
| [removed: Goodwill] [added: Goodwill, balance at January 1,] | [added: $ |] 789,058 | | | [added: $] | 785,399 | | [removed: |]
| Other assets, net | [removed: 41,349] [added: 43,425] | | | | [removed: 37,384] [added: 41,349] | | |
| Total assets | $ | [removed: 7,571,885] [added: 7,980,789] | | | $ | [removed: 7,204,189] [added: 7,571,885] | |
| Accounts payable | $ | [removed: 3,190,029] [added: 3,376,403] | | | $ | [removed: 2,936,656] [added: 3,190,029] | |
| Self-insurance reserves | [removed: 71,695] [added: 77,012] | | | | [removed: 67,921] [added: 71,695] | | |
| Accrued payroll | [removed: 77,147] [added: 86,520] | | | | [removed: 71,717] [added: 77,147] | | |
| Accrued benefits and withholdings | [removed: 69,308] [added: 89,082] | | | | [removed: 74,454] [added: 69,308] | | |
| Other current liabilities | [removed: 239,187] [added: 253,990] | | | | [removed: 249,901] [added: 239,187] | | |
| Total current liabilities | [removed: 3,647,366] [added: 3,894,020] | | | | [removed: 3,400,649] [added: 3,647,366] | | |
| Long-term debt | [removed: 2,978,390] [added: 3,417,122] | | | | [removed: 1,887,019] [added: 2,978,390] | | |
| Deferred income taxes | [removed: 85,406] [added: 105,566] | | | | [removed: 90,166] [added: 85,406] | | |
| Other liabilities | [removed: 207,677] [added: 210,414] | | | | [removed: 199,219] [added: 207,677] | | |
| /s/ | Gregory D. Johnson | | /s/ | Thomas McFall |
| Gregory D. Johnson | | | Thomas McFall | |
| February 27, 2019 | | | February 27, 2019 | |
February 27, 2019
February 27, 2019
| Cash and cash equivalents | $ | 31,315 | | | $ | 46,348 | |
| Goodwill | 807,260 | | | | 789,058 | | |
| Income taxes payable | 11,013 | | | | — | | |
| 79,043,919 as of December 31, 2018, and | | | | | | | |
| Net income | — | | | — | | | | — | | | | 1,324,487 | | | | 1,324,487 | | |
| Share repurchases, including fees | (6,061 | ) | | (61 | | ) | | (93,119 | | ) | | (1,620,833 | | ) | | (1,714,013 | | ) |
| Balance at December 31, 2018 | 79,044 | | | $ | 790 | | | $ | 1,262,063 | | | $ | (909,186 | ) | | $ | 353,667 | |
| Net income | $ | 1,324,487 | | | $ | 1,133,804 | | | $ | 1,037,691 | |
After the close of business on December 31, 2018, the Company acquired substantially all of the non-real estate assets of Bennett Auto Supply, Inc. and its affiliates, including 33 stores that were not included in the 2018 store count and were not operated by the Company in 2018.
See Note 4 for further information concerning the Company’s goodwill and other intangibles.
The Company recorded a charge of $11.4 million related to its long-lived assets during the year ended December 31, 2018, primarily due to the disposal of a software project that was no longer expected to provide a long-term benefit.
each participant.
| | 2018 | | | | 2017 | | |
Litigation accruals:
The Company’s primary source of revenue is derived from the sale of automotive aftermarket parts and merchandise to its customers.
Revenue is recognized when performance obligations under the terms of a contract with a customer are satisfied, in an amount representing the consideration the Company expects to receive in exchange for transferring goods to the customer.
taxes.
The company does not recognize revenue related to product warranties, as these are considered assurance warranty obligations.
See the new recent accounting pronouncements section for information regarding the adoption implementation of Accounting Standard Update No. 2014-09, “Revenue from Contracts with Customers (Topic 606).”
Other sales and sales adjustments primarily includes sales to Team Members, wholesale sales to other retailers (“jobber sales”), equipment sales, discounts, rebates, deferred revenue adjustments relating to the Company’s retail loyalty program and adjustments to estimated sales returns allowances.
Sales to Team Members are recorded when the Team Member takes possession of the merchandise.
The Company invests in certain tax credit funds that promote renewable energy.
These investments generate a return primarily through the realization of federal tax credits and other tax benefits.
The Company accounts for its renewable energy investments using the deferral method.
Under this method, realized investment tax credits are recognized as a reduction of the renewable energy investments.
associated with the Company’s various tax positions and actual results could differ from estimates.
In July of 2018, the FASB issued ASU No. 2018-11, “Leases (Topic 842): Targeted Improvement” (“ASU 2018-11”), to provide an additional, optional transition method for adopting ASU 2016-02, which allows for an entity to choose to apply the new lease standard at adoption date and recognize a cumulative-effective adjustment to the opening balance of retained earnings in the period of adoption, while comparative periods presented will continue to be in accordance with current U.S. GAAP Topic 840.
The Company established a task force, composed of multiple functional groups inside of the Company, which has substantially completed its objective of reviewing the critical components of the standard and implementing changes to systems and controls necessary to support the adoption of the new standard beginning with its first quarter ending March 31, 2019.
The Company will adopt this guidance using the additional, optional transition method, the package of transitional practical expedients relating to the identification, classification and initial direct costs of leases commencing before the effective date of Topic 842, and the transitional practical expedient for the treatment of existing land easements; however, the Company will not elect the hindsight transitional practical expedient.
The Company will make an accounting policy election to not apply recognition requirements of the guidance to short-term leases.
The adoption of the new guidance will have a material impact on the total assets and liabilities reported on the Company’s consolidated balance sheet, and the Company estimates net right-of-use assets and lease liabilities to be approximately $1.9 billion and $2.0 billion, respectively, as of January 1, 2019.
The difference between these amounts is primarily due to the accrual for straight-line rent expense.
These estimates are based on the Company’s current lease portfolio and changes to the lease portfolio, including the total number of leases, lease commencement and end dates and lease termination expectations, as well as changes in anticipated lease discount rates, could impact these estimates.
The Company expects to make an adjustment to opening “Retained Deficit” on the Consolidated Balance Sheet of approximately $1.4 million related to the adoption of this new guidance.
The adoption of this new guidance will not have a material impact on the Company’s results of operations, cash flows, liquidity or the Company’s covenant compliance under its existing credit agreement.
| /s/ | Greg Henslee | | /s/ | Thomas McFall |
| Greg Henslee | | | Thomas McFall | |
| | | | February 28, 2018 | |
February 28, 2018
| 92,851,815 as of December 31, 2016 | 843 | | | | 929 | | |
| Balance at December 31, 2014 | 101,603 | | | $ | 1,016 | | | $ | 1,194,929 | | | $ | 822,473 | | | $ | 2,018,418 | |
| Net income | — | | | — | | | | — | | | | 931,216 | | | | 931,216 | | |
| Share repurchases, including fees | (4,901 | ) | | (49 | | ) | | (61,315 | | ) | | (1,074,849 | | ) | | (1,136,213 | | ) |
| | | | | | (As Adjusted, Note) | | | | (As Adjusted, Note) | | |
| Principal payments on capital leases | — | | | | — | | | | (25 | | ) |
| Cash and cash equivalents at end of the year | $ | 46,348 | | | $ | 146,598 | | | $ | 116,301 | |
Note: Certain prior period amounts have been reclassified to conform to current period presentation.
See Note 1 “Summary of Significant Accounting Policies” to the Consolidated Financial Statements for more information.
Notes receivable:
Historically, the Company has utilized notes receivable from supplier and other third parties; however, during the year ended December 31, 2016, the notes receivable from suppliers and other third parties were dissolved, in connection with new supplier contracts, and during the years ended December 31, 2017 and 2016, no new notes receivable arrangements were entered into.
Litigation reserves:
O’Reilly is currently involved in litigation incidental to the ordinary conduct of the Company’s business.
The Company records reserves for litigation losses in instances where a material adverse outcome is probable and the Company is able to reasonably estimate the probable loss.
The Company reserves for an estimate of material legal costs to be incurred in pending litigation matters.
Although the Company cannot ascertain the amount of liability that it may incur from any of these matters, it does not currently believe that, in the aggregate, these matters, taking into account applicable insurance and reserves, will have a material adverse effect on its consolidated financial position, results of operations or cash flows in a particular quarter or annual period.
The program allows a retail customer to enroll at no charge, does not impose a membership fee and provides members with the ability to earn loyalty points by making qualifying purchases at the Company’s stores.
Upon reaching established thresholds, the members are automatically issued coupons, which expire 90 days after issuance, have no cash value and may be redeemed for most items in the Company’s stores with a total purchase price equal to or greater than the value of the coupon.
Points accrued in a member’s account, which have not been awarded to the member with a coupon, expire 12 months after the date that they were earned.
Advertising expense, net of cooperative advertising allowances from suppliers that were incremental to the advertising program, specific
In August of 2015, the FASB issued ASU No. 2015-14, “Revenue from Contracts with Customers (Topic 606): Deferral of the Effective Date” (“ASU 2015-14”), to defer the effective date of ASU 2014-09 by one year.
These ASUs can be adopted retrospectively or as a cumulative-effective adjustment at the date of adoption.
The Company will adopt this guidance beginning with its first quarter ending March 31, 2019.
The Company has established a task force, composed of multiple functional groups inside of the Company, which is currently in the process of evaluating critical components of this new guidance and the potential impact of the guidance on the Company’s financial position, results of operations and cash flows.
Based on the preliminary work completed, the Company is considering the potential implications of the new standard on determining the discount rate to be used in valuing new and existing leases, the treatment of existing favorable and unfavorable lease agreements acquired in connection with previous acquisitions, procedural and operational changes that may be necessary to comply with the provisions of the guidance and all applicable financial statement disclosures required by the new guidance, all of which are areas that could potentially be impacted by adoption of the guidance.
At this time, the task force has not completed its full evaluation; however, the Company believes the adoption of the new guidance will have a material impact on the total assets and total liabilities reported on the Company’s consolidated balance sheets.
ASU 2016-09 amendments related to accounting
In August of 2016, the FASB issued ASU No. 2016-15, “Statement of Cash Flows (Topic 230): Classification of Certain Cash Receipts and Cash Payments (a consensus of the FASB Emerging Issues Task Force)” (“ASU 2016-15”).
ASU 2016-15 reduces the existing diversity in practice for eight specific parts on cash flow statement presentation and classification: debt prepayment or debt extinguishment costs; settlement of zero-coupon debt instruments; contingent consideration payments made after a business combination; proceeds from the settlement of insurance claims; proceeds from the settlement of corporate-owned life insurance (COLI) policies; distributions received from equity method investments; beneficial interests in securitization transactions; and separately identifiable cash flows and application of the predominance principle.
For public companies, ASU 2016-15 is effective for annual reporting periods beginning after December 15, 2017, including interim periods within that reporting period, and requires retrospective adoption, with early adoption permitted.
The Company will adopt this guidance beginning with its first quarter ending March 31, 2018.
In January of 2017, the FASB issued ASU No. 2017-01, “Business Combinations (Topic 805): Clarifying the Definition of a Business” (“ASU 2017-01”).
ASU 2017-01 revises the definition of a business in the Accounting Standards Codification and clarifies the guidance for determining whether the purchase or disposal of an asset or group of assets qualifies as the purchase or disposal of a business.
For public companies, ASU 2017-01 is effective for annual reporting periods beginning after December 15, 2017, including interim periods within that reporting period, and requires prospective adoption, with early adoption permitted with certain conditions.
In May of 2017, the FASB issued ASU No. 2017-09, “Compensation - Stock Compensation (Topic 718): Scope of Modification Accounting” (“ASU 2017-09”).
ASU 2017-09 provides clarity and reduces both the diversity in practice and cost and complexity when applying stock compensation guidance to a change to the terms or conditions of a share-based payment award.
An excerpt. Shown here: 40 of 355 rewritten, 40 of 113 added and 40 of 102 removed. The counts are complete. For every sentence, read Item 8. Financial Statements and Supplementary Data in the FY2018 filing and the FY2017 filing.
Item 9A. Controls and Procedures
3 rewritten, 0 added, 0 removed, 23 unchanged
There were no changes in the Company’s internal control over financial reporting during the fiscal quarter ended December 31, [removed: 2017,] [added: 2018,] that have materially affected, or are reasonably likely to materially affect, the Company’s internal control over financial reporting.
Under the supervision and with the participation of the Company’s principal executive officer and principal financial officer, management assessed the effectiveness of the Company’s internal control over financial reporting as of December 31, [removed: 2017.][added: 2018.]
Based on this assessment, management believes that as of December 31, [removed: 2017,] [added: 2018,] the Company’s internal control over financial reporting was effective based on those criteria.
Item 10. Directors, Executive Officers and Corporate Governance
2 rewritten, 1 added, 2 removed, 19 unchanged
Certain information required by Part III is incorporated by reference from O’Reilly Automotive, Inc. and Subsidiaries’ (the “Company”) Proxy Statement on Schedule 14A for the [removed: 2018] [added: 2019] Annual Meeting of Shareholders (“Proxy Statement”), which will be filed with the Securities and Exchange Commission (the “SEC”) within 120 days of the end of the Company’s most recent fiscal year.
In addition, our Board of Directors has determined that Mr. [removed: Murphy,] [added: Hendrickson,] Chairman of the Audit Committee, qualifies as an audit committee financial expert under Item 407(d)(5) of Regulation S-K.
Hendrickson, John R.
Hendrickson, Paul R.
Lederer, John R.
Item 11. Executive Compensation
1 rewritten, 0 added, 0 removed, 3 unchanged
The information required by Item 402 of Regulation S-K will be included in O’Reilly Automotive, Inc. and Subsidiaries’ (the “Company”) Proxy Statement on Schedule 14A for the [removed: 2018] [added: 2019] Annual Meeting of Shareholders (“Proxy Statement”) under the captions “Compensation of Executive Officers” and “Compensation of Directors” and is incorporated herein by reference.
Item 12. Security Ownership of Certain Beneficial Owners and Management and Related Stockholder Matters
1 rewritten, 0 added, 0 removed, 1 unchanged
The information required by Item 201(d) of Regulation S-K will be included in O’Reilly Automotive, Inc. and Subsidiaries’ (the “Company”) Proxy Statement on Schedule 14A for the [removed: 2018] [added: 2019] Annual Meeting of Shareholders (“Proxy Statement”) under the caption “Equity Compensation Plans” and is incorporated herein by reference.
Item 13. Certain Relationships and Related Transactions, and Director Independence
1 rewritten, 0 added, 0 removed, 1 unchanged
The information required by Item 404 of Regulation S-K will be included in the O’Reilly Automotive, Inc. and Subsidiaries’ (the “Company”) Proxy Statement on Schedule 14A for the [removed: 2018] [added: 2019] Annual Meeting of Shareholders (“Proxy Statement”) under the caption “Certain Relationships and Related Transactions” and is incorporated herein by reference.
Item 14. Principal Accountant Fees and Services
1 rewritten, 0 added, 0 removed, 1 unchanged
The information required by Item 9(e) of Schedule 14A will be included in O’Reilly Automotive, Inc. and Subsidiaries’ Proxy Statement on Schedule 14A for the [removed: 2018] [added: 2019] Annual Meeting of Shareholders under the caption “Fees Paid to Independent Registered Public Accounting Firm” and is incorporated herein by reference.
Item 15. Exhibits and Financial Statement Schedules
12 rewritten, 2 added, 0 removed, 98 unchanged
The following consolidated financial statements of O’Reilly Automotive, Inc. and Subsidiaries included in the Annual Shareholders’ Report of the registrant for the year ended December 31, [removed: 2017,] [added: 2018,] are filed with this Annual Report in Part II, Item 8:
Consolidated Balance Sheets as of December 31, [removed: 2017] [added: 2018] and [removed: 2016][added: 2017]
Consolidated Statements of Income for the years ended December 31, [removed: 2017, 2016] [added: 2018, 2017] and [removed: 2015][added: 2016]
Consolidated Statements of Shareholders’ Equity for the years ended December 31, [removed: 2017, 2016] [added: 2018, 2017] and [removed: 2015][added: 2016]
Consolidated Statements of Cash Flows for the years ended December 31, [removed: 2017, 2016] [added: 2018, 2017] and [removed: 2015][added: 2016]
Notes to Consolidated Financial Statements for the years ended December 31, [removed: 2017, 2016] [added: 2018, 2017] and [removed: 2015][added: 2016]
| [removed: [21.1](https://www.sec.gov/Archives/edgar/data/898173/000089817318000077/orly-20171231x10xkexhibit211.htm)] [added: [21.1](https://www.sec.gov/Archives/edgar/data/898173/000089817319000060/orly-20181231x10xkexhibit211.htm)] | [Subsidiaries of the Registrant, filed [removed: herewith.](https://www.sec.gov/Archives/edgar/data/898173/000089817318000077/orly-20171231x10xkexhibit211.htm)] [added: herewith.](https://www.sec.gov/Archives/edgar/data/898173/000089817319000060/orly-20181231x10xkexhibit211.htm)] |
| [removed: [23.1](https://www.sec.gov/Archives/edgar/data/898173/000089817318000077/orly-20171231x10xkexhibit231.htm)] [added: [23.1](https://www.sec.gov/Archives/edgar/data/898173/000089817319000060/orly-20181231x10xkexhibit231.htm)] | [Consent of Ernst & Young LLP, independent registered public accounting firm, filed [removed: herewith.](https://www.sec.gov/Archives/edgar/data/898173/000089817318000077/orly-20171231x10xkexhibit231.htm)] [added: herewith.](https://www.sec.gov/Archives/edgar/data/898173/000089817319000060/orly-20181231x10xkexhibit231.htm)] |
| [removed: [31.1](https://www.sec.gov/Archives/edgar/data/898173/000089817318000077/orly-20171231x10xkexhibit311.htm)] [added: [31.1](https://www.sec.gov/Archives/edgar/data/898173/000089817319000060/orly-20181231x10xkexhibit311.htm)] | [Certificate of the Chief Executive Officer pursuant to Section 302 of the Sarbanes-Oxley Act of 2002, filed [removed: herewith.](https://www.sec.gov/Archives/edgar/data/898173/000089817318000077/orly-20171231x10xkexhibit311.htm)] [added: herewith.](https://www.sec.gov/Archives/edgar/data/898173/000089817319000060/orly-20181231x10xkexhibit311.htm)] |
| [removed: [31.2](https://www.sec.gov/Archives/edgar/data/898173/000089817318000077/orly-20171231x10xkexhibit312.htm)] [added: [31.2](https://www.sec.gov/Archives/edgar/data/898173/000089817319000060/orly-20181231x10xkexhibit312.htm)] | [Certificate of the Chief Financial Officer pursuant to Section 302 of the Sarbanes-Oxley Act of 2002, filed [removed: herewith.](https://www.sec.gov/Archives/edgar/data/898173/000089817318000077/orly-20171231x10xkexhibit312.htm)] [added: herewith.](https://www.sec.gov/Archives/edgar/data/898173/000089817319000060/orly-20181231x10xkexhibit312.htm)] |
| [32.1 [removed: *](https://www.sec.gov/Archives/edgar/data/898173/000089817318000077/orly-20171231x10xkexhibit321.htm)] [added: *](https://www.sec.gov/Archives/edgar/data/898173/000089817319000060/orly-20181231x10xkexhibit321.htm)] | [Certificate of the Chief Executive Officer pursuant to 18 U.S.C. Section 1350, as adopted pursuant to Section 906 of the Sarbanes-Oxley Act of 2002, furnished [removed: herewith.](https://www.sec.gov/Archives/edgar/data/898173/000089817318000077/orly-20171231x10xkexhibit321.htm)] [added: herewith.](https://www.sec.gov/Archives/edgar/data/898173/000089817319000060/orly-20181231x10xkexhibit321.htm)] |
| [32.2 [removed: *](https://www.sec.gov/Archives/edgar/data/898173/000089817318000077/orly-20171231x10xkexhibit322.htm)] [added: *](https://www.sec.gov/Archives/edgar/data/898173/000089817319000060/orly-20181231x10xkexhibit322.htm)] | [Certificate of the Chief Financial Officer pursuant to 18 U.S.C. Section 1350, as adopted pursuant to Section 906 of the Sarbanes-Oxley Act of 2002, furnished [removed: herewith.](https://www.sec.gov/Archives/edgar/data/898173/000089817318000077/orly-20171231x10xkexhibit322.htm)] [added: herewith.](https://www.sec.gov/Archives/edgar/data/898173/000089817319000060/orly-20181231x10xkexhibit322.htm)] |
| [4.15](http://www.sec.gov/Archives/edgar/data/898173/000110465918034071/a18-12615_4ex4d1.htm) | [Third Supplemental Indenture, dated as of May 17, 2018, by and between O’Reilly Automotive, Inc. and UMB Bank N.A., as Trustee, filed as Exhibit 4.1 to the Registrant’s Current Report on Form 8-K dated May 17, 2018, is incorporated herein by this reference](http://www.sec.gov/Archives/edgar/data/898173/000110465918034071/a18-12615_4ex4d1.htm). |
| [4.16](http://www.sec.gov/Archives/edgar/data/898173/000110465918034071/a18-12615_4ex4d1.htm) | [Form of Note for 4.350% Senior Notes due 2028, included in Exhibit 4.1 to the Registrant’s Current Report on Form 8-K dated May 17, 2018, is incorporated herein by this reference](http://www.sec.gov/Archives/edgar/data/898173/000110465918034071/a18-12615_4ex4d1.htm). |
Item 16. Form 10-K Summary
16 rewritten, 7 added, 11 removed, 43 unchanged
| For the year ended December 31, 2017 | | [removed: $ | 9,595] [added: 12,040] | | | [removed: $] | [removed: 1,347] [added: 8,598] | | | [removed: $] | — | | | [removed: $] | [removed: —] [added: 7,921] | | | [added: (1)] | [removed: $] | [removed: 10,942] [added: 12,717] | | [added: |]
| For the year ended December 31, 2016 | | [removed: 7,978] [added: $] | [added: 9,637] | | | [removed: 1,617] [added: $] | [added: 9,587] | | | [removed: —] [added: $] | [added: —] | | | [removed: —] [added: $] | [added: 7,184] | | [added: (1)] | | [removed: 9,595] [added: $] | [added: 12,040] | |
| For the year ended December 31, [removed: 2017] [added: 2018] | | $ | [removed: 12,040] [added: 12,717] | | | $ | [removed: 8,598] [added: 9,475] | | | $ | — | | | $ | [removed: 7,921] [added: 8,954] | | (1) | | $ | [removed: 12,717] [added: 13,238] | |
| | Date: | February [removed: 28, 2018] [added: 27, 2019] | |
| | [removed: By:] [added: /s/] | [added: Rosalie O’Reilly Wooten | |] /s/ | Greg Henslee | [added: |]
| | [added: Rosalie O’Reilly Wooten] | [added: | |] Greg Henslee | | [added: |]
| | | Chief Executive Officer [added: and] | |
| Date: | February [removed: 28, 2018] [added: 27, 2019] | | | | | |
| | /s/ | David O’Reilly | | /s/ | [removed: Charles H.] [added: Larry] O’Reilly [removed: Jr.] | |
| | David O’Reilly | | | [removed: Charles H.] [added: Larry] O’Reilly [removed: Jr.] | | |
| | Director [removed: and] [added: | | | Executive] Vice Chairman of the Board | | | [removed: Director | | |]
| | Director | | | [removed: Director] | | |
| | /s/ | [removed: Dana M. Perlman] [added: Ronald Rashkow] | | [removed: /s/] | [removed: Ronald Rashkow] | |
| | [removed: Dana M. Perlman] [added: Ronald Rashkow] | | | [removed: Ronald Rashkow] | | |
| | [removed: Director] [added: Chief Executive Officer] and | | | Executive Vice President and | | |
| | [removed: Chief Executive Officer] [added: Co-President] | | | Chief Financial Officer | | |
| | By: | /s/ | Gregory D. Johnson |
| | | Gregory D. Johnson | |
| | | Co-President | |
| | /s/ | John R. Murphy | | /s/ | Dana M. Perlman | |
| | John R. Murphy | | | Dana M. Perlman | | |
| | /s/ | Gregory D. Johnson | | /s/ | Thomas McFall | |
| | Gregory D. Johnson | | | Thomas McFall | | |
| | | | | | | | | | | | | | | | | | | | | | |
| Sales and returns allowances: | | | | | | | | | | | | | | | | | | | | | |
| For the year ended December 31, 2015 | | $ | 6,855 | | | $ | 1,123 | | | $ | — | | | $ | — | | | | $ | 7,978 | |
| For the year ended December 31, 2016 | | 9,637 | | | | 9,587 | | | | — | | | | 7,184 | | | (1) | | 12,040 | | |
| For the year ended December 31, 2015 | | $ | 8,713 | | | $ | 7,119 | | | $ | — | | | $ | 6,195 | | (1) | | $ | 9,637 | |
| | /s/ | Larry O’Reilly | | /s/ | Rosalie O’Reilly Wooten | |
| | Larry O’Reilly | | | Rosalie O’Reilly Wooten | | |
| | /s/ | Paul R. Lederer | | /s/ | John R. Murphy | |
| | Paul R. Lederer | | | John R. Murphy | | |
| | /s/ | Greg Henslee | | /s/ | Thomas McFall | |
| | Greg Henslee | | | Thomas McFall | | |