 filings.tools
O'Reilly Automotive (ORLY) 10-K risk factor changes: FY2019 vs FY2018
The 2019-12-31 10-K against the 2018-12-31 one, compared heading by heading and sentence by sentence. One of these filings carries no fiscal year tag, so its year is the calendar year of the period end.
Item 1A44 rewritten55 added8 removed77 unchanged
All filing items583 rewritten1,654 added1,552 removed529 unchanged
Summary
counted, not written
- Item 1A headings could not be compared: only 0 carried over between the two years, which usually means one filing was read wrongly, so none is reported as new or removed.
- Sentence by sentence, 1,654 added, 1,552 removed, 583 rewritten and 529 unchanged across 21 items that differ.
- Not in this year's filing: Item 7A. Quantitative and Qualitative Disclosures about Market Risk; Item 1B. Unresolved Staff Comments; Item 2. Properties; Item 8. Financial Statements and Supplementary Data; Item 12. Security Ownership of Certain Beneficial Owners and Management and Related Stockholder Matters; Item 15. Exhibits and Financial Statement Schedules; Item 16. Form 10-K Summary.
Sentences by item
22 items, with every count and a link to each item that changed
Underlined words on a shaded ground are new in FY2019; struck-through words were in FY2018. Sentences that are wholly new or wholly gone are labelled rather than marked.
Item 1A. Risk Factors
44 rewritten, 55 added, 8 removed, 77 unchanged
Interested parties should be aware that the occurrence of the events described in these risk factors, elsewhere in this Form 10-K and in our other filings with the Securities and Exchange Commission could [removed: have a material adverse effect on our business, operating results and financial condition.]
[removed: Deteriorating] [added: Deteriorating] economic conditions may adversely impact demand for our products, reduce access to credit and cause our customers and others, with which we do business, to suffer financial hardship, all of which could adversely impact our business, results of operations, financial condition and cash [removed: flows.][added: flows.]
The economic health of our customers is affected by many factors, including, among others, general business conditions, interest rates, inflation, consumer debt levels, the availability of consumer credit, currency exchange rates, taxation, fuel prices, unemployment levels and other matters that influence consumer confidence and [removed: spending.][added: spending, such as a prolong public health crisis or epidemic (such as the coronavirus).]
If third parties, on whom we rely for merchandise, are unable to overcome difficulties resulting from the deterioration in economic [removed: conditions] [added: conditions, the cause of which could include a prolonged public health crisis or epidemic (such as the coronavirus),] and provide us with the merchandise we need, or if counterparties to our credit facilities do not perform their obligations, our business, results of operations, financial condition and cash flows could be adversely affected.
[removed: The] [added: The] automotive aftermarket business is highly competitive, and we may have to risk our capital to remain competitive, all of which could adversely impact our business, results of operations, financial condition and cash [removed: flows.][added: flows.]
Both the [removed: do-it-yourself (“DIY”)] [added: DIY] and professional service provider portions of our business are highly competitive, particularly in the more densely populated areas that we serve.
Online and mobile platforms may allow customers to quickly compare prices and product assortments between us and a range of competitors, which [added: could result in pricing pressure.]
[removed: We] [added: We] are sensitive to regional economic and weather conditions that could impact our costs and [removed: sales.][added: sales.]
In addition, our stores and [removed: distribution centers (“DCs”)] [added: DCs] located in coastal regions may be subject to increased insurance claims resulting from regional weather conditions and our results of operations, financial condition and cash flows could be adversely affected.
[removed: We] [added: We] cannot assure future growth will be [removed: achieved.][added: achieved.]
We cannot be sure that our growth plans for [removed: 2019] [added: 2020] and beyond will be achieved.
[removed: Failure] to achieve our growth objectives may negatively impact the trading price of our common stock.
[removed: In] [added: In] order to be successful, we will need to retain and motivate key [removed: employees.][added: employees.]
[removed: A] [added: A] change in the relationship with any of our key suppliers, the unavailability of our key products at competitive prices or changes in trade policies could affect our financial [removed: health.][added: health.]
We could also be negatively impacted by suppliers who might experience work stoppages, labor [removed: strikes] [added: strikes, a prolonged public health crisis] or [added: epidemic (such as the coronavirus) or] other interruptions to, or difficulties in the, manufacture or supply of the products we purchase from them.
[removed: Risks] [added: Risks] associated with future acquisitions may not lead to expected growth and could result in increased costs and [removed: inefficiencies.][added: inefficiencies.]
Acquisitions involve certain risks that could cause our actual growth and profitability to differ from our [removed: expectations, examples of such risks include the following:][added: expectations.]
| [removed: •] | [added: ● |] We may not be able to continue to identify suitable acquisition targets or to acquire additional companies at favorable prices or on other favorable terms. |
| [removed: •] | [added: ● |] Our management’s attention may be distracted. |
| [removed: •] | [added: ● |] We may fail to retain key personnel from acquired businesses. |
| [removed: •] | [added: ● |] We may assume unanticipated legal liabilities and other problems. |
| [removed: •] | [added: ● |] We may not be able to successfully integrate the operations (accounting and billing functions, for example) of businesses we acquire to realize economic, operational and other benefits. |
| [removed: •] | [added: ● |] We may fail, or be unable to, discover liabilities of businesses that we acquire for which we or the subsequent owner or operator may be liable. |
[removed: Business] [added: Business] interruptions in our distribution centers or other facilities may affect our store hours, operability of our computer systems, and/or availability and distribution of merchandise, which may affect our [removed: business.][added: business.]
[removed: Failure] [added: Failure] to achieve and maintain a high level of product and service quality may reduce our brand value and negatively impact our [removed: business.][added: business.]
[removed: Risks] [added: Risks] related to us and unanticipated fluctuations in our quarterly operating results could affect our stock [removed: price.][added: price.]
[removed: The] [added: The] market price of our common stock may be volatile and could expose us to securities class action [removed: litigation.][added: litigation.]
In the past, following periods of volatility in the market price of a company’s securities, securities class action litigation has often been [removed: instituted] [added: initiated] against such companies.
If similar litigation were [removed: instituted] [added: initiated] against us, it could result in substantial costs and a diversion of our management’s attention and resources, which could have an adverse effect on our business.
[removed: Our increased] [added: Our] debt levels could adversely affect our cash flow and prevent us from fulfilling our [removed: obligations.][added: obligations.]
| [removed: •] | [added: ● |] make it more difficult to satisfy our financial obligations, including those relating to the senior unsecured notes and our credit facility; |
| [removed: •] | [added: ● |] increase our vulnerability to adverse economic and industry conditions; |
| [removed: •] | [added: ● |] limit our flexibility in planning for, or reacting to, changes and opportunities in our industry, which may place us at a competitive disadvantage; |
| [removed: •] | [added: ● |] require us to dedicate a substantial portion of our cash flows to service the principal and interest on the debt, reducing the funds available for other business purposes, such as working capital, capital expenditures or other cash requirements; |
| [removed: •] | [added: ● |] limit our ability to incur additional debt with acceptable terms, if at all; and |
| [removed: •] | [added: ● |] expose us to fluctuations in interest rates, including changes that may result from the implementation of new benchmark rates that replace LIBOR. |
A failure to comply with these restrictions could result in a default under our financing obligations [added: or could require us to obtain waivers from our lenders for failure to comply with these restrictions.]
[removed: A] [added: A] downgrade in our credit rating would impact our cost of capital and could impact the market value of our unsecured senior notes, as well as limit our access to attractive supplier financing [removed: programs.][added: programs.]
In addition, a downgrade in our current credit rating could limit the financial institutions willing to commit funds to our [removed: supplier financing programs at attractive rates.]
[removed: A] [added: A] breach of customer, supplier, Team Member or Company information could damage our reputation or result in substantial additional costs or possible [removed: litigation.][added: litigation.]
have a material adverse effect on our business, operating results and financial condition.
Failure
Examples of such risks include the following:
| --- | --- | --- |
| --- | --- | --- |
| --- | --- | --- |
| --- | --- | --- |
| --- | --- | --- |
| --- | --- | --- |
| --- | --- | --- |
| --- | --- | --- |
| --- | --- | --- |
| --- | --- | --- |
| --- | --- | --- |
| --- | --- | --- |
supplier financing programs at attractive rates.
Risks associated with international operations could result in additional costs and inefficiencies.
In addition to many of the risks we face in our U.S. operations, international operations present a unique set of risks and challenges, including local laws and customs, U.S. laws applicable to foreign operations, and political and socio-economic conditions.
Our ability to operate effectively and grow in international markets could be impacted by these risks resulting in legal liabilities, additional costs, and the distraction of management’s attention.
Compliance with the Foreign Corrupt Practices Act and protection of intellectual property rights surrounding items such as tradenames and trademarks in foreign jurisdictions can pose significant challenges.
In addition, our operations in international markets are conducted primarily in the local currency of those countries.
Given that our Consolidated Financial Statements are denominated in U.S. dollars, amounts of assets, liabilities, net sales, and other revenues and expenses denominated in local currencies must be translated into U.S. dollars using exchange rates for the current period.
As a result, foreign currency exchange rates and fluctuations in those rates may adversely impact our financial performance.
Item 1B.
Unresolved Staff Comments
None.
Item 2.
Properties
_Stores, distribution centers and other properties:_
Of the 5,460 stores that we operated at December 31, 2019, 2,235 stores were owned, 3,151 stores were leased from unaffiliated parties, 21 of which were located in Mexico, and 74 stores were leased from entities that include one or more of our affiliated directors or members of their immediate family.
Leases with unaffiliated parties generally provide for payment of a fixed base rent, payment of certain tax, insurance and maintenance expenses and an original term of, at a minimum, 10 years, subject to one or more renewals at our
option.
We have entered into separate master lease agreements with each of the affiliated entities for the occupancy of the stores covered thereby.
Such master lease agreements with two of the seven affiliated entities have been modified to extend the term of the lease agreement for specific stores.
The master lease agreements or modifications thereto expire on dates ranging from July 31, 2020, to September 30, 2031.
We believe that the lease agreements with the affiliated entities are on terms comparable to those obtainable from third parties.
The following table provides information regarding our U.S. domestic regional DCs in operation as of December 31, 2019:
| | | | | | | |
| --- | --- | --- | --- | --- | --- | --- |
| | | | | | | Operating Square Footage (1) |
Unless otherwise indicated, “we,” “us,” “our” and similar terms, as well as references to the “Company,” refer to O’Reilly Automotive, Inc. and its subsidiaries.
could result in pricing pressure.
| | |
| --- | --- |
or could require us to obtain waivers from our lenders for failure to comply with these restrictions.
The enactment of legislation implementing changes in the taxation of business activities, the adoption of other corporate tax reform policies, or changes in tax legislation or policies may affect our business, financial condition, results of operations and cash flows.
The Company is subject to taxation in the U.S. In December 2017, comprehensive tax legislation, commonly referred to as the U.S. Tax Cuts and Jobs Act (the “Tax Act”), was enacted and the changes included in the Tax Act are broad and complex.
As tax laws and related regulations and interpretations change, our financial condition, results of operations and cash flows could be materially impacted.
An excerpt. Shown here: 40 of 44 rewritten, 40 of 55 added and all 8 removed. The counts are complete. For every sentence, read Item 1A. Risk Factors in the FY2019 filing and the FY2018 filing.
Item 7. Management’s Discussion and Analysis of Financial Condition and Results of Operations
230 rewritten, 1,258 added, 80 removed, 207 unchanged
| [removed: •] | [added: ● |] an overview of the key drivers of the automotive aftermarket industry; |
| [removed: •] | [added: ● |] key events and recent developments within our company; |
| [removed: •] | [added: ● |] our results of operations for the years ended December 31, [added: 2019,] 2018, [removed: 2017] and [removed: 2016;] [added: 2017;] |
| [removed: •] | [added: ● |] our liquidity and capital resources; |
| [removed: •] | [added: ● |] any contractual obligations, to which we are committed; |
| [removed: •] | [added: ● |] any off-balance sheet arrangements we utilize; |
| [removed: •] | [added: ● |] our critical accounting estimates; |
| [removed: •] | [added: ● |] the inflation and seasonality of our business; |
| [removed: •] | [added: ● |] our quarterly results for the years ended December 31, [removed: 2018,] [added: 2019,] and [removed: 2017;] [added: 2018;] and |
| [removed: •] | [added: ● |] recent accounting pronouncements that may affect our Company. |
[removed: FORWARD-LOOKING STATEMENTS][added: FORWARD-LOOKING STATEMENTS]
Such statements are subject to risks, uncertainties and assumptions, including, but not limited to, the economy in general, inflation, tariffs, product demand, the market for auto parts, competition, weather, risks associated with the performance of acquired businesses, our ability to hire and retain qualified employees, consumer debt levels, our increased debt levels, credit ratings on public debt, governmental regulations, information security and [removed: cyber attacks,] [added: cyber-attacks,] terrorist activities, war and the threat of war.
Please refer to the “Risk Factors” section [removed: of our] [added: in this] annual report on Form 10-K for the year ended December 31, [removed: 2018,] [added: 2019, and subsequent Securities and Exchange Commission filings,] for additional factors that could materially affect our financial performance.
[removed: OVERVIEW][added: OVERVIEW]
We are one of the largest U.S. automotive aftermarket specialty retailers, selling our products to both [removed: do-it-yourself (“DIY”)] [added: DIY] customers and professional service providers – our “dual market strategy.” Our stores carry an extensive product line consisting of new and remanufactured automotive hard parts, maintenance items, accessories, a complete line of auto body paint and related materials, automotive tools and professional service provider service equipment.
[removed: Operating within the retail industry, we] [added: We] are influenced by a number of general macroeconomic factors [added: that influence both our industry and our consumers,] including, but not limited to, fuel costs, unemployment [added: trends, interest] rates, [removed: consumer preferences] and [removed: spending habits, and competition.][added: other economic factors.]
[removed: g our product offering to adjust to customers’ changing preferences, and we also] [added: We] have [added: ongoing] initiatives focused on marketing and training to educate customers on the advantages of ongoing vehicle maintenance, as well as “purchasing up” on the value spectrum.
We believe the key drivers of current and future [added: long-term] demand for the products sold within the automotive aftermarket include the number of U.S. miles driven, number of U.S. registered vehicles, new light vehicle [removed: registrations,] [added: registrations and] average vehicle [removed: age and unemployment.][added: age.]
[removed: | • | Number of Miles Driven – The number of total miles driven in the U.S. influences the demand for repair and maintenance products sold within the automotive aftermarket.] In total, vehicles in the U.S. are driven approximately three trillion miles per year, resulting in ongoing wear and tear and a corresponding continued demand for the repair and maintenance products necessary to keep these vehicles in operation. [removed: According to the Department of Transportation, the number of total miles driven in the U.S. increased 0.3%, 1.2% and 2.4% in 2018, 2017 and 2016, respectively, and we expect to continue to see modest improvements in total miles driven in the U.S., supported by an increasing number of registered vehicles on the road, resulting in continued demand for automotive aftermarket products. |]
[removed: KEY] [added: KEY] EVENTS AND RECENT [removed: DEVELOPMENTS][added: DEVELOPMENTS]
| [removed: •] | [added: ● |] Under the Company’s share repurchase program, as approved by our Board of Directors in January of 2011, we may, from time to time, repurchase shares of our common stock, solely through open market purchases effected through a broker dealer at prevailing market prices, based on a variety of factors such as price, corporate trading policy requirements and overall market conditions. Our Board of Directors may increase or otherwise modify, renew, suspend or terminate the share repurchase program at any time, without prior notice. As announced on [removed: February 7, 2018,] [added: May 31, 2019,] and [removed: November 13, 2018,] [added: February 5, 2020,] our Board of Directors [removed: each time] approved a resolution [added: each time] to increase the authorization amount under our share repurchase program by an additional $1.00 billion, resulting in a cumulative authorization amount of [removed: $11.75] [added: $13.75] billion. Each additional authorization is effective for a [removed: three\-year period, beginning on its respective announcement date. As of February 27, 2019, we had repurchased approximately 73.1 million shares of our common stock at an aggregate cost of $11.02 billion under this program.] |
| [removed: •] | [added: ● |] On May [removed: 17, 2018,] [added: 20, 2019,] we issued $500 million aggregate principal amount of unsecured [removed: 4.350%] [added: 3.900%] Senior Notes due [removed: 2028 (“4.350%] [added: 2029 (“3.900%] Senior Notes due [removed: 2028”)] [added: 2029”)] at a price to the public of [removed: 99.732%] [added: 99.991%] of their face value with [removed: UMB Bank, N.A.] [added: U.S. Bank National Association (“U.S. Bank”)] as trustee. Interest on the [removed: 4.350%] [added: 3.900%] Senior Notes due [removed: 2028] [added: 2029] is payable on June 1 and December 1 of each year, which began on December 1, [removed: 2018,] [added: 2019,] and is computed on the basis of a [removed: 360\-day] [added: 360-day] year. |
| [removed: •] | [added: ● |] After the close of business on December 31, 2018, we completed an asset purchase of [removed: Bennett Auto Supply, Inc. (“Bennett”),] [added: Bennett,] a privately held automotive parts [removed: supplier. The asset purchase included] [added: supplier operating] 33 stores [removed: that] [added: and a warehouse in Florida. These stores] were not [added: operated by the Company in 2018 and were therefore not] included in [added: our 2018 store count. Beginning January 1, 2019,] the [added: operations of the acquired Bennett locations were included in the] Company’s [removed: 2018] store [removed: count] [added: count, consolidated financial statements] and [removed: were not operated by] [added: results of operations. During] the [added: year ended December 31, 2019, the] Company [removed: in 2018,] [added: merged 13 of these acquired Bennett stores into existing O’Reilly locations] and [removed: a warehouse located in southern Florida.] [added: rebranded the remaining 20 Bennett stores as O’Reilly stores.] |
[removed: RESULTS] [added: RESULTS] OF [removed: OPERATIONS][added: OPERATIONS]
The following table includes income statement data as a percentage of sales for the years ended December 31, [removed: 2018, 2017] [added: 2019, 2018] and [removed: 2016:][added: 2017]
| [added: ] | [removed: For] [added: | For] the Year [removed: Ended December 31,] [added: Ended] | | | | | | | |
| [added: ] | [added: |] 2018 | | | 2017 | | [removed: | 2016 | |]
| Sales | [removed: 100.0] | [removed: %] [added: 100.0] | [added: %] | [added: |] 100.0 | % | [added: ] | 100.0 | % |
| Cost of goods sold, including warehouse and distribution expenses | [removed: 47.2] | [added: 46.9] | | [removed: 47.4] [added: ] | [added: 47.2] | | [removed: 47.5] [added: ] | [added: 47.4] | [added: |]
| Gross profit | [removed: 52.8] | [added: 53.1] | | [removed: 52.6] [added: ] | [added: 52.8] | | [removed: 52.5] [added: ] | [added: 52.6] | [added: |]
| Selling, general and administrative expenses | [removed: 33.8] | [added: 34.2] | | [removed: 33.4] [added: ] | [added: 33.8] | | [removed: 32.7] [added: ] | [added: 33.4] | [added: |]
| Operating income | [removed: 19.0] | [added: 18.9] | | [removed: 19.2] [added: ] | [added: 19.0] | | [removed: 19.8] [added: ] | [added: 19.2] | [added: |]
| Interest expense | [removed: (1.3] | [removed: )] [added: (1.4)] | | [removed: (1.0] [added: ] | [removed: )] [added: (1.3)] | | [removed: (0.8] [added: ] | [removed: )] [added: (1.0)] | [added: |]
| Interest income | [removed: —] | [added: 0.1] | | [added: |] — | | [added: ] | [removed: 0.1] [added: —] | |
| Income before income taxes (1) | [removed: 17.8] | [added: 17.6] | | [removed: 18.2] [added: ] | [added: 17.8] | | [removed: 19.1] [added: ] | [added: 18.2] | [added: |]
| Provision for income taxes | [removed: 3.9] | [added: 3.9] | | [removed: 5.6] [added: ] | [added: 3.9] | | [removed: 7.0] [added: ] | [added: 5.6] | [added: |]
| Net income | [removed: 13.9] | [removed: %] [added: 13.7] | [added: %] | [removed: 12.6] [added: ] | [added: 13.9 |] % | [added: ] | [removed: 12.1] [added: 12.6] | % |
[removed: 2018] [added: 2018] Compared to [removed: 2017][added: 2017]
| [added: ] | [removed: Increase] [added: | Increase] in Sales for the Year [removed: Ended December 31, 2018, Compared to the Same Period in 2017 |] [added: Ended] | |
| [removed: Store sales:] [added: Store sales:] | | [added: ] | |
| --- | --- | --- |
| --- | --- | --- |
| --- | --- | --- |
| --- | --- | --- |
| --- | --- | --- |
| --- | --- | --- |
| --- | --- | --- |
| --- | --- | --- |
| --- | --- | --- |
| --- | --- | --- |
As of December 31, 2019, we operated 5,439 stores in 47 U.S. states and 21 stores in Mexico.
Due to the nature of these macroeconomic
factors, we are unable to determine how long current conditions will persist and the degree of impact future changes may have on our business.
The sustained trends of low U.S. unemployment have been favorable to our industry through the support of miles driven and consumer confidence; however, this has also resulted in pressure on wages, particularly when combined with legislated wage increases in certain market areas.
_Number of Miles Driven_
The number of total miles driven in the U.S. influences the demand for repair and maintenance products sold within the automotive aftermarket.
According to the Department of Transportation, the number of total miles driven in the U.S. increased 0.4% and 1.2% in 2018 and 2017, respectively, and through November of 2019, year-to-date miles driven increased 0.9%.
We would expect to continue to see modest improvements in total miles driven in the U.S., supported by an increasing number of registered vehicles on the road, resulting in continued demand for automotive aftermarket products.
_Size and Age of the Vehicle Fleet_
The total number of vehicles on the road and the average age of the vehicle population heavily influence the demand for products sold within the automotive aftermarket industry.
As reported by The Auto Care Association, the total number of registered vehicles increased 8.1% from 2008 to 2018, bringing the number of light vehicles on the road to 272 million by the end of 2018.
For the year ended December 31, 2019, the seasonally adjusted annual rate of light vehicle sales in the U.S. (“SAAR”) was approximately 16.7 million, contributing to the continued growth in the total number of registered vehicles on the road.
In the past decade, vehicle scrappage rates have remained relatively stable, ranging from 4.4% to 5.7% annually.
As a result, over the past decade, the average age of the U.S. vehicle population has increased, growing 20.6%, from 9.7 years in 2008 to 11.7 years in 2018.
We believe this increase in average age can be attributed to better engineered and manufactured vehicles, which can be reliably driven at higher mileages due to better quality power trains, interiors and exteriors, and the consumer’s willingness to invest in maintaining these higher-mileage, better built vehicles.
As the average age of vehicles on the road increases, a larger percentage of miles are being driven by vehicles that are outside of a manufacturer warranty.
These out-of-warranty, older vehicles generate strong demand for automotive aftermarket products as they go through more routine maintenance cycles, have more frequent mechanical failures and generally require more maintenance than newer vehicles.
We believe consumers will continue to invest in these reliable, higher-quality, higher-mileage vehicles and these investments, along with an increasing total light vehicle fleet, will support continued demand for automotive aftermarket products.
| --- | --- | --- |
| --- | --- | --- |
| | | three-year period, beginning on its respective announcement date. As of February 28, 2020, we had repurchased approximately 77.1 million shares of our common stock at an aggregate cost of $12.54 billion under this program. |
| --- | --- | --- |
| --- | --- | --- |
| | ● | After the close of business on November 29, 2019, we completed the acquisition of Mayasa, a specialty retailer of automotive aftermarket parts headquartered in Guadalajara, Jalisco, Mexico pursuant to a stock purchase agreement. At the time of the acquisition, Mayasa operated six distribution centers, 21 Orma Autopartes stores and served over 2,000 independent jobber locations in 28 Mexican states. The results of Mayasa’s operations have been included in the Company’s consolidated financial statements and results of operations beginning from the date of acquisition. Pro forma results of operations related to the acquisition of Mayasa are not presented as Mayasa’s results are not material to the Company’s results of operations. |
| --- | --- | --- |
| | | | | | | | | | |
| --- | --- | --- | --- | --- | --- | --- | --- | --- | --- |
| | | December 31, | | | | | | | |
2019 Compared to 2018
| | | | |
Unless otherwise indicated, “we,” “us,” “our” and similar terms, as well as references to the “Company” or “O’Reilly,” refer to O’Reilly Automotive, Inc. and its subsidiaries.
| | |
| --- | --- |
As of December 31, 2018, we operated 5,219 stores in 47 states.
We have ongoing initiatives aimed at tailorin
| • | Number of U.S. Registered Vehicles, New Light Vehicle Registrations and Average Vehicle Age – The total number of vehicles on the road and the average age of the vehicle population heavily influence the demand for products sold within the automotive aftermarket industry. As reported by The Auto Care Association, the total number of registered vehicles increased 8.5% from 2007 to 2017, bringing the number of light vehicles on the road to 270 million by the end of 2017. For the year ended December 31, 2018, the seasonally adjusted annual rate of light vehicle sales in the U.S. (“SAAR”) was approximately 17.5 million, contributing to the continued growth in the total number of registered vehicles on the road. In the past decade, vehicle scrappage rates have remained relatively stable, ranging from 4.2% to 5.7% annually. As a result, over the past decade, the average age of the U.S. vehicle population has increased, growing 21.9%, from 9.6 years in 2007 to 11.7 years in 2017. We believe this increase in average age can be attributed to better engineered and manufactured vehicles, which can be reliably driven at higher mileages due to better quality power trains and interiors and exteriors, and the consumer’s willingness to invest in maintaining these higher-mileage, better built vehicles. As the average age of vehicles on the road increases, a larger percentage of miles are being driven by vehicles that are outside of a manufacturer warranty. These out-of-warranty, older vehicles generate strong demand for automotive aftermarket products as they go through more routine maintenance cycles, have more frequent mechanical failures and generally require more maintenance than newer vehicles. We believe consumers will continue to invest in these reliable, higher-quality, higher-mileage vehicles and these investments, along with an increasing total light vehicle fleet, will support continued demand for automotive aftermarket products. |
| • | Unemployment – Unemployment, underemployment, the threat of future joblessness and the uncertainty surrounding the overall economic health of the U.S. have a negative impact on consumer confidence and the level of consumer discretionary spending. Long-term trends of high unemployment have historically impeded the growth of annual miles driven, as well as decrease consumer discretionary spending, both of which negatively impact demand for products sold in the automotive aftermarket industry. As of December 31, 2017, the U.S. unemployment rate was 4.1%, and as of December 31, 2018, the U.S. unemployment rate decreased to 3.9%. We believe total employment should remain at healthy levels supporting the trend of modest growth in total miles driven in the U.S. and the continued demand for automotive aftermarket products. |
| | | | | | | | | |
| | | | |
After the close of business on December 31, 2018, we acquired the 33 Bennett stores that were not included in our 2018 store count and were not operated by the Company in 2018.
We anticipate new store growth will be 200 to 210 net, new store openings in 2019 and will net an additional 20 stores, as we will merge 13 of the acquired 33 Bennett stores into existing O’Reilly stores during 2019.
2017 Compared to 2016
| Comparable store sales, including sales from the 48 acquired Bond stores | $ | 182 | |
| Sales for stores opened throughout 2017 | 108 | | |
| Sales from Leap Day in 2016 | (25 | | ) |
In addition, customer transaction counts for the year ended December 31, 2017, were negatively impacted by softer industry demand, resulting, in part, from the unseasonably mild winter weather at the onset of 2017 and a cool, wet summer in many of our markets.
The mild winter weather did not stress vehicle components to the degree more typical harsh winter weather would, which resulted in a lower level of automobile parts breakage and associated demand for our products.
The cool, wet summer in many of our markets resulted in a lower level of demand, as the absence of typical seasonally high temperatures resulted in fewer heat related product repairs.
As of December 31, 2017, we operated 5,019 stores in 47 states compared to 4,829 stores in 47 states at December 31, 2016.
The increase in gross profit as a percentage of sales for the year ended December 31, 2017, was primarily due to a smaller non-cash LIFO impact, partially offset by a lower merchandise margin and higher inventory shrinkage.
The smaller LIFO impact is the result of fewer product acquisition cost improvements during the year ended December 31, 2017, compared 2016.
For the year ended December 31, 2017 and 2016, our LIFO inventory costs were written down by approximately $22 million and $49 million, respectively, to reflect replacement cost.
The lower merchandise margin was primarily the result of merchandise mix, driven by the unfavorable weather conditions during 2017.
The higher inventory shrinkage was primarily cyclical in nature, following a period of lower than average shrinkage trends.
SG&A for the year ended December 31, 2017, increased 7% to $3.00 billion (or 33.4% of sales) from $2.81 billion (or 32.7% of sales) for the same period in 2016.
The increase in total SG&A dollars for the year ended December 31, 2017, was primarily the result of additional Team Members, facilities and vehicles to support our increased sales and store count, partially offset by a $9.1 million benefit from the reduction in our legal accrual following the expiration of the statute of limitations related to a legacy claim and incremental SG&A expenses incurred from one additional day due to Leap Day for the same period one year prior.
The increase in SG&A as a percentage of sales for the year ended December 31, 2017, was primarily due to deleverage of store operating costs on soft comparable store sales during the year ended December 31, 2017.
The decrease in our effective tax rate for the year ended December 31, 2017, was primarily due to the required revaluation of our deferred income tax liabilities, which provided a one-time benefit of 325 basis points to the effective tax rate for the year ended December 31, 2017, and excess tax benefits from share-based compensation, which provided a benefit of 297 basis points to the effective tax rate for the year ended December 31, 2017.
Due to the required revaluation of our deferred income tax liabilities, our diluted earnings per common share for the year ended December 31, 2017, included a one-time benefit of $0.59.
Due to the adoption of ASU 2016-09, our diluted earnings per common share for the year ended December 31, 2017, included a benefit of $0.50.
debt covenants of our credit agreement and, therefore, negatively impact the funds available under our unsecured revolving credit facility.
| | | | | | | | | | | | |
| --- | --- | --- | --- | --- | --- | --- | --- | --- | --- | --- | --- |
| | | | | | | | | | | | | |
| (1) | Prior period amount has been reclassified to conform to current period presentation, due to the Company’s adoption of a new accounting standard during the first quarter ended March 31, 2017. See Note 1 “Summary of Significant Accounting Policies” to the Consolidated Financial Statements of the annual report on Form 10-K for the year ended December 31, 2017. |
Our accounts payable to inventory ratio was 106.0%, 105.7% and 99.1% as of December 31, 2017, 2016 and 2015, respectively.
The smaller increase in our accounts payable to inventory ratio in 2017
was primarily attributable to fewer new suppliers entering our supplier financing programs in 2017 and a smaller decrease in net inventory, due to a softer sales environment, as compared to 2016.
The decrease in other investing activities was primarily due to less acquisition related expenditures in 2017, as compared to 2016.
| | | | | | | | |
An excerpt. Shown here: 40 of 230 rewritten, 40 of 1,258 added and 40 of 80 removed. The counts are complete. For every sentence, read Item 7. Management’s Discussion and Analysis of Financial Condition and Results of Operations in the FY2019 filing and the FY2018 filing.
Item 7A. Quantitative and Qualitative Disclosures about Market Risk
0 rewritten, 0 added, 9 removed, 0 unchanged
Dropped this year
Unless otherwise indicated, “we,” “us,” “our” and similar terms, as well as references to the “Company” or “O’Reilly,” refer to O’Reilly Automotive, Inc. and its subsidiaries.
We are subject to interest rate risk to the extent we borrow against our unsecured revolving credit facility (the “Revolving Credit Facility”) with variable interest rates based on either an Alternative Base Rate or Adjusted LIBO Rate, as defined in the credit agreement governing the Revolving Credit Facility.
As of December 31, 2018, we had outstanding borrowings under our Revolving Credit Facility in the amount of $287 million, at the weighted-average variable interest rate of 4.560%.
At this borrowing level, a 0.50% increase in interest rates would have had an unfavorable annual impact on our pre-tax earnings and cash flows in the amount of $1.4 million.
We had outstanding fixed rate debt of $3.15 billion and $2.65 billion as of December 31, 2018 and 2017, respectively.
The fair value of our fixed rate debt was estimated at $3.12 billion and $2.73 billion as of December 31, 2018 and 2017, respectively, which was determined by reference to quoted market prices.
We invest certain of our excess cash balances in short-term, highly-liquid instruments with maturities of 90 days or less.
We do not expect any material losses from our invested cash balances and we believe that our interest rate exposure is minimal.
As of December 31, 2018, our cash and cash equivalents totaled $31 million.
Item 1. Business
152 rewritten, 111 added, 110 removed, 175 unchanged
[removed: GENERAL INFORMATION][added: GENERAL INFORMATION]
O’Reilly [removed: Automotive, Inc. and its subsidiaries, collectively “we,” “us,” “our,” the “Company,” or “O’Reilly,”] is one of the largest specialty retailers of automotive aftermarket parts, tools, supplies, equipment and accessories in the United [removed: States,] [added: States (“U.S.”),] selling our products to both do-it-yourself (“DIY”) and professional service provider customers, our “dual market strategy.” The business was founded in 1957 by Charles F.
| [removed: •] | [added: ● |] new and remanufactured automotive hard [removed: parts,] [added: parts and maintenance items,] such as alternators, batteries, brake system components, belts, chassis parts, driveline parts, engine parts, fuel pumps, hoses, starters, temperature [removed: control and] [added: control,] water [removed: pumps;] [added: pumps, antifreeze, appearance products, engine additives, filters, fluids, lighting, oil and wiper blades; and] |
| [removed: •] | [added: ● |] accessories, such as floor mats, seat covers and truck accessories. |
| [removed: •] | [added: ● |] battery diagnostic testing; |
| [removed: •] | [added: ● |] battery, wiper and bulb replacement; |
| [removed: •] | [added: ● |] check engine light code [removed: extraction;] [added: extraction, where allowed by law;] |
| [removed: •] | [added: ● |] custom hydraulic hoses; |
| [removed: •] | [added: ● |] drum and rotor resurfacing; |
| [removed: •] | [added: ● |] electrical and module testing; |
| [removed: •] | [added: ● |] loaner tool program; |
| [removed: •] | [added: ● |] machine shops; |
| [removed: •] | [added: ● |] professional paint shop mixing and related materials; and |
| [removed: •] | [added: ● |] used oil, oil filter and battery recycling. |
See the “Risk Factors” section of [removed: Item 1A of] this annual report on Form 10-K for a description of certain risks relevant to our business.
These risk factors include, among others, deteriorating economic conditions, competition in the automotive aftermarket business, our sensitivity to regional economic and weather conditions, future growth assurance, our dependence upon key and other personnel, our relationships with key suppliers and availability of key products, our acquisition strategies, complications in our distribution centers (“DCs”), failure to achieve high levels of service and product quality, unanticipated fluctuations in our quarterly results, the volatility of the market price of our common stock, our increased debt levels, a downgrade in our credit ratings, data security, [removed: and] environmental legislation and other [removed: regulations.][added: regulations and risks associated with international operations.]
[removed: OUR BUSINESS][added: OUR BUSINESS]
[removed: Competitive Advantages][added: Competitive Advantages]
For more than [removed: 35] [added: 40] years, we have established a track record of effectively serving, at a high level, both DIY and professional service provider customers.
In [removed: 2018,] [added: 2019,] we derived approximately [removed: 57%] [added: 56%] of our sales from our DIY customers and approximately [removed: 43%] [added: 44%] of our sales from our professional service provider customers.
We believe we will continue to have a competitive advantage on the professional service provider portion of our business, due to our systems, knowledge and experience serving the professional service provider side of the automotive aftermarket, supported by our approximately [removed: 790] [added: 825] full-time sales staff dedicated solely to calling upon and servicing the professional service provider customer.
| [removed: •] | [added: ● |] superior in-store service through highly-motivated, technically-proficient store personnel (“Professional Parts People”); |
| [removed: •] | [added: ● |] an extensive selection and availability of products; |
| [removed: •] | [added: ● |] many enhanced service programs, including battery and electrical testing, battery, wiper and bulb replacement and check engine light code extractions; |
| [removed: •] | [added: ● |] attractive stores in convenient locations; |
| [removed: •] | [added: ● |] competitive pricing, supported by a good, better, best product assortment designed to meet all of our customers’ quality and value preferences; and |
| [removed: •] | [added: ● |] a robust point-of-sale system integrated with our proprietary electronic catalog, which contains a wide variety of product images, schematics and technical specifications and equips our Team Members with highly effective tools to source products in our extensive supply network. |
[removed: Our strategic, regional,] tiered distribution network includes DCs and Hub stores.
We currently operate [removed: 27] [added: 28] regional DCs, which provide our stores with same-day or overnight access to an average of [removed: 156,000] [added: 159,000] stock keeping units (“SKUs”), many of which are hard-to-find items not typically stocked by other auto parts retailers.
To augment our robust distribution network, we operate a total of [removed: 342] [added: 356] Hub stores that also provide delivery service and same-day access to an average of [removed: 66,000] [added: 68,000] SKUs from a Super Hub or 42,000 SKUs from a Hub to other stores within the surrounding area.
We have a strong management team comprised of [removed: 194] [added: 216] senior managers who average [removed: 20] [added: 21] years of service; [removed: 254] [added: 270] corporate managers who average 16 years of service; and [removed: 518] [added: 540] district managers who average [removed: 13] [added: 14] years of service.
Our management team has demonstrated the consistent ability to successfully execute our business plan and growth strategy by generating [removed: 26] [added: 27] consecutive years of record revenues and earnings and positive comparable store sales results since becoming a public company in April of 1993.
[removed: Growth Strategy][added: Growth Strategy]
[removed: During 2018, we opened 200 net, new stores, and in 2019,] [added: In 2020,] we plan to open approximately [removed: 200 to 210] [added: 180] net, new stores, which will increase our penetration in existing markets and allow for expansion into new, contiguous markets.
| [added: |] (i) | constructing a new facility or renovating an existing one on property we purchase or lease and stocking the new store with fixtures and inventory; |
| [added: |] (ii) | acquiring an independently owned auto parts [removed: store,] [added: store (“jobber store”),] typically by the purchase of substantially all of the inventory and other assets (other than realty) of such store; or |
| [added: |] (iii) | purchasing multi-store chains. |
During [removed: 2018,] [added: 2019,] we relocated [removed: 18] [added: 12] stores and performed minor to major updates or renovations to approximately [removed: 1,000] [added: 1,500] additional stores.
[removed: Team Members][added: Team Members]
As of January 31, [removed: 2019,] [added: 2020,] we employed [removed: 79,174] [added: 82,167] Team Members [removed: (49,476] [added: (53,159] full-time Team Members and [removed: 29,698] [added: 29,008] part-time Team Members), of whom [removed: 67,369] [added: 68,679] were employed at our [added: U.S.] stores, [removed: 8,372] [added: 8,607] were employed at our [removed: DCs and 3,433] [added: U.S. DCs, 3,620] were employed at our [added: U.S.] corporate and regional [removed: offices.][added: offices, and 1,261 were employed in Mexico.]
Unless otherwise indicated, “we,” “us,” “our” and similar terms, as well as references to the “Company,” refer to O’Reilly Automotive, Inc. and its Subsidiaries.
After the close of business on November 29, 2019, we completed the acquisition of Mayoreo de Autopartes y Aceites, S.A. de C.V. (“Mayasa”), a specialty retailer of automotive aftermarket parts headquartered in Guadalajara, Jalisco, Mexico pursuant to a stock purchase agreement.
At the time of the acquisition, Mayasa operated six distribution centers, 21 Orma Autopartes stores and served over 2,000 independent jobber locations in 28 Mexican states.
At December 31, 2019, we operated 5,439 stores in 47 states in the United States and 21 stores in Mexico.
| --- | --- | --- |
| --- | --- | --- |
| --- | --- | --- |
| --- | --- | --- |
| --- | --- | --- |
| --- | --- | --- |
| --- | --- | --- |
| --- | --- | --- |
| --- | --- | --- |
| --- | --- | --- |
| --- | --- | --- |
| --- | --- | --- |
| --- | --- | --- |
| --- | --- | --- |
| --- | --- | --- |
| --- | --- | --- |
| --- | --- | --- |
| --- | --- | --- |
Our strategic, regional,
During 2019, we opened 200 net, new domestic stores, as well as 20 net, additional stores from the Bennett Auto Supply (“Bennett”), Inc. acquisition and 21 additional stores from the Mayasa acquisition.
| --- | --- | --- |
| --- | --- | --- |
| --- | --- | --- |
Omnichannel Growth Strategy:
Our Omnichannel growth strategies reflect the continued evolution of customer preferences in researching and completing purchases.
More than ever before, our customers’ purchase decisions are informed by a range of interactions, whether in-person, over the phone, or through a variety of digital channels, as they seek to find the professional parts knowledge and the product availability they need to meet their automotive repair and maintenance needs.
Our Omnichannel growth strategies are focused on offering our customers an enhanced and seamless research and buying experience through any of these channels.
We have long been known for excellent customer service and continue to grow the functionality and user-friendliness of our websites, including www.OReillyAuto.com and www.FirstCallOnline.com, to enhance our customer’s shopping experience.
Many of our customers interact over multiple channels to research and complete a purchase, and the functionality and features of our digital sites complements the outstanding customer service provided in our over 5,400 brick and mortar locations.
In addition, the Company assumed collective bargaining agreements with various unions in Mexico in connection with its acquisition of Mayasa; however, none of the Company’s Team Members are specifically affiliated with, or members of, those unions.
| --- | --- | --- |
| --- | --- | --- |
| --- | --- | --- |
| --- | --- | --- |
| --- | --- | --- |
At December 31, 2018, we operated 5,219 stores in 47 states.
| | |
| --- | --- |
| • | maintenance items, such as antifreeze, appearance products, engine additives, filters, fluids, lighting, oil and wiper blades; and |
In addition, after the close of business on December 31, 2018, we acquired the 33 Bennett Auto Supply, Inc. stores that were not included in our 2018 store count and were not operated by the Company in 2018.
Enhance and Improve Customer Omnichannel Experience:
Regardless of how our customers begin their interaction, whether in-store, over the telephone or digitally, and complete their transaction, whether in-store or delivery to their home or business, our goal is to provide excellent customer service and a seamless experience.
Our user-friendly websites, www.OReillyAuto.com and www.FirstCallOnline.com, allow our customers to search product and repair content, check the in-store availability of our products, and place orders for either delivery or in-store pickup.
We continue to improve the functionality of our websites to provide our customers with a user-friendly and convenient shopping experience, as well as a robust product and repair content information resource, which will continue to enhance the O’Reilly Brand.
In addition, approximately 62 Team Members who drive over-the-road trucks in two of our DCs are represented by labor unions.
| | | | | | | | | | | | | | | | | | | | | | |
| --- | --- | --- | --- | --- | --- | --- | --- | --- | --- | --- | --- | --- | --- | --- | --- | --- | --- | --- | --- | --- | --- |
| | | December 31, 2017 | | | | | | 2018 Net, New Stores | | | | | | December 31, 2018 | | | | | | | |
| Texas | | 690 | | | 13.7 | % | | 16 | | | 8.0 | % | | 706 | | | 13.5 | % | | 13.5 | % |
| California | | 541 | | | 10.8 | % | | 12 | | | 6.0 | % | | 553 | | | 10.6 | % | | 24.1 | % |
| Georgia | | 196 | | | 3.9 | % | | 9 | | | 4.5 | % | | 205 | | | 3.9 | % | | 28.0 | % |
| Illinois | | 193 | | | 3.8 | % | | 10 | | | 5.0 | % | | 203 | | | 3.9 | % | | 31.9 | % |
| Missouri | | 200 | | | 4.0 | % | | 1 | | | 0.5 | % | | 201 | | | 3.9 | % | | 35.8 | % |
| Florida | | 180 | | | 3.6 | % | | 20 | | | 10.0 | % | | 200 | | | 3.8 | % | | 39.6 | % |
| Ohio | | 180 | | | 3.6 | % | | 16 | | | 8.0 | % | | 196 | | | 3.8 | % | | 43.4 | % |
| Tennessee | | 167 | | | 3.3 | % | | 9 | | | 4.5 | % | | 176 | | | 3.4 | % | | 46.8 | % |
| Washington | | 156 | | | 3.1 | % | | — | | | 0.0 | % | | 156 | | | 3.0 | % | | 56.3 | % |
| Alabama | | 132 | | | 2.6 | % | | 7 | | | 3.5 | % | | 139 | | | 2.7 | % | | 59.0 | % |
| Arizona | | 137 | | | 2.7 | % | | 2 | | | 1.0 | % | | 139 | | | 2.7 | % | | 61.7 | % |
| Indiana | | 126 | | | 2.5 | % | | 11 | | | 5.5 | % | | 137 | | | 2.6 | % | | 64.3 | % |
| Minnesota | | 122 | | | 2.4 | % | | 3 | | | 1.5 | % | | 125 | | | 2.4 | % | | 66.7 | % |
| Louisiana | | 116 | | | 2.3 | % | | 5 | | | 2.5 | % | | 121 | | | 2.3 | % | | 69.0 | % |
| Oklahoma | | 121 | | | 2.4 | % | | — | | | 0.0 | % | | 121 | | | 2.3 | % | | 71.3 | % |
| Wisconsin | | 120 | | | 2.4 | % | | 1 | | | 0.5 | % | | 121 | | | 2.3 | % | | 73.6 | % |
| Arkansas | | 110 | | | 2.2 | % | | 2 | | | 1.0 | % | | 112 | | | 2.1 | % | | 75.7 | % |
| Colorado | | 101 | | | 2.0 | % | | 1 | | | 0.5 | % | | 102 | | | 2.0 | % | | 79.8 | % |
| Kentucky | | 88 | | | 1.8 | % | | 7 | | | 3.5 | % | | 95 | | | 1.7 | % | | 81.5 | % |
| Virginia | | 74 | | | 1.5 | % | | 4 | | | 2.0 | % | | 78 | | | 1.5 | % | | 86.1 | % |
| Iowa | | 74 | | | 1.5 | % | | 3 | | | 1.5 | % | | 77 | | | 1.5 | % | | 87.6 | % |
| Oregon | | 69 | | | 1.4 | % | | 1 | | | 0.5 | % | | 70 | | | 1.3 | % | | 88.9 | % |
| Utah | | 61 | | | 1.2 | % | | 3 | | | 1.5 | % | | 64 | | | 1.2 | % | | 90.1 | % |
| Nevada | | 55 | | | 1.1 | % | | 1 | | | 0.5 | % | | 56 | | | 1.1 | % | | 92.3 | % |
| Idaho | | 42 | | | 0.9 | % | | 2 | | | 1.0 | % | | 44 | | | 0.8 | % | | 94.0 | % |
| Massachusetts | | 32 | | | 0.6 | % | | 7 | | | 3.5 | % | | 39 | | | 0.7 | % | | 94.7 | % |
| Maine | | 35 | | | 0.7 | % | | — | | | 0.0 | % | | 35 | | | 0.7 | % | | 95.4 | % |
An excerpt. Shown here: 40 of 152 rewritten, 40 of 111 added and 40 of 110 removed. The counts are complete. For every sentence, read Item 1. Business in the FY2019 filing and the FY2018 filing.
Item 3. Legal Proceedings
1 rewritten, 0 added, 0 removed, 3 unchanged
[removed: O’Reilly] [added: The Company] is currently involved in litigation incidental to the ordinary conduct of the Company’s business.
Cover and table of contents
61 rewritten, 20 added, 10 removed, 22 unchanged
[removed: UNITED STATES][added: UNITED STATES]
[removed: SECURITIES] [added: SECURITIES] AND EXCHANGE [removed: COMMISSION][added: COMMISSION]
[removed: WASHINGTON,] [added: WASHINGTON,] DC [removed: 20549][added: 20549]
[removed: FORM 10-K][added: FORM 10-K]
| [removed: x] [added: ☒] | [removed: ANNUAL] [added: ANNUAL] REPORT PURSUANT TO SECTION 13 OR 15(d) OF THE SECURITIES EXCHANGE ACT OF [removed: 1934] [added: 1934] |
[removed: For] [added: For] the fiscal year [removed: ended December] [added: ended December] 31, [removed: 2018][added: 2019]
| [removed: ¨] [added: ☐] | [removed: TRANSITION] [added: TRANSITION] REPORT PURSUANT TO SECTION 13 OR 15(d) OF THE SECURITIES EXCHANGE ACT OF [removed: 1934] [added: 1934] |
[removed: For] [added: For] the transition period [removed: from ________ to ________][added: from to]
[removed: O’REILLY] [added: O’REILLY] AUTOMOTIVE, [removed: INC.][added: INC.]
[removed: (Exact] [added: (Exact] name of registrant as specified in its [removed: charter)][added: charter)]
| [removed: Missouri] [added: Missouri] | | [removed: 000-21318] [added: 000-21318] | | [removed: 27-4358837] [added: 27-4358837] |
| (State or other jurisdiction | [added: ] | Commission file | [added: ] | (I.R.S. Employer |
| of incorporation or organization) | [added: ] | number | [added: ] | Identification No.) |
[removed: 233] [added: 233] South Patterson [removed: Avenue][added: Avenue]
[removed: Springfield, Missouri 65802][added: Springfield, Missouri 65802]
[removed: (417) 862-6708][added: (417) 862-6708]
[removed: Securities] [added: Securities] registered pursuant to Section 12(b) of the [removed: Act:][added: Act:]
| [removed: Title] [added: Title] of Each [removed: Class] [added: Class] | | [removed: Name] [added: | Trading Symbol(s) | | Name] of Each Exchange on which [removed: Registered] [added: Registered] | [added: | | | |]
| Common [removed: Stock,] [added: Stock |] $0.01 par value | [added: ] | [added: ORLY | |] The NASDAQ Stock Market LLC | [added: | | | |]
| [added: ] | [added: ] | [added: | | |] (NASDAQ Global Select Market) | [added: | | | |]
[removed: Securities] [added: Securities] registered pursuant to Section 12(g) of the [removed: Act:][added: Act:]
Yes [removed: x] [added: ☒] No [removed: ¨][added: ☐]
Yes [removed: ¨] [added: ☐] No [removed: x][added: ☒]
| Large accelerated filer [removed: x] [added: ☒] | | Accelerated filer [removed: ¨] [added: ☐] |
| Non-accelerated filer [removed: ¨] [added: ☐] | [added: ] | Smaller reporting company [removed: ¨] [added: ☐] |
| Emerging growth company [removed: ¨] [added: ☐] | [added: ] | [added: ] |
At February [removed: 18, 2019,] [added: 24, 2020,] an aggregate of [removed: 78,375,610] [added: 74,897,080] shares of common stock of the registrant [removed: was] [added: were] outstanding.
At June 30, [removed: 2018,] [added: 2019,] the aggregate market value of the voting stock held by non-affiliates of the Company was [removed: $16,890,003,772] [added: $23,433,046,431] based on the last price of the common stock reported by The NASDAQ Global Select Market.
[removed: DOCUMENTS] [added: DOCUMENTS] INCORPORATED BY [removed: REFERENCE][added: REFERENCE]
Portions of the definitive proxy statement for the [removed: 2019] [added: 2020] Annual Meeting of Shareholders to be filed with the Securities and Exchange Commission within 120 days after December 31, [removed: 2018,] [added: 2019,] are incorporated by reference into Part III.
[removed: O’REILLY] [added: O’REILLY] AUTOMOTIVE, INC. AND [removed: SUBSIDIARIES][added: SUBSIDIARIES]
[removed: FOR] [added: FOR] THE YEAR ENDED DECEMBER 31, [removed: 2018][added: 2019]
[removed: TABLE] [added: TABLE] OF [removed: CONTENTS][added: CONTENTS]
| [added: ] | | [removed: Page] [added: Page] |
[removed: | [PART I](#s62ECA38D3E63753919E455D3C37AE61D) | | |][added: PART I]
| [removed: [Item 1.](#s4166C04AE94F5B86C71F55D3BB56BEBD)] [added: [Item 1.](#Item1Business_676281)] | [removed: [Business](#s4166C04AE94F5B86C71F55D3BB56BEBD)] [added: [Business](#Item1Business_676281)] | [removed: [2](#s4166C04AE94F5B86C71F55D3BB56BEBD)] [added: 3] |
| [removed: [Item 1A.](#sB45E562DD8715792310B55D3C43A303E)] [added: [Item 1A.](#Item1ARiskFactors_428092)] | [Risk [removed: Factors](#sB45E562DD8715792310B55D3C43A303E)] [added: Factors](#Item1ARiskFactors_428092)] | [removed: [15](#sB45E562DD8715792310B55D3C43A303E)] [added: 14] |
| [removed: [Item 1B.](#s217CDD4F0B7A08A926EE55D3C43AF2BD)] [added: [Item 1B.](#Item1BUnresolvedStaffComments_370595)] | [Unresolved Staff [removed: Comments](#s217CDD4F0B7A08A926EE55D3C43AF2BD)] [added: Comments](#Item1BUnresolvedStaffComments_370595)] | [removed: [18](#s217CDD4F0B7A08A926EE55D3C43AF2BD)] [added: 18] |
| [removed: [Item 2.](#s5BC3C2C5F84C2747A31F55D3BF53C020)] [added: [Item 2.](#Item2Properties_805477)] | [removed: [Properties](#s5BC3C2C5F84C2747A31F55D3BF53C020)] [added: [Properties](#Item2Properties_805477)] | [removed: [19](#s5BC3C2C5F84C2747A31F55D3BF53C020)] [added: 18] |
| [removed: [Item 3.](#s0C48E0BD7F3D5FDE713755D3C469D5A5)] [added: [Item 3.](#Item3LegalProceedings_233756)] | [Legal [removed: Proceedings](#s0C48E0BD7F3D5FDE713755D3C469D5A5)] [added: Proceedings](#Item3LegalProceedings_233756)] | [removed: [20](#s0C48E0BD7F3D5FDE713755D3C469D5A5)] [added: 19] |
| | |
OR
| | |
| | | | | |
| | | | | | | | | | |
| --- | --- | --- | --- | --- | --- | --- | --- | --- | --- |
Yes ☒ No ☐
Yes ☒ No ☐
Yes ☐ No ☒
FORM 10-K
| | | |
| [PART I](#PARTI_699071) | | |
| [PART II](#PARTII_925287) | | |
| [PART IV](#PARTIV_840449) | | |
10-K 1 orly-20181231x10xk.htm 10-K
| | |
OR
| | | | | |
| | | |
| --- | --- | --- |
Indicate by check mark if disclosure of delinquent filers pursuant to Item 405 of Regulation S-K is not contained here, and will not be contained, to the best of the registrant’s knowledge, in definitive proxy or information statements incorporated by reference in Part III of this Form 10-K or any amendment to this Form 10-K. x
| [PART II](#s359E4C4F79F79892D5BE55D3C4821C7F) | | |
| [PART IV](#sFB0CC5BB780042FA362155D3CE1B899B) | | |
PART I
An excerpt. Shown here: 40 of 61 rewritten, all 20 added and all 10 removed. The counts are complete. For every sentence, read Cover and table of contents in the FY2019 filing and the FY2018 filing.
Item 4. Mine Safety Disclosures
1 rewritten, 0 added, 0 removed, 1 unchanged
[removed: PART II][added: PART II]
Item 5. Market for Registrant’s Common Equity, Related Stockholder Matters and Issuer Purchases of Equity Securities
16 rewritten, 15 added, 13 removed, 1 unchanged
[removed: Common stock:][added: _Common stock:_]
Shares of [removed: O’Reilly Automotive, Inc. (the “Company”)] [added: the Company’s] common stock are traded on The NASDAQ Global Select Market (“Nasdaq”) under the symbol “ORLY.” The Company’s common stock began trading on April 22, 1993; no cash dividends have been declared since that time, and the Company does not anticipate paying any cash dividends in the foreseeable future.
As of February 14, [removed: 2019,] [added: 2020,] the Company had approximately [removed: 351,000] [added: 392,000] shareholders of common stock based on the number of holders of record and an estimate of individual participants represented by security position listings.
[removed: Sales] [added: _Sales] of unregistered [removed: securities:][added: securities:_]
There were no sales of unregistered securities during the year ended December 31, [removed: 2018.][added: 2019.]
[removed: Issuer] [added: _Issuer] purchases of equity [removed: securities:][added: securities:_]
The following table identifies all repurchases during the fourth quarter ended December 31, [removed: 2018,] [added: 2019,] of any of the Company’s securities registered under Section 12 of the Securities Exchange Act of 1934, as amended, by or on behalf of the Company or any affiliated purchaser (in thousands, except per share data):
| (1) | Under the Company’s share repurchase program, as approved by its Board of Directors on January 11, 2011, the Company may, from time to time, repurchase shares of its common stock, solely through open market purchases effected through a broker dealer at prevailing market prices, based on a variety of factors such as price, corporate trading policy requirements and overall market conditions not to exceed a dollar limit authorized by the Board of Directors. The Company’s Board of Directors may increase or otherwise modify, renew, suspend or terminate the share repurchase program at any time, without prior notice. As announced on [removed: February 7, 2018,] [added: May 31, 2019,] and [removed: November 13, 2018,] [added: February 5, 2020,] the Company’s Board of Directors each time approved a resolution to increase the authorization amount under the share repurchase program by an additional $1.0 billion, resulting in a cumulative authorization amount of [removed: $11.8] [added: $13.8] billion. Each additional authorization is effective for a [removed: three\-year] [added: three–year] period, beginning on its respective announcement date. The [removed: authorization] [added: authorizations] under the share repurchase program that currently [removed: has] [added: have] capacity [removed: is] [added: are] scheduled to expire on [removed: November 13, 2021.] [added: May 31, 2022, and February 5, 2023.] No other share repurchase programs existed during the twelve months ended December 31, [removed: 2018.] [added: 2019.] |
The Company repurchased a total of [removed: 6.1] [added: 3.9] million shares of its common stock under its publicly announced share repurchase program during the year ended December 31, [removed: 2018,] [added: 2019,] at an average price per share of [removed: $282.80,] [added: $369.55,] for a total investment of [removed: $1.7] [added: $1.4] billion.
Subsequent to the end of the year and through February [removed: 27, 2019,] [added: 28, 2020,] the Company repurchased an additional [removed: 0.8] [added: 0.9] million shares of its common stock, at an average price per share of [removed: $342.95,] [added: $400.78,] for a total investment of [removed: $268.9] [added: $363.4] million.
The Company has repurchased a total of [removed: 73.1] [added: 77.1] million shares of its common stock under its share repurchase program since the inception of the program in January of 2011 and through February [removed: 27, 2019,] [added: 28, 2020,] at an average price of [removed: $150.73,] [added: $162.72,] for a total aggregate investment of [removed: $11.0] [added: $12.5] billion.
[removed: Stock] [added: _Stock] performance [removed: graph:][added: graph:_]
The graph below shows the cumulative total shareholder return assuming the investment of $100, on December 31, [removed: 2013,] [added: 2014,] and the reinvestment of dividends thereafter, if any, in the Company’s common stock versus the Standard and Poor’s S&P 500 Retail Index (“S&P 500 Retail Index”) and the Standard and Poor’s S&P 500 Index (“S&P 500”).
[removed: 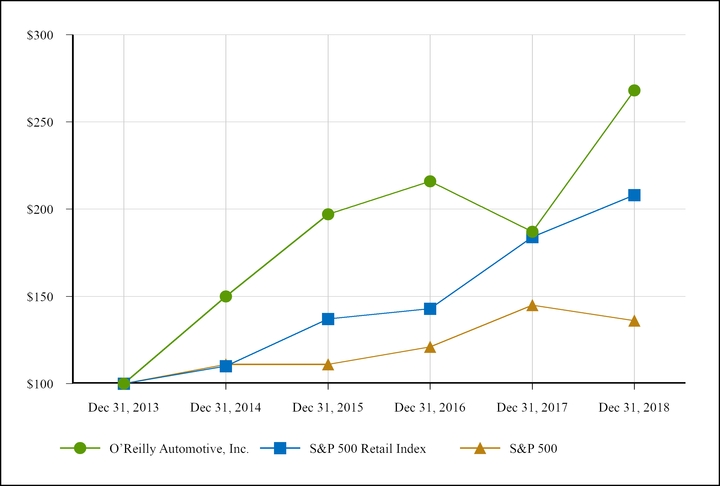][added: ]
| [removed: | | December 31, | | | |] [added: ] | [added: ] | [added: December 31,] | | | | | | | | | | | | | | | | |
| [removed: Company/Index | | 2013 | | | | 2014] [added: Company/Index] | | [added: 2014] | | [removed: 2015] | [added: 2015] | | | [removed: 2016] [added: 2016] | | | [added: 2017] | [removed: 2017] | | [added: 2018] | | [removed: 2018] | [added: 2019] | |
| | | | | | | | | | | |
| --- | --- | --- | --- | --- | --- | --- | --- | --- | --- | --- |
| | | | | | | | Total Number of | | Maximum Dollar Value | |
| | | Total | | Average | | | Shares Purchased as | | of Shares that May Yet | |
| | | Number of | | Price Paid | | | Part of Publicly | | Be Purchased Under the | |
| Period | | Shares Purchased | | per Share | | | Announced Programs | | Programs (1) | |
| October 1, 2019, to October 31, 2019 | | 88 | | $ | 393.84 | | 88 | | $ | 658,656 |
| November 1, 2019, to November 30, 2019 | | 61 | | | 441.75 | | 61 | | | 631,663 |
| December 1, 2019, to December 31, 2019 | | 143 | | | 441.93 | | 143 | | $ | 568,684 |
| Total as of December 31, 2019 | | 292 | | $ | 427.33 | | 292 | | | |
| | | | | | | | | | | | | | | | | | | |
| --- | --- | --- | --- | --- | --- | --- | --- | --- | --- | --- | --- | --- | --- | --- | --- | --- | --- | --- |
| O’Reilly Automotive, Inc. | | $ | 100 | | $ | 132 | | $ | 145 | | $ | 125 | | $ | 179 | | $ | 228 |
| S&P 500 Retail Index | | | 100 | | | 124 | | | 130 | | | 168 | | | 189 | | | 237 |
| S&P 500 | | $ | 100 | | $ | 99 | | $ | 109 | | $ | 130 | | $ | 122 | | $ | 157 |
| | | | | | | | | | | | | | | |
| --- | --- | --- | --- | --- | --- | --- | --- | --- | --- | --- | --- | --- | --- | --- |
| Period | | Total Number of Shares Purchased | | | Average Price Paid per Share | | | | Total Number of Shares Purchased as Part of Publicly Announced Programs | | | Maximum Dollar Value of Shares that May Yet Be Purchased Under the Programs (1) | | |
| October 1, 2018, to October 31, 2018 | | 277 | | | $ | 338.34 | | | 277 | | | $ | 370,701 | |
| November 1, 2018, to November 30, 2018 | | 472 | | | 339.35 | | | | 472 | | | 1,210,365 | | |
| December 1, 2018, to December 31, 2018 | | 617 | | | 338.84 | | | | 617 | | | $ | 1,001,436 | |
| Total as of December 31, 2018 | | 1,366 | | | $ | 338.92 | | | 1,366 | | | | | |
| | |
| | | | | | | | | | | | | | | | | | | | | | | | | |
| --- | --- | --- | --- | --- | --- | --- | --- | --- | --- | --- | --- | --- | --- | --- | --- | --- | --- | --- | --- | --- | --- | --- | --- | --- |
| O’Reilly Automotive, Inc. | | $ | 100 | | | $ | 150 | | | $ | 197 | | | $ | 216 | | | $ | 187 | | | $ | 268 | |
| S&P 500 Retail Index | | 100 | | | | 110 | | | | 137 | | | | 143 | | | | 184 | | | | 208 | | |
| S&P 500 | | $ | 100 | | | $ | 111 | | | $ | 111 | | | $ | 121 | | | $ | 145 | | | $ | 136 | |
Item 6. Selected Financial Data
54 rewritten, 23 added, 3 removed, 13 unchanged
The table below compares [removed: O’Reilly Automotive, Inc.’s (the “Company”)] [added: the “Company’s] selected financial data over a ten-year [removed: period.][added: period:]
| [removed: Years] [added: Years] ended December [removed: 31,] [added: 31,] | [removed: 2018] | [added: 2019] | [removed: 2017] | [added: 2018] | [removed: 2016] | [added: 2017] | [removed: 2015] | [added: 2016] | [removed: 2014] | [added: 2015] | [removed: 2013] | [added: 2014] | [removed: 2012] | [added: 2013] | [removed: 2011] | [added: 2012] | [removed: 2010] | [added: 2011] | [removed: 2009] | [added: 2010] | [added: |]
| (In thousands, except per share, Team Members, stores and ratio data) | | | | | | | | | | | | | | | | | | | | | [added: |]
| [removed: INCOME] [added: INCOME] STATEMENT [removed: DATA:] [added: DATA:] | | | | | | | | | | | | | | | | | | | | | [added: |]
| Sales ($) | [added: | 10,149,985 | |] 9,536,428 | | 8,977,726 | | 8,593,096 | | 7,966,674 | | 7,216,081 | | 6,649,237 | | 6,182,184 | | 5,788,816 | | 5,397,525 | | [removed: 4,847,062 | |]
| Cost of goods sold, including warehouse and distribution expenses | [added: | 4,755,294 | |] 4,496,462 | | 4,257,043 | | 4,084,085 | | 3,804,031 | | 3,507,180 | | 3,280,236 | | 3,084,766 | | 2,951,467 | | 2,776,533 | | [removed: 2,520,534 | |]
| Gross profit | [added: | 5,394,691 | |] 5,039,966 | | 4,720,683 | | 4,509,011 | | 4,162,643 | | 3,708,901 | | 3,369,001 | | 3,097,418 | | 2,837,349 | | 2,620,992 | | [removed: 2,326,528 | |]
| Selling, general and administrative expenses | [added: | 3,473,965 | |] 3,224,782 | | 2,995,283 | | 2,809,805 | | 2,648,622 | | 2,438,527 | | 2,265,516 | | 2,120,025 | | 1,973,381 | | 1,887,316 | | [removed: 1,788,909 | |]
| Former CSK officer clawback | [removed: —] | [added: —] | [added: |] — | | — | | — | | — | | — | | — | | [removed: (2,798] [added: —] | [removed: )] | [removed: —] [added: (2,798)] | | — | |
| Legacy CSK Department of Justice investigation charge | [removed: —] | [added: —] | [added: |] — | | — | | — | | — | | — | | — | | — | | [removed: 20,900] [added: —] | | [removed: —] [added: 20,900] | |
| Operating income | [added: | 1,920,726 | |] 1,815,184 | | 1,725,400 | | 1,699,206 | | 1,514,021 | | 1,270,374 | | 1,103,485 | | 977,393 | | 866,766 | | 712,776 | | [removed: 537,619 | |]
| Write-off of asset-based revolving credit agreement debt issuance costs | [removed: —] | [added: —] | [added: |] — | | — | | — | | — | | — | | — | | [removed: (21,626] [added: —] | [removed: )] | [removed: —] [added: (21,626)] | | — | |
| Termination of interest rate swap agreements | [removed: —] | [added: —] | [added: |] — | | — | | — | | — | | — | | — | | [removed: (4,237] [added: —] | [removed: )] | [removed: —] [added: (4,237)] | | — | |
| Gain on settlement of note receivable | [removed: —] | [added: —] | [added: |] — | | — | | — | | — | | — | | — | | — | | [removed: 11,639] [added: —] | | [removed: —] [added: 11,639] | |
| Other income (expense), net | [removed: (121,097] | [removed: )] [added: (130,397)] | [removed: (87,596] | [removed: )] [added: (121,097)] | [removed: (62,015] | [removed: )] [added: (87,596)] | [removed: (53,655] | [removed: )] [added: (62,015)] | [removed: (48,192] | [removed: )] [added: (53,655)] | [removed: (44,543] | [removed: )] [added: (48,192)] | [removed: (35,872] | [removed: )] [added: (44,543)] | [removed: (25,130] | [removed: )] [added: (35,872)] | [removed: (35,042] | [removed: )] [added: (25,130)] | [removed: (40,721] | [removed: )] [added: (35,042)] | [added: |]
| Total other income (expense) | [removed: (121,097] | [removed: )] [added: (130,397)] | [removed: (87,596] | [removed: )] [added: (121,097)] | [removed: (62,015] | [removed: )] [added: (87,596)] | [removed: (53,655] | [removed: )] [added: (62,015)] | [removed: (48,192] | [removed: )] [added: (53,655)] | [removed: (44,543] | [removed: )] [added: (48,192)] | [removed: (35,872] | [removed: )] [added: (44,543)] | [removed: (50,993] | [removed: )] [added: (35,872)] | [removed: (23,403] | [removed: )] [added: (50,993)] | [removed: (40,721] | [removed: )] [added: (23,403)] | [added: |]
| Income before income taxes | [added: | 1,790,329 | |] 1,694,087 | | 1,637,804 | | 1,637,191 | | 1,460,366 | | 1,222,182 | | 1,058,942 | | 941,521 | | 815,773 | | 689,373 | | [removed: 496,898 | |]
| Provision for income taxes (a)(b) | [added: | 399,287 | |] 369,600 | | 504,000 | | 599,500 | | 529,150 | | 444,000 | | 388,650 | | 355,775 | | 308,100 | | 270,000 | | [removed: 189,400 | |]
| Net income ($) (a)(b) | [added: | 1,391,042 | |] 1,324,487 | | 1,133,804 | | 1,037,691 | | 931,216 | | 778,182 | | 670,292 | | 585,746 | | 507,673 | | 419,373 | | [removed: 307,498 | |]
| [removed: Basic] [added: _Basic] earnings per common [removed: share:] [added: share:_] | | | | | | | | | | | | | | | | | | | | | [added: |]
| Earnings per share – basic ($) | [added: | 18.07 | |] 16.27 | | 12.82 | | 10.87 | | 9.32 | | 7.46 | | 6.14 | | 4.83 | | 3.77 | | 3.02 | | [removed: 2.26 | |]
| Weighted-average common shares outstanding – basic | [added: | 76,985 | |] 81,406 | | 88,426 | | 95,447 | | 99,965 | | 104,262 | | 109,244 | | 121,182 | | 134,667 | | 138,654 | | [removed: 136,230 | |]
| [removed: Earnings] [added: _Earnings] per common share -assuming dilution: [removed: (a)(b)] [added: (a)(b)_] | | | | | | | | | | | | | | | | | | | | | [added: |]
| Earnings per share – assuming dilution ($) | [added: | 17.88 | |] 16.10 | | 12.67 | | 10.73 | | 9.17 | | 7.34 | | 6.03 | | 4.75 | | 3.71 | | 2.95 | | [removed: 2.23 | |]
| Weighted-average common shares outstanding – assuming dilution | [added: | 77,788 | |] 82,280 | | 89,502 | | 96,720 | | 101,514 | | 106,041 | | 111,101 | | 123,314 | | 136,983 | | 141,992 | | [removed: 137,882 | |]
| [removed: SELECTED] [added: SELECTED] OPERATING [removed: DATA:] [added: DATA:] | | | | | | | | | | | | | | | | | | | | | [added: |]
| Number of Team Members at year end [added: (c)] | [added: | 81,223 | |] 78,882 | | 75,552 | | 74,580 | | 71,621 | | 67,569 | | 61,909 | | 53,063 | | 49,324 | | 46,858 | | [removed: 44,880 | |]
| [removed: Number] [added: Total number] of stores at year end [removed: (c)] [added: (d)(e)] | [added: | 5,460 | |] 5,219 | | 5,019 | | 4,829 | | 4,571 | | 4,366 | | 4,166 | | 3,976 | | 3,740 | | 3,570 | | [removed: 3,421 | |]
| [removed: Total store] [added: Store] square footage at year end [removed: (d)] [added: (c)(f)] | [added: | 40,227 | |] 38,455 | | 36,685 | | 35,123 | | 33,148 | | 31,591 | | 30,077 | | 28,628 | | 26,530 | | 25,315 | | [removed: 24,200 | |]
| Sales per weighted-average store [removed: (e)($)] [added: ($) (c)(g)] | [added: | 1,881 | |] 1,842 | | 1,807 | | 1,826 | | 1,769 | | 1,678 | | 1,614 | | 1,590 | | 1,566 | | 1,527 | | [removed: 1,424 | |]
| Sales per weighted-average square foot [removed: (d)(f)($)] [added: ($) (c)(f)(h)] | [added: | 255 | |] 251 | | 248 | | 251 | | 244 | | 232 | | 224 | | 224 | | 221 | | 216 | | [removed: 202 | |]
| Percentage increase in comparable store sales [removed: (g)] [added: (c)(i)] | [added: | 4.0 | % |] 3.8 | % | 1.4 | % | 4.8 | % | 7.5 | % | 6.0 | % | 4.6 | % | 3.5 | % | 4.6 | % | 8.8 | % | [removed: 4.8 | % |]
| [removed: SELECT] [added: SELECT] BALANCE SHEET AND CASH FLOW [removed: DATA:] [added: DATA:] | | | | | | | | | | | | | | | | | | | | | [added: |]
| Working capital [removed: (h)($)] [added: ($) (j)] | [removed: (350,918] | [removed: )] [added: (635,765)] | [removed: (249,694] | [removed: )] [added: (350,918)] | [removed: (142,674] | [removed: )] [added: (249,694)] | [removed: (36,372] | [removed: )] [added: (142,674)] | [added: | (36,372) | |] 252,082 | | 430,832 | | 478,093 | | 1,028,330 | | 1,029,861 | | [removed: 900,857 | |]
| Total assets [removed: (h)($)] [added: ($) (j)] | [added: | 10,717,160 | |] 7,980,789 | | 7,571,885 | | [removed: 7,404,189] [added: 7,204,189] | | 6,676,684 | | 6,532,083 | | 6,057,895 | | 5,741,241 | | 5,494,174 | | 5,031,950 | | [removed: 4,695,536 | |]
| Inventory turnover [removed: (i)] [added: (c)(k)] | [added: | 1.4 | |] 1.4 | | 1.4 | | 1.5 | | 1.5 | | 1.4 | | 1.4 | | 1.4 | | 1.5 | | 1.4 | | [removed: 1.4 | |]
| Accounts payable to inventory [removed: (j)] [added: (c)(l)] | [added: | 104.6 | % |] 105.7 | % | 106.0 | % | 105.7 | % | 99.1 | % | 94.6 | % | 86.6 | % | 84.7 | % | 64.4 | % | 44.3 | % | [removed: 42.8 | % |]
| Current portion of long-term debt and short-term debt ($) | [added: | — | |] — | | — | | — | | — | | 25 | | 67 | | 222 | | 662 | | 1,431 | | [removed: 106,708 | |]
| Long-term debt, less current portion [removed: (h)($)] [added: ($) (j)] | [added: | 3,890,527 | |] 3,417,122 | | 2,978,390 | | 1,887,019 | | 1,390,018 | | 1,388,397 | | 1,386,828 | | 1,087,789 | | 790,585 | | 357,273 | | [removed: 684,040 | |]
| Shareholders’ equity ($) (a) | [added: | 397,340 | |] 353,667 | | 653,046 | | 1,627,136 | | 1,961,314 | | 2,018,418 | | 1,966,321 | | 2,108,307 | | 2,844,851 | | 3,209,685 | | [removed: 2,685,865 | |]
| | | | | | | | | | | | | | | | | | | | | | |
| --- | --- | --- | --- | --- | --- | --- | --- | --- | --- | --- | --- | --- | --- | --- | --- | --- | --- | --- | --- | --- | --- |
| | | | | | | | | | | | | | | | | | | | | | |
| | | | | | | | | | | | | | | | | | | | | | |
| ** | | | | | | | | | | | | | | | | | | | | | |
| ** | | | | | | | | | | | | | | | | | | | | | |
| | | | | | | | | | | | | | | | | | | | | | |
| | | | | | | | | | | | | | | | | | | | | | |
| Number of U.S. stores at year end (d) | | 5,439 | | 5,219 | | 5,019 | | 4,829 | | 4,571 | | 4,366 | | 4,166 | | 3,976 | | 3,740 | | 3,570 | |
| Number of Mexico stores at year end (e) | | 21 | | — | | — | | — | | — | | — | | — | | — | | — | | — | |
| | | | | | | | | | | | | | | | | | | | | | |
| --- | --- | --- | --- | --- | --- | --- | --- | --- | --- | --- | --- | --- | --- | --- | --- | --- | --- | --- | --- | --- | --- |
| Years ended December 31, | | 2019 | | 2018 | | 2017 | | 2016 | | 2015 | | 2014 | | 2013 | | 2012 | | 2011 | | 2010 | |
| (In thousands, except per share, Team Members, stores and ratio data) | | | | | | | | | | | | | | | | | | | | | |
| | | | | | | | | | | | | | | | | | | | | | |
| | | | | | | | | | | | | | | | | | | | | | |
| (c) | Represents O’Reilly U.S. operations only. |
| (e) | In 2019, the Company acquired Mayoreo de Autopartes y Aceites, S.A. de C.V. (“Mayasa”), which added 21 stores to the O’Reilly store count. Financial results for this acquired company have been included in the Company’s consolidated financial statements beginning from the date of the acquisition. |
| --- | --- |
| --- | --- |
| | | | | | | | | | | | | | | | | | | | | |
| --- | --- | --- | --- | --- | --- | --- | --- | --- | --- | --- | --- | --- | --- | --- | --- | --- | --- | --- | --- | --- |
| | |
An excerpt. Shown here: 40 of 54 rewritten, all 23 added and all 3 removed. The counts are complete. For every sentence, read Item 6. Selected Financial Data in the FY2019 filing and the FY2018 filing.
Item 9A. Controls and Procedures
11 rewritten, 2 added, 1 removed, 12 unchanged
[removed: EVALUATION] [added: EVALUATION] OF DISCLOSURE CONTROLS AND [removed: PROCEDURES][added: PROCEDURES]
As of the end of the period covered by this report, the [removed: management of O’Reilly Automotive, Inc. and Subsidiaries (the “Company”),] [added: Company’s management,] under the supervision and with the participation of its Chief Executive Officer and Chief Financial Officer, evaluated the effectiveness of the design and operation of the Company’s disclosure controls and procedures pursuant to Rule 13a-15(b) and as defined in Rule 13a-15(e) of the Securities Exchange Act of 1934, as amended (the “Exchange Act”).
[removed: CHANGES] [added: CHANGES] IN INTERNAL [removed: CONTROLS][added: CONTROLS]
There were no changes in the Company’s internal control over financial reporting during the fiscal quarter ended December 31, [removed: 2018,] [added: 2019,] that have materially affected, or are reasonably likely to materially affect, the Company’s internal control over financial reporting.
[removed: INTERNAL] [added: INTERNAL] CONTROL OVER FINANCIAL [removed: REPORTING][added: REPORTING]
| [removed: •] [added: ●] | pertain to the maintenance of records that, in reasonable detail, accurately and fairly reflect the transactions and dispositions of the assets of the Company; |
| [removed: •] [added: ●] | provide reasonable assurance that transactions are recorded as necessary to permit preparation of financial statements in accordance with accounting principles generally accepted in the United States of America, and that receipts and expenditures of the Company are being made only in accordance with authorizations of management and directors of the Company; and |
| [removed: •] [added: ●] | provide reasonable assurance regarding prevention or timely detection of unauthorized acquisition, use or disposition of the Company’s assets that could have a material effect on the financial statements. |
Under the supervision and with the participation of the Company’s principal executive officer and principal financial officer, management assessed the effectiveness of the Company’s internal control over financial reporting as of December 31, [removed: 2018.][added: 2019.]
In making this assessment, management used the criteria set forth by the Committee of Sponsoring Organizations of the Treadway Commission in [removed: Internal] [added: _Internal] Control – Integrated [removed: Framework] [added: Framework_] (2013 framework).
Based on this assessment, management believes that as of December 31, [removed: 2018,] [added: 2019,] the Company’s internal control over financial reporting was effective based on those criteria.
As permitted by guidance issued by the Securities and Exchange Commission, management excluded from its assessment of its system of internal control over financial reporting the operations associated with the acquisition of Mayoreo de Autopartes y Aceites, S.A. de C.V. (“Mayasa”), pursuant to a stock purchase agreement, which was completed after the close of business on November 29, 2019.
The acquired operations were included in the consolidated financial statements of the Company, which constituted 2% of total assets as of December 31, 2019, and less than 1% of revenues and less than 1% of net income for the year ended December 31, 2019.
| | |
Item 9B. Other Information
1 rewritten, 0 added, 0 removed, 1 unchanged
[removed: PART III][added: PART III]
Item 10. Directors, Executive Officers and Corporate Governance
6 rewritten, 1 added, 2 removed, 14 unchanged
Certain information required by Part III is incorporated by reference from [removed: O’Reilly Automotive, Inc. and Subsidiaries’ (the “Company”)] [added: the Company’s] Proxy Statement on Schedule 14A for the [removed: 2019] [added: 2020] Annual Meeting of Shareholders (“Proxy Statement”), which will be filed with the Securities and Exchange Commission (the “SEC”) within 120 days of the end of the Company’s most recent fiscal year.
[removed: Directors] [added: _Directors] and [removed: Officers:][added: Officers:_]
[removed: Code] [added: _Code] of [removed: Ethics:][added: Ethics:_]
[removed: Corporate Governance:][added: _Corporate Governance:_]
[removed: Perlman and Ronald Rashkow,] [added: Weiss,] each an independent director in accordance with The Nasdaq Stock Market Marketplace Rule 5605(a)(2), the standards of Rule 10A-3 of the Exchange Act and the requirements of The Nasdaq Stock Market Marketplace Rule 5605(c)(2).
In addition, our Board of Directors has determined that Mr. Hendrickson, [removed: Chairman] [added: Chairperson] of the Audit Committee, qualifies as an audit committee financial expert under Item 407(d)(5) of Regulation S-K.
Perlman and Andrea M.
Section 16(a) of the Securities Exchange Act of 1934, as amended:
The information regarding compliance with Section 16(a) of the Securities Exchange Act of 1934, as amended (the “Exchange Act”), required by Item 405 of Regulation S-K, will be included in the Company’s Proxy Statement under the caption “Section 16(a) Beneficial Ownership Reporting Compliance” and is incorporated herein by reference.
Item 11. Executive Compensation
3 rewritten, 4 added, 0 removed, 1 unchanged
[removed: Director] [added: _Director] and Officer [removed: Compensation:][added: Compensation:_]
The information required by Item 402 of Regulation S-K will be included in [removed: O’Reilly Automotive, Inc. and Subsidiaries’ (the “Company”)] [added: the Company’s] Proxy Statement [removed: on Schedule 14A for the 2019 Annual Meeting of Shareholders (“Proxy Statement”)] under the captions “Compensation of Executive Officers” and “Compensation of Directors” and is incorporated herein by reference.
[removed: Compensation Committee:][added: _Compensation Committee:_]
Item 12.
Security Ownership of Certain Beneficial Owners and Management and Related Stockholder Matters
The information required by Item 201(d) of Regulation S-K will be included in the Company’s Proxy Statement under the caption “Equity Compensation Plans” and is incorporated herein by reference.
The information required by Item 403 of Regulation S-K will be included in the Company’s Proxy Statement under the captions “Security Ownership of Certain Beneficial Owners” and “Security Ownership of Directors and Management” and is incorporated herein by reference.
Item 13. Certain Relationships and Related Transactions, and Director Independence
1 rewritten, 0 added, 0 removed, 1 unchanged
The information required by Item 404 of Regulation S-K will be included in the [removed: O’Reilly Automotive, Inc. and Subsidiaries’ (the “Company”)] [added: Company’s] Proxy Statement [removed: on Schedule 14A for the 2019 Annual Meeting of Shareholders (“Proxy Statement”)] under the caption “Certain Relationships and Related Transactions” and is incorporated herein by reference.
Item 14. Principal Accountant Fees and Services
2 rewritten, 165 added, 0 removed, 0 unchanged
The information required by Item 9(e) of Schedule 14A will be included in [removed: O’Reilly Automotive, Inc. and Subsidiaries’] [added: the Company’s] Proxy Statement [removed: on Schedule 14A for the 2019 Annual Meeting of Shareholders] under the caption “Fees Paid to Independent Registered Public Accounting Firm” and is incorporated herein by reference.
[removed: PART IV][added: PART IV]
Item 15.
Exhibits and Financial Statement Schedules
| (a) | The following documents are filed as part of this Annual Report on Form 10-K: |
| --- | --- |
| | 1. | Financial Statements - O’Reilly Automotive, Inc. and Subsidiaries |
| --- | --- | --- |
The following consolidated financial statements of O’Reilly Automotive, Inc. and Subsidiaries included in the Annual Shareholders’ Report of the registrant for the year ended December 31, 2019, are filed with this Annual Report in Part II, Item 8:
_Management’s Report on Internal Control over Financial Reporting_
_Report of Independent Registered Public Accounting Firm – Internal Control over Financial Reporting_
_Report of Independent Registered Public Accounting Firm – Financial Statements_
_Consolidated Balance Sheets as of December 31, 2019 and 2018_
_Consolidated Statements of Income for the years ended December 31, 2019, 2018 and 2017_
_Consolidated Statements of Comprehensive Income for the years ended December 31, 2019, 2018 and 2017_
_Consolidated Statements of Shareholders’ Equity for the years ended December 31, 2019, 2018 and 2017_
_Consolidated Statements of Cash Flows for the years ended December 31, 2019, 2018 and 2017_
_Notes to Consolidated Financial Statements for the years ended December 31, 2019, 2018 and 2017_
| | 2. | Financial Statement Schedules - O’Reilly Automotive, Inc. and Subsidiaries |
| --- | --- | --- |
The following consolidated financial statement schedule of O’Reilly Automotive, Inc. and Subsidiaries is included in Item 15(a):
_Schedule II - Valuation and qualifying accounts_
All other schedules, for which provision is made in the applicable accounting regulations of the Securities and Exchange Commission, are not required under the related instructions or are inapplicable, and therefore have been omitted.
| | 3. | Exhibits |
| --- | --- | --- |
| | | |
| --- | --- | --- |
| Exhibit No. | | Description |
| | | |
| 3.1 | | [Amended and Restated Articles of Incorporation of the Registrant, filed as Exhibit 3.1 to the Registrant’s Current Report on Form 8-K dated May 9, 2013, is incorporated herein by this reference.](http://www.sec.gov/Archives/edgar/data/898173/000089817313000026/orly-20130507ex31c851abd.htm) |
| 3.2 | | [Amended and Restated Bylaws of the Registrant, filed as Exhibit 3.1 to the Registrant’s Current Report on Form 8-K dated November 29, 2016, is incorporated herein by this reference.](http://www.sec.gov/Archives/edgar/data/898173/000089817316000409/exhibit31.htm) |
| 4.1 | | Form of Stock Certificate for Common Stock, filed as Exhibit 4.1 to the Registration Statement of the Registrant on Form S-1, File No. 33-58948, is incorporated herein by this reference. |
| 4.2 | | [Indenture, dated as of January 14, 2011, by and among O’Reilly Automotive, Inc., the subsidiaries party thereto as guarantors, and UMB Bank, N.A., as Trustee, filed as Exhibit 4.1 to the Registrant’s Current Report on Form 8-K dated January 14, 2011, is incorporated herein by this reference.](http://www.sec.gov/Archives/edgar/data/898173/000119312511008230/dex41.htm) |
| 4.3 | | [Form of 4.875% Note due 2021, included in Exhibit 4.1 to the Registrant’s Current Report on Form 8-K dated January 14, 2011, is incorporated herein by this reference.](http://www.sec.gov/Archives/edgar/data/898173/000119312511008230/dex41.htm) |
| 4.4 | | [Indenture, dated as of September 19, 2011, by and among O’Reilly Automotive, Inc., the subsidiaries party thereto as guarantors, and UMB Bank, N.A., as Trustee, filed as Exhibit 4.1 to the Registrant’s Current Report on Form 8-K dated September 19, 2011, is incorporated herein by this reference.](http://www.sec.gov/Archives/edgar/data/898173/000119312511251369/d233420dex41.htm) |
| 4.5 | | [Form of 4.625% Note due 2021, included in Exhibit 4.1 to the Registrant’s Current Report on Form 8-K dated September 19, 2011, is incorporated herein by this reference.](http://www.sec.gov/Archives/edgar/data/898173/000119312511251369/d233420dex41.htm) |
| | | |
| --- | --- | --- |
| Exhibit No. | | Description |
| | | |
| 4.6 | | [Indenture, dated as of August 21, 2012, by and among O’Reilly Automotive, Inc., the subsidiaries party thereto as guarantors, and UMB Bank, N.A., as Trustee, filed as Exhibit 4.1 to the Registrant’s Current Report on Form 8-K dated August 21, 2012, is incorporated herein by this reference.](http://www.sec.gov/Archives/edgar/data/898173/000119312512363282/d400352dex41.htm) |
| 4.7 | | [Form of 3.800% Note due 2022, included in Exhibit 4.1 to the Registrant’s Current Report on Form 8-K dated August 21, 2012, is incorporated herein by this reference.](http://www.sec.gov/Archives/edgar/data/898173/000119312512363282/d400352dex41.htm) |
An excerpt. Shown here: all 2 rewritten, 40 of 165 added and all 0 removed. The counts are complete. For every sentence, read Item 14. Principal Accountant Fees and Services in the FY2019 filing and the FY2018 filing.
Item 1B. Unresolved Staff Comments
0 rewritten, 0 added, 1 removed, 0 unchanged
Dropped this year
None.
Item 2. Properties
0 rewritten, 0 added, 58 removed, 0 unchanged
Dropped this year
Unless otherwise indicated, “we,” “us,” “our” and similar terms, as well as references to the “Company,” refer to O’Reilly Automotive, Inc. and its subsidiaries.
Distribution centers, stores, and other properties
As of December 31, 2018, we operated 27 regional distribution centers (“DC”s), of which eight were leased (2.8 million operating square footage) and 19 were owned (8.1 million operating square footage) for total DC operating square footage of 10.8 million square feet.
The following table provides information regarding our DCs, returns facility and corporate offices as of December 31, 2018:
| | | | | | | | | | |
| --- | --- | --- | --- | --- | --- | --- | --- | --- | --- |
| | | | | | | | | | |
| Location | | Principal Use(s) | | Operating Square Footage (1) | | | Nature of Occupancy | | Lease Term Expiration |
| Aurora, CO | | Distribution Center | | 321,242 | | | Owned | | |
| Belleville, MI | | Distribution Center | | 333,262 | | | Leased | | 2/28/2025 |
| Billings, MT | | Distribution Center | | 129,142 | | | Leased | | 1/31/2031 |
| Brooklyn Park, MN | | Distribution Center | | 324,668 | | | Owned | | |
| Brownsburg, IN | | Distribution Center | | 657,603 | | | Owned | | |
| Des Moines, IA | | Distribution Center | | 253,886 | | | Owned | | |
| Devens, MA | | Distribution Center | | 511,261 | | | Owned | | |
| Forest Park, GA | | Distribution Center | | 492,350 | | | Leased | | 10/31/2024 |
| Greensboro, NC | | Distribution Center | | 685,230 | | | Owned | | |
| Houston, TX | | Distribution Center | | 532,615 | | | Owned | | |
| Kansas City, MO | | Distribution Center | | 299,018 | | | Owned | | |
| Knoxville, TN | | Distribution Center (to be relocated in 2020) | | 150,766 | | | Owned | | |
| Lakeland, FL | | Distribution Center | | 569,419 | | | Owned | | |
| Lebanon, TN | | Distribution Center (to open in 2020) | | 410,000 | | | Owned | | |
| Lubbock, TX | | Distribution Center | | 276,896 | | | Owned | | |
| Moreno Valley, CA | | Distribution Center | | 547,478 | | | Owned | | |
| Naperville, IL | | Distribution Center | | 499,471 | | | Owned | | |
| Nashville, TN | | Distribution Center (to be relocated in 2020) | | 315,977 | | | Leased | | 12/31/2023 |
| North Little Rock, AR | | Distribution Center | | 122,969 | | | Leased | | 3/31/2022 |
| Oklahoma City, OK | | Distribution Center | | 320,667 | | | Owned | | |
| Phoenix, AZ | | Distribution Center | | 383,570 | | | Leased | | 6/30/2025 |
| Puyallup, WA | | Distribution Center | | 533,790 | | | Owned | | |
| Salt Lake City, UT | | Distribution Center | | 294,932 | | | Owned | | |
| Saraland, AL | | Distribution Center | | 301,068 | | | Leased | | 12/31/2022 |
| Seagoville, TX | | Distribution Center | | 442,000 | | | Owned | | |
| Selma, TX | | Distribution Center | | 552,703 | | | Owned | | |
| Springfield, MO | | Distribution Center | | 266,306 | | | Owned | | |
| Stockton, CA | | Distribution Center | | 720,836 | | | Leased | | 6/30/2035 |
| Twinsburg, OH | | Distribution Center (to open in 2019) | | 405,000 | | | Owned | | |
| Springfield, MO | | Bulk Facility | | 35,200 | | | Owned | | |
| Springfield, MO | | Return/Deconsolidation Facility, Corporate Offices | | 290,580 | | | Owned | | |
| Phoenix, AZ | | Corporate Offices | | 12,327 | | | Leased | | 11/30/2022 |
An excerpt. Shown here: all 0 rewritten, all 0 added and 40 of 58 removed. The counts are complete. For every sentence, read Item 2. Properties in the FY2018 filing.
Item 8. Financial Statements and Supplementary Data
0 rewritten, 0 added, 1,077 removed, 0 unchanged
Dropped this year
| | | | |
| --- | --- | --- | --- |
| | | | |
| Index | | | |
| | | | Page |
| [Management’s Report on Internal Control over Financial Reporting](#s9D18FEBA59DACA6ED1BC55D3C772DA14) | | | [42](#s9D18FEBA59DACA6ED1BC55D3C772DA14) |
| [Report of Independent Registered Public Accounting Firm: Internal Control over Financial Reporting](#s2887A289E6D542AC568B55D3C79FBFAE) | | | [43](#s2887A289E6D542AC568B55D3C79FBFAE) |
| [Report of Independent Registered Public Accounting Firm: Financial Statements](#sA66FD964D2CC9C96E2ED55D3C7C44D40) | | | [44](#sA66FD964D2CC9C96E2ED55D3C7C44D40) |
| [Consolidated Balance Sheets](#s5A36F2EFFEAB60F2AADA55D3B249D996) | | | [45](#s5A36F2EFFEAB60F2AADA55D3B249D996) |
| [Consolidated Statements of Income](#s8BB1B274FC1F03A2291A55D3B29B814A) | | | [46](#s8BB1B274FC1F03A2291A55D3B29B814A) |
| [Consolidated Statements of Shareholders’ Equity](#sF106506D707B3D4FCFF255D3B2D9B473) | | | [47](#sF106506D707B3D4FCFF255D3B2D9B473) |
| [Consolidated Statements of Cash Flows](#sD0D2C30902F27179C5AB55D3B32E6AD0) | | | [48](#sD0D2C30902F27179C5AB55D3B32E6AD0) |
| [Notes to Consolidated Financial Statements](#sD9684D37F2A4F2F8917B55D3C8D2A951) | | | [49](#sD9684D37F2A4F2F8917B55D3C8D2A951) |
MANAGEMENT’S REPORT ON INTERNAL CONTROL OVER FINANCIAL REPORTING
The management of O’Reilly Automotive, Inc. and Subsidiaries (the “Company”), under the supervision and with the participation of the Company’s principal executive officer and principal financial officer and effected by the Company’s Board of Directors, is responsible for establishing and maintaining adequate internal control over financial reporting as defined in Rule 13(a)-15(f) or 15(d)-15(f) under the Securities Exchange Act of 1934, as amended.
The Company’s internal control system is designed to provide reasonable assurance regarding the reliability of financial reporting and the preparation of financial statements for external purposes in accordance with accounting principles generally accepted in the United States.
Internal control over financial reporting includes all policies and procedures that
| | |
| --- | --- |
| • | pertain to the maintenance of records that, in reasonable detail, accurately and fairly reflect the transactions and dispositions of the assets of the Company; |
| | |
| --- | --- |
| • | provide reasonable assurance that transactions are recorded as necessary to permit preparation of financial statements in accordance with accounting principles generally accepted in the United States of America, and that receipts and expenditures of the Company are being made only in accordance with authorizations of management and directors of the Company; and |
| | |
| --- | --- |
| • | provide reasonable assurance regarding prevention or timely detection of unauthorized acquisition, use or disposition of the Company’s assets that could have a material effect on the financial statements. |
Management recognizes that all internal control systems, no matter how well designed, have inherent limitations.
Therefore, even those systems determined to be effective can provide only reasonable assurance with respect to financial statement preparation and presentation.
Also, projections of any evaluation of effectiveness to future periods are subject to risk.
Over time, controls may become inadequate because of changes in conditions or deterioration in the degree of compliance with policies or procedures.
Under the supervision and with the participation of the Company’s principal executive officer and principal financial officer, management assessed the effectiveness of the Company’s internal control over financial reporting as of December 31, 2018.
In making this assessment, management used the criteria set forth by the Committee of Sponsoring Organizations of the Treadway Commission (“COSO”) in Internal Control - Integrated Framework (2013 framework).
Based on this assessment, management believes that as of December 31, 2018, the Company’s internal control over financial reporting is effective based on those criteria.
Ernst & Young LLP, Independent Registered Public Accounting Firm, has audited the Company’s consolidated financial statements and has issued an attestation report on the effectiveness of the Company’s internal control over financial reporting, as stated in their report, which is included herein.
| | | | | |
| --- | --- | --- | --- | --- |
| | | | | |
| /s/ | Gregory D. Johnson | | /s/ | Thomas McFall |
| Gregory D. Johnson | | | Thomas McFall | |
| Chief Executive Officer and | | | Executive Vice President and | |
An excerpt. Shown here: all 0 rewritten, all 0 added and 40 of 1,077 removed. The counts are complete. For every sentence, read Item 8. Financial Statements and Supplementary Data in the FY2018 filing.
Item 12. Security Ownership of Certain Beneficial Owners and Management and Related Stockholder Matters
0 rewritten, 0 added, 2 removed, 0 unchanged
Dropped this year
The information required by Item 201(d) of Regulation S-K will be included in O’Reilly Automotive, Inc. and Subsidiaries’ (the “Company”) Proxy Statement on Schedule 14A for the 2019 Annual Meeting of Shareholders (“Proxy Statement”) under the caption “Equity Compensation Plans” and is incorporated herein by reference.
The information required by Item 403 of Regulation S-K will be included in the Company’s Proxy Statement under the captions “Security Ownership of Certain Beneficial Owners” and “Security Ownership of Directors and Management” and is incorporated herein by reference.
Item 15. Exhibits and Financial Statement Schedules
0 rewritten, 0 added, 112 removed, 0 unchanged
Dropped this year
| | |
| --- | --- |
| (a) | The following documents are filed as part of this Annual Report on Form 10-K: |
| | |
| --- | --- |
| 1. | Financial Statements - O’Reilly Automotive, Inc. and Subsidiaries |
The following consolidated financial statements of O’Reilly Automotive, Inc. and Subsidiaries included in the Annual Shareholders’ Report of the registrant for the year ended December 31, 2018, are filed with this Annual Report in Part II, Item 8:
Management’s Report on Internal Control over Financial Reporting
Report of Independent Registered Public Accounting Firm – Internal Control over Financial Reporting
Report of Independent Registered Public Accounting Firm – Financial Statements
Consolidated Balance Sheets as of December 31, 2018 and 2017
Consolidated Statements of Income for the years ended December 31, 2018, 2017 and 2016
Consolidated Statements of Shareholders’ Equity for the years ended December 31, 2018, 2017 and 2016
Consolidated Statements of Cash Flows for the years ended December 31, 2018, 2017 and 2016
Notes to Consolidated Financial Statements for the years ended December 31, 2018, 2017 and 2016
| | |
| --- | --- |
| 2. | Financial Statement Schedules - O’Reilly Automotive, Inc. and Subsidiaries |
The following consolidated financial statement schedule of O’Reilly Automotive, Inc. and Subsidiaries is included in Item 15(a):
Schedule II - Valuation and qualifying accounts
All other schedules, for which provision is made in the applicable accounting regulations of the Securities and Exchange Commission, are not required under the related instructions or are inapplicable, and therefore have been omitted.
| | |
| --- | --- |
| 3. | Exhibits |
| | |
| --- | --- |
| | |
| Exhibit No. | Description |
| [3.1](http://www.sec.gov/Archives/edgar/data/898173/000089817313000026/orly-20130507ex31c851abd.htm) | [Amended and Restated Articles of Incorporation of the Registrant, filed as Exhibit 3.1 to the Registrant’s Current Report on Form 8-K dated May 9, 2013, is incorporated herein by this reference.](http://www.sec.gov/Archives/edgar/data/898173/000089817313000026/orly-20130507ex31c851abd.htm) |
| [3.2](http://www.sec.gov/Archives/edgar/data/898173/000089817316000409/exhibit31.htm) | [Amended and Restated Bylaws of the Registrant, filed as Exhibit 3.1 to the Registrant’s Current Report on Form 8-K dated November 29, 2016, is incorporated herein by this reference.](http://www.sec.gov/Archives/edgar/data/898173/000089817316000409/exhibit31.htm) |
| 4.1 | Form of Stock Certificate for Common Stock, filed as Exhibit 4.1 to the Registration Statement of the Registrant on Form S-1, File No. 33-58948, is incorporated herein by this reference. |
| [4.2](http://www.sec.gov/Archives/edgar/data/898173/000119312511008230/dex41.htm) | [Indenture, dated as of January 14, 2011, by and among O’Reilly Automotive, Inc., the subsidiaries party thereto as guarantors, and UMB Bank, N.A., as Trustee, filed as Exhibit 4.1 to the Registrant’s Current Report on Form 8-K dated January 14, 2011, is incorporated herein by this reference.](http://www.sec.gov/Archives/edgar/data/898173/000119312511008230/dex41.htm) |
| [4.3](http://www.sec.gov/Archives/edgar/data/898173/000119312511008230/dex41.htm) | [Form of 4.875% Note due 2021, included in Exhibit 4.1 to the Registrant’s Current Report on Form 8-K dated January 14, 2011, is incorporated herein by this reference.](http://www.sec.gov/Archives/edgar/data/898173/000119312511008230/dex41.htm) |
| [4.4](http://www.sec.gov/Archives/edgar/data/898173/000119312511251369/d233420dex41.htm) | [Indenture, dated as of September 19, 2011, by and among O’Reilly Automotive, Inc., the subsidiaries party thereto as guarantors, and UMB Bank, N.A., as Trustee, filed as Exhibit 4.1 to the Registrant’s Current Report on Form 8-K dated September 19, 2011, is incorporated herein by this reference.](http://www.sec.gov/Archives/edgar/data/898173/000119312511251369/d233420dex41.htm) |
| [4.5](http://www.sec.gov/Archives/edgar/data/898173/000119312511251369/d233420dex41.htm) | [Form of 4.625% Note due 2021, included in Exhibit 4.1 to the Registrant’s Current Report on Form 8-K dated September 19, 2011, is incorporated herein by this reference.](http://www.sec.gov/Archives/edgar/data/898173/000119312511251369/d233420dex41.htm) |
| [4.6](http://www.sec.gov/Archives/edgar/data/898173/000119312512363282/d400352dex41.htm) | [Indenture, dated as of August 21, 2012, by and among O’Reilly Automotive, Inc., the subsidiaries party thereto as guarantors, and UMB Bank, N.A., as Trustee, filed as Exhibit 4.1 to the Registrant’s Current Report on Form 8-K dated August 21, 2012, is incorporated herein by this reference.](http://www.sec.gov/Archives/edgar/data/898173/000119312512363282/d400352dex41.htm) |
| [4.7](http://www.sec.gov/Archives/edgar/data/898173/000119312512363282/d400352dex41.htm) | [Form of 3.800% Note due 2022, included in Exhibit 4.1 to the Registrant’s Current Report on Form 8-K dated August 21, 2012, is incorporated herein by this reference.](http://www.sec.gov/Archives/edgar/data/898173/000119312512363282/d400352dex41.htm) |
Exhibits (continued)
| | |
| --- | --- |
An excerpt. Shown here: all 0 rewritten, all 0 added and 40 of 112 removed. The counts are complete. For every sentence, read Item 15. Exhibits and Financial Statement Schedules in the FY2018 filing.
Item 16. Form 10-K Summary
0 rewritten, 0 added, 66 removed, 0 unchanged
Dropped this year
Not applicable.
O’REILLY AUTOMOTIVE, INC. AND SUBSIDIARIES
SCHEDULE II - VALUATION AND QUALIFYING ACCOUNTS
(in thousands)
| | | | | | | | | | | | | | | | | | | | | | |
| --- | --- | --- | --- | --- | --- | --- | --- | --- | --- | --- | --- | --- | --- | --- | --- | --- | --- | --- | --- | --- | --- |
| | | | | | | | | | | | | | | | | | | | | | |
| Description | | Balance at Beginning of Period | | | | Additions - Charged to Costs and Expenses | | | | Additions - Charged to Other Accounts - Describe | | | | Deductions - Describe | | | | | Balance at End of Period | | |
| Allowance for doubtful accounts: | | | | | | | | | | | | | | | | | | | | | |
| For the year ended December 31, 2018 | | $ | 12,717 | | | $ | 9,475 | | | $ | — | | | $ | 8,954 | | (1) | | $ | 13,238 | |
| For the year ended December 31, 2017 | | 12,040 | | | | 8,598 | | | | — | | | | 7,921 | | | (1) | | 12,717 | | |
| For the year ended December 31, 2016 | | $ | 9,637 | | | $ | 9,587 | | | $ | — | | | $ | 7,184 | | (1) | | $ | 12,040 | |
| | |
| --- | --- |
| (1) | Uncollectable accounts written off. |
SIGNATURES
Pursuant to the requirements of Section 13 or 15(d) of the Securities Exchange Act of 1934, as amended, the registrant has duly caused this report to be signed on its behalf by the undersigned, thereunto duly authorized.
| | | | |
| --- | --- | --- | --- |
| | | | |
| | O’REILLY AUTOMOTIVE, INC. | | |
| | (Registrant) | | |
| | | | |
| | Date: | February 27, 2019 | |
| | | | |
| | By: | /s/ | Gregory D. Johnson |
| | | Gregory D. Johnson | |
| | | Chief Executive Officer and | |
| | | Co-President | |
Pursuant to the requirements of the Securities Exchange Act of 1934, as amended, this report has been signed below by the following persons on behalf of the registrant in the capacities and on the dates indicated.
| | | | | | | |
| --- | --- | --- | --- | --- | --- | --- |
| | | | | | | |
| Date: | February 27, 2019 | | | | | |
| | | | | | | |
| | | | | | | |
| | /s/ | David O’Reilly | | /s/ | Larry O’Reilly | |
| | David O’Reilly | | | Larry O’Reilly | | |
| | Director and Chairman of the Board | | | Director and Vice Chairman of the Board | | |
| | | | | | | |
An excerpt. Shown here: all 0 rewritten, all 0 added and 40 of 66 removed. The counts are complete. For every sentence, read Item 16. Form 10-K Summary in the FY2018 filing.