 filings.tools
O'Reilly Automotive 10-K 2020-12-31
Filed 2021-02-26. 15 sections, 355K characters. Original on sec.gov · Markdown · JSON
Cover and table of contents
UNITED STATES
SECURITIES AND EXCHANGE COMMISSION
WASHINGTON, D.C. 20549
FORM 10-K
| | |
|---|---|
| ☒ | ANNUAL REPORT PURSUANT TO SECTION 13 OR 15(d) OF THE SECURITIES EXCHANGE ACT OF 1934 |
For the fiscal year ended December 31, 2020
OR
| | |
|---|---|
| ☐ | TRANSITION REPORT PURSUANT TO SECTION 13 OR 15(d) OF THE SECURITIES EXCHANGE ACT OF 1934 |
For the transition period from to

O’REILLY AUTOMOTIVE, INC.
(Exact name of registrant as specified in its charter)
| | | | | |
|---|---|---|---|---|
| Missouri | 000-21318 | 27-4358837 | ||
| (State or other jurisdiction | | Commission file | | (I.R.S. Employer |
| of incorporation or organization) | | number | | Identification No.) |
233 South Patterson Avenue
Springfield**,** Missouri 65802
(Address of principal executive offices, Zip code)
(417) 862-6708
(Registrant’s telephone number, including area code)
Securities registered pursuant to Section 12(b) of the Act:
| | | | | ||||||
|---|---|---|---|---|---|---|---|---|---|
| Title of Each Class | | Trading Symbol(s) | | Name of Each Exchange on which Registered | |||||
| Common Stock | $0.01 par value | | ORLY | | The NASDAQ Stock Market LLC | ||||
| | | | | | (NASDAQ Global Select Market) |
Securities registered pursuant to Section 12(g) of the Act:
None
Indicate by check mark if the registrant is a well-known seasoned issuer, as defined in Rule 405 of the Securities Act. Yes ☒ No ☐
Indicate by check mark if the registrant is not required to file reports pursuant to Section 13 or Section 15(d) of the Act. Yes ☐ No ☒
Note - Checking the box above will not relieve any registrant required to file reports pursuant to Section 13 or 15(d) of the Exchange Act from their obligations under those Sections.
Indicate by check mark whether the registrant (1) has filed all reports required to be filed by Section 13 or 15(d) of the Securities Exchange Act of 1934 during the preceding 12 months (or for such shorter period that the registrant was required to file such reports), and (2) has been subject to such filing requirements for the past 90 days. Yes ☒ No ☐
Indicate by check mark whether the registrant has submitted electronically every Interactive Data File required to be submitted pursuant to Rule 405 of Regulation S-T during the preceding 12 months (or for such shorter period that the registrant was required to submit such files). Yes ☒ No ☐
Indicate by check mark whether the registrant is a large accelerated filer, an accelerated filer, a non-accelerated filer, a smaller reporting company, or an emerging growth company. See definitions of “large accelerated filer,” “accelerated filer,” “smaller reporting company,” and “emerging growth company” in Rule 12b-2 of the Exchange Act.
| Large accelerated filer ☒ | Accelerated filer ☐ | |
|---|---|---|
| Non-accelerated filer ☐ | | Smaller reporting company ☐ |
| Emerging growth company ☐ | | |
If an emerging growth company, indicate by check mark if the registrant has elected not to use the extended transition period for complying with any new or revised financial accounting standards provided pursuant to Section 13(a) of the Exchange Act. ☐
Indicate by check mark whether the registrant has filed a report on and attestation to its management’s assessment of the effectiveness of its internal control over financial reporting under Section 404(b) of the Sarbanes-Oxley Act (15 U.S.C. 7262(b)) by the registered public accounting firm that prepared or issued its audit report. ☒
Indicate by check mark whether the registrant is a shell company (as defined in Rule 12b-2 of the Exchange Act). Yes ☐ No ☒
At June 30, 2020, the aggregate market value of the voting stock held by non-affiliates of the Company was $25,984,638,678 based on the last price of the common stock reported by The NASDAQ Global Select Market.
At February 22, 2021, an aggregate of 70,206,669 shares of common stock of the registrant were outstanding.
DOCUMENTS INCORPORATED BY REFERENCE
Portions of the definitive proxy statement for the 2021 Annual Meeting of Shareholders to be filed with the Securities and Exchange Commission within 120 days after December 31, 2020, are incorporated by reference into Part III.
O’REILLY AUTOMOTIVE, INC. AND SUBSIDIARIES
FORM 10-K
FOR THE YEAR ENDED DECEMBER 31, 2020
TABLE OF CONTENTS
Forward-Looking Statements
We claim the protection of the safe-harbor for forward-looking statements within the meaning of the Private Securities Litigation Reform Act of 1995. You can identify these statements by forward-looking words such as “estimate,” “may,” “could,” “will,” “believe,” “expect,” “would,” “consider,” “should,” “anticipate,” “project,” “plan,” “intend” or similar words. In addition, statements contained within this annual report that are not historical facts are forward-looking statements, such as statements discussing, among other things, expected growth, store development, integration and expansion strategy, business strategies, future revenues and future performance. These forward-looking statements are based on estimates, projections, beliefs and assumptions and are not guarantees of future events and results. Such statements are subject to risks, uncertainties and assumptions, including, but not limited to, the COVID-19 pandemic or other public health crises, the economy in general, inflation, consumer debt levels, product demand, the market for auto parts, competition, weather, tariffs, terrorist activities, war and the threat of war, risks associated with the performance of acquired businesses, our increased debt levels, credit ratings on public debt, our ability to hire and retain qualified employees, information security and cyber-attacks and governmental regulations. Actual results may materially differ from anticipated results described or implied in these forward-looking statements. Please refer to the “Risk Factors” section in this annual report on Form 10-K for the year ended December 31, 2020, and subsequent Securities and Exchange Commission filings, for additional factors that could materially affect our financial performance. Forward-looking statements speak only as of the date they were made, and we undertake no obligation to publicly update any forward-looking statements, whether as a result of new information, future events or otherwise, except as required by applicable law.
PART I
Item 1. Business
GENERAL INFORMATION
Unless otherwise indicated, “we,” “us,” “our” and similar terms, as well as references to the “Company,” refer to O’Reilly Automotive, Inc. and its Subsidiaries. O’Reilly is one of the largest specialty retailers of automotive aftermarket parts, tools, supplies, equipment and accessories in the United States (“U.S.”), selling our products to both do-it-yourself (“DIY”) and professional service provider customers, our “dual market strategy.” The business was founded in 1957 by Charles F. O’Reilly and his son, Charles H. “Chub’’ O’Reilly, Sr., and initially operated from a single store in Springfield, Missouri. Our common stock has traded on The NASDAQ Global Select Market under the symbol “ORLY” since April 22, 1993.
After the close of business on November 29, 2019, we completed the acquisition of Mayoreo de Autopartes y Aceites, S.A. de C.V. (“Mayasa”), a specialty retailer of automotive aftermarket parts headquartered in Guadalajara, Jalisco, Mexico pursuant to a stock purchase agreement. At the time of the acquisition, Mayasa operated six distribution centers, 21 Orma Autopartes stores and served over 2,000 independent jobber locations in 28 Mexican states.
At December 31, 2020, we operated 5,594 stores in 47 states in the United States and 22 stores in Mexico. Our stores carry an extensive product line, including
| ● | new and remanufactured automotive hard parts and maintenance items, such as alternators, batteries, brake system components, belts, chassis parts, driveline parts, engine parts, fuel pumps, hoses, starters, temperature control, water pumps, antifreeze, appearance products, engine additives, filters, fluids, lighting, oil and wiper blades; and |
|---|
| ● | accessories, such as floor mats, seat covers and truck accessories. |
|---|
Our stores offer many enhanced services and programs to our customers, such as
| ● | battery diagnostic testing; |
|---|
| ● | battery, wiper and bulb replacement; |
|---|
| ● | check engine light code extraction, where allowed by law; |
|---|
| ● | custom hydraulic hoses; |
|---|
| ● | drum and rotor resurfacing; |
|---|
| ● | electrical and module testing; |
|---|
| ● | loaner tool program; |
|---|
| ● | professional paint shop mixing and related materials; and |
|---|
| ● | used oil, oil filter and battery recycling. |
|---|
See the “Risk Factors” section of this annual report on Form 10-K for a description of certain risks relevant to our business. These risk factors include, among others, risk related to the novel coronavirus (“COVID-19”) pandemic, deteriorating economic conditions, competition in the automotive aftermarket business, our sensitivity to regional economic and weather conditions, our relationships with key suppliers and availability of key products, complications in our distribution centers (“DCs”), failure to protect our brand and reputation, risks associated with international operations, unanticipated fluctuations in our quarterly results, the volatility of the market price of our common stock, our increased debt levels, a downgrade in our credit ratings, future growth assurance, our dependence upon key and other personnel, our acquisition strategies, data security and environmental legislation and other regulations.
OUR BUSINESS
Our goal is to continue to achieve growth in sales and profitability by capitalizing on our competitive advantages and executing our growth strategy. We remain confident in our ability to continue to gain market share in our existing markets and grow our business in new markets by focusing on our dual market strategy and the core O’Reilly values, including superior customer service and expense control. Our intent is to be the dominant auto parts provider in all the markets we serve, by providing a higher level of customer service and a better value position than our competitors to both DIY and professional service provider customers.
Competitive Advantages
We believe our effective dual market strategy, superior customer service, technically proficient store personnel, strategic distribution network and experienced management Team make up our key competitive advantages, which cannot be easily duplicated.
Proven Ability to Execute Our Dual Market Strategy:
For more than 40 years, we have established a track record of effectively serving, at a high level, both DIY and professional service provider customers. We believe our proven ability to effectively execute a dual market strategy is a unique competitive advantage. The execution of this strategy enables us to better compete by targeting a larger base of automotive aftermarket parts consumers, capitalizing on our existing store and distribution infrastructure, operating profitably in both large markets and less densely populated geographic areas that typically attract fewer competitors and enhancing service levels offered to DIY customers through the offering of a broad inventory and the extensive product knowledge required by professional service provider customers.
In 2020, we derived approximately 59% of our sales from our DIY customers and approximately 41% of our sales from our professional service provider customers. Over the long-term, we have increased our sales to professional service provider customers at a faster pace than the increase in our sales to DIY customers due to the more fragmented nature of the professional service provider business, which offers a greater opportunity for consolidation. We believe we will continue to have a competitive advantage on the professional service provider portion of our business, due to our systems, knowledge, industry-leading parts availability and experience serving the professional service provider side of the automotive aftermarket, supported by our approximately 765 full-time sales staff dedicated solely to calling upon and servicing the professional service provider customer. We will also continue to expand and enhance the level of offerings focused on growing our DIY business and will continue to execute our proven dual market strategy in both existing and new markets.
Superior Customer Service:
We seek to provide our customers with an efficient and pleasant in-store experience by maintaining attractive stores in convenient locations with a wide selection of automotive products. We believe the satisfaction of DIY and professional service provider customers is substantially dependent upon our ability to provide, in a timely fashion, the specific automotive products needed to complete their repairs. Accordingly, each O’Reilly store carries, or has same or next day availability to, a broad selection of automotive products designed to cover a wide range of vehicle applications. We continuously refine the inventory levels and assortments carried in each of our stores and within our network, based in large part on the sales movement tracked by our inventory control system, market vehicle registration data, failure rates and management’s assessment of the changes and trends in the marketplace. We have no material backorders for the products we sell.
We seek to attract new DIY and professional service provider customers and retain existing customers by offering superior customer service, the key elements of which are identified below:
| ● | superior in-store service through highly-motivated, technically-proficient store personnel (“Professional Parts People”); |
|---|
| ● | an extensive selection and availability of products; |
|---|
| ● | many enhanced service programs, including battery and electrical testing, battery, wiper and bulb replacement and check engine light code extractions; |
|---|
| | ● | attractive stor
Showing the first 8K of 63K characters. Open the full section
Item 1A. Risk Factors
Our future performance is subject to a variety of risks and uncertainties. Although the risks described below are the risks that we believe are material, there may also be risks of which we are currently unaware, or that we currently regard as immaterial based upon the information available to us that later may prove to be material. Interested parties should be aware that the occurrence of the events described in these risk factors, elsewhere in this Form 10-K and in our other filings with the Securities and Exchange Commission could have a material adverse effect on our business, operating results and financial condition. Actual results, therefore, may materially differ from anticipated results described in our forward-looking statements.
RISKS RELATED TO THE COVID-19 PANDEMIC
The ongoing occurrence of COVID-19, or any other such widespread public health crisis, could have a material adverse effect on our business, results of operations, financial condition and cash flows.
The outbreak of the COVID-19 pandemic and its global spread, including in the U.S., has had a significant impact on the U.S. and world economies. The public health concerns resulting from the pandemic have created significant uncertainty, economic disruption and volatility, all of which have impacted and may continue to impact our business. We may be required to take significant actions to mitigate any adverse impact of the COVID-19 pandemic, including, but not limited to, reduced staffing and increased expenses. We are unable to predict the ongoing short-term and long-term impact of the COVID-19 pandemic on our business, results of operations, financial condition and cash flows due to several factors beyond our control, including, but not limited to:
| ● | the severity and duration of the pandemic, including additional outbreaks, new strands of the virus and availability of effective medical treatments and vaccines for COVID-19; |
|---|
| ● | the continued response of both governmental and nongovernmental authorities, including, but not limited to, stay at home orders or quarantine, restrictions on our operations, such as requiring a reduction in store operating hours or the temporary closure of stores, distributions centers and other facilities, complex and changing regulations and guidance regarding the safety of employees and customers, inconsistent application of COVID-19 orders and regulations, unemployment compensation and economic stimulus; |
|---|
| ● | the impact of the pandemic on consumer confidence and macroeconomic factors such as unemployment and work force availability, as well as industry specific demand drivers such as the number of U.S. miles driven, which could impact demand for our product; |
|---|
| ● | temporary or long-term disruption in our supply network from local and international suppliers and/or delays in the delivery of our inventory; |
|---|
| ● | volatility in the U.S. and global financial markets, including global debt and equity markets; |
|---|
| ● | the impact of regulatory and legislative changes in liability for workers’ compensation; and |
|---|
| ● | the impact of litigation, investigations or claims from customers, Team Members, suppliers, regulators or other third parties relating to the COVID-19 pandemic or our actions in response thereto, including any reputational harm. |
|---|
The above factors and uncertainties, in addition to others we are not currently aware of, may result in adverse impacts to our business, results of operations, financial condition and cash flows.
RISKS SPECIFIC TO OUR BUSINESS AND INDUSTRY
Deteriorating economic conditions may adversely impact demand for our products, reduce access to credit and cause our customers and others, with which we do business, to suffer financial hardship, all of which could adversely impact our business, results of operations, financial condition and cash flows.
Although demand for many of our products is primarily non-discretionary in nature and tend to be purchased by consumers out of necessity, rather than on an impulse basis, our sales are impacted by constraints on the economic health of our customers. The economic health of our customers is affected by many factors, including, among others, general business conditions, interest rates, inflation, consumer debt levels, the availability of consumer credit, currency exchange rates, taxation, fuel prices, unemployment levels and other matters that influence consumer confidence and spending, such as a prolonged public health crisis or pandemic, such as the COVID-19 pandemic. Many of these factors are outside of our control. Our customers’ purchases, including purchases of our products, could decline during periods when income is lower, when prices increase in response to rising costs, or in periods of actual or perceived unfavorable economic conditions or political uncertainty. If any of these events occur, or if unfavorable economic conditions challenge the consumer environment, our business, results of operations, financial condition and cash flows could be adversely affected.
Overall demand for products sold in the automotive aftermarket is dependent upon many factors including the total number of vehicle miles driven in the U.S., the total number of registered vehicles in the U.S., the age and quality of these registered vehicles and the level of unemployment in the U.S. Changes in vehicle technology used by the original equipment manufacturers (“OEM”) on future vehicles, including but not limited to electric, hybrid and internal combustion engines, may result in less frequent repairs, parts lasting longer or elimination of certain repairs. In addition, restrictions on access to telematics, diagnostic tools and repair information imposed by the OEMs or by governmental regulations may force vehicle owners to rely on dealers to perform maintenance and repairs. Adverse changes in these factors could lead to a decreased level of demand for our products, which could negatively impact our business, results of operations, financial condition and cash flows.
In addition, economic conditions, including decreased access to credit, may result in financial difficulties leading to restructurings, bankruptcies, liquidations and other unfavorable events for our customers, suppliers, logistics and other service providers and financial institutions that are counterparties to our credit facilities. Furthermore, the ability of these third parties to overcome these difficulties may increase. If third parties, on whom we rely for merchandise, are unable to overcome difficulties resulting from the deterioration in economic conditions, the cause of which could include a prolonged public health crisis or pandemic, such as the COVID-19 pandemic, and provide us with the merchandise we need, or if counterparties to our credit facilities do not perform their obligations, our business, results of operations, financial condition and cash flows could be adversely affected.
The automotive aftermarket business is highly competitive, and we may have to risk our capital to remain competitive, all of which could adversely impact our business, results of operations, financial condition and cash flows.
Both the DIY and professional service provider portions of our business are highly competitive, particularly in the more densely populated areas that we serve. Some of our competitors are larger than we are and have greater financial resources. In addition, some of our competitors are smaller than we are, but have a greater presence than we do in a particular market. Online and mobile platforms may allow customers to quickly compare prices and product assortments between us and a range of competitors, which could result in pricing pressure. Some online competitors may have a lower cost structure than we do, as a result of our strategy of providing an exceptional in-store experience and superior parts availability supported by our extensive store network and robust, regional distribution footprint, which could also create pricing pressure. We may have to expend more resources and risk additional capital to remain competitive and our results of operations, financial condition and cash flows could be adversely affected. For a list of our principal competitors, see the “Competition” section of Item 1 of this annual report on Form 10-K.
We are sensitive to regional economic and weather conditions that could impact our costs and sales.
Our business is sensitive to national and regional economic and weather conditions and natural disasters. Unusually inclement weather, such as significant rain, snow, sleet, freezing rain, flooding, seismic activity and hurricanes, has historically discouraged our customers from visiting our stores during the affected period and reduced our sales, particularly to DIY customers. Extreme weather conditions, such as extreme heat and extreme cold temperatures, may enhance demand for our products due to increased failure rates of our customers’ automotive parts, while temperate weather conditions may have a lesser impact on failure rates of automotive parts. In addition, our stores and DCs located in coastal regions may be subject to increased insurance claims resulting from regional weather conditions and our results of operations, financial condition and cash flows could be adversely affected.
A change in the relationship with any of our key suppliers, the unavailability of our key products at competitive prices or changes in trade policies could affect our financial health.
Our business depends on developing and maintaining close relationships with our suppliers and on our suppliers’ ability or willingness to sell quality products to us at favorable prices and terms. Many factors outside of our control may harm these relationships and the ability or willingness of these suppliers to sell us products on favorable terms. For example, financial or operational difficulties that our suppliers may face could increase the cost of the products we purchase from them or our ability to source products from them. In addition, the trend toward consolidation among automotive parts suppliers, as well as the off-shoring of manufacturing capacity to foreign countries, may disrupt or end our relationship with some suppliers and could lead to less competition and result in higher prices. We could also be negatively impacted by suppliers who might experience work stoppages, labor strikes, a prolonged public health crisis or pandemic, such as the COVID-19 pandemic, or other interruptions to, or difficulties in the, manufacture or supply of the products we purchase from them. Changes in U.S. trade policies, practices, tariffs or taxes could affect our ability and our suppliers’ ability to source product at current volumes and/or prices.
Business interruptions in our distribution centers or other facilities may affect our store hours, stability of our computer systems, and/or availability and distribution of merchandise, which may affect our business.
Weather, terrorist activities, war or other disasters, or the threat of them, may result in the closure of one or more of our DCs or other facilities, or may adversely affect our ability to deliver inventory to our stores on a nightly basis. This may affect our ability to timely provide products to our customers, resulting in lost sales or a potential loss of customer loyalty. Some of our merchandise is imported from other countries and these goods could become difficult or impossible to bring into the United States, and we may not be able to obtain such merchandise from other sources at similar prices. Such a disruption in revenue could potentially have a negative impact on our results of operations, financial condition and cash flows.
We rely extensively on our computer systems to manage inventory, process transactions and timely provide products to our customers. Our systems are subject to damage or interruption from power outages, telecommunications failures, computer viruses, security breaches or other catastrophic events. If our systems are damaged or fail to function properly, we may experience loss of critical data and interruptions or delays in our ability to manage inventories or process customer transactions. Such a disruption of our systems could negatively impact revenue and potentially have a negative impact on our results of operations, financial condition and cash flows.
Failure to protect our brand and reputation could have a material adverse effect on our brand name, business, results of operations, financial condition and cash flows.
We believe our Company has built an excellent reputation as a leading retailer in the automotive aftermarket industry. We believe our continued success depends, in part, on our ability to preserve, grow and leverage the value of our brand. Our reputation is based, in part, on perceptions of subjective qualities; negative publicity involving the Company, our merchandise or our industry in general that erode customer trust or confidence could adversely affect our reputation and business. Failure to comply with ethical, social, product, labor, health and safety, accounting or environmental standards, or existing or future laws or regulations could also jeopardize our reputation and potentially lead to various adverse actions from consumer or environmental groups, employees or regulatory bodies, which could require us to incur substantial legal fees and costs. In addition, negative claims or publicity, including the availability of information and opinions on social media, as its impact is immediate, could adversely affect our reputation. The opportunity for the rapid dissemination of information, including inaccurate and inflammatory information and opinions, is virtually limitless and easily accessible. Damage to our reputation or loss of consumer confidence for any of these or other reasons could have an adverse effect on our business, results of operations, financial condition or cash flows, as well as require additional resources to rebuild our reputation.
Risks associated with international operations could result in additional costs and inefficiencies.
In addition to many of the risks we face in our U.S. operations, international operations present a unique set of risks and challenges, including local laws and customs, U.S. laws applicable to foreign operations and political and socio-economic conditions. Our ability to operate effectively and grow in international markets could be impacted by these risks resulting in legal liabilities, additional costs and the distraction of management’s attention. Compliance with the Foreign Corrupt Practices Act and protection of intellectual property rights surrounding items such as tradenames and trademarks in foreign jurisdictions can pose significant challenges.
In addition, our operations in international markets are conducted primarily in the local currency of those countries. Given that our Consolidated Financial Statements are denominated in U.S. dollars, amounts of assets, liabilities, net sales and other revenues and expenses denominated in local currencies must be translated into U.S. dollars using exchange rates for the current period. As a result, foreign currency exchange rates and fluctuations in those rates may adversely impact our financial performance.
RISKS RELATED TO OUR COMMON STOCK
Risks related to us and unanticipated fluctuations in our quarterly operating results could affect our stock price.
We believe that quarter-to-quarter comparisons of our financial results are not necessarily meaningful indicators of our future operating results and should not be relied on as an indication of future performance. If our quarterly operating results fail to meet the expectations of analysts, the trading price of our common stock could be negatively affected. We cannot be certain that our growth plans and business strategies will be successful or that they will successfully meet the expectations of these analysts. If we fail to adequately address any of these risks or difficulties, our stock price would likely suffer.
The market price of our common stock may be volatile and could expose us to securities class action litigation.
The stock market and the price of our common stock may be subject to wide fluctuations based upon general economic and market conditions and potentially being targeted through the selling and buying of our common stock by a group of individuals, whose interests and reasoning behind such actions may not align with an average market participant. The market price of our common stock may also be affected by our ability to meet analysts’ expectations and failure to meet such expectations, even slightly, could have an adverse effect on the market price of our common stock.
In addition, stock market volatility has had a significant effect on the market prices of securities issued by many companies for reasons unrelated to the operating performance of these companies. Downturns in the stock market may cause the price of our common stock to decline. In the past, following periods of volatility in the market price of a company’s securities, securities class action litigation has often been initiated against such companies. If similar litigation were initiated against us, it could result in substantial costs and a diversion of our management’s attention and resources, which could have an adverse effect on our business.
RISKS RELATED TO OUR INDEBTEDNESS AND FINANCING
Our debt levels could adversely affect our cash flow and prevent us from fulfilling our obligations.
We have an unsecured revolving credit facility and unsecured senior notes, which could have important consequences to our financial health. For example, our level of indebtedness could, among other things,
| ● | make it more difficult to satisfy our financial obligations, including those relating to the senior unsecured notes and our credit facility; |
|---|
| ● | increase our vulnerability to adverse economic and industry conditions; |
|---|
| ● | limit our flexibility in planning for, or reacting to, changes and opportunities in our industry, which may place us at a competitive disadvantage; |
|---|
| ● | require us to dedicate a substantial portion of our cash flows to service the principal and interest on the debt, reducing the funds available for other business purposes, such as working capital, capital expenditures or other cash requirements; |
|---|
| ● | limit our ability to incur additional debt with acceptable terms, if at all; and |
|---|
| ● | expose us to fluctuations in interest rates, including changes that may result from the implementation of new benchmark rates that replace LIBOR. |
|---|
In addition, the terms of our financing obligations include restrictions, such as affirmative, negative and financial covenants, conditions on borrowing and subsidiary guarantees. A failure to comply with these restrictions could result in a default under our financing obligations or could require us to obtain waivers from our lenders for failure to comply with these restrictions. The occurrence of a default that remains uncured or the inability to secure a necessary consent or waiver could have a material adverse effect on our business, financial condition, results of operations and cash flows.
A downgrade in our credit rating would impact our cost of capital and could impact the market value of our unsecured senior notes, as well as limit our access to attractive supplier financing programs.
Credit ratings are an important component of our cost of capital. These ratings are based upon, among other factors, our financial strength. Our current credit ratings provide us with the ability to borrow funds at favorable rates. A downgrade in our current credit rating from either rating agency could adversely affect our cost of capital by causing us to pay a higher interest rate on borrowed funds under our unsecured revolving credit facility and a higher facility fee on commitments under our unsecured revolving credit facility. A downgrade in our current credit rating could also adversely affect the market price and/or liquidity of our unsecured senior notes, preventing a holder from selling the unsecured senior notes at a favorable price, as well as adversely affect our ability to issue new notes in the future. In addition, a downgrade in our current credit rating could limit the financial institutions willing to commit funds to our supplier financing programs at attractive rates. Decreased participation in our supplier financing programs would lead to an increase in working capital needed to operate the business, adversely affecting our cash flows.
GENERAL RISKS
We cannot assure future growth will be achieved.
We believe that our ability to open additional, profitable stores at a high growth rate will be a significant factor in achieving our growth objectives for the future. Our ability to accomplish our growth objectives is dependent, in part, on matters beyond our control, such as weather conditions, zoning and other issues related to new store site development, the availability of qualified management personnel and general business and economic conditions. We cannot be sure that our growth plans for 2021 and beyond will be achieved. Failure to achieve our growth objectives may negatively impact the trading price of our common stock. For a discussion of our growth strategies, see the “Growth Strategy” section of Item 1 of this annual report on Form 10-K.
In order to be successful, we will need to retain and motivate key employees.
Our success has been largely dependent on the efforts of certain key personnel. In order to be successful, we will need to retain and motivate executives and other key employees. Experienced management and technical personnel are in high demand and competition for their talents is intense. We must also continue to motivate employees and keep them focused on our strategies and goals. Our business, results of operations and cash flows could be materially adversely affected by the unexpected loss of the services of one or more of our key employees. We cannot be sure that we will be able to continue to attract qualified personnel, which could cause us to be less efficient and, as a result, may adversely impact our sales and profitability. For a discussion of our management, see the “Business” section of Item 1 of this annual report on Form 10-K.
Risks associated with future acquisitions may not lead to expected growth and could result in increased costs and inefficiencies.
We expect to continue to make acquisitions as an element of our growth strategy. Acquisitions involve certain risks that could cause our actual growth and profitability to differ from our expectations. Examples of such risks include the following:
| ● | We may not be able to continue to identify suitable acquisition targets or to acquire additional companies at favorable prices or on other favorable terms. |
|---|
| ● | Our management’s attention may be distracted. |
|---|
| ● | We may fail to retain key personnel from acquired businesses. |
|---|
| ● | We may assume unanticipated legal liabilities and other problems. |
|---|
| ● | We may not be able to successfully integrate the operations (accounting and billing functions, for example) of businesses we acquire to realize economic, operational and other benefits. |
|---|
We may fail, or be unable to, discover liabilities of businesses that we acquire for which we or the subsequent owner or operator may be liable.
A breach of customer, supplier, Team Member or Company information could damage our reputation or result in substantial additional costs or possible litigation.
Our business involves the storage of information about our customers, suppliers, Team Members and the Company, some of which is entrusted to third-party service providers and vendors. We and our third-party service providers and vendors have taken reasonable and appropriate steps to protect this information; however, these security measures may be breached due to cyber-attacks, Team Member error, system compromises, fraud, hacking or other intentional or unintentional acts, which could result in unauthorized parties gaining access to such information. The methods used to obtain unauthorized access are constantly evolving and may be difficult to anticipate or detect for long periods of time. If we experience a significant data security breach, we could be exposed to damage to our reputation, additional costs, lost sales, litigation or possible regulatory action. In addition, the regulatory environment related to information security and privacy is constantly evolving, and compliance with those requirements could result in additional costs. There is no guarantee that the procedures that we and our third-party service providers and vendors have implemented to protect against unauthorized access to secured data are adequate to safeguard against all data security breaches, and such a breach could potentially have a negative impact on our results of operations, financial condition and cash flows.
Litigation, governmental proceedings, environmental legislation and regulations and employment legislation and regulations may affect our business, financial condition, results of operations and cash flows.
We are, and in the future may become, involved in lawsuits, regulatory inquiries and governmental and other legal proceedings, arising out of the ordinary course of our business. The damages sought against us in some of these litigation proceedings may be material and may adversely affect our business, results of operations, financial condition and cash flows.
Environmental legislation and regulations, like the initiatives to limit greenhouse gas emissions and bills related to climate change, could adversely impact all industries. While it is uncertain whether these initiatives will become law, additional climate change related mandates could potentially be forthcoming and these matters, if enacted, could adversely impact our costs, by, among other things, increasing fuel prices.
Our business is subject to employment legislation and regulations, including requirements related to minimum wage. Our success depends, in part, on our ability to manage operating costs and identify opportunities to reduce costs. Our ability to meet labor needs, while controlling costs is subject to external factors, such as minimum wage legislation. A violation of, or change in, employment legislation and/or regulations could hinder our ability to control costs, which could have a material adverse effect on our business, results of operations, financial condition and cash flows.
Item 1B. Unresolved Staff Comments
None.
Item 2. Properties
Stores, distribution centers and other properties:
Of the 5,616 stores we operated at December 31, 2020, 2,325 stores were owned, 3,220 stores were leased from unaffiliated parties, 22 of which were located in Mexico, and 71 stores were leased from entities that include one or more of our affiliated directors or members of their immediate family. Leases with unaffiliated parties generally provide for payment of a fixed base rent, payment of certain tax, insurance and maintenance expenses and an original term of, at a minimum, 10 years, subject to one or more renewals at our option. We have entered into separate master lease agreements with each of the affiliated entities for the occupancy of the stores covered thereby. Such master lease agreements with two of the five affiliated entities have been modified to extend the term of the lease agreement for specific stores. The master lease agreements or modifications thereto expire on dates ranging from June 30, 2021, to November 1, 2035. We believe that the lease agreements with the affiliated entities are on terms comparable to those obtainable from third parties.
The following table provides information regarding our U.S. domestic regional DCs in operation as of December 31, 2020:
| | | | | | | |
|---|---|---|---|---|---|---|
| | | | | | Operating Square Footage (1) | |
| Principal Use | | Nature of Occupancy | | Number of Locations | | (in thousands) |
| Distribution center | | Owned | | 21 | 9,161 | |
| Distribution center | | Leased (2) | | 7 | 2,483 | |
| Total | | | | 28 | 11,644 |
| (1) | DC operating square footage includes floor and mezzanine operating square footage and excludes subleased square footage. |
|---|
| (2) | Terms expiring on dates ranging from March 31, 2022, to June 30, 2035. |
|---|
In addition, we operate six small distribution centers in Mexico; these distribution centers do not serve U.S. stores and are immaterial in the aggregate. In 2020, we relocated our Nashville, Tennessee, DC into a larger facility in Lebanon, Tennessee, providing a larger, more efficient facility that serves both markets in March 2020. The existing store portion of the Nashville, Tennessee, DC facility remained a large Hub that continues to provide same day parts availability in the attractive Nashville market. The distribution operations of our Knoxville, Tennessee, DC are in the process of being merged into our Lebanon, Tennessee, DC, which is expected to be completed in 2021, and the existing store portion of our Knoxville, Tennessee, DC facility will remain a large Hub that will continue to provide same day parts availability in the Knoxville market. Additionally, we plan to merge our North Little Rock, Arkansas, DC into our new Horn Lake, Mississippi, DC, which we expect to open in mid-2021. At that time, the existing store portion of our North Little Rock, Arkansas, DC facility will remain a large Hub that will continue to provide same day parts availability in the Little Rock market.
We believe that our present facilities are in good condition, are sufficiently insured and are adequate for the conduct of our current operations. The store servicing capability of our 28 existing U.S. DCs is approximately 6,180 stores, providing a growth capacity of more than 585 U.S. stores, which will increase by approximately 150 net, stores with the completion of our Horn Lake, Mississippi, DC and the conversion of our North Little Rock, Arkansas, DC into a Hub facility in 2021. We believe the growth capacity in our DCs, along with the additional capacity of our new Horn Lake, Mississippi, DC, will provide us with the DC infrastructure needed for near-term expansion. However, as we expand our geographic footprint, we will continue to evaluate our existing distribution system infrastructure and will adjust our distribution system capacity as needed to support our future growth.
Our corporate office operations occur primarily in Springfield, Missouri, and as of December 31, 2020, the total square footage was 0.6 million square feet, substantially all of which was owned.
Item 3. Legal Proceedings
The Company is currently involved in litigation incidental to the ordinary conduct of the Company’s business. The Company accrues for litigation losses in instances where a material adverse outcome is probable and the Company is able to reasonably estimate the probable loss. The Company accrues for an estimate of material legal costs to be incurred in pending litigation matters. Although the Company cannot ascertain the amount of liability that it may incur from any of these matters, it does not currently believe that, in the aggregate, these matters, taking into account applicable insurance and accruals, will have a material adverse effect on its consolidated financial position, results of operations or cash flows in a particular quarter or annual period.
Item 4. Mine Safety Disclosures
Not applicable.
PART II
Item 5. Market for Registrant’s Common Equity, Related Stockholder Matters and Issuer Purchases of Equity Securities
Common stock:
Shares of the Company’s common stock are traded on The NASDAQ Global Select Market (“Nasdaq”) under the symbol “ORLY.” The Company’s common stock began trading on April 22, 1993; no cash dividends have been declared since that time, and the Company does not anticipate paying any cash dividends in the foreseeable future.
As of February 18, 2021, the Company had approximately 420,000 shareholders of common stock based on the number of holders of record and an estimate of individual participants represented by security position listings.
Sales of unregistered securities:
There were no sales of unregistered securities during the year ended December 31, 2020.
Issuer purchases of equity securities:
The following table identifies all repurchases during the fourth quarter ended December 31, 2020, of any of the Company’s securities registered under Section 12 of the Securities Exchange Act of 1934, as amended, by or on behalf of the Company or any affiliated purchaser (in thousands, except per share data):
| | | | | | | | | | | |
|---|---|---|---|---|---|---|---|---|---|---|
| | | | | Total Number of | Maximum Dollar Value | |||||
| | | Total | | Average | | Shares Purchased as | | of Shares that May Yet | ||
| | | Number of | | Price Paid | | Part of Publicly | | Be Purchased Under the | ||
| Period | | Shares Purchased | | per Share | | Announced Programs | | Programs (1) | ||
| October 1, 2020, to October 31, 2020 | 779 | | $ | 457.71 | 779 | | $ | 1,118,244 | ||
| November 1, 2020, to November 30, 2020 | 714 | | 449.32 | 714 | | 797,226 | ||||
| December 1, 2020, to December 31, 2020 | 705 | | 448.08 | 705 | | $ | 481,538 | |||
| Total as of December 31, 2020 | 2,198 | | $ | 451.90 | 2,198 | |
| (1) | Under the Company’s share repurchase program, as approved by its Board of Directors on January 11, 2011, the Company may, from time to time, repurchase shares of its common stock, solely through open market purchases effected through a broker dealer at prevailing market prices, based on a variety of factors such as price, corporate trading policy requirements and overall market conditions not to exceed a dollar limit authorized by the Board of Directors. The Company’s Board of Directors may increase or otherwise modify, renew, suspend or terminate the share repurchase program at any time, without prior notice. As announced on February 5, 2020, October 28, 2020, and February 10, 2021, the Company’s Board of Directors each time approved a resolution to increase the authorization amount under the share repurchase program by an additional $1.0 billion, resulting in a cumulative authorization amount of $15.8 billion. Each additional authorization is effective for a three–year period, beginning on its respective announcement date. The authorizations under the share repurchase program that currently have capacity are scheduled to expire on October 28, 2023 and February 10, 2024. No other share repurchase programs existed during the twelve months ended December 31, 2020. |
|---|
The Company repurchased a total of 4.8 million shares of its common stock under its publicly announced share repurchase program during the year ended December 31, 2020, at an average price per share of $431.93, for a total investment of $2.1 billion. Subsequent to the end of the year and through February 26, 2021, the Company repurchased an additional 1.1 million shares of its common stock, at an average price per share of $447.49, for a total investment of $478.4 million. The Company has repurchased a total of 82.1 million shares of its common stock under its share repurchase program since the inception of the program in January of 2011 and through February 26, 2021, at an average price of $179.65, for a total aggregate investment of $14.7 billion.
Stock performance graph:
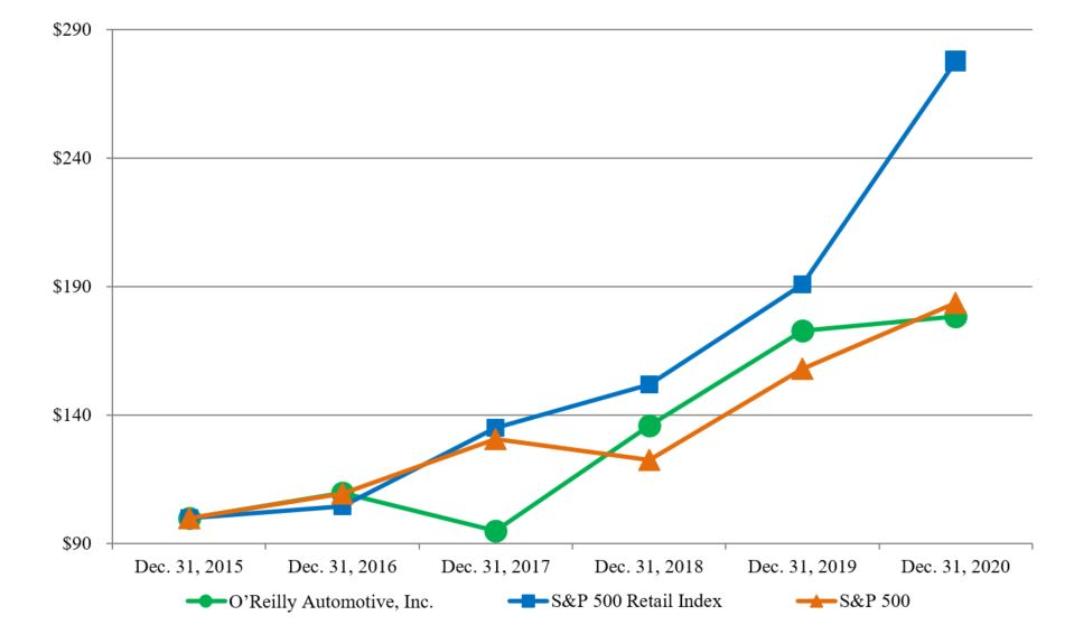
The graph below shows the cumulative total shareholder return assuming the investment of $100, on December 31, 2015, and the reinvestment of dividends thereafter, if any, in the Company’s common stock versus the Standard and Poor’s S&P 500 Retail Index (“S&P 500 Retail Index”) and the Standard and Poor’s S&P 500 Index (“S&P 500”).
| | | | | | | | | | | | | | | | | | | |
|---|---|---|---|---|---|---|---|---|---|---|---|---|---|---|---|---|---|---|
| | | December 31, | ||||||||||||||||
| Company/Index | 2015 | 2016 | 2017 | 2018 | 2019 | 2020 | ||||||||||||
| O’Reilly Automotive, Inc. | | $ | 100 | | $ | 110 | | $ | 95 | | $ | 136 | | $ | 173 | | $ | 179 |
| S&P 500 Retail Index | | 100 | | 105 | | 135 | | 152 | | 191 | | 278 | ||||||
| S&P 500 | | $ | 100 | | $ | 110 | | $ | 131 | | $ | 123 | | $ | 158 | | $ | 184 |
Item 6. Selected Financial Data
The table below compares the “Company’s selected financial data over a ten-year period:
| | | | | | | | | | | | | | | | | | | | | | |
|---|---|---|---|---|---|---|---|---|---|---|---|---|---|---|---|---|---|---|---|---|---|
| Years ended December 31, | 2020 | 2019 | 2018 | 2017 | 2016 | 2015 | 2014 | 2013 | 2012 | 2011 | |||||||||||
| (In thousands, except per share, Team Members, stores and ratio data) | |||||||||||||||||||||
| | | | | | | | | | | | | | | | | | | | | | |
| INCOME STATEMENT DATA: | |||||||||||||||||||||
| | | | | | | | | | | | | | | | | | | | | | |
| Sales ($) | 11,604,493 | 10,149,985 | 9,536,428 | 8,977,726 | 8,593,096 | 7,966,674 | 7,216,081 | 6,649,237 | 6,182,184 | 5,788,816 | |||||||||||
| Cost of goods sold, including warehouse and distribution expenses | 5,518,801 | 4,755,294 | 4,496,462 | 4,257,043 | 4,084,085 | 3,804,031 | 3,507,180 | 3,280,236 | 3,084,766 | 2,951,467 | |||||||||||
| Gross profit | 6,085,692 | 5,394,691 | 5,039,966 | 4,720,683 | 4,509,011 | 4,162,643 | 3,708,901 | 3,369,001 | 3,097,418 | 2,837,349 | |||||||||||
| Selling, general and administrative expenses | 3,666,356 | 3,473,965 | 3,224,782 | 2,995,283 | 2,809,805 | 2,648,622 | 2,438,527 | 2,265,516 | 2,120,025 | 1,973,381 | |||||||||||
| Former CSK officer clawback | — | — | — | — | — | — | — | — | — | (2,798) | |||||||||||
| Operating income | 2,419,336 | 1,920,726 | 1,815,184 | 1,725,400 | 1,699,206 | 1,514,021 | 1,270,374 | 1,103,485 | 977,393 | 866,766 | |||||||||||
| Write-off of asset-based revolving credit agreement debt issuance costs | — | — | — | — | — | — | — | — | — | (21,626) | |||||||||||
| Termination of interest rate swap agreements | — | — | — | — | — | — | — | — | — | (4,237) | |||||||||||
| Other income (expense), net | (152,931) | (130,397) | (121,097) | (87,596) | (62,015) | (53,655) | (48,192) | (44,543) | (35,872) | (25,130) | |||||||||||
| Total other income (expense) | (152,931) | (130,397) | (121,097) | (87,596) | (62,015) | (53,655) | (48,192) | (44,543) | (35,872) | (50,993) | |||||||||||
| Income before income taxes | 2,266,405 | 1,790,329 | 1,694,087 | 1,637,804 | 1,637,191 | 1,460,366 | 1,222,182 | 1,058,942 | 941,521 | 815,773 | |||||||||||
| Provision for income taxes (a)(b) | 514,103 | 399,287 | 369,600 | 504,000 | 599,500 | 529,150 | 444,000 | 388,650 | 355,775 | 308,100 | |||||||||||
| Net income ($) (a)(b) | 1,752,302 | 1,391,042 | 1,324,487 | 1,133,804 | 1,037,691 | 931,216 | 778,182 | 670,292 | 585,746 | 507,673 | |||||||||||
| | | | | | | | | | | | | | | | | | | | | | |
| Basic earnings per common share: | |||||||||||||||||||||
| Earnings per share – basic ($) | 23.74 | 18.07 | 16.27 | 12.82 | 10.87 | 9.32 | 7.46 | 6.14 | 4.83 | 3.77 | |||||||||||
| Weighted-average common shares outstanding – basic | 73,817 | 76,985 | 81,406 | 88,426 | 95,447 | 99,965 | 104,262 | 109,244 | 121,182 | 134,667 | |||||||||||
| | | | | | | | | | | | | | | | | | | | | | |
| Earnings per common share -assuming dilution: (a)(b) | |||||||||||||||||||||
| Earnings per share – assuming dilution ($) | 23.53 | 17.88 | 16.10 | 12.67 | 10.73 | 9.17 | 7.34 | 6.03 | 4.75 | 3.71 | |||||||||||
| Weighted-average common shares outstanding – assuming dilution | 74,462 | 77,788 | 82,280 | 89,502 | 96,720 | 101,514 | 106,041 | 111,101 | 123,314 | 136,983 | |||||||||||
| | | | | | | | | | | | | | | | | | | | | | |
| SELECTED OPERATING DATA: | |||||||||||||||||||||
| | | | | | | | | | | | | | | | | | | | | | |
| Number of Team Members at year end (c) | 76,257 | 81,223 | 78,882 | 75,552 | 74,580 | 71,621 | 67,569 | 61,909 | 53,063 | 49,324 | |||||||||||
| Total number of stores at year end (d)(e) | 5,616 | 5,460 | 5,219 | 5,019 | 4,829 | 4,571 | 4,366 | 4,166 | 3,976 | 3,740 | |||||||||||
| Number of U.S. stores at year end (d) | | 5,594 | 5,439 | 5,219 | 5,019 | 4,829 | 4,571 | 4,366 | 4,166 | 3,976 | 3,740 | ||||||||||
| Number of Mexico stores at year end (e) | | 22 | 21 | — | — | — | — | — | — | — | — | ||||||||||
| Store square footage at year end (c)(f) | | 41,668 | 40,227 | 38,455 | 36,685 | 35,123 | 33,148 | 31,591 | 30,077 | 28,628 | 26,530 | ||||||||||
| Sales per weighted-average store ($) (c)(g) | 2,057 | 1,881 | 1,842 | 1,807 | 1,826 | 1,769 | 1,678 | 1,614 | 1,590 | 1,566 | |||||||||||
| Sales per weighted-average square foot ($) (c)(f)(h) | 277 | 255 | 251 | 248 | 251 | 244 | 232 | 224 | 224 | 221 | |||||||||||
| Percentage increase in comparable store sales (c)(i) | 10.9 | % | 4.0 | % | 3.8 | % | 1.4 | % | 4.8 | % | 7.5 | % | 6.0 | % | 4.6 | % | 3.5 | % | 4.6 | % |
| | | | | | | | | | | | | | | | | | | | | | |
|---|---|---|---|---|---|---|---|---|---|---|---|---|---|---|---|---|---|---|---|---|---|
| Years ended December 31, | 2020 | 2019 | 2018 | 2017 | 2016 | 2015 | 2014 | 2013 | 2012 | 2011 | |||||||||||
| (In thousands, except per share, Team Members, stores and ratio data) | |||||||||||||||||||||
| | | | | | | | | | | | | | | | | | | | | | |
| SELECT BALANCE SHEET AND CASH FLOW DATA: | |||||||||||||||||||||
| | | | | | | | | | | | | | | | | | | | | | |
| Working capital ($) (j) | (762,630) | (635,765) | (350,918) | (249,694) | (142,674) | (36,372) | 252,082 | 430,832 | 478,093 | 1,028,330 | |||||||||||
| Total assets ($) (j) | 11,596,642 | 10,717,160 | 7,980,789 | 7,571,885 | 7,204,189 | 6,676,684 | 6,532,083 | 6,057,895 | 5,741,241 | 5,494,174 | |||||||||||
| Inventory turnover (k) | 1.5 | 1.4 | 1.4 | 1.4 | 1.5 | 1.5 | 1.4 | 1.4 | 1.4 | 1.5 | |||||||||||
| Accounts payable to inventory (l) | 114.5 | % | 104.4 | % | 105.7 | % | 106.0 | % | 105.7 | % | 99.1 | % | 94.6 | % | 86.6 | % | 84.7 | % | 64.4 | % | |
| Current portion of long-term debt and short-term debt ($) | — | — | — | — | — | — | 25 | 67 | 222 | 662 | |||||||||||
| Long-term debt, less current portion ($) (j) | 4,123,217 | 3,890,527 | 3,417,122 | 2,978,390 | 1,887,019 | 1,390,018 | 1,388,397 | 1,386,828 | 1,087,789 | 790,585 | |||||||||||
| Shareholders’ equity ($) (a) | 140,258 | 397,340 | 353,667 | 653,046 | 1,627,136 | 1,961,314 | 2,018,418 | 1,966,321 | 2,108,307 | 2,844,851 | |||||||||||
| Cash provided by operating activities ($) (m) | 2,836,603 | 1,708,479 | 1,727,555 | 1,403,687 | 1,510,713 | 1,345,488 | 1,190,430 | 908,026 | 1,251,555 | 1,118,991 | |||||||||||
| Capital expenditures ($) | 465,579 | 628,057 | 504,268 | 465,940 | 476,344 | 414,020 | 429,987 | 395,881 | 300,719 | 328,319 | |||||||||||
| Free cash flow ($) (m)(n) | 2,189,995 | 1,020,649 | 1,188,584 | 889,059 | 978,375 | 868,390 | 760,443 | 512,145 | 950,836 | 790,672 |
| (a) | During the year ended December 31, 2017, the Company adopted a new accounting standard that requires excess tax benefits related to share-based compensation payments to be recorded through the income statement. In compliance with the standard, the Company did not restate prior period amounts to conform to current period presentation. The Company recorded a cumulative effect adjustment to opening retained earnings, due to the adoption of the new accounting standard. See Note 1 “Summary of Significant Accounting Policies” to the Consolidated Financial Statements of the annual report on Form 10-K for the year ended December 31, 2017, for more information. |
|---|
| (b) | Following the enactment of the U.S. Tax Cuts and Jobs Act in December of 2017, the Company revalued its deferred income tax liabilities, which resulted in a one-time benefit to the Company’s Consolidated Statement of Income for the years ended December 31, 2018 and 2017. See Note 13 “Income Taxes” to the Consolidated Financial Statements of the annual report on Form 10-K for the year ended December 31, 2018, for more information. |
|---|
| (c) | Represents O’Reilly’s U.S. operations only. |
|---|
| (d) | In 2012, 2016 and 2018, the Company acquired materially all assets of VIP Parts, Tires & Service (“VIP”), Bond Auto Parts (“Bond”) and Bennett Auto Supply, Inc. (“Bennett”), respectively. The 2012 VIP acquisition added 56 stores, and the 2016 Bond acquisition added 48 stores to the O’Reilly store count. After the close of business on December 31, 2018, the Company acquired substantially all of the non-real estate assets of Bennett, including 33 stores that were not included in the 2018 store count and were not operated by the Company in 2018, but beginning January 1, 2019, the operations of the acquired Bennett locations were included in the Company’s store count, and during the year ended December 31, 2019, the Company merged 13 of these acquired Bennett stores into existing O’Reilly locations and rebranded the remaining 20 Bennett stores as O’Reilly stores. Financial results for these acquired companies have been included in the Company’s consolidated financial statements from the dates of the acquisitions forward. |
|---|
| (e) | In 2019, the Company acquired Mayoreo de Autopartes y Aceites, S.A. de C.V. (“Mayasa”), which added 21 stores to the O’Reilly store count. Financial results for this acquired company have been included in the Company’s consolidated financial statements beginning from the date of the acquisition. |
|---|
| (f) | Square footage includes normal selling, office, stockroom and receiving space. |
|---|
| (g) | Sales per weighted-average store are weighted to consider the approximate dates of store openings, acquisitions or closures. |
|---|
| (h) | Sales per weighted-average square foot are weighted to consider the approximate dates of domestic store openings, acquisitions, expansions or closures. |
|---|
| (i) | Comparable store sales are calculated based on the change in sales of U.S. stores open at least one year and excludes sales of specialty machinery, sales to independent parts stores, sales to Team Members, sales from Leap Day during the years ended December 31, 2020, 2016 and 2012. Online sales, resulting from ship-to-home orders and pick-up-in-store orders, for U.S. stores open at least one year, are included in the comparable store sales calculation. |
|---|
| (j) | Certain prior period amounts have been reclassified to conform to current period presentation, due to the Company’s adoption of new accounting standards during the fourth quarter ended December 31, 2015. See Note 1 “Summary of Significant Accounting Policies” to the Consolidated Financial Statements of the annual report on Form 10-K for the year ended December 31, 2015, for more information. |
|---|
| (k) | Inventory turnover is calculated as cost of goods sold for the last 12 months divided by average inventory. Average inventory is calculated as the average of inventory for the trailing four quarters used in determining the denominator. |
|---|
| (l) | Accounts payable to inventory is calculated as accounts payable divided by inventory. |
|---|
| (m) | Certain prior period amounts have been reclassified to conform to current period presentation, due to the Company’s adoption of a new accounting standard during the first quarter ended March 31, 2017. See Note 1 “Summary of Significant Accounting Policies” to the Consolidated Financial Statements of the annual report on Form 10-K for the year ended December 31, 2017, for more information. |
|---|
| (n) | Free cash flow is calculated as net cash provided by operating activities less capital expenditures, excess tax benefit from share-based compensation payments and investment in tax credit equity investments for the period. |
|---|
Item 7. Management’s Discussion and Analysis of Financial Condition and Results of Operations
In Management’s Discussion and Analysis, we provide a historical and prospective narrative of our general financial condition, results of operations, liquidity and certain other factors that may affect our future results, including
| ● | an overview of the key drivers of the automotive aftermarket industry; |
|---|
| ● | key events and recent developments within our Company; |
|---|
| ● | our results of operations for the years ended December 31, 2020 and 2019; |
|---|
| ● | our liquidity and capital resources; |
|---|
| ● | any contractual obligations, to which we are committed; |
|---|
| ● | any off-balance sheet arrangements we utilize; |
|---|
| ● | our critical accounting estimates; |
|---|
| ● | the inflation and seasonality of our business; and |
|---|
| ● | recent accounting pronouncements that may affect our Company. |
|---|
The review of Management’s Discussion and Analysis should be made in conjunction with our consolidated financial statements, related notes and other financial information, forward-looking statements and other risk factors included elsewhere in this annual report.
OVERVIEW
We are a specialty retailer of automotive aftermarket parts, tools, supplies, equipment and accessories in the United States and Mexico. We are one of the largest U.S. automotive aftermarket specialty retailers, selling our products to both DIY customers and professional service providers – our “dual market strategy.” Our stores carry an extensive product line consisting of new and remanufactured automotive hard parts, maintenance items, accessories, a complete line of auto body paint and related materials, automotive tools and professional service provider service equipment.
Our extensive product line includes an assortment of products that are differentiated by quality and price for most of the product lines we offer. For many of our product offerings, this quality differentiation reflects “good,” “better,” and “best” alternatives. Our sales and total gross profit dollars are highest for the “best” quality category of products. Consumers’ willingness to select products at a higher point on the value spectrum is a driver of sales and profitability in our industry. We have ongoing initiatives focused on marketing and training to educate customers on the advantages of ongoing vehicle maintenance, as well as “purchasing up” on the value spectrum.
Our stores also offer enhanced services and programs to our customers, including used oil, oil filter and battery recycling; battery, wiper and bulb replacement; battery diagnostic testing; electrical and module testing; check engine light code extraction; loaner tool program; drum and rotor resurfacing; custom hydraulic hoses; and professional paint shop mixing and related materials. As of December 31, 2020, we operated 5,594 stores in 47 U.S. states and 22 stores in Mexico.
We are influenced by a number of general macroeconomic factors that impact both our industry and our consumers, including, but not limited to, fuel costs, unemployment trends, interest rates and other economic factors. Due to the nature of these macroeconomic factors, we are unable to determine how long current conditions will persist and the degree of impact future changes may have on our business. Macroeconomic factors, such as increases in the U.S. unemployment rate, and demand drivers specific to the automotive aftermarket, such as U.S. miles driven, have been pressured as a result of responses to the COVID-19 pandemic, such as stay at home orders, work from home arrangements and reduced travel. Gradual reopening processes across many markets positively impacted our performance beginning in the second quarter and continuing into our third and fourth quarters; however, we are unable to predict the ongoing and future impact of the pandemic on broader economic conditions or our industry.
We believe the key drivers of current and future long-term demand for the products sold within the automotive aftermarket include the number of U.S. miles driven, number of U.S. registered vehicles, new light vehicle registrations and average vehicle age.
Number of Miles Driven
The number of total miles driven in the U.S. influences the demand for repair and maintenance products sold within the automotive aftermarket. In total, vehicles in the U.S. are driven approximately three trillion miles per year, resulting in ongoing wear and tear and a corresponding continued demand for the repair and maintenance products necessary to keep these vehicles in operation. According to the Department of Transportation, the number of total miles driven in the U.S. increased 0.9% and 0.4% in 2019 and 2018, respectively, and through February of 2020, year-to-date miles driven increased 2.1%. Miles driven dramatically declined beginning in March of 2020, and through December 2020, year-to-date miles driven decreased 13.2%, as a result of the measures taken by state and local
governments in response to COVID-19 and the impact to economic activity as consumers responded to COVID-19. Further government measures or consumer and business behavior could continue to have a negative impact on miles driven, but we are unable to predict the duration and severity of the impact to our business.
Size and Age of the Vehicle Fleet
The total number of vehicles on the road and the average age of the vehicle population heavily influence the demand for products sold within the automotive aftermarket industry. As reported by The Auto Care Association, the total number of registered vehicles increased 10.4% from 2009 to 2019, bringing the number of light vehicles on the road to 278 million by the end of 2019. For the year ended December 31, 2020, the seasonally adjusted annual rate of light vehicle sales in the U.S. (“SAAR”) was approximately 16.3 million. In the past decade, vehicle scrappage rates have remained relatively stable, ranging from 4.1% to 5.7% annually. As a result, over the past decade, the average age of the U.S. vehicle population has increased, growing 18.0%, from 10.0 years in 2009 to 11.8 years in 2019.
We believe this increase in average age can be attributed to better engineered and manufactured vehicles, which can be reliably driven at higher mileages due to better quality power trains, interiors and exteriors and the consumer’s willingness to invest in maintaining these higher-mileage, better built vehicles. As the average age of vehicles on the road increases, a larger percentage of miles are being driven by vehicles that are outside of a manufacturer warranty. These out-of-warranty, older vehicles generate strong demand for automotive aftermarket products as they go through more routine maintenance cycles, have more frequent mechanical failures and generally require more maintenance than newer vehicles. We believe consumers will continue to invest in these reliable, higher-quality, higher-mileage vehicles and these investments, along with an increasing total light vehicle fleet, will support continued demand for automotive aftermarket products.
We remain confident in our ability to gain market share in our existing markets and grow our business in new markets by focusing on our dual market strategy and the core O’Reilly values of hard work and excellent customer service.
KEY EVENTS AND RECENT DEVELOPMENTS
Several key events have had or may have a significant impact on our operations and are identified below:
After the close of business on November 29, 2019, we completed the acquisition of Mayasa, a specialty retailer of automotive aftermarket parts headquartered in Guadalajara, Jalisco, Mexico pursuant to a stock purchase agreement. At the time of the acquisition, Mayasa operated six distribution centers, 21 Orma Autopartes stores an
Showing the first 8K of 198K characters. Open the full section
Item 9. Changes in and Disagreements with Accountants on Accounting and Financial Disclosure
None.
Item 9A. Controls and Procedures
EVALUATION OF DISCLOSURE CONTROLS AND PROCEDURES
As of the end of the period covered by this report, the Company’s management, under the supervision and with the participation of its Chief Executive Officer and Chief Financial Officer, evaluated the effectiveness of the design and operation of the Company’s disclosure controls and procedures pursuant to Rule 13a-15(b) and as defined in Rule 13a-15(e) of the Securities Exchange Act of 1934, as amended (the “Exchange Act”). Based on that evaluation, the Chief Executive Officer and the Chief Financial Officer concluded that the Company’s disclosure controls and procedures as of the end of the period covered by this report are functioning effectively to provide reasonable assurance that the information required to be disclosed by the Company, including its consolidated subsidiaries, in reports filed under the Exchange Act is recorded, processed, summarized and reported within the time periods specified in the Securities and Exchange Commission’s rules and forms and is accumulated and communicated to management, including the Company’s Chief Executive Officer and Chief Financial Officer, as appropriate to allow timely decisions regarding required disclosure.
CHANGES IN INTERNAL CONTROLS
There were no changes in the Company’s internal control over financial reporting during the fiscal quarter ended December 31, 2020, that have materially affected, or are reasonably likely to materially affect, the Company’s internal control over financial reporting.
INTERNAL CONTROL OVER FINANCIAL REPORTING
The management of the Company, under the supervision and with the participation of the Company’s principal executive officer and principal financial officer and effected by the Company’s Board of Directors, is responsible for establishing and maintaining adequate internal control over financial reporting as defined in Rule 13(a)-15(f) or 15(d)-15(f) under the Exchange Act. The Company’s internal control system is designed to provide reasonable assurance regarding the reliability of financial reporting and the preparation of financial statements for external purposes in accordance with accounting principles generally accepted in the United States.
Internal control over financial reporting includes all policies and procedures that
| ● | pertain to the maintenance of records that, in reasonable detail, accurately and fairly reflect the transactions and dispositions of the assets of the Company; |
|---|
| ● | provide reasonable assurance that transactions are recorded as necessary to permit preparation of financial statements in accordance with accounting principles generally accepted in the United States of America, and that receipts and expenditures of the Company are being made only in accordance with authorizations of management and directors of the Company; and |
|---|
| ● | provide reasonable assurance regarding prevention or timely detection of unauthorized acquisition, use or disposition of the Company’s assets that could have a material effect on the financial statements. |
|---|
Management recognizes that all internal control systems, no matter how well designed, have inherent limitations. Therefore, even those systems determined to be effective can provide only reasonable assurance with respect to financial statement preparation and presentation. Also, projections of any evaluation of effectiveness to future periods are subject to risk. Over time, controls may become inadequate because of changes in conditions or deterioration in the degree of compliance with policies or procedures.
Under the supervision and with the participation of the Company’s principal executive officer and principal financial officer, management assessed the effectiveness of the Company’s internal control over financial reporting as of December 31, 2020. In making this assessment, management used the criteria set forth by the Committee of Sponsoring Organizations of the Treadway Commission in Internal Control – Integrated Framework (2013 framework). Based on this assessment, management believes that as of December 31, 2020, the Company’s internal control over financial reporting was effective based on those criteria.
Ernst & Young LLP, Independent Registered Public Accounting Firm, has audited the Company’s consolidated financial statements and has issued an attestation report on the effectiveness of the Company’s internal control over financial reporting, which is included in Item 8 of this annual report on Form 10-K.
Item 9B. Other Information
Not Applicable.
PART III
Item 10. Directors, Executive Officers and Corporate Governance
Certain information required by Part III is incorporated by reference from the Company’s Proxy Statement on Schedule 14A for the 2021 Annual Meeting of Shareholders (“Proxy Statement”), which will be filed with the Securities and Exchange Commission (the “SEC”) within 120 days of the end of the Company’s most recent fiscal year. Except for those portions specifically incorporated in this Annual Report on Form 10-K by reference to the Company’s Proxy Statement, no other portions of the Proxy Statement are deemed to be filed as part of this Annual Report on Form 10-K.
Directors and Officers:
The information regarding the directors of the Company will be included in the Company’s Proxy Statement under the caption “Proposal 1 - Election of Directors” and “Information Concerning the Board of Directors” and is incorporated herein by reference. The Proxy Statement will be filed with the SEC within 120 days of the end of the Company’s most recent fiscal year. The information regarding executive officers called for by Item 401 of Regulation S-K is included in Part I, in accordance with General Instruction G(3) to Form 10-K, for the Company’s executive officers who are not also directors.
Section 16(a) of the Securities Exchange Act of 1934, as amended:
The information regarding compliance with Section 16(a) of the Securities Exchange Act of 1934, as amended (the “Exchange Act”), required by Item 405 of Regulation S-K, will be included in the Company’s Proxy Statement under the caption “Delinquent Section 16(a) Reports,” if applicable, and is incorporated herein by reference.
Code of Ethics:
The Company’s Board of Directors has adopted a code of ethics that applies to all of its directors, officers (including its chief executive officer, chief operating officer, chief financial officer, chief accounting officer, controller and any person performing similar functions) and Team Members. The Company’s Code of Ethics is available on its website at www.OReillyAuto.com, under the “Corporate Home” caption. The information on the Company’s website is not a part of this Annual Report on Form 10-K and is not incorporated by reference in this report or any of the Company’s other filings with the SEC.
Corporate Governance:
The Corporate Governance/Nominating Committee of the Board of Directors does not have a written policy on the consideration of Director candidates recommended by shareholders. It is the view of the Board of Directors that all candidates, whether recommended by a shareholder or the Corporate Governance/Nominating Committee, shall be evaluated based on the same established criteria for persons to be nominated for election to the Board of Directors and its committees.
The Board of Directors has established an Audit Committee pursuant to Section 3(a)(58)(A) of the Exchange Act. The Audit Committee currently consists of Jay D. Burchfield, Thomas T. Hendrickson, John R. Murphy, Dana M. Perlman, Maria A. Sastre and Andrea M. Weiss, each an independent director in accordance with The Nasdaq Stock Market Marketplace Rule 5605(a)(2), the standards of Rule 10A-3 of the Exchange Act and the requirements of The Nasdaq Stock Market Marketplace Rule 5605(c)(2). In addition, our Board of Directors has determined that Mr. Hendrickson, Chairperson of the Audit Committee, qualifies as an audit committee financial expert under Item 407(d)(5) of Regulation S-K.
Item 11. Executive Compensation
Director and Officer Compensation:
The information required by Item 402 of Regulation S-K will be included in the Company’s Proxy Statement under the captions “Compensation of Executive Officers” and “Compensation of Directors” and is incorporated herein by reference.
Compensation Committee:
The information required by Item 407(e)(4) and (e)(5) of Regulation S-K will be included in the Company’s Proxy Statement under the captions “Compensation Committee Interlocks and Insider Participation” and “Compensation Committee Report” and is incorporated herein by reference.
Item 12. Security Ownership of Certain Beneficial Owners and Management and Related Stockholder Matters
The information required by Item 201(d) of Regulation S-K will be included in the Company’s Proxy Statement under the caption “Equity Compensation Plans” and is incorporated herein by reference.
The information required by Item 403 of Regulation S-K will be included in the Company’s Proxy Statement under the captions “Security Ownership of Certain Beneficial Owners” and “Security Ownership of Directors and Management” and is incorporated herein by reference.
Item 13. Certain Relationships and Related Transactions, and Director Independence
The information required by Item 404 of Regulation S-K will be included in the Company’s Proxy Statement under the caption “Certain Relationships and Related Transactions” and is incorporated herein by reference.
The information required by Item 407(a) of Regulation S-K will be included in the Company’s Proxy Statement under the caption “Director Independence” and is incorporated herein by reference.
Item 14. Principal Accountant Fees and Services
The information required by Item 9(e) of Schedule 14A will be included in the Company’s Proxy Statement under the caption “Fees Paid to Independent Registered Public Accounting Firm” and is incorporated herein by reference.
PART IV
Item 15. Exhibits and Financial Statement Schedules
| (a) | The following documents are filed as part of this Annual Report on Form 10-K: |
|---|
| 1. | Financial Statements - O’Reilly Automotive, Inc. and Subsidiaries |
|---|
The following consolidated financial statements of O’Reilly Automotive, Inc. and Subsidiaries included in the Annual Shareholders’ Report of the registrant for the year ended December 31, 2020, are filed with this Annual Report in Part II, Item 8:
Management’s Report on Internal Control over Financial Reporting
Report of Independent Registered Public Accounting Firm – Internal Control over Financial Reporting
Report of Independent Registered Public Accounting Firm – Financial Statements
Consolidated Balance Sheets as of December 31, 2020 and 2019
Consolidated Statements of Income for the years ended December 31, 2020, 2019 and 2018
Consolidated Statements of Comprehensive Income for the years ended December 31, 2020, 2019 and 2018
Consolidated Statements of Shareholders’ Equity for the years ended December 31, 2020, 2019 and 2018
Consolidated Statements of Cash Flows for the years ended December 31, 2020, 2019 and 2018
Notes to Consolidated Financial Statements for the years ended December 31, 2020, 2019 and 2018
| 2. | Financial Statement Schedules - O’Reilly Automotive, Inc. and Subsidiaries |
|---|
Any schedules, for which provision is made in the applicable accounting regulations of the Securities and Exchange Commission, are not required under the related instructions or are inapplicable, and therefore have been omitted.
| 3. | Exhibits |
|---|
Item 16. Form 10-K Summary
Not applicable.
SIGNATURES
Pursuant to the requirements of Section 13 or 15(d) of the Securities Exchange Act of 1934, as amended, the registrant has duly caused this report to be signed on its behalf by the undersigned, thereunto duly authorized.
| | | | | |
|---|---|---|---|---|
| | O’REILLY AUTOMOTIVE, INC. | | ||
| | (Registrant) | | ||
| | | | | |
| | Date: | February 26, 2021 | | |
| | | | | |
| | By: | /s/ | Gregory D. Johnson | |
| | | Gregory D. Johnson | | |
| | | Chief Executive Officer and | | |
| | | Co-President | |
Pursuant to the requirements of the Securities Exchange Act of 1934, as amended, this report has been signed below by the following persons on behalf of the registrant in the capacities and on the dates indicated.
| | | | | | |
|---|---|---|---|---|---|
| Date: | February 26, 2021 | | | | |
| | | | | | |
| | | | | | |
| | /s/ | David O’Reilly | | /s/ | Larry O’Reilly |
| | David O’Reilly | | Larry O’Reilly | ||
| | Director and Chairman of the Board | | Director and Vice Chairman of the Board | ||
| | | | | | |
| | | | | | |
| | /s/ | Greg Henslee | | /s/ | Jay D. Burchfield |
| | Greg Henslee | | Jay D. Burchfield | ||
| | Executive Vice Chairman of the Board | | Director | ||
| | | | | | |
| | | | | | |
| | /s/ | Thomas T. Hendrickson | | /s/ | John R. Murphy |
| | Thomas T. Hendrickson | | John R. Murphy | ||
| | Director | | Director | ||
| | | | | | |
| | | | | | |
| | /s/ | Dana M. Perlman | | /s/ | Maria A. Sastre |
| | Dana M. Perlman | | Maria A. Sastre | ||
| | Director | | Director | ||
| | | | | | |
| | | | | | |
| | /s/ | Andrea M. Weiss | | | |
| | Andrea M. Weiss | | | | |
| | Director | | | | |
| | | | | | |
| | | | | | |
| | /s/ | Gregory D. Johnson | | /s/ | Thomas McFall |
| | Gregory D. Johnson | | Thomas McFall | ||
| | Chief Executive Officer and | | Executive Vice President and | ||
| | Co-President | | Chief Financial Officer | ||
| | (Principal Executive Officer) | | (Principal Financial and Accounting Officer) |