 filings.tools
O'Reilly Automotive (ORLY) 10-K risk factor changes: FY2020 vs FY2019
The 2020-12-31 10-K against the 2019-12-31 one, compared heading by heading and sentence by sentence.
Item 1A32 rewritten36 added9 removed135 unchanged
All filing items805 rewritten328 added380 removed1,546 unchanged
Summary
counted, not written
- Item 1A lists 18 risk factor headings: 2 new, 1 reworded and 15 unchanged since FY2019. 1 heading from FY2019 no longer appears.
- Sentence by sentence, 328 added, 380 removed, 805 rewritten and 1,546 unchanged across 9 items that differ.
New Item 1A headings (2)
- The ongoing occurrence of COVID-19, or any other such widespread public health crisis, could have a material adverse effect on our business, results of operations, financial condition and cash flows.
- Failure to protect our brand and reputation could have a material adverse effect on our brand name, business, results of operations, financial condition and cash flows.
Removed Item 1A headings (1)
- Failure to achieve and maintain a high level of product and service quality may reduce our brand value and negatively impact our business.
Reworded Item 1A headings (1)
- Business interruptions in our distribution centers or other facilities may affect our store hours,
[removed: operability][added: stability] of our computer systems, and/or availability and distribution of merchandise, which may affect our business.
A heading is new when no FY2019 heading matches it after ignoring case and punctuation, and reworded when it shares at least 60 percent of its words with one that went away. All current risk factor headings.
Sentences by item
15 items, with every count and a link to each item that changed
| Item | Added | Removed | Rewritten | Unchanged |
|---|---|---|---|---|
| Item 1A. Risk Factors | 36 | 9 | 32 | 135 |
| Item 7. Management’s Discussion and Analysis of Financial Condition and Results of Operations | 209 | 298 | 576 | 789 |
| Item 1. Business | 57 | 38 | 95 | 305 |
| Item 3. Legal Proceedings | 0 | 0 | 0 | 4 |
| Cover and table of contents | 2 | 1 | 17 | 84 |
| Item 4. Mine Safety Disclosures | 0 | 0 | 0 | 2 |
| Item 5. Market for Registrant’s Common Equity, Related Stockholder Matters and Issuer Purchases of Equity Securities | 6 | 6 | 11 | 15 |
| Item 6. Selected Financial Data | 1 | 2 | 41 | 46 |
| Item 9. Changes in and Disagreements with Accountants on Accounting and Financial Disclosure | 0 | 0 | 0 | 1 |
| Item 9A. Controls and Procedures | 0 | 2 | 3 | 20 |
| Item 9B. Other Information | 0 | 0 | 0 | 2 |
| Item 10. Directors, Executive Officers and Corporate Governance | 3 | 0 | 3 | 18 |
| Item 11. Executive Compensation | 0 | 0 | 0 | 8 |
| Item 13. Certain Relationships and Related Transactions, and Director Independence | 0 | 0 | 0 | 2 |
| Item 14. Principal Accountant Fees and Services | 14 | 24 | 27 | 115 |
Underlined words on a shaded ground are new in FY2020; struck-through words were in FY2019. Sentences that are wholly new or wholly gone are labelled rather than marked.
Item 1A. Risk Factors
32 rewritten, 36 added, 9 removed, 135 unchanged
Interested parties should be aware that the occurrence of the events described in these risk factors, elsewhere in this Form 10-K and in our other filings with the Securities and Exchange Commission could [added: have a material adverse effect on our business, operating results and financial condition.]
[added: Failure to protect our brand and reputation could] have a material adverse effect on our [added: brand name,] business, [removed: operating] results [removed: and] [added: of operations,] financial [removed: condition.][added: condition and cash flows.]
The economic health of our customers is affected by many factors, including, among others, general business conditions, interest rates, inflation, consumer debt levels, the availability of consumer credit, currency exchange rates, taxation, fuel prices, unemployment levels and other matters that influence consumer confidence and spending, such as a [removed: prolong] [added: prolonged] public health crisis or [removed: epidemic (such] [added: pandemic, such] as the [removed: coronavirus).][added: COVID-19 pandemic.]
In addition, restrictions on access to telematics, diagnostic tools and repair information imposed by the [removed: original vehicle manufacturers] [added: OEMs] or by governmental regulations may force vehicle owners to rely on dealers to perform maintenance and repairs.
[removed: Overall demand for products sold in the automotive aftermarket is dependent upon many factors including the total number of vehicle miles driven in the U.S., the total number of registered vehicles in the U.S., the age and quality of these registered vehicles and the level of unemployment in the U.S.] Adverse changes in these factors could lead to a decreased level of demand for our products, which could negatively impact our business, results of operations, financial condition and cash flows.
If third parties, on whom we rely for merchandise, are unable to overcome difficulties resulting from the deterioration in economic conditions, the cause of which could include a prolonged public health crisis or [removed: epidemic (such] [added: pandemic, such] as the [removed: coronavirus),] [added: COVID-19 pandemic,] and provide us with the merchandise we need, or if counterparties to our credit facilities do not perform their obligations, our business, results of operations, financial condition and cash flows could be adversely affected.
We may have to expend more resources and risk additional capital to remain [removed: competitive,] [added: competitive] and our results of operations, financial condition and cash flows could be adversely affected.
Our business is sensitive to national and regional economic and weather [removed: conditions,] [added: conditions] and natural disasters.
Our ability to accomplish our growth objectives is dependent, in part, on matters beyond our control, such as weather conditions, [removed: zoning,] [added: zoning] and other issues related to new store site development, the availability of qualified management personnel and general business and economic conditions.
We cannot be sure that our growth plans for [removed: 2020] [added: 2021] and beyond will be achieved.
[added: Failure] to achieve our growth objectives may negatively impact the trading price of our common stock.
We could also be negatively impacted by suppliers who might experience work stoppages, labor strikes, a prolonged public health crisis or [removed: epidemic (such] [added: pandemic, such] as the [removed: coronavirus)] [added: COVID-19 pandemic,] or other interruptions to, or difficulties in the, manufacture or supply of the products we purchase from them.
[removed: | | ● |] We may fail, or be unable to, discover liabilities of businesses that we acquire for which we or the subsequent owner or operator may be liable. [removed: |]
Business interruptions in our distribution centers or other facilities may affect our store hours, [removed: operability] [added: stability] of our computer systems, and/or availability and distribution of merchandise, which may affect our business.
The stock market and the price of our common stock may be subject to wide fluctuations based upon general economic and market [removed: conditions.][added: conditions and potentially being targeted through the selling and buying of our common stock by a group of individuals, whose interests and reasoning behind such actions may not align with an average market participant.]
In addition, a downgrade in our current credit rating could limit the financial institutions willing to commit funds to our [added: supplier financing programs at attractive rates.]
We are, and in the future may become, involved in lawsuits, regulatory [removed: inquiries,] [added: inquiries] and governmental and other legal proceedings, arising out of the ordinary course of our business.
In addition to many of the risks we face in our U.S. operations, international operations present a unique set of risks and challenges, including local laws and customs, U.S. laws applicable to foreign [removed: operations,] [added: operations] and political and socio-economic conditions.
Our ability to operate effectively and grow in international markets could be impacted by these risks resulting in legal liabilities, additional [removed: costs,] [added: costs] and the distraction of management’s attention.
Given that our Consolidated Financial Statements are denominated in U.S. dollars, amounts of assets, liabilities, net [removed: sales,] [added: sales] and other revenues and expenses denominated in local currencies must be translated into U.S. dollars using exchange rates for the current period.
Of the [removed: 5,460] [added: 5,616] stores [removed: that] we operated at December 31, [removed: 2019, 2,235] [added: 2020, 2,325] stores were owned, [removed: 3,151] [added: 3,220] stores were leased from unaffiliated parties, [removed: 21] [added: 22] of which were located in Mexico, and [removed: 74] [added: 71] stores were leased from entities that include one or more of our affiliated directors or members of their immediate family.
Leases with unaffiliated parties generally provide for payment of a fixed base rent, payment of certain tax, insurance and maintenance expenses and an original term of, at a minimum, 10 years, subject to one or more renewals at our [added: option.]
Such master lease agreements with two of the [removed: seven] [added: five] affiliated entities have been modified to extend the term of the lease agreement for specific stores.
The master lease agreements or modifications thereto expire on dates ranging from [removed: July 31, 2020, to September] [added: June] 30, [removed: 2031.][added: 2021, to November 1, 2035.]
The following table provides information regarding our U.S. domestic regional DCs in operation as of December 31, [removed: 2019:][added: 2020:]
| Distribution center | | Owned | | [removed: 20] [added: 21] | | [removed: 8,595] [added: 9,161] |
| Distribution center | | Leased (2) | | [removed: 8] [added: 7] | | [removed: 2,799] [added: 2,483] |
In addition, we [removed: acquired] [added: operate] six small distribution centers in [removed: Mexico from the Mayasa acquisition;] [added: Mexico;] these distribution centers do not serve U.S. stores and are immaterial in the aggregate.
We believe that our present facilities are in good condition, are [removed: adequately] [added: sufficiently] insured and are adequate for the conduct of our current operations.
The store servicing capability of our 28 existing U.S. DCs is approximately [removed: 6,135] [added: 6,180] stores, providing a growth capacity of more than [removed: 695] [added: 585] U.S. stores, which will increase by approximately [removed: 190] [added: 150 net,] stores with the completion of our [removed: two Tennessee market area DCs] [added: Horn Lake, Mississippi, DC and the conversion of our North Little Rock, Arkansas, DC into a Hub facility] in [removed: 2020.][added: 2021.]
We believe the growth capacity in our DCs, along with the additional capacity of our new [removed: Nashville and Memphis, Tennessee, markets DCs,] [added: Horn Lake, Mississippi, DC,] will provide us with the DC infrastructure needed for near-term expansion.
Our corporate office operations occur primarily in Springfield, Missouri, and as of December 31, [removed: 2019,] [added: 2020,] the total square footage was 0.6 million square feet, substantially all of which was owned.
RISKS RELATED TO THE COVID-19 PANDEMIC
The ongoing occurrence of COVID-19, or any other such widespread public health crisis, could have a material adverse effect on our business, results of operations, financial condition and cash flows.
The outbreak of the COVID-19 pandemic and its global spread, including in the U.S., has had a significant impact on the U.S. and world economies.
The public health concerns resulting from the pandemic have created significant uncertainty, economic disruption and volatility, all of which have impacted and may continue to impact our business.
We may be required to take significant actions to mitigate any adverse impact of the COVID-19 pandemic, including, but not limited to, reduced staffing and increased expenses.
We are unable to predict the ongoing short-term and long-term impact of the COVID-19 pandemic on our business, results of operations, financial condition and cash flows due to several factors beyond our control, including, but not limited to:
| | ● | the severity and duration of the pandemic, including additional outbreaks, new strands of the virus and availability of effective medical treatments and vaccines for COVID-19; |
| | ● | the continued response of both governmental and nongovernmental authorities, including, but not limited to, stay at home orders or quarantine, restrictions on our operations, such as requiring a reduction in store operating hours or the temporary closure of stores, distributions centers and other facilities, complex and changing regulations and guidance regarding the safety of employees and customers, inconsistent application of COVID-19 orders and regulations, unemployment compensation and economic stimulus; |
| | ● | the impact of the pandemic on consumer confidence and macroeconomic factors such as unemployment and work force availability, as well as industry specific demand drivers such as the number of U.S. miles driven, which could impact demand for our product; |
| | ● | temporary or long-term disruption in our supply network from local and international suppliers and/or delays in the delivery of our inventory; |
| | ● | volatility in the U.S. and global financial markets, including global debt and equity markets; |
| | ● | the impact of regulatory and legislative changes in liability for workers’ compensation; and |
| | ● | the impact of litigation, investigations or claims from customers, Team Members, suppliers, regulators or other third parties relating to the COVID-19 pandemic or our actions in response thereto, including any reputational harm. |
The above factors and uncertainties, in addition to others we are not currently aware of, may result in adverse impacts to our business, results of operations, financial condition and cash flows.
RISKS SPECIFIC TO OUR BUSINESS AND INDUSTRY
Overall demand for products sold in the automotive aftermarket is dependent upon many factors including the total number of vehicle miles driven in the U.S., the total number of registered vehicles in the U.S., the age and quality of these registered vehicles and the level of unemployment in the U.S. Changes in vehicle technology used by the original equipment manufacturers (“OEM”) on future vehicles, including but not limited to electric, hybrid and internal combustion engines, may result in less frequent repairs, parts lasting longer or elimination of certain repairs.
Our reputation is based, in part, on perceptions of subjective qualities; negative publicity involving the Company, our merchandise or our industry in general that erode customer trust or confidence could adversely affect our reputation and business.
Failure to comply with ethical, social, product, labor, health and safety, accounting or environmental standards, or existing or future laws or regulations could also jeopardize our reputation and potentially lead to various adverse actions from consumer or environmental groups, employees or regulatory bodies, which could require us to incur substantial legal fees and costs.
In addition, negative claims or publicity, including the availability of information and opinions on social media, as its impact is immediate, could adversely affect our reputation.
The opportunity for the rapid dissemination of information, including inaccurate and inflammatory information and opinions, is virtually limitless and easily accessible.
Damage to our reputation or loss of consumer confidence for any of these or other reasons could have an adverse effect on our business, results of operations, financial condition or cash flows, as well as require additional resources to rebuild our reputation.
RISKS RELATED TO OUR COMMON STOCK
RISKS RELATED TO OUR INDEBTEDNESS AND FINANCING
| --- | --- | --- |
GENERAL RISKS
| --- | --- | --- |
| --- | --- | --- |
| --- | --- | --- |
| --- | --- | --- |
| --- | --- | --- |
| Total | | | | 28 | | 11,644 |
In 2020, we relocated our Nashville, Tennessee, DC into a larger facility in Lebanon, Tennessee, providing a larger, more efficient facility that serves both markets in March 2020.
The existing store portion of the Nashville, Tennessee, DC facility remained a large Hub that continues to provide same day parts availability in the attractive Nashville market.
The distribution operations of our Knoxville, Tennessee, DC are in the process of being merged into our Lebanon, Tennessee, DC, which is expected to be completed in 2021, and the existing store portion of our Knoxville, Tennessee, DC facility will remain a large Hub that will continue to provide same day parts availability in the Knoxville market.
Additionally, we plan to merge our North Little Rock, Arkansas, DC into our new Horn Lake, Mississippi, DC, which we expect to open in mid-2021.
At that time, the existing store portion of our North Little Rock, Arkansas, DC facility will remain a large Hub that will continue to provide same day parts availability in the Little Rock market.
Failure
Failure to achieve and maintain a high level of product and service quality may reduce our brand value and negatively impact our business.
Brand value is based, in large part, on perceptions of subjective qualities and even isolated incidents can erode trust and confidence, particularly if they result in adverse publicity, governmental investigations or litigation, which can negatively impact these perceptions and lead to adverse effects on our business or Team Members.
supplier financing programs at attractive rates.
option.
| Total | | | | 28 | | 11,394 |
We have two distribution system expansion projects under construction in the Nashville and Memphis, Tennessee, markets, both of which are expected to be completed in 2020.
With the completion of our new Nashville area DC, two of our smaller, existing Tennessee DCs will cease being used as distribution facilities.
We also own or lease other properties that are not material in the aggregate.
Item 7. Management’s Discussion and Analysis of Financial Condition and Results of Operations
576 rewritten, 209 added, 298 removed, 789 unchanged
| | ● | our results of operations for the years ended December 31, [removed: 2019, 2018,] [added: 2020] and [removed: 2017;] [added: 2019;] |
| | ● | the inflation and seasonality of our business; [added: and] |
We are a specialty retailer of automotive aftermarket parts, tools, supplies, equipment and accessories in the United [removed: States.][added: States and Mexico.]
Our stores also offer enhanced services and programs to our customers, including used oil, oil filter and battery recycling; battery, wiper and bulb replacement; battery diagnostic testing; electrical and module testing; check engine light code extraction; loaner tool program; drum and rotor resurfacing; custom hydraulic hoses; [added: and] professional paint shop mixing and related [removed: materials; and machine shops.][added: materials.]
As of December 31, [removed: 2019,] [added: 2020,] we operated [removed: 5,439] [added: 5,594] stores in 47 U.S. states and [removed: 21] [added: 22] stores in Mexico.
We are influenced by a number of general macroeconomic factors that [removed: influence] [added: impact] both our industry and our consumers, including, but not limited to, fuel costs, unemployment trends, interest [removed: rates,] [added: rates] and other economic factors.
[added: Due to the nature of these macroeconomic] factors, we are unable to determine how long current conditions will persist and the degree of impact future changes may have on our business.
According to the Department of Transportation, the number of total miles driven in the U.S. increased [removed: 0.4%] [added: 0.9%] and [removed: 1.2%] [added: 0.4%] in [removed: 2018] [added: 2019] and [removed: 2017,] [added: 2018,] respectively, and through [removed: November] [added: February] of [removed: 2019,] [added: 2020,] year-to-date miles driven increased [removed: 0.9%.][added: 2.1%.]
As reported by The Auto Care Association, the total number of registered vehicles increased [removed: 8.1%] [added: 10.4%] from [removed: 2008] [added: 2009] to [removed: 2018,] [added: 2019,] bringing the number of light vehicles on the road to [removed: 272] [added: 278] million by the end of [removed: 2018.][added: 2019.]
For the year ended December 31, [removed: 2019,] [added: 2020,] the seasonally adjusted annual rate of light vehicle sales in the U.S. (“SAAR”) was approximately [removed: 16.7 million, contributing to the continued growth in the total number of registered vehicles on the road.][added: 16.3 million.]
In the past decade, vehicle scrappage rates have remained relatively stable, ranging from [removed: 4.4%] [added: 4.1%] to 5.7% annually.
As a result, over the past decade, the average age of the U.S. vehicle population has increased, growing [removed: 20.6%,] [added: 18.0%,] from [removed: 9.7] [added: 10.0] years in [removed: 2008] [added: 2009] to [removed: 11.7] [added: 11.8] years in [removed: 2018.][added: 2019.]
We believe this increase in average age can be attributed to better engineered and manufactured vehicles, which can be reliably driven at higher mileages due to better quality power trains, interiors and [removed: exteriors,] [added: exteriors] and the consumer’s willingness to invest in maintaining these higher-mileage, better built vehicles.
[removed: | | ● |] On [removed: May 20, 2019,] [added: March 27, 2020,] we issued $500 million aggregate principal amount of unsecured [removed: 3.900%] [added: 4.200%] Senior Notes due [removed: 2029 (“3.900%] [added: 2030 (“4.200%] Senior Notes due [removed: 2029”)] [added: 2030”)] at a price to the public of [removed: 99.991%] [added: 99.959%] of their face value with U.S. Bank National Association (“U.S. Bank”) as trustee. [removed: Interest on the 3.900% Senior Notes due 2029 is payable on June 1 and December 1 of each year, which began on December 1, 2019, and is computed on the basis of a 360-day year. |]
The following table includes income statement data as a percentage of [removed: sales] [added: sales, which is computed independently and may not compute to presented totals due to rounding differences,] for the years ended December 31, [removed: 2019, 2018] [added: 2020] and [removed: 2017][added: 2019:]
| | | For the Year Ended | | | | | [removed: | | |]
| | | December [removed: 31, | | | | | |] [added: 31, 2020,] | |
[removed: | | | 2019 | | | 2018 | | | 2017 | |][added: _2019 Compared to 2018:_]
| Sales | | 100.0 | % | | 100.0 | % | [removed: | 100.0 | % |]
| Cost of goods sold, including warehouse and distribution expenses | | [removed: 46.9 | | | 47.2] [added: 47.6] | [added: ] | | [removed: 47.4] [added: 46.9] | |
| Gross profit | | [removed: 53.1 | | | 52.8] [added: 52.4] | [added: ] | | [removed: 52.6] [added: 53.1] | |
| Selling, general and administrative expenses | | [removed: 34.2 | | | 33.8] [added: 31.6] | [added: ] | | [removed: 33.4] [added: 34.2] | |
| Operating income | | [removed: 18.9 | | | 19.0] [added: 20.8] | | | [removed: 19.2] [added: 18.9] | |
| Interest expense | | (1.4) | [removed: | | (1.3) |] [added: ] | | [removed: (1.0)] [added: (1.4)] | |
| Interest income | | 0.1 | [removed: | | — |] [added: ] | | [removed: —] [added: 0.1] | |
| Income before income taxes [removed: (1)] | | [removed: 17.6] [added: 19.5] | [added: ] | | [removed: 17.8 |] [added: 17.6] | | [removed: 18.2 | |]
| Provision for income taxes | | [removed: 3.9] [added: 4.4] | [added: ] | | 3.9 | | [removed: | 5.6 | |]
| Net income | | [removed: 13.7] [added: 15.1] | % | | [removed: 13.9 | % | | 12.6] [added: 13.7] | % |
Sales for the year ended December 31, [removed: 2019,] [added: 2020,] increased [removed: $614 million,] [added: $1.45 billion,] or [removed: 6%,] [added: 14%,] to [removed: $10.15] [added: $11.60] billion from [removed: $9.54] [added: $10.15] billion for the same period in [removed: 2018.][added: 2019.]
Comparable store sales for stores open at least one year increased [removed: 4.0%] [added: 10.9%] and [removed: 3.8%] [added: 4.0%] for the years ended December 31, [removed: 2019] [added: 2020] and [removed: 2018,] [added: 2019,] respectively.
[removed: U.S. domestic comparable] [added: Comparable] store sales are calculated based on [removed: the change] [added: changes] in sales for [added: U.S. domestic] stores open at least one year and exclude sales of specialty machinery, sales to independent parts stores and sales to Team [removed: Members.][added: Members, as well as sales from Leap Day in the year ended December 31, 2020.]
[removed: Online sales, resulting from ship-to-home orders and pickup in-store orders,] [added: | Sales] for stores [added: opened throughout 2019, excluding stores] open at least one [removed: year,] [added: year that] are included in [removed: the] comparable store [added: sales, and] sales [removed: calculation.][added: from the acquired Mayasa stores | | | 120 |]
The following table presents the components of the increase in sales for the year ended December 31, [removed: 2019] [added: 2020] (in millions):
| [removed: ] [added: ] | [added: ] | [removed: Increase in Sales for] [added: For] the Year Ended | | [added: | | |]
| | | Compared to the Same Period in [removed: 2018] [added: 2019] | |
| [removed: Store sales: |] [added: Comparable store sales] | | [added: $] | [added: 1,082 |]
| Decline in sales for stores that have closed | | | [removed: (8)] [added: (9)] |
| Includes sales of machinery and sales to independent parts stores and Team Members | | | [removed: 19] [added: 105] |
| Total increase in sales | | $ | [removed: 614] [added: 1,455] |
We believe the increased sales [removed: achieved by our stores were] [added: are] the result of store growth, the [added: acquisition of Mayasa, sales from one additional day due to Leap Day for the year ended December 31, 2020, the] high levels of customer service provided by our well-trained and technically proficient Team Members, superior inventory availability, including same day and over-night access to inventory in our regional distribution centers, enhanced services and programs offered in our stores, a [removed: broad] [added: broader] selection of product offerings in most [removed: of our] stores with a dynamic catalog system to identify and source parts, a targeted promotional and advertising effort through a variety of media and localized promotional events, continued improvement in the merchandising and store layouts of our stores, compensation programs for all store Team Members that provide incentives for performance and our continued focus on serving both DIY and professional service provider customers.
Macroeconomic factors, such as increases in the U.S. unemployment rate, and demand drivers specific to the automotive aftermarket, such as U.S. miles driven, have been pressured as a result of responses to the COVID-19 pandemic, such as stay at home orders, work from home arrangements and reduced travel.
Gradual reopening processes across many markets positively impacted our performance beginning in the second quarter and continuing into our third and fourth quarters; however, we are unable to predict the ongoing and future impact of the pandemic on broader economic conditions or our industry.
Miles driven dramatically declined beginning in March of 2020, and through December 2020, year-to-date miles driven decreased 13.2%, as a result of the measures taken by state and local
governments in response to COVID-19 and the impact to economic activity as consumers responded to COVID-19.
Further government measures or consumer and business behavior could continue to have a negative impact on miles driven, but we are unable to predict the duration and severity of the impact to our business.
After the close of business on November 29, 2019, we completed the acquisition of Mayasa, a specialty retailer of automotive aftermarket parts headquartered in Guadalajara, Jalisco, Mexico pursuant to a stock purchase agreement.
The results of Mayasa’s operations have been included in the Company’s consolidated financial statements and results of operations beginning from the date of acquisition.
The COVID-19 pandemic has caused significant disruption to the economy, placing pressure on our business beginning in mid-March 2020, as stay at home orders and/or business restrictions were put in place in most cities, counties and states.
This pressure continued until mid-April when our customers began to receive Economic Impact Payments under the CARES Act.
We believe these government stimulus payments and enhanced unemployment benefits, along with the easing of stay at home orders and the associated market reopenings beginning in May and June and favorable industry dynamics, such as consumers investing in existing vehicles, led to strong demand for our products beginning in April and continuing through the remainder of 2020.
We have been deemed an essential service provider in the communities we serve, and have taken many steps to promote the health and safety of our customers and Team Members, while keeping our stores open and operating to meet our customers’ critical needs during the COVID-19 crisis.
In addition, when our business was pressured at the end of the first quarter, we took steps to strengthen our liquidity and mitigate the expected ongoing impact on our operations and financial performance.
These actions include, but are not limited to:
| | ● | Implementing social distancing standards throughout the Company, providing our Team Members with personal protective equipment and modifying store procedures, including the implementation of curbside pickup for Buy Online, Pick Up In-Store orders, enhanced cleaning protocols, health screening, contact tracing and mandatory masking for all Team Members; |
| | ● | Putting in place programs to relax attendance policies, as well as advance sick time to assist Team Members who are place in quarantine or need time away to support family members effective by COVID-19; |
| | ● | Temporarily deferring certain capital investments, many of which have now resumed, and prudently managing our cost structure in response to sales volatility; |
| | ● | Successfully issuing $500 million aggregate principal amount unsecured 4.20% Senior Notes due 2030, and drawing a precautionary $250 million on our existing revolving credit facility, however during the second quarter of 2020, this additional draw was repaid; |
| | ● | Temporarily suspending our share repurchase program on March 16, 2020, however, the program resumed on May 29, 2020, based on the improved business environment and outlook; and |
| | ● | Utilizing relief efforts as part of the Coronavirus Aid, Relief, and Economic Security Act (CARES Act) signed into law on March 27, 2020, which included bonus depreciation on eligible property, deferral of employer portion of social security taxes and deferral of certain tax payments. |
While we continue to make adjustments as we navigate the current environment, we are unable to predict how long the current crisis will last or the extent of the impact on our customers and our business.
2020 Compared to 2019
| Sales from Leap Day | | | 34 |
The Company incurred significant sales headwinds beginning in the middle of March and through the middle of April, as a result of COVID-19; however, the government stimulus payments, enhanced unemployment benefits, easing of stay at home orders and the associated market reopenings beginning in May and June, when combined with favorable industry dynamics, such as consumers investing in existing vehicles, led to strong demand for our products over the remainder of the second quarter and continuing through the remainder of 2020.
Beginning in April of 2020, average ticket values, primarily for DIY customers, benefited from consumers spending additional time and money repairing and maintaining their vehicles in response to the COVID-19 and economic environment.
As the COVID-19 stay at home orders and business restrictions took effect in our markets in the middle of March 2020, transaction counts for both DIY and professional service provider customers turned sharply negative, with a larger impact realized on the professional side of the business, as we believe a larger segment of the demographic served by our professional service provider customers is more likely to accommodate working from home than a typical DIY customer.
However, in the middle of April 2020, as the government stimulus and enhanced unemployment benefits reached consumers, we saw a reversal in transaction counts, with a more immediate impact realized on the DIY side of the business.
Improved transaction counts continued through December 2020, as states implemented reopening plans and many individuals returned to work.
We cannot predict what continued impact the COVID-19 pandemic will have to our business in the future given the high degree of uncertainty as to the duration and severity of the pandemic, the potential future changes to economic reopening plans and the mitigating impact of government stimulus for consumers.
The decrease in SG&A as a percentage of sales for the year ended December 31, 2020, was principally due to leverage of store operating costs on strong comparable store sales growth combined with our cautionary approach and strict expense control measures in response to the onset of the COVID-19 environment.
A discussion of the changes in our results of operations for the year ended December 31, 2019, as compared to the year ended December 31, 2018, has been omitted from this Form 10-K but may be found in Item 7.
“Management’s Discussion and Analysis of Financial Condition and Results of Operations” of the annual report on Form 10-K for the year ended December 31, 2019, filed with the Securities and Exchange Commission (the “SEC”) on February 28, 2020, which is available free of charge on the SEC’s website at www.sec.gov by searching with our ticker symbol “ORLY” or at our internet address, www.OReillyAuto.com, by clicking “Investor Relations” located at the bottom of the page.
As we operated amid uncertainty and disruption caused by the COVID-19 pandemic, we have demonstrated our ability to take prudent steps to support the future stability and financial flexibility of our Company.
At the onset of disruption caused by the COVID-19 pandemic, our Teams took decisive action to reduce costs and conserve cash, which included delaying capital investments, reducing operating costs and temporarily suspending our share repurchase program from March 16, 2020, through May 28, 2020.
As we are unable to determine the duration or potential increase in severity of this crisis, we cannot predict its future impacts on our ability to generate funds from operations or maintain liquidity, and accordingly, we will continue to make adjustments as we navigate the current and expected environment.
The increase in current liabilities was primarily due to an increase in accounts payable, which was the result of higher inventory turns on strong sales, and accrued benefits and withholdings, which was the result of deferred payroll tax payments under the CARES Act and Team member incentive payments.
| Operating activities | | $ | 2,836,603 | | $ | 1,708,479 |
| Investing activities | | | (614,895) | | | (796,746) |
| Financing activities | | | (1,796,577) | | | (902,811) |
The larger decrease in net inventory investment in 2020, as compared to 2019, was primarily attributable to the strong comparable store sales growth and the resulting benefit to inventory turns.
The increase in accrued benefits and withholdings is primarily due to the deferral of payroll tax payments under the CARES Act and the timing of Team Member incentive payments.
| --- | --- | --- |
| | ● | our quarterly results for the years ended December 31, 2019, and 2018; and |
FORWARD-LOOKING STATEMENTS
We claim the protection of the safe-harbor for forward-looking statements within the meaning of the Private Securities Litigation Reform Act of 1995.
You can identify these statements by forward-looking words such as “estimate,” “may,” “could,” “will,” “believe,” “expect,” “would,” “consider,” “should,” “anticipate,” “project,” “plan,” “intend” or similar words.
In addition, statements contained within this annual report that are not historical facts are forward-looking statements, such as statements discussing, among other things, expected growth, store development, integration and expansion strategy, business strategies, future revenues and future performance.
These forward-looking statements are based on estimates, projections, beliefs and assumptions and are not guarantees of future events and results.
Such statements are subject to risks, uncertainties and assumptions, including, but not limited to, the economy in general, inflation, tariffs, product demand, the market for auto parts, competition, weather, risks associated with the performance of acquired businesses, our ability to hire and retain qualified employees, consumer debt levels, our increased debt levels, credit ratings on public debt, governmental regulations, information security and cyber-attacks, terrorist activities, war and the threat of war.
Actual results may materially differ from anticipated results described or implied in these forward-looking statements.
Please refer to the “Risk Factors” section in this annual report on Form 10-K for the year ended December 31, 2019, and subsequent Securities and Exchange Commission filings, for additional factors that could materially affect our financial performance.
Forward-looking statements speak only as of the date they were made, and we undertake no obligation to publicly update any forward-looking statements, whether as a result of new information, future events or otherwise, except as required by applicable law.
Due to the nature of these macroeconomic
The sustained trends of low U.S. unemployment have been favorable to our industry through the support of miles driven and consumer confidence; however, this has also resulted in pressure on wages, particularly when combined with legislated wage increases in certain market areas.
We would expect to continue to see modest improvements in total miles driven in the U.S., supported by an increasing number of registered vehicles on the road, resulting in continued demand for automotive aftermarket products.
| | ● | After the close of business on December 31, 2018, we completed an asset purchase of Bennett, a privately held automotive parts supplier operating 33 stores and a warehouse in Florida. These stores were not operated by the Company in 2018 and were therefore not included in our 2018 store count. Beginning January 1, 2019, the operations of the acquired Bennett locations were included in the Company’s store count, consolidated financial statements and results of operations. During the year ended December 31, 2019, the Company merged 13 of these acquired Bennett stores into existing O’Reilly locations and rebranded the remaining 20 Bennett stores as O’Reilly stores. |
| | ● | Under the Company’s share repurchase program, as approved by our Board of Directors in January of 2011, we may, from time to time, repurchase shares of our common stock, solely through open market purchases effected through a broker dealer at prevailing market prices, based on a variety of factors such as price, corporate trading policy requirements and overall market conditions. Our Board of Directors may increase or otherwise modify, renew, suspend or terminate the share repurchase program at any time, without prior notice. As announced on May 31, 2019, and February 5, 2020, our Board of Directors approved a resolution each time to increase the authorization amount under our share repurchase program by an additional $1.00 billion, resulting in a cumulative authorization amount of $13.75 billion. Each additional authorization is effective for a |
| | | three-year period, beginning on its respective announcement date. As of February 28, 2020, we had repurchased approximately 77.1 million shares of our common stock at an aggregate cost of $12.54 billion under this program. |
| | ● | After the close of business on November 29, 2019, we completed the acquisition of Mayasa, a specialty retailer of automotive aftermarket parts headquartered in Guadalajara, Jalisco, Mexico pursuant to a stock purchase agreement. At the time of the acquisition, Mayasa operated six distribution centers, 21 Orma Autopartes stores and served over 2,000 independent jobber locations in 28 Mexican states. The results of Mayasa’s operations have been included in the Company’s consolidated financial statements and results of operations beginning from the date of acquisition. Pro forma results of operations related to the acquisition of Mayasa are not presented as Mayasa’s results are not material to the Company’s results of operations. |
| | | | | | | | | | |
| --- | --- | --- | --- | --- | --- | --- | --- | --- | --- |
| (1) | Each percentage of sales amount is computed independently and may not compute to presented totals. |
Sales:
| | | | |
| --- | --- | --- | --- |
| | | December 31, 2019 | |
| Comparable store sales | | $ | 375 |
| Sales for stores opened throughout 2018, excluding stores open at least one year that are included in comparable store sales | | | 87 |
| Sales for stores opened throughout 2019 and sales from the acquired Bennett and Mayasa stores | | | 141 |
| Non-store sales: | | | |
Transaction counts were flat for the year ended December 31, 2019, comprised of positive transaction counts for professional service provider customers, offset by negative transaction counts for DIY customers.
The increased complexity and replacement costs are a result of the current population of better-engineered and more technically advanced vehicles that require less frequent repairs, as the component parts are more durable and last for longer periods of time, which creates pressure on customer transaction counts.
However, when repairs are needed, the cost of replacement parts is, on average, greater, which benefits average ticket values.
Transaction counts for the year ended December 31, 2019, as compared to the same period in 2018, were also negatively impacted by wetter, cooler than normal temperatures in many of our markets during the first half of 2019, which is a headwind to DIY business.
DIY transaction counts continue to be impacted by the inflationary environment.
Gross profit:
Beginning in the last six months of 2018, inventory acquisition costs in our industry increased, as a result of tariffs on products imported from China and other increases in supplier input costs, which were passed through in higher retail and wholesale prices in our industry.
The increase in SG&A as a percentage of sales for the year ended December 31, 2019, was principally due to wage pressure, driven by a low unemployment, inflationary environment, and other variable costs, including health benefit costs and cost of insurance, primarily auto related, and increased spending on Omnichannel and technology initiatives.
Operating income:
Other income and expense:
During the years ended December 31, 2019 and 2018, excess tax benefits from share-based compensation were approximately $26 million and $35 million, respectively.
An excerpt. Shown here: 40 of 576 rewritten, 40 of 209 added and 40 of 298 removed. The counts are complete. For every sentence, read Item 7. Management’s Discussion and Analysis of Financial Condition and Results of Operations in the FY2020 filing and the FY2019 filing.
Item 1. Business
95 rewritten, 57 added, 38 removed, 305 unchanged
At December 31, [removed: 2019,] [added: 2020,] we operated [removed: 5,439] [added: 5,594] stores in 47 states in the United States and [removed: 21] [added: 22] stores in Mexico.
These risk factors include, among others, [added: risk related to the novel coronavirus (“COVID-19”) pandemic,] deteriorating economic conditions, competition in the automotive aftermarket business, our sensitivity to regional economic and weather conditions, [removed: future growth assurance,] our [removed: dependence upon key and other personnel, our] relationships with key suppliers and availability of key products, [removed: our acquisition strategies,] complications in our distribution centers (“DCs”), failure to [removed: achieve high levels of service] [added: protect our brand] and [removed: product quality,] [added: reputation, risks associated with international operations,] unanticipated fluctuations in our quarterly results, the volatility of the market price of our common stock, our increased debt levels, a downgrade in our credit ratings, [added: future growth assurance, our dependence upon key and other personnel, our acquisition strategies,] data [removed: security,] [added: security and] environmental legislation and other [removed: regulations and risks associated with international operations.][added: regulations.]
The execution of this strategy enables us to better compete by targeting a larger base of automotive aftermarket parts consumers, capitalizing on our existing [removed: retail] [added: store] and distribution infrastructure, operating profitably in both large markets and less densely populated geographic areas that typically attract fewer [removed: competitors,] [added: competitors] and enhancing service levels offered to DIY customers through the offering of a broad inventory and the extensive product knowledge required by professional service provider customers.
In [removed: 2019,] [added: 2020,] we derived approximately [removed: 56%] [added: 59%] of our sales from our DIY customers and approximately [removed: 44%] [added: 41%] of our sales from our professional service provider customers.
[removed: Historically,] [added: Over the long-term,] we have increased our sales to professional service provider customers at a faster pace than the increase in our sales to DIY customers due to the more fragmented nature of the professional service provider business, which offers a greater opportunity for consolidation.
We believe we will continue to have a competitive advantage on the professional service provider portion of our business, due to our systems, [removed: knowledge] [added: knowledge, industry-leading parts availability] and experience serving the professional service provider side of the automotive aftermarket, supported by our approximately [removed: 825] [added: 765] full-time sales staff dedicated solely to calling upon and servicing the professional service provider customer.
[added: Our strategic, regional,] tiered distribution network includes DCs and Hub stores.
To augment our robust distribution network, we operate a total of [removed: 356] [added: 362] Hub stores that also provide delivery service and same-day access to an average of [removed: 68,000] [added: 70,000] SKUs from a Super Hub or 42,000 SKUs from a Hub to other stores within the surrounding area.
We have a strong management [removed: team] [added: Team] comprised of 216 senior managers who average [removed: 21] [added: 20] years of [removed: service; 270] [added: service, 269] corporate managers who average 16 years of [removed: service;] [added: service] and [removed: 540] [added: 560] district managers who average [removed: 14] [added: 13] years of service.
Our management [removed: team] [added: Team] has demonstrated the consistent ability to successfully execute our business plan and growth strategy by generating [removed: 27] [added: 28] consecutive years of record revenues and earnings and positive comparable store sales results since becoming a public company in April of 1993.
In [removed: 2020,] [added: 2021,] we plan to open [removed: approximately 180] [added: 165 to 175] net, new stores, which will increase our penetration in existing markets and allow for expansion into new, contiguous markets.
The automotive aftermarket industry is still highly fragmented, and we believe the ability of national auto parts chains, like O’Reilly, to operate more efficiently and effectively than smaller independent [removed: operators,] [added: operators] will result in continued industry consolidation.
[removed: Our intention] is to continue to selectively pursue strategic acquisitions that will strengthen our position as a leading automotive aftermarket parts supplier in existing markets and provide a springboard for expansion into new [removed: markets.][added: markets, domestic and cross-border.]
Our current prototype store design features optimized square footage, high ceilings, convenient interior store layouts, in-store signage, bright lighting, convenient ingress, egress and [removed: parking,] [added: parking] and dedicated counters to serve professional service provider customers, each designed to increase sales and operating efficiencies to enhance overall customer service.
During [removed: 2019,] [added: 2020, while experiencing constraints to construction timing due to the COVID-19 pandemic,] we relocated [removed: 12] [added: 16] stores and performed minor to major updates or renovations to approximately [removed: 1,500] [added: 970] additional stores.
Many of our customers interact over multiple channels to research and complete a purchase, and the functionality and features of our digital sites complements the outstanding customer service provided in our over [removed: 5,400] [added: 5,600] brick and mortar locations.
[removed: Team Members][added: Team Members and Unions:]
As of January 31, [removed: 2020,] [added: 2021,] we employed [removed: 82,167] [added: 77,827] Team Members [removed: (53,159] [added: (62,530] full-time Team Members and [removed: 29,008] [added: 15,297] part-time Team Members), of whom [removed: 68,679] [added: 63,212] were employed at our U.S. stores, [removed: 8,607] [added: 9,593] were employed at our U.S. DCs, [removed: 3,620] [added: 3,625] were employed at our U.S. corporate and regional [removed: offices,] [added: offices] and [removed: 1,261] [added: 1,397] were employed in Mexico.
[removed: A union represents 50 stores (489 Team Members) in the Greater Bay Area in California and has for many years, and approximately 34] [added: Approximately 63] Team Members [removed: who] [added: that] drive over-the-road trucks in two of our domestic DCs are [added: also] represented by [added: a] labor [removed: unions as well.][added: union.]
Our tradition for [removed: 63] [added: 64] years has been to treat all of our Team Members with honesty and respect and to commit significant resources to instill in them our “Live Green” culture, which emphasizes the importance of each Team Member’s contribution to the success of O’Reilly.
| | ● | demographics, including age, [removed: ethnicity,] life style and per capita income; |
As these store clusters mature, we evaluate the need to open additional locations in the more densely populated markets where we believe opportunities exist to expand our market share or to [added: improve the level of service provided in high volume areas.]
At December 31, [removed: 2019,] [added: 2020,] we had a total of approximately [removed: 40] [added: 42] million square feet in our [removed: 5,439] [added: 5,594] domestic stores.
Our domestic stores are served primarily by the nearest DC, which averages 159,000 SKUs, but also have same-day access to the broad selection of inventory available at one of our [removed: 356] [added: 362] Hub stores, which are comprised of [removed: 85] [added: 88] Super Hubs that average approximately [removed: 15,700] [added: 17,100] square feet and carry an average of [removed: 68,000] [added: 70,000] SKUs and [removed: 271] [added: 274] Hubs that average approximately [removed: 10,000] [added: 10,200] square feet and carry an average of 42,000 SKUs.
The following table sets forth the geographic distribution and activity of our stores as of December 31, [removed: 2019] [added: 2020] and [removed: 2018:][added: 2019:]
| | | [removed: ] [added: December 31, 2019] | [removed: ] | [removed: ] | [removed: ] | | [removed: 2019] [added: 2020] Net, New [removed: and] [added: Stores] | | | | | [removed: ] [added: December 31, 2020] | [removed: ] | [removed: ] | [removed: ] | [removed: ] | [removed: ] | [removed: ] |
| Texas | | [removed: 706] [added: 735] | | 13.5 | % | | [removed: 29] [added: 20] | | [removed: 13.2] [added: 12.9] | % | | [removed: 735] [added: 755] | | 13.5 | % | | 13.5 | % |
| Ohio | | [removed: 196] [added: 203] | | [removed: 3.8] [added: 3.7] | % | | [removed: 7] [added: 8] | | [removed: 3.2] [added: 5.2] | % | | [removed: 203] [added: 211] | | [removed: 3.7] [added: 3.8] | % | | [removed: 43.3] [added: 39.5] | % |
| North Carolina | | [removed: 173] [added: 185] | | [removed: 3.3] [added: 3.4] | % | | [removed: 12] [added: 14] | | [removed: 5.5] [added: 9.0] | % | | [removed: 185] [added: 199] | | [removed: 3.4] [added: 3.6] | % | | 46.7 | % |
| South Carolina | | [removed: 108] [added: 110] | | [removed: 2.1] [added: 2.0] | % | | [removed: 2] [added: 5] | | [removed: 0.9] [added: 3.2] | % | | [removed: 110] [added: 115] | | [removed: 2.0] [added: 2.1] | % | | [removed: 77.4] [added: 77.2] | % |
| Kentucky | | [removed: 95] [added: 101] | | [removed: 1.7] [added: 1.9] | % | | [removed: 6] [added: 4] | | 2.7 | % | | [removed: 101] [added: 105] | | 1.9 | % | | [removed: 81.2] [added: 81.0] | % |
| Virginia | | [removed: 78] [added: 85] | | [removed: 1.5] [added: 1.7] | % | | [removed: 7] [added: 5] | | 3.2 | % | | [removed: 85] [added: 90] | | [removed: 1.7] [added: 1.6] | % | | [removed: 84.6] [added: 82.6] | % |
| New Mexico | | [removed: 56] [added: 60] | | 1.1 | % | | [removed: 4] [added: —] | | [removed: 1.8] [added: —] | % | | 60 | | 1.1 | % | | [removed: 91.1] [added: 90.6] | % |
| Nebraska | | [removed: 45] [added: 47] | | 0.9 | % | | 2 | | [removed: 0.9] [added: 1.3] | % | | [removed: 47] [added: 49] | | 0.9 | % | | [removed: 93.0] [added: 93.4] | % |
| Massachusetts | | [removed: 39] [added: 46] | | [removed: 0.7] [added: 0.8] | % | | [removed: 7] [added: 5] | | 3.2 | % | | [removed: 46] [added: 51] | | [removed: 0.8] [added: 0.9] | % | | [removed: 93.8] [added: 92.5] | % |
| New Hampshire | | 32 | | 0.6 | % | | [removed: —] [added: 1] | | [removed: —] [added: 0.6] | % | | [removed: 32] [added: 33] | | 0.6 | % | | [removed: 96.4] [added: 96.2] | % |
| Montana | | 28 | | 0.5 | % | | — | | — | % | | 28 | | 0.5 | % | | [removed: 96.9] [added: 96.7] | % |
| Vermont | | 24 | | [removed: 0.5] [added: 0.4] | % | | — | | — | % | | 24 | | 0.4 | % | | [removed: 97.3] [added: 97.6] | % |
| South Dakota | | 18 | | 0.3 | % | | [removed: —] [added: 1] | | [removed: —] [added: 0.6] | % | | [removed: 18] [added: 19] | | 0.3 | % | | [removed: 98.4] [added: 98.7] | % |
| West Virginia | | [removed: 15] [added: 17] | | 0.3 | % | | [removed: 2] [added: 1] | | [removed: 0.9] [added: 0.6] | % | | [removed: 17] [added: 18] | | 0.3 | % | | [removed: 98.7] [added: 99.0] | % |
During 2020, we opened 155 net, new domestic stores and one new store in Mexico.
Our intention
Team Members and Human Capital Management
We are also committed to providing a work environment where Team Members feel highly valued and where productivity at work is enhance by maintaining an inclusive environment and healthy work/life balance, which we believe increases employee engagement.
Our ongoing emphasis on diversity and inclusion, including further ensuring our policies, recruitment and selection procedures, onboarding tactics and training efforts, positively builds upon our successful “promote from within” philosophy and growth strategies.
Our Company knows the value of a tenured Team, which is why our philosophy is to “promote from within” first.
As management opportunities arise, we look first within the Company and promote those who have performed well, have the right expertise and have shown leadership potential before looking outside the Company; however, we augment this philosophy by pursuing strategic hires with a strong emphasis on automotive aftermarket experience when appropriate.
This comprehensive approach increases Team Member commitment and has resulted in a very experienced leadership Team.
As of December 31, 2020, our strong management Team was comprised of 216 senior managers who average 20 years of service, 269 corporate managers who average 16 years of service and 560 district managers who average 13 years of service.
In
Ours is an increasingly technical business creating the need for knowledgeable Professional Parts People, and our ongoing focus on developing a technically proficient Team has resulted in the growth of our full-time work force, increasing to 80% as of January 31, 2021, up from 65% as of January 31, 2020.
While full-time Professional Parts People play a vital role in our ongoing success, the flexibility of incorporating part-time employment into our work force is also an important component of providing excellent customer service.
Many of our part-time Team Members choose to work at O’Reilly while attending school, or during other transitional periods in their lives, or simply because of their passion for cars and knowledge of auto parts.
Part-time Team Members have the opportunity to become career Professional Parts People because of our promote from within philosophy, and many of our leaders today began their careers as part-time Team Members in our stores or distribution centers.
A union represents Team Members in 53 stores (408 Team Members) in the Greater Bay Area in California and has for many years.
In addition, the Company has collective bargaining agreements with two unions in Mexico, where the legal environment is very different and evolving compared to the U.S. Our relationships with unions in Mexico will continue to evolve to ensure compliance with changing requirements.
We consider our current relationship with these unions and union Team Members to be excellent.
| California | | 554 | | 10.2 | % | | 8 | | 5.2 | % | | 562 | | 10.0 | % | | 23.5 | % |
| Florida | | 239 | | 4.4 | % | | 7 | | 4.5 | % | | 246 | | 4.4 | % | | 27.9 | % |
| Georgia | | 214 | | 3.9 | % | | 10 | | 6.5 | % | | 224 | | 4.0 | % | | 31.9 | % |
| Illinois | | 211 | | 3.9 | % | | 2 | | 1.3 | % | | 213 | | 3.8 | % | | 35.7 | % |
| Missouri | | 203 | | 3.7 | % | | 1 | | 0.6 | % | | 204 | | 3.6 | % | | 43.1 | % |
| Tennessee | | 183 | | 3.4 | % | | 2 | | 1.3 | % | | 185 | | 3.3 | % | | 50.0 | % |
| Michigan | | 175 | | 3.2 | % | | 6 | | 3.9 | % | | 181 | | 3.2 | % | | 53.2 | % |
| Washington | | 158 | | 2.9 | % | | — | | — | % | | 158 | | 2.8 | % | | 56.0 | % |
| Indiana | | 147 | | 2.7 | % | | 9 | | 5.8 | % | | 156 | | 2.8 | % | | 58.8 | % |
| Alabama | | 147 | | 2.7 | % | | 5 | | 3.2 | % | | 152 | | 2.7 | % | | 61.5 | % |
| Arizona | | 140 | | 2.6 | % | | 2 | | 1.3 | % | | 142 | | 2.5 | % | | 64.0 | % |
| Wisconsin | | 124 | | 2.3 | % | | 4 | | 2.7 | % | | 128 | | 2.3 | % | | 66.3 | % |
| Louisiana | | 124 | | 2.3 | % | | 3 | | 1.9 | % | | 127 | | 2.3 | % | | 68.6 | % |
| Minnesota | | 126 | | 2.3 | % | | (2) | | (1.3) | % | | 124 | | 2.2 | % | | 70.8 | % |
| Oklahoma | | 122 | | 2.2 | % | | 2 | | 1.3 | % | | 124 | | 2.2 | % | | 73.0 | % |
| Arkansas | | 114 | | 2.1 | % | | 3 | | 1.9 | % | | 117 | | 2.1 | % | | 75.1 | % |
| Colorado | | 105 | | 1.9 | % | | 4 | | 2.7 | % | | 109 | | 1.9 | % | | 79.1 | % |
| Kansas | | 85 | | 1.7 | % | | 1 | | 0.6 | % | | 86 | | 1.5 | % | | 84.1 | % |
| Mississippi | | 80 | | 1.5 | % | | 2 | | 1.3 | % | | 82 | | 1.5 | % | | 85.6 | % |
| Iowa | | 78 | | 1.4 | % | | 2 | | 1.3 | % | | 80 | | 1.4 | % | | 87.0 | % |
| Oregon | | 72 | | 1.3 | % | | (1) | | (0.6) | % | | 71 | | 1.3 | % | | 88.3 | % |
| Utah | | 65 | | 1.2 | % | | 1 | | 0.6 | % | | 66 | | 1.2 | % | | 89.5 | % |
| Nevada | | 56 | | 1.0 | % | | 1 | | 0.6 | % | | 57 | | 1.0 | % | | 91.6 | % |
| | ● | machine shops; |
Our strategic, regional,
During 2019, we opened 200 net, new domestic stores, as well as 20 net, additional stores from the Bennett Auto Supply (“Bennett”), Inc. acquisition and 21 additional stores from the Mayasa acquisition.
In addition, the Company assumed collective bargaining agreements with various unions in Mexico in connection with its acquisition of Mayasa; however, none of the Company’s Team Members are specifically affiliated with, or members of, those unions.
improve the level of service provided in high volume areas.
| | | December 31, 2018 | | | | | Acquired Stores | | | | | December 31, 2019 | | | | | | |
| California | | 553 | | 10.6 | % | | 1 | | 0.5 | % | | 554 | | 10.2 | % | | 23.7 | % |
| Florida | | 200 | | 3.8 | % | | 39 | | 17.7 | % | | 239 | | 4.4 | % | | 28.1 | % |
| Georgia | | 205 | | 3.9 | % | | 9 | | 4.1 | % | | 214 | | 3.9 | % | | 32.0 | % |
| Illinois | | 203 | | 3.9 | % | | 8 | | 3.6 | % | | 211 | | 3.9 | % | | 35.9 | % |
| Missouri | | 201 | | 3.9 | % | | 2 | | 0.9 | % | | 203 | | 3.7 | % | | 39.6 | % |
| Tennessee | | 176 | | 3.4 | % | | 7 | | 3.2 | % | | 183 | | 3.4 | % | | 50.1 | % |
| Michigan | | 168 | | 3.2 | % | | 7 | | 3.2 | % | | 175 | | 3.2 | % | | 53.3 | % |
| Washington | | 156 | | 3.0 | % | | 2 | | 0.9 | % | | 158 | | 2.9 | % | | 56.2 | % |
| Alabama | | 139 | | 2.7 | % | | 8 | | 3.6 | % | | 147 | | 2.7 | % | | 58.9 | % |
| Indiana | | 137 | | 2.6 | % | | 10 | | 4.5 | % | | 147 | | 2.7 | % | | 61.6 | % |
| Arizona | | 139 | | 2.7 | % | | 1 | | 0.5 | % | | 140 | | 2.6 | % | | 64.2 | % |
| Minnesota | | 125 | | 2.4 | % | | 1 | | 0.5 | % | | 126 | | 2.3 | % | | 66.5 | % |
| Louisiana | | 121 | | 2.3 | % | | 3 | | 1.3 | % | | 124 | | 2.3 | % | | 68.8 | % |
| Wisconsin | | 121 | | 2.3 | % | | 3 | | 1.3 | % | | 124 | | 2.3 | % | | 71.1 | % |
| Oklahoma | | 121 | | 2.3 | % | | 1 | | 0.5 | % | | 122 | | 2.2 | % | | 73.3 | % |
| Arkansas | | 112 | | 2.1 | % | | 2 | | 0.9 | % | | 114 | | 2.1 | % | | 75.4 | % |
| Colorado | | 102 | | 2.0 | % | | 3 | | 1.3 | % | | 105 | | 1.9 | % | | 79.3 | % |
| Kansas | | 85 | | 1.6 | % | | — | | — | % | | 85 | | 1.7 | % | | 82.9 | % |
| Mississippi | | 78 | | 1.5 | % | | 2 | | 0.9 | % | | 80 | | 1.5 | % | | 86.1 | % |
| Iowa | | 77 | | 1.5 | % | | 1 | | 0.5 | % | | 78 | | 1.4 | % | | 87.5 | % |
| Oregon | | 70 | | 1.3 | % | | 2 | | 0.9 | % | | 72 | | 1.3 | % | | 88.8 | % |
| Utah | | 64 | | 1.2 | % | | 1 | | 0.5 | % | | 65 | | 1.2 | % | | 90.0 | % |
| Nevada | | 56 | | 1.1 | % | | — | | — | % | | 56 | | 1.0 | % | | 92.1 | % |
| Idaho | | 44 | | 0.8 | % | | 1 | | 0.5 | % | | 45 | | 0.8 | % | | 94.6 | % |
| Maine | | 35 | | 0.7 | % | | (1) | | (0.5) | % | | 34 | | 0.6 | % | | 95.2 | % |
| Pennsylvania | | 24 | | 0.5 | % | | 9 | | 4.1 | % | | 33 | | 0.6 | % | | 95.8 | % |
| Connecticut | | 20 | | 0.4 | % | | 3 | | 1.3 | % | | 23 | | 0.4 | % | | 97.7 | % |
| Wyoming | | 21 | | 0.4 | % | | 1 | | 0.5 | % | | 22 | | 0.4 | % | | 98.1 | % |
| New York | | 3 | | 0.1 | % | | 14 | | 6.4 | % | | 17 | | 0.3 | % | | 99.0 | % |
As of December 31, 2019, we had a total growth capacity of more than 695 stores in our distribution center network.
Further enhancing our distribution capabilities in 2020, we plan to relocate and merge our existing Nashville, Tennessee, and Knoxville, Tennessee, DCs into a larger facility located in Lebanon, Tennessee, providing a larger, more efficient facility to serve both markets, while also allowing us to convert the existing Knoxville, Tennessee, DC into a large Hub that will continue to provide same day parts availability in the attractive Knoxville market.
Additionally, we plan to open a new DC in Horn Lake, Mississippi, in 2020.
An excerpt. Shown here: 40 of 95 rewritten, 40 of 57 added and all 38 removed. The counts are complete. For every sentence, read Item 1. Business in the FY2020 filing and the FY2019 filing.
Cover and table of contents
17 rewritten, 2 added, 1 removed, 84 unchanged
WASHINGTON, [removed: DC] [added: D.C.] 20549
For the fiscal year ended December 31, [removed: 2019][added: 2020]
At June 30, [removed: 2019,] [added: 2020,] the aggregate market value of the voting stock held by non-affiliates of the Company was [removed: $23,433,046,431] [added: $25,984,638,678] based on the last price of the common stock reported by The NASDAQ Global Select Market.
At February [removed: 24, 2020,] [added: 22, 2021,] an aggregate of [removed: 74,897,080] [added: 70,206,669] shares of common stock of the registrant were outstanding.
Portions of the definitive proxy statement for the [removed: 2020] [added: 2021] Annual Meeting of Shareholders to be filed with the Securities and Exchange Commission within 120 days after December 31, [removed: 2019,] [added: 2020,] are incorporated by reference into Part III.
FOR THE YEAR ENDED DECEMBER 31, [removed: 2019][added: 2020]
| [Item 1A.](#Item1ARiskFactors_428092) | [Risk Factors](#Item1ARiskFactors_428092) | [removed: 14] [added: 15] |
| [Item 1B.](#Item1BUnresolvedStaffComments_370595) | [Unresolved Staff Comments](#Item1BUnresolvedStaffComments_370595) | [removed: 18] [added: 20] |
| [Item 2.](#Item2Properties_805477) | [Properties](#Item2Properties_805477) | [removed: 18] [added: 20] |
| [Item 3.](#Item3LegalProceedings_233756) | [Legal Proceedings](#Item3LegalProceedings_233756) | [removed: 19] [added: 21] |
| [Item 4.](#Item4MineSafetyDisclosures_603933) | [Mine Safety Disclosures](#Item4MineSafetyDisclosures_603933) | [removed: 19] [added: 21] |
| [Item 5.](#Item5MarketForRegistrantsCommonEquityRel) | [Market for Registrant’s Common Equity, Related Stockholder Matters and Issuer Purchases of Equity Securities](#Item5MarketForRegistrantsCommonEquityRel) | [removed: 20] [added: 22] |
| [Item 6.](#Item6SelectedFinancialData_732535) | [Selected Financial Data](#Item6SelectedFinancialData_732535) | [removed: 22] [added: 24] |
| [Item 7.](#Item7ManagementsDiscussionandAnalysisofF) | [Management’s Discussion and Analysis of Financial Condition and Results of Operations](#Item7ManagementsDiscussionandAnalysisofF) | [removed: 24] [added: 26] |
| [Item 12.](#Item12SecurityOwnershipofCertainBenefici) | [Security Ownership of Certain Beneficial Owners and Management and Related Shareholder Matters](#Item12SecurityOwnershipofCertainBenefici) | [removed: 74] [added: 75] |
Such statements are subject to risks, uncertainties and assumptions, including, but not limited to, the [added: COVID-19 pandemic or other public health crises, the] economy in general, inflation, [removed: tariffs,] [added: consumer debt levels,] product demand, the market for auto parts, competition, weather, [added: tariffs, terrorist activities, war and the threat of war,] risks associated with the performance of acquired businesses, our [removed: ability to hire and retain qualified employees, consumer debt levels, our] increased debt levels, credit ratings on public debt, [removed: governmental regulations,] [added: our ability to hire and retain qualified employees,] information security and [removed: cyber-attacks, terrorist activities, war] [added: cyber-attacks] and [removed: the threat of war.][added: governmental regulations.]
Please refer to the “Risk Factors” section in this annual report on Form 10-K for the year ended December 31, [removed: 2019,] [added: 2020,] and subsequent Securities and Exchange Commission filings, for additional factors that could materially affect our financial performance.

Indicate by check mark whether the registrant has filed a report on and attestation to its management’s assessment of the effectiveness of its internal control over financial reporting under Section 404(b) of the Sarbanes-Oxley Act (15 U.S.C. 7262(b)) by the registered public accounting firm that prepared or issued its audit report.
Item 5. Market for Registrant’s Common Equity, Related Stockholder Matters and Issuer Purchases of Equity Securities
11 rewritten, 6 added, 6 removed, 15 unchanged
As of February [removed: 14, 2020,] [added: 18, 2021,] the Company had approximately [removed: 392,000] [added: 420,000] shareholders of common stock based on the number of holders of record and an estimate of individual participants represented by security position listings.
There were no sales of unregistered securities during the year ended December 31, [removed: 2019.][added: 2020.]
The following table identifies all repurchases during the fourth quarter ended December 31, [removed: 2019,] [added: 2020,] of any of the Company’s securities registered under Section 12 of the Securities Exchange Act of 1934, as amended, by or on behalf of the Company or any affiliated purchaser (in thousands, except per share data):
| (1) | Under the Company’s share repurchase program, as approved by its Board of Directors on January 11, 2011, the Company may, from time to time, repurchase shares of its common stock, solely through open market purchases effected through a broker dealer at prevailing market prices, based on a variety of factors such as price, corporate trading policy requirements and overall market conditions not to exceed a dollar limit authorized by the Board of Directors. The Company’s Board of Directors may increase or otherwise modify, renew, suspend or terminate the share repurchase program at any time, without prior notice. As announced on [removed: May 31, 2019, and] February 5, 2020, [added: October 28, 2020, and February 10, 2021,] the Company’s Board of Directors each time approved a resolution to increase the authorization amount under the share repurchase program by an additional $1.0 billion, resulting in a cumulative authorization amount of [removed: $13.8] [added: $15.8] billion. Each additional authorization is effective for a three–year period, beginning on its respective announcement date. The authorizations under the share repurchase program that currently have capacity are scheduled to expire on [removed: May 31, 2022,] [added: October 28, 2023] and February [removed: 5, 2023.] [added: 10, 2024.] No other share repurchase programs existed during the twelve months ended December 31, [removed: 2019.] [added: 2020.] |
The Company repurchased a total of [removed: 3.9] [added: 4.8] million shares of its common stock under its publicly announced share repurchase program during the year ended December 31, [removed: 2019,] [added: 2020,] at an average price per share of [removed: $369.55,] [added: $431.93,] for a total investment of [removed: $1.4] [added: $2.1] billion.
Subsequent to the end of the year and through February [removed: 28, 2020,] [added: 26, 2021,] the Company repurchased an additional [removed: 0.9] [added: 1.1] million shares of its common stock, at an average price per share of [removed: $400.78,] [added: $447.49,] for a total investment of [removed: $363.4] [added: $478.4] million.
The Company has repurchased a total of [removed: 77.1] [added: 82.1] million shares of its common stock under its share repurchase program since the inception of the program in January of 2011 and through February [removed: 28, 2020,] [added: 26, 2021,] at an average price of [removed: $162.72,] [added: $179.65,] for a total aggregate investment of [removed: $12.5] [added: $14.7] billion.
The graph below shows the cumulative total shareholder return assuming the investment of $100, on December 31, [removed: 2014,] [added: 2015,] and the reinvestment of dividends thereafter, if any, in the Company’s common stock versus the Standard and Poor’s S&P 500 Retail Index (“S&P 500 Retail Index”) and the Standard and Poor’s S&P 500 Index (“S&P 500”).
[removed: ][added: 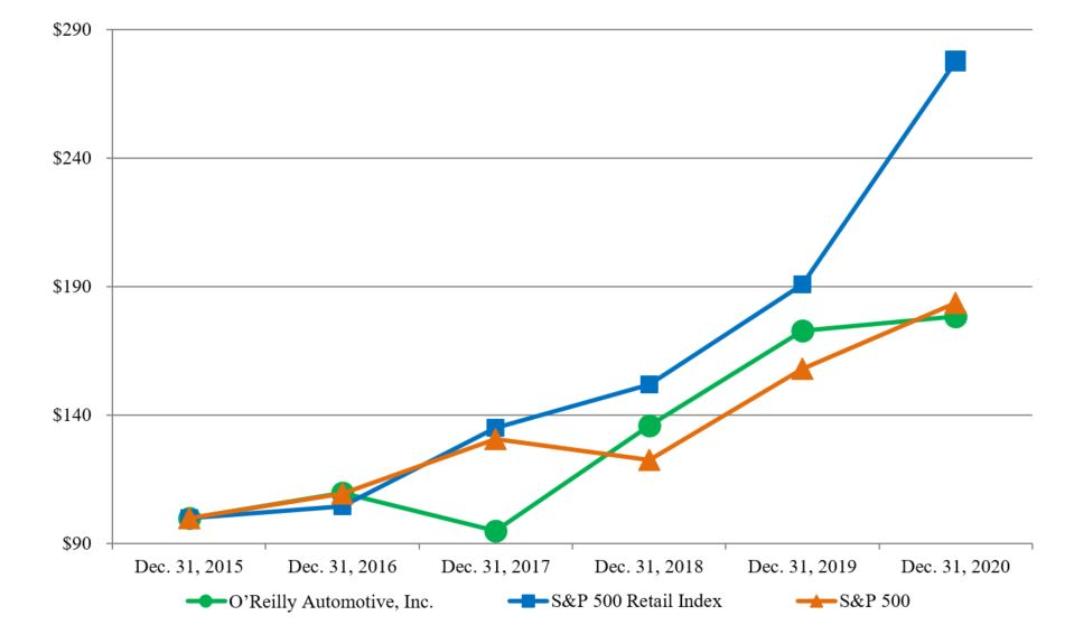]
| Company/Index | | [removed: 2014 | | |] 2015 | | | 2016 | | | 2017 | | | 2018 | | | 2019 | | [added: | 2020 | |]
| O’Reilly Automotive, Inc. | | $ | 100 | | $ | [removed: 132] [added: 110] | | $ | [removed: 145] [added: 95] | | $ | [removed: 125] [added: 136] | | $ | [removed: 179] [added: 173] | | $ | [removed: 228] [added: 179] |
| October 1, 2020, to October 31, 2020 | | 779 | | $ | 457.71 | | 779 | | $ | 1,118,244 |
| November 1, 2020, to November 30, 2020 | | 714 | | | 449.32 | | 714 | | | 797,226 |
| December 1, 2020, to December 31, 2020 | | 705 | | | 448.08 | | 705 | | $ | 481,538 |
| Total as of December 31, 2020 | | 2,198 | | $ | 451.90 | | 2,198 | | | |
| S&P 500 Retail Index | | | 100 | | | 105 | | | 135 | | | 152 | | | 191 | | | 278 |
| S&P 500 | | $ | 100 | | $ | 110 | | $ | 131 | | $ | 123 | | $ | 158 | | $ | 184 |
| October 1, 2019, to October 31, 2019 | | 88 | | $ | 393.84 | | 88 | | $ | 658,656 |
| November 1, 2019, to November 30, 2019 | | 61 | | | 441.75 | | 61 | | | 631,663 |
| December 1, 2019, to December 31, 2019 | | 143 | | | 441.93 | | 143 | | $ | 568,684 |
| Total as of December 31, 2019 | | 292 | | $ | 427.33 | | 292 | | | |
| S&P 500 Retail Index | | | 100 | | | 124 | | | 130 | | | 168 | | | 189 | | | 237 |
| S&P 500 | | $ | 100 | | $ | 99 | | $ | 109 | | $ | 130 | | $ | 122 | | $ | 157 |
Item 6. Selected Financial Data
41 rewritten, 1 added, 2 removed, 46 unchanged
| Years ended December 31, | | [added: 2020 | |] 2019 | | 2018 | | 2017 | | 2016 | | 2015 | | 2014 | | 2013 | | 2012 | | 2011 | | [removed: 2010 | |]
| Sales ($) | | [removed: 10,149,985] [added: 11,604,493] | | [added: 10,149,985 | |] 9,536,428 | | 8,977,726 | | 8,593,096 | | 7,966,674 | | 7,216,081 | | 6,649,237 | | 6,182,184 | | 5,788,816 | | [removed: 5,397,525 | |]
| Cost of goods sold, including warehouse and distribution expenses | | [removed: 4,755,294] [added: 5,518,801] | | [added: 4,755,294 | |] 4,496,462 | | 4,257,043 | | 4,084,085 | | 3,804,031 | | 3,507,180 | | 3,280,236 | | 3,084,766 | | 2,951,467 | | [removed: 2,776,533 | |]
| Gross profit | | [removed: 5,394,691] [added: 6,085,692] | | [added: 5,394,691 | |] 5,039,966 | | 4,720,683 | | 4,509,011 | | 4,162,643 | | 3,708,901 | | 3,369,001 | | 3,097,418 | | 2,837,349 | | [removed: 2,620,992 | |]
| Selling, general and administrative expenses | | [removed: 3,473,965] [added: 3,666,356] | | [added: 3,473,965 | |] 3,224,782 | | 2,995,283 | | 2,809,805 | | 2,648,622 | | 2,438,527 | | 2,265,516 | | 2,120,025 | | 1,973,381 | | [removed: 1,887,316 | |]
| Former CSK officer clawback | | — | | — | | — | | — | | — | | — | | — | | — | | [removed: (2,798)] [added: —] | | [removed: —] [added: (2,798)] | |
| Operating income | | [removed: 1,920,726] [added: 2,419,336] | | [added: 1,920,726 | |] 1,815,184 | | 1,725,400 | | 1,699,206 | | 1,514,021 | | 1,270,374 | | 1,103,485 | | 977,393 | | 866,766 | | [removed: 712,776 | |]
| Write-off of asset-based revolving credit agreement debt issuance costs | | — | | — | | — | | — | | — | | — | | — | | — | | [removed: (21,626)] [added: —] | | [removed: —] [added: (21,626)] | |
| Termination of interest rate swap agreements | | — | | — | | — | | — | | — | | — | | — | | — | | [removed: (4,237)] [added: —] | | [removed: —] [added: (4,237)] | |
| Other income (expense), net | | [removed: (130,397)] [added: (152,931)] | | [added: (130,397) | |] (121,097) | | (87,596) | | (62,015) | | (53,655) | | (48,192) | | (44,543) | | (35,872) | | (25,130) | | [removed: (35,042) | |]
| Total other income (expense) | | [removed: (130,397)] [added: (152,931)] | | [added: (130,397) | |] (121,097) | | (87,596) | | (62,015) | | (53,655) | | (48,192) | | (44,543) | | (35,872) | | (50,993) | | [removed: (23,403) | |]
| Income before income taxes | | [removed: 1,790,329] [added: 2,266,405] | | [added: 1,790,329 | |] 1,694,087 | | 1,637,804 | | 1,637,191 | | 1,460,366 | | 1,222,182 | | 1,058,942 | | 941,521 | | 815,773 | | [removed: 689,373 | |]
| Provision for income taxes (a)(b) | | [removed: 399,287] [added: 514,103] | | [added: 399,287 | |] 369,600 | | 504,000 | | 599,500 | | 529,150 | | 444,000 | | 388,650 | | 355,775 | | 308,100 | | [removed: 270,000 | |]
| Net income ($) (a)(b) | | [removed: 1,391,042] [added: 1,752,302] | | [added: 1,391,042 | |] 1,324,487 | | 1,133,804 | | 1,037,691 | | 931,216 | | 778,182 | | 670,292 | | 585,746 | | 507,673 | | [removed: 419,373 | |]
| Earnings per share – basic ($) | | [removed: 18.07] [added: 23.74] | | [added: 18.07 | |] 16.27 | | 12.82 | | 10.87 | | 9.32 | | 7.46 | | 6.14 | | 4.83 | | 3.77 | | [removed: 3.02 | |]
| Weighted-average common shares outstanding – basic | | [removed: 76,985] [added: 73,817] | | [added: 76,985 | |] 81,406 | | 88,426 | | 95,447 | | 99,965 | | 104,262 | | 109,244 | | 121,182 | | 134,667 | | [removed: 138,654 | |]
| Earnings per share – assuming dilution ($) | | [removed: 17.88] [added: 23.53] | | [added: 17.88 | |] 16.10 | | 12.67 | | 10.73 | | 9.17 | | 7.34 | | 6.03 | | 4.75 | | 3.71 | | [removed: 2.95 | |]
| Weighted-average common shares outstanding – assuming dilution | | [removed: 77,788] [added: 74,462] | | [added: 77,788 | |] 82,280 | | 89,502 | | 96,720 | | 101,514 | | 106,041 | | 111,101 | | 123,314 | | 136,983 | | [removed: 141,992 | |]
| Number of Team Members at year end (c) | | [removed: 81,223] [added: 76,257] | | [added: 81,223 | |] 78,882 | | 75,552 | | 74,580 | | 71,621 | | 67,569 | | 61,909 | | 53,063 | | 49,324 | | [removed: 46,858 | |]
| Total number of stores at year end (d)(e) | | [removed: 5,460] [added: 5,616] | | [added: 5,460 | |] 5,219 | | 5,019 | | 4,829 | | 4,571 | | 4,366 | | 4,166 | | 3,976 | | 3,740 | | [removed: 3,570 | |]
| Number of U.S. stores at year end (d) | | [removed: 5,439] [added: 5,594] | | [added: 5,439 | |] 5,219 | | 5,019 | | 4,829 | | 4,571 | | 4,366 | | 4,166 | | 3,976 | | 3,740 | | [removed: 3,570 | |]
| Number of Mexico stores at year end (e) | | [removed: 21] [added: 22] | | [removed: —] [added: 21] | | [removed: —] [added: —] | | [removed: —] [added: —] | | [removed: —] [added: —] | | [removed: —] [added: —] | | [removed: —] [added: —] | | [removed: —] [added: —] | | [removed: —] [added: —] | | [removed: —] [added: —] | |
| Store square footage at year end (c)(f) | | [removed: 40,227] [added: 41,668] | | [added: 40,227 | |] 38,455 | | 36,685 | | 35,123 | | 33,148 | | 31,591 | | 30,077 | | 28,628 | | 26,530 | | [removed: 25,315 | |]
| Sales per weighted-average store ($) (c)(g) | | [removed: 1,881] [added: 2,057] | | [added: 1,881 | |] 1,842 | | 1,807 | | 1,826 | | 1,769 | | 1,678 | | 1,614 | | 1,590 | | 1,566 | | [removed: 1,527 | |]
| Sales per weighted-average square foot ($) (c)(f)(h) | | [removed: 255] [added: 277] | | [added: 255 | |] 251 | | 248 | | 251 | | 244 | | 232 | | 224 | | 224 | | 221 | | [removed: 216 | |]
| Percentage increase in comparable store sales (c)(i) | | [removed: 4.0] [added: 10.9] | % | [added: 4.0 | % |] 3.8 | % | 1.4 | % | 4.8 | % | 7.5 | % | 6.0 | % | 4.6 | % | 3.5 | % | 4.6 | % | [removed: 8.8 | % |]
| Working capital ($) (j) | | [removed: (635,765)] [added: (762,630)] | | [added: (635,765) | |] (350,918) | | (249,694) | | (142,674) | | (36,372) | | 252,082 | | 430,832 | | 478,093 | | 1,028,330 | | [removed: 1,029,861 | |]
| Total assets ($) (j) | | [removed: 10,717,160] [added: 11,596,642] | | [added: 10,717,160 | |] 7,980,789 | | 7,571,885 | | 7,204,189 | | 6,676,684 | | 6,532,083 | | 6,057,895 | | 5,741,241 | | 5,494,174 | | [removed: 5,031,950 | |]
| Inventory turnover [removed: (c)(k)] [added: (k)] | | [removed: 1.4] [added: 1.5] | | 1.4 | | 1.4 | | [added: 1.4 | |] 1.5 | | 1.5 | | 1.4 | | 1.4 | | 1.4 | | 1.5 | | [removed: 1.4 | |]
| Accounts payable to inventory [removed: (c)(l)] [added: (l)] | | [removed: 104.6] [added: 114.5] | % | [added: 104.4 | % |] 105.7 | % | 106.0 | % | 105.7 | % | 99.1 | % | 94.6 | % | 86.6 | % | 84.7 | % | 64.4 | % | [removed: 44.3 | % |]
| Current portion of long-term debt and short-term debt ($) | | — | | — | | — | | — | | — | | [added: — | |] 25 | | 67 | | 222 | | 662 | | [removed: 1,431 | |]
| Long-term debt, less current portion ($) (j) | | [removed: 3,890,527] [added: 4,123,217] | | [added: 3,890,527 | |] 3,417,122 | | 2,978,390 | | 1,887,019 | | 1,390,018 | | 1,388,397 | | 1,386,828 | | 1,087,789 | | 790,585 | | [removed: 357,273 | |]
| Shareholders’ equity ($) (a) | | [removed: 397,340] [added: 140,258] | | [added: 397,340 | |] 353,667 | | 653,046 | | 1,627,136 | | 1,961,314 | | 2,018,418 | | 1,966,321 | | 2,108,307 | | 2,844,851 | | [removed: 3,209,685 | |]
| Cash provided by operating activities ($) (m) | | [removed: 1,708,479] [added: 2,836,603] | | [added: 1,708,479 | |] 1,727,555 | | 1,403,687 | | 1,510,713 | | 1,345,488 | | 1,190,430 | | 908,026 | | 1,251,555 | | 1,118,991 | | [removed: 703,687 | |]
| Capital expenditures ($) | | [removed: 628,057] [added: 465,579] | | [added: 628,057 | |] 504,268 | | 465,940 | | 476,344 | | 414,020 | | 429,987 | | 395,881 | | 300,719 | | 328,319 | | [removed: 365,419 | |]
| Free cash flow ($) (m)(n) | | [removed: 1,020,649] [added: 2,189,995] | | [added: 1,020,649 | |] 1,188,584 | | 889,059 | | 978,375 | | 868,390 | | 760,443 | | 512,145 | | 950,836 | | 790,672 | | [removed: 338,268 | |]
| (b) | Following the enactment of the U.S. Tax Cuts and Jobs Act in December of 2017, the Company revalued its deferred income tax liabilities, which resulted in a one-time benefit to the Company’s Consolidated Statement of Income for the [removed: year] [added: years] ended December 31, 2018 and 2017. See Note 13 “Income Taxes” to the Consolidated Financial Statements of the annual report on Form 10-K for the year ended December 31, 2018, for more information. |
| (c) | Represents [removed: O’Reilly] [added: O’Reilly’s] U.S. operations only. |
| (d) | In [removed: 2008,] 2012, [removed: 2016,] [added: 2016] and 2018, the Company acquired [removed: CSK Auto Corporation (“CSK”),] materially all assets of VIP Parts, Tires & Service (“VIP”), Bond Auto Parts (“Bond”) and Bennett Auto Supply, Inc. (“Bennett”), respectively. The [removed: 2008 CSK acquisition added 1,342 stores, the] 2012 VIP acquisition added 56 [removed: stores] [added: stores,] and the 2016 Bond acquisition added 48 stores to the O’Reilly store count. After the close of business on December 31, 2018, the Company acquired substantially all of the non-real estate assets of Bennett, including 33 stores that were not included in the 2018 store count and were not operated by the Company in 2018, but beginning January 1, 2019, the operations of the acquired Bennett locations were included in the Company’s store count, and during the year ended December 31, 2019, the Company merged 13 of these acquired Bennett stores into existing O’Reilly locations and rebranded the remaining 20 Bennett stores as O’Reilly stores. Financial results for these acquired companies have been included in the Company’s consolidated financial statements from the dates of the acquisitions forward. |
| (i) | Comparable store sales are calculated based on the change in sales of U.S. stores open at least one year and excludes sales of specialty machinery, sales to independent parts stores, sales to Team Members, sales from Leap Day during the years ended December 31, [added: 2020,] 2016 and [removed: 2012, and sales during the one to two week period certain CSK branded stores were closed for conversion.] [added: 2012.] Online sales, resulting from ship-to-home orders and pick-up-in-store orders, for U.S. stores open at least one year, are included in the comparable store sales calculation. |
| Years ended December 31, | | 2020 | | 2019 | | 2018 | | 2017 | | 2016 | | 2015 | | 2014 | | 2013 | | 2012 | | 2011 | |
| Legacy CSK Department of Justice investigation charge | | — | | — | | — | | — | | — | | — | | — | | — | | — | | 20,900 | |
| Gain on settlement of note receivable | | — | | — | | — | | — | | — | | — | | — | | — | | — | | 11,639 | |
An excerpt. Shown here: 40 of 41 rewritten, all 1 added and all 2 removed. The counts are complete. For every sentence, read Item 6. Selected Financial Data in the FY2020 filing and the FY2019 filing.
Item 9A. Controls and Procedures
3 rewritten, 0 added, 2 removed, 20 unchanged
There were no changes in the Company’s internal control over financial reporting during the fiscal quarter ended December 31, [removed: 2019,] [added: 2020,] that have materially affected, or are reasonably likely to materially affect, the Company’s internal control over financial reporting.
Under the supervision and with the participation of the Company’s principal executive officer and principal financial officer, management assessed the effectiveness of the Company’s internal control over financial reporting as of December 31, [removed: 2019.][added: 2020.]
Based on this assessment, management believes that as of December 31, [removed: 2019,] [added: 2020,] the Company’s internal control over financial reporting was effective based on those criteria.
As permitted by guidance issued by the Securities and Exchange Commission, management excluded from its assessment of its system of internal control over financial reporting the operations associated with the acquisition of Mayoreo de Autopartes y Aceites, S.A. de C.V. (“Mayasa”), pursuant to a stock purchase agreement, which was completed after the close of business on November 29, 2019.
The acquired operations were included in the consolidated financial statements of the Company, which constituted 2% of total assets as of December 31, 2019, and less than 1% of revenues and less than 1% of net income for the year ended December 31, 2019.
Item 10. Directors, Executive Officers and Corporate Governance
3 rewritten, 3 added, 0 removed, 18 unchanged
Certain information required by Part III is incorporated by reference from the Company’s Proxy Statement on Schedule 14A for the [removed: 2020] [added: 2021] Annual Meeting of Shareholders (“Proxy Statement”), which will be filed with the Securities and Exchange Commission (the “SEC”) within 120 days of the end of the Company’s most recent fiscal year.
The Company’s Board of Directors has adopted a code of ethics that applies to all of its directors, officers (including its chief executive officer, chief operating officer, chief financial officer, chief accounting officer, controller and any person performing similar [removed: functions),] [added: functions)] and Team Members.
[removed: Perlman] [added: Sastre] and Andrea M.
_Section 16(a) of the Securities Exchange Act of 1934, as amended:_
The information regarding compliance with Section 16(a) of the Securities Exchange Act of 1934, as amended (the “Exchange Act”), required by Item 405 of Regulation S-K, will be included in the Company’s Proxy Statement under the caption “Delinquent Section 16(a) Reports,” if applicable, and is incorporated herein by reference.
Perlman, Maria A.
Item 14. Principal Accountant Fees and Services
27 rewritten, 14 added, 24 removed, 115 unchanged
The following consolidated financial statements of O’Reilly Automotive, Inc. and Subsidiaries included in the Annual Shareholders’ Report of the registrant for the year ended December 31, [removed: 2019,] [added: 2020,] are filed with this Annual Report in Part II, Item 8:
_Consolidated Balance Sheets as of December 31, [removed: 2019] [added: 2020] and [removed: 2018_][added: 2019_]
_Consolidated Statements of Income for the years ended December 31, [removed: 2019, 2018] [added: 2020, 2019] and [removed: 2017_][added: 2018_]
_Consolidated Statements of Comprehensive Income for the years ended December 31, [removed: 2019, 2018] [added: 2020, 2019] and [removed: 2017_][added: 2018_]
_Consolidated Statements of Shareholders’ Equity for the years ended December 31, [removed: 2019, 2018] [added: 2020, 2019] and [removed: 2017_][added: 2018_]
_Consolidated Statements of Cash Flows for the years ended December 31, [removed: 2019, 2018] [added: 2020, 2019] and [removed: 2017_][added: 2018_]
_Notes to Consolidated Financial Statements for the years ended December 31, [removed: 2019, 2018] [added: 2020, 2019] and [removed: 2017_][added: 2018_]
[removed: All other] [added: Any] schedules, for which provision is made in the applicable accounting regulations of the Securities and Exchange Commission, are not required under the related instructions or are inapplicable, and therefore have been omitted.
| 3.1 | | [removed: [Amended] [added: [Second Amended] and Restated Articles of Incorporation of the Registrant, filed as Exhibit 3.1 to the Registrant’s Current Report on Form 8-K dated May [removed: 9, 2013,] [added: 19, 2020,] is incorporated herein by this [removed: reference.](http://www.sec.gov/Archives/edgar/data/898173/000089817313000026/orly-20130507ex31c851abd.htm)] [added: reference.](https://www.sec.gov/Archives/edgar/data/898173/000089817320000037/orly-20200519ex31a8ed886.htm)] |
| 3.2 | | [removed: [Amended] [added: [Fourth Amended] and Restated Bylaws of the Registrant, filed as Exhibit [removed: 3.1] [added: 3.3] to the Registrant’s Current Report on Form 8-K dated [removed: November 29, 2016,] [added: May 19, 2020,] is incorporated herein by this [removed: reference.](http://www.sec.gov/Archives/edgar/data/898173/000089817316000409/exhibit31.htm)] [added: reference.](https://www.sec.gov/Archives/edgar/data/898173/000089817320000037/orly-20200519ex338abbce6.htm)] |
| 4.20 | | [Description of Capital Stock Exchange Act Section 12 Registered Securities of O’Reilly Automotive, Inc., filed [removed: herewith.](https://www.sec.gov/Archives/edgar/data/898173/000089817320000007/orly-20191231ex4201f7d0d.htm)] [added: as Exhibit 4.20 to the Registrant’s Annual Shareholders’ Report on Form 10-K dated February 28, 2020, is incorporated herein by this reference.](https://www.sec.gov/Archives/edgar/data/898173/000089817320000007/orly-20191231ex4201f7d0d.htm)] |
| [removed: 10.13] [added: 10.14] (a) | | [Form of O’Reilly Automotive, Inc. Executive Officer Indemnification Agreement, filed as Exhibit 10.2 to the Registrant’s Current Report on Form 8-K dated August 19, 2013, is incorporated herein by this reference.](http://www.sec.gov/Archives/edgar/data/898173/000089817313000041/orly-20130814ex10221bfdd.htm) |
| [removed: 10.14] [added: 10.16] (a) | | [Form of O’Reilly Automotive, Inc. Executive Incentive Compensation Clawback Policy Acknowledgment, between O’Reilly Automotive, Inc. and certain O’Reilly Automotive, Inc. Executive Officers, filed as Exhibit 10.1 to the Registrant’s Current Report on Form 8-K dated February 4, 2015, is incorporated herein by this reference.](http://www.sec.gov/Archives/edgar/data/898173/000089817315000042/orly-20150129xexhibit101.htm) |
| [removed: 10.15] [added: 10.17] (a) | | [Form of Change in Control Severance Agreement between O’Reilly and certain O’Reilly Executive Officers, filed as Exhibit 10.2 to the Registrant’s Current Report on Form 8-K dated February 4, 2015, is incorporated herein by this reference.](http://www.sec.gov/Archives/edgar/data/898173/000089817315000042/orly-20150129xexhibit102.htm) |
| [removed: 10.16] [added: 10.18] (a) | | [O’Reilly Automotive, Inc. 2017 Incentive Award Plan, filed as Annex A to the Registrant’s Proxy Statement for 2017 Annual Meeting of Shareholders on Schedule 14A dated March 24, 2017, is incorporated herein by this reference.](http://www.sec.gov/Archives/edgar/data/898173/000089817317000097/a2017definitiveproxystatem.htm) |
| [removed: 10.17] [added: 10.19] | | [Credit Agreement, dated as of April 5, 2017, among O’Reilly Automotive, Inc., as Borrower, JPMorgan Chase Bank, N.A., as Administrative Agent, Swing Line Lender, Letter of Credit Issuer and a Lender, and other lenders party thereto, filed as Exhibit 10.1 to the Registrant’s Current Report on Form 8-K dated April 11, 2017, is incorporated herein by this reference.](http://www.sec.gov/Archives/edgar/data/898173/000089817317000105/orly-20170405xexhibit101xc.htm) |
| [removed: 10.18] [added: 10.20] (a) | | [O’Reilly Automotive, Inc. 2017 Incentive Award Plan, Form of Stock Option Grant Notice and Agreement, dated as of July 10, 2017, filed as Exhibit 10.3 to the Registrant’s Quarterly Report on Form 10-Q dated August 7, 2017, is incorporated herein by this reference.](http://www.sec.gov/Archives/edgar/data/898173/000089817317000154/orly-20170630x10qexhibit103.htm) |
| [removed: 10.19] [added: 10.22] (a) | | [O’Reilly Automotive, Inc. 2017 Incentive Award Plan, Form of Director Restricted Stock Agreement, filed [removed: herewith.](https://www.sec.gov/Archives/edgar/data/898173/000089817320000007/orly-20191231ex101926dba.htm)] [added: as Exhibit 10.19 to the Registrant’s Annual Shareholders’ Report on Form 10-K dated February 28, 2020, is incorporated herein by this reference.](https://www.sec.gov/Archives/edgar/data/898173/000089817320000007/orly-20191231ex101926dba.htm)] |
| 21.1 | | [Subsidiaries of the Registrant, filed [removed: herewith.](https://www.sec.gov/Archives/edgar/data/898173/000089817320000007/orly-20191231ex21194701c.htm)] [added: herewith.](https://www.sec.gov/Archives/edgar/data/898173/000089817321000012/orly-20201231ex211002cfb.htm)] |
| 23.1 | | [Consent of Ernst & Young LLP, independent registered public accounting firm, filed [removed: herewith.](https://www.sec.gov/Archives/edgar/data/898173/000089817320000007/orly-20191231ex2316da8b3.htm)] [added: herewith.](https://www.sec.gov/Archives/edgar/data/898173/000089817321000012/orly-20201231ex2313a94ca.htm)] |
| 31.1 | | [Certificate of the Chief Executive Officer pursuant to Section 302 of the Sarbanes-Oxley Act of 2002, filed [removed: herewith.](https://www.sec.gov/Archives/edgar/data/898173/000089817320000007/orly-20191231ex31104a86a.htm)] [added: herewith.](https://www.sec.gov/Archives/edgar/data/898173/000089817321000012/orly-20201231ex311176982.htm)] |
| 31.2 | | [Certificate of the Chief Financial Officer pursuant to Section 302 of the Sarbanes-Oxley Act of 2002, filed [removed: herewith.](https://www.sec.gov/Archives/edgar/data/898173/000089817320000007/orly-20191231ex3129469cb.htm)] [added: herewith.](https://www.sec.gov/Archives/edgar/data/898173/000089817321000012/orly-20201231ex3126aa5fc.htm)] |
| 32.1 * | | [Certificate of the Chief Executive Officer pursuant to 18 U.S.C. Section 1350, as adopted pursuant to Section 906 of the Sarbanes-Oxley Act of 2002, furnished [removed: herewith.](https://www.sec.gov/Archives/edgar/data/898173/000089817320000007/orly-20191231ex3216e1a60.htm)] [added: herewith.](https://www.sec.gov/Archives/edgar/data/898173/000089817321000012/orly-20201231ex3215906ee.htm)] |
| 32.2 * | | [Certificate of the Chief Financial Officer pursuant to 18 U.S.C. Section 1350, as adopted pursuant to Section 906 of the Sarbanes-Oxley Act of 2002, furnished [removed: herewith.](https://www.sec.gov/Archives/edgar/data/898173/000089817320000007/orly-20191231ex3223771c9.htm)] [added: herewith.](https://www.sec.gov/Archives/edgar/data/898173/000089817321000012/orly-20201231ex32267f606.htm)] |
| | Date: | February [removed: 28, 2020] [added: 26, 2021] | | |
| Date: | February [removed: 28, 2020] [added: 26, 2021] | | | | |
| | [removed: Director | | |] Executive Vice Chairman of the Board | | [added: | Director | |]
| 4.21 | | [Second Supplemental Indenture, dated as of March 27, 2020, by and between O’Reilly Automotive, Inc. and U.S. Bank National Association, as Trustee, filed as Exhibit 4.1 to the Registrant’s Current Report on Form 8-K dated March 27, 2020, is incorporated herein by this reference.](https://www.sec.gov/Archives/edgar/data/898173/000110465920039548/tm209312d5_ex4-1.htm) |
| 4.22 | | [Form of Note for 4.200% Senior Notes due 2030, included in Exhibit 4.1 to the Registrant’s Current Report on Form 8-K dated March 27, 2020, is incorporated herein by this reference.](https://www.sec.gov/Archives/edgar/data/898173/000110465920039548/tm209312d5_ex4-1.htm) |
| 4.23 | | [Third Supplemental Indenture, dated as of September 23, 2020, by and between O’Reilly Automotive, Inc. and U.S. Bank National Association, as Trustee, filed as Exhibit 4.1 to the Registrant’s Current Report on Form 8-K dated September 23, 2020, is incorporated herein by this reference.](https://www.sec.gov/Archives/edgar/data/898173/000110465920107816/tm2031416d1_ex4-1.htm) |
| 4.24 | | [Form of Note for 1.750% Senior Notes due 2031, included in Exhibit 4.1 to the Registrant’s Current Report on Form 8-K dated September 23, 2020, is incorporated herein by this reference.](https://www.sec.gov/Archives/edgar/data/898173/000110465920107816/tm2031416d1_ex4-1.htm) |
| 10.13 (a) | | [Second Form of O’Reilly Automotive, Inc. Director Indemnification Agreement, filed as Exhibit 10.1 to the Registrant’s Quarterly Report on Form 10-Q dated August 7, 2020, is incorporated herein by this reference.](https://www.sec.gov/Archives/edgar/data/898173/000155837020009976/orly-20200630ex101671b25.htm) |
| 10.15 (a) | | [Second Form of O’Reilly Automotive, Inc. Executive Officer Indemnification Agreement, filed as Exhibit 10.2 to the Registrant’s Quarterly Report on Form 10-Q dated August 7, 2020, is incorporated herein by this reference.](https://www.sec.gov/Archives/edgar/data/898173/000155837020009976/orly-20200630ex102edbb4b.htm) |
| 10.21 (a) | | [O’Reilly Automotive, Inc. 2017 Incentive Award Plan, Second Form of Stock Option Agreement, dated as of August 6, 2020, filed as Exhibit 10.3 to the Registrant’s Quarterly Report on Form 10-Q dated August 7, 2020, is incorporated herein by this reference.](https://www.sec.gov/Archives/edgar/data/898173/000155837020009976/orly-20200630ex103d71333.htm) |
| 10.23 (a) | | [O’Reilly Automotive, Inc. Deferred Compensation Plan, as amended and restated effective as of January 1, 2021, filed herewith.](https://www.sec.gov/Archives/edgar/data/898173/000089817321000012/orly-20201231ex102348531.htm) |
| | /s/ | Greg Henslee | | /s/ | Jay D. Burchfield |
| | Greg Henslee | | | Jay D. Burchfield | |
| | /s/ | Thomas T. Hendrickson | | /s/ | John R. Murphy |
| | Thomas T. Hendrickson | | | John R. Murphy | |
| | /s/ | Dana M. Perlman | | /s/ | Maria A. Sastre |
| | Dana M. Perlman | | | Maria A. Sastre | |
| --- | --- |
The following consolidated financial statement schedule of O’Reilly Automotive, Inc. and Subsidiaries is included in Item 15(a):
_Schedule II - Valuation and qualifying accounts_
O’REILLY AUTOMOTIVE, INC. AND SUBSIDIARIES
SCHEDULE II - VALUATION AND QUALIFYING ACCOUNTS
(in thousands)
| | | | | | | | | | | | | | | | | |
| --- | --- | --- | --- | --- | --- | --- | --- | --- | --- | --- | --- | --- | --- | --- | --- | --- |
| | | | | | Additions - | | | Additions - | | | | | | | | |
| | | Balance at | | | Charged to | | | Charged to | | | | | | | Balance at | |
| | | Beginning of | | | Costs and | | | Other Accounts - | | | Deductions - | | | | End of | |
| Description | | Period | | | Expenses | | | Describe | | | Describe | | | | Period | |
| Allowance for doubtful accounts: | | | | | | | | | | | | | | | | |
| For the year ended December 31, 2019 | | $ | 13,238 | | $ | 9,461 | | $ | — | | $ | 8,282 | (1) | | $ | 14,417 |
| For the year ended December 31, 2018 | | | 12,717 | | | 9,475 | | | — | | | 8,954 | (1) | | | 13,238 |
| For the year ended December 31, 2017 | | $ | 12,040 | | $ | 8,598 | | $ | — | | $ | 7,921 | (1) | | $ | 12,717 |
| (1) | Uncollectable accounts written off. |
| | /s/ | Rosalie O’Reilly Wooten | | /s/ | Greg Henslee |
| | Rosalie O’Reilly Wooten | | | Greg Henslee | |
| | /s/ | Jay D. Burchfield | | /s/ | Thomas T. Hendrickson |
| | Jay D. Burchfield | | | Thomas T. Hendrickson | |
| | /s/ | John R. Murphy | | /s/ | Dana M. Perlman |
| | John R. Murphy | | | Dana M. Perlman | |