 filings.tools
Packaging Corp of America 2017 10-K Annual Report
PKG · CIK 75677 · Form 10-K · Fiscal year ended December 31, 2017 · Filed February 28, 2018
21 sections, 361K characters. Original on sec.gov · Markdown · JSON
Risk FactorsBusinessMD&AFinancial StatementsWhat changed vs 2017
Cover and table of contents
10-K 1 pkg-10k_20171231.htm 10-K
UNITED STATES
SECURITIES AND EXCHANGE COMMISSION
Washington, D.C. 20549
Form 10-K
ANNUAL REPORT PURSUANT TO SECTION 13 OR 15(d)
OF THE SECURITIES EXCHANGE ACT OF 1934
For the fiscal year ended December 31, 2017
Commission file number 1-15399
(Exact Name of Registrant as Specified in its Charter)
| Delaware | 36-4277050 | |
|---|---|---|
| (State or Other Jurisdiction of Incorporation or Organization) | (I.R.S. Employer Identification No.) | |
| 1955 West Field Court, Lake Forest, Illinois | 60045 | |
| (Address of Prinicpal Executive Offices) | (Zip Code) |
Registrant's telephone number, including area code: (847) 482-3000
Securities registered pursuant to Section 12(b) of the Act:
| Title of Each Class | Name of Each Exchange On Which Registered | |
|---|---|---|
| Common Stock, $0.01 par value | New York Stock Exchange |
Securities registered pursuant to Section 12(g) of the Act:
None
Indicate by check mark if the registrant is a well-known seasoned issuer, as defined in Rule 405 of the Securities Act. Yes ☒ No ☐
Indicate by check mark if the registrant is not required to file reports pursuant to Section 13 or Section 15(d) of the Act. Yes ☐ No ☒
Indicate by check mark whether the registrant (1) has filed all reports required to be filed by Section 13 or 15(d) of the Securities Exchange Act of 1934 during the preceding 12 months (or for such shorter period that the registrant was required to file such reports), and (2) has been subject to such filing requirements for the past 90 days. Yes ☒ No ☐
Indicate by check mark whether the registrant has submitted electronically and posted on its corporate Web site, if any, every Interactive Data File required to be submitted and posted pursuant to Rule 405 of Regulation S-T (§232.405 of this chapter) during the preceding 12 months (or for such shorter period that the registrant was required to submit and post such files). Yes ☒ No ☐
Indicate by check mark if disclosure of delinquent filers pursuant to Item 405 of Regulation S-K (§229.405 of this chapter) is not contained herein, and will not be contained, to the best of registrant's knowledge, in definitive proxy or information statements incorporated by reference in Part III of this Form 10-K or any amendment to this Form 10-K. ☒
Indicate by check mark whether the registrant is a large accelerated filer, an accelerated filer, a non-accelerated filer, or a smaller reporting company. See the definitions of “large accelerated filer,” “accelerated filer,” and “smaller reporting company” in Rule 12b-2 of the Exchange Act. (Check one):
| Large accelerated filer | ☒ | Accelerated filer | ☐ | |||
|---|---|---|---|---|---|---|
| Non-accelerated filer | ☐ (Do not check if a smaller reporting company) | Smaller reporting company | ☐ | |||
| Emerging growth company | ☐ |
If an emerging growth company, indicate by check mark if the registrant has elected not to use the extended transition period for complying with any new or revised financial accounting standards provided pursuant to Section 13(a) of the Exchange Act. ☐
Indicate by check mark whether the registrant is a shell company (as defined in Rule 12b-2 of the Exchange Act). Yes ☐ No ☒
At June 30, 2017, the last day of the Registrant's most recently completed second fiscal quarter, the aggregate market value of Registrant's common equity held by non-affiliates was approximately $10,380,184,252 based upon the closing sale price as reported on the New York Stock Exchange. This calculation of market value has been made for the purposes of this report only and should not be considered as an admission or conclusion by the Registrant that any person is in fact an affiliate of the Registrant.
On February 23, 2018, there were 94,349,822 shares of Common Stock outstanding.
DOCUMENTS INCORPORATED BY REFERENCE
Specified portions of the Proxy Statement for the Registrant's 2018 Annual Meeting of Stockholders are incorporated by reference to the extent indicated in Part III of this Form 10-K.
Table of Contents
i
PART I
Item 1. BUSINESS
| --- | --- |
Packaging Corporation of America (“we,” “us,” “our,” “PCA,” or the “Company”) is the fourth largest producer of containerboard products and the third largest producer of uncoated freesheet (UFS) in North America, based on production capacity. We operate five containerboard mills, three white paper mills and 94 corrugated products manufacturing plants. We are headquartered in Lake Forest, Illinois and operate primarily in the United States.
We report in three reportable segments: Packaging, Paper and Corporate and Other. For segment financial information see Note 17, Segment Information, of the Notes to Consolidated Financial Statements in “Part II, Item 8, Financial Statements and Supplementary Data” of this Form 10-K.
On October 2, 2017, we acquired substantially all of the assets of Sacramento Container Corporation, and 100% of the membership interests of Northern Sheets, LLC and Central California Sheets, LLC for a cash purchase price of $265 million, funded with cash on hand. The acquired companies operate two full-line corrugated products operations and sheet feeders in McClellan, California and Kingsburg, California.
During the third quarter of 2017, we announced that we would discontinue production of uncoated freesheet and certain types of pressure sensitive grades of white paper at our Wallula, Washington mill in the second quarter of 2018. We will convert the No. 3 paper machine at the mill to a 400,000 ton-per-year virgin kraft linerboard machine. After the conversion, the Wallula mill will produce only containerboard.
Production and Shipments
The following table summarizes the Packaging segment's containerboard production and corrugated products shipments and the Paper segment's production.
| First Quarter | Second Quarter | Third Quarter | Fourth Quarter | Full Year | ||||||||||||||||||||||
|---|---|---|---|---|---|---|---|---|---|---|---|---|---|---|---|---|---|---|---|---|---|---|---|---|---|---|
| Containerboard Production | PCA | 2017 | 932 | 947 | 996 | 1,006 | 3,881 | |||||||||||||||||||
| (thousand tons) | 2016 | 898 | 926 | 950 | 962 | 3,736 | ||||||||||||||||||||
| 2015 | 882 | 938 | 933 | 903 | 3,656 | |||||||||||||||||||||
| Corrugated Shipments (BSF) | PCA | 2017 | 13.6 | 13.9 | 13.7 | 14.5 | 55.7 | |||||||||||||||||||
| 2016 | 12.3 | 12.7 | 13.1 | 13.2 | 51.3 | |||||||||||||||||||||
| 2015 | 11.9 | 12.4 | 12.5 | 12.1 | 48.9 | |||||||||||||||||||||
| White Paper (UFS) Production | PCA | 2017 | 273 | 289 | 278 | 278 | 1,118 | |||||||||||||||||||
| (thousand tons) | 2016 | 283 | 268 | 288 | 288 | 1,127 | ||||||||||||||||||||
| 2015 | 288 | 273 | 294 | 262 | 1,117 | |||||||||||||||||||||
| Market Pulp Production (a) | PCA | 2017 | - | - | - | - | - | |||||||||||||||||||
| (thousand tons) | 2016 | 16 | 10 | 12 | 7 | 45 | ||||||||||||||||||||
| 2015 | 27 | 23 | 25 | 23 | 98 |
| (a) | On December 1, 2016, PCA ceased production of softwood market pulp at our Wallula, Washington mill and permanently shut down the No.1 machine. |
|---|
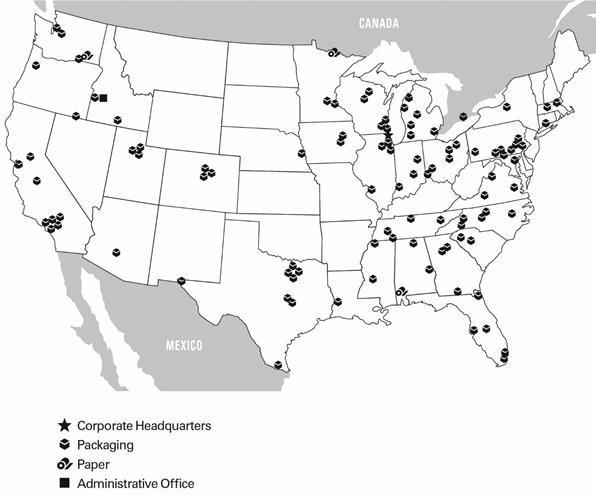
Below is a map of our locations:
Packaging
Packaging Products
Our containerboard mills produce linerboard and semi-chemical corrugating medium, which are papers primarily used in the production of corrugated products. Our corrugated products manufacturing plants produce a wide variety of corrugated packaging products, including conventional shipping containers used to protect and transport manufactured goods, multi-color boxes and displays with strong visual appeal that help to merchandise the packaged product in retail locations, and honeycomb protective packaging. In addition, we are a large producer of packaging for meat, fresh fruit and vegetables, processed food, beverages, and other industrial and consumer products.
During the year ended December 31, 2017, our Packaging segment produced 3.9 million tons of containerboard at our mills. Our corrugated products manufacturing plants sold 55.7 billion square feet (BSF) of corrugated products. Our net sales to third parties totaled $5.3 billion in 2017.
Facilities
We currently manufacture our Packaging products at five containerboard mills, one containerboard machine (at our Wallula, Washington white paper mill), corrugated manufacturing operations, and protective packaging operations. Total annual containerboard capacity is 4,111,000 tons. The following provides more details of our operations:
Counce. Our Counce, Tennessee mill produces kraft linerboard. The mill can produce basis weights from 26 lb. to 90 lb. The mill also produces a variety of performance and specialty grades of linerboard.
DeRidder. Our DeRidder, Louisiana mill produces kraft linerboard on its No. 1 machine and linerboard and semi-chemical corrugating medium on its No. 3 machine. The mill can produce linerboard in basis weights of 26 lb. to 69 lb. and medium in basis weights of 23 lb. to 33 lb.
Valdosta. Our Valdosta, Georgia mill produces kraft linerboard. The mill can produce basis weights from 35 lb. to 96 lb.
Tomahawk. Our Tomahawk, Wisconsin mill produces semi-chemical corrugating medium. The Tomahawk mill can produce basis weights from 23 lb. to 47 lb. and a variety of performance and specialty grades of corrugating medium.
Filer City. Our Filer City, Michigan mill produces semi-chemical corrugating medium. Filer City can produce corrugating medium in basis weights from 20 lb. to 47 lb.
Wallula. Our Wallula, Washington mill primarily produces white paper, but also produces semi-chemical corrugating medium on one of its two paper machines. Wallula can produce corrugating medium in basis weights from 23 lb. to 45 lb. As described above, we are converting the No. 3 machine at the mill from white paper to kraft linerboard. After the conversion, the Wallula mill will solely produce containerboard.
We operate 94 corrugated manufacturing operations, a technical and development center, nine regional design centers, a rotogravure printing operation, and a complement of packaging supplies and distribution centers. Of the 94 manufacturing facilities, 61 operate as combining operations, commonly called corrugated plants, which manufacture corrugated sheets and finished corrugated packaging products, 32 are sheet plants, which procure combined sheets and manufacture finished corrugated packaging products, and one is a corrugated sheet-only manufacturer.
Corrugated products plants tend to be located in close proximity to customers to minimize freight costs. Each of our plants serve a market radius of approximately 150 miles. Our sheet plants are generally located in close proximity to our larger corrugated plants, which enables us to offer additional services and converting capabilities such as small volume and quick turnaround items.
Major Raw Materials Used
Fiber supply. Fiber is the largest raw material cost to manufacture containerboard. We consume both wood fiber and recycled fiber in our containerboard mills. We have no 100% recycled mills, or mills whose fiber consumption consists solely of recycled fiber. To reduce our fiber costs, we have invested in processes and equipment to ensure a high degree of fiber flexibility. Our mill system has the capability to shift a portion of its fiber consumption between softwood, hardwood, and recycled sources. All of our mills, other than the Valdosta mill, can utilize some recycled fiber in their containerboard production. Our ability to use various types of virgin and recycled fiber helps mitigate the impact of changes in the prices of various fibers. Our corrugated manufacturing operations generate recycled fiber as a by-product from the manufacturing process, which is consumed by our mills. In 2017, our usage of recycled fiber, net of internal generation, represents 17% of our containerboard production.
We procure wood fiber through leases of cutting rights, long-term supply agreements, and market purchases and believe we have adequate sources of fiber supply.
We participate in the Sustainable Forestry Initiative® (SFI), the Programme for the Endorsement of Forest Certification (PEFC), as well as the Forest Stewardship Council (FSC), and we are certified under their sourcing standards. These standards are aimed at ensuring the long-term health and conservation of forestry resources. We are committed to sourcing wood fiber through environmentally, socially, and economically sustainable practices and promoting resource and conservation stewardship ethics.
Energy supply. Energy at our packaging mills is obtained through purchased or self-generated fuels and electricity. Fuel sources include natural gas, by-products of the containerboard manufacturing and pulping process (including black liquor and wood waste), purchased wood waste, and other purchased fuels. Each of our mills self-generates process steam requirements from by-products (black liquor and wood waste), as well as from the various purchased fuels. The process steam is used throughout the production process and also to generate electricity.
In 2017, our packaging mills consumed about 63 million MMBTU’s of fuel to produce both steam and electricity. Of the 63 million MMBTU’s consumed, about 62% was from mill generated by-products and 38% was from purchased fuels. Of the 38% in purchased fuels, 61% was from natural gas, 33% was from purchased wood waste and 6% was from other purchased fuels.
Chemical supply. We consume various chemicals in the production of containerboard, including caustic soda and sulfuric acid. Most of our chemicals are purchased under contracts, which are bid or negotiated periodically.
Sales, Marketing, and Distribution
Our corrugated products are sold through our direct sales and marketing organization, independent brokers, and distribution partners. We have sales representatives and a sales manager at most of our corrugated manufacturing operations and also have corporate account managers who serve customer accounts with a national presence. Additionally, our design centers maintain an on-site dedicated graphics sales force. In addition to direct sales and marketing personnel, we utilize new product development engineers and product graphics and design specialists. These individuals are located at both the corrugated plants and the design centers. General marketing support is located at our corporate headquarters.
Our containerboard sales group is responsible for the coordination of linerboard and corrugating medium, order processing, and sales to our corrugated plants, to outside domestic customers, and to export customers. These personnel also coordinate and execute all containerboard trade agreements with other containerboard manufacturers.
Containerboard produced in our mills is shipped by rail or truck. Our corrugated products are delivered by truck due to our large number of customers and their demand for timely service. Our corrugated manufacturing operations typically serve customers within a 150-mile radius. We sometimes use third-party warehouses for short-term storage of corrugated products.
Customers
We sell corrugated products to over 18,000 customers in over 35,000 locations. About three-quarters of our corrugated products sales are to regional and local accounts, which are broadly diversified across industries and geographic locations. The remaining one-quarter of our customer base consists primarily of national accounts that have multiple locations and are served by a number of PCA plants. No single customer exceeds 10% of segment sales.
The primary end-use markets in the United States for corrugated products are shown below as reported in the 2016 Fibre Box Association annual report:
| Food, beverages, and agricultural products | 45 | % | ||
|---|---|---|---|---|
| Retail and wholesale trade | 22 | % | ||
| Miscellaneous manufacturing | 12 | % | ||
| Paper and other products | 11 | % | ||
| Chemical, plastic, and rubber products | 10 | % |
Competition
As of December 31, 2017, we were the fourth largest producer of containerboard products in the United States, according to industry sources and our own estimates. According to industry sources, corrugated products are produced by about 475 U.S. companies operating approximately 1,200 plants. The primary basis for competition for most of our packaging products includes quality, service, price, product design, and innovation. Most corrugated products are manufactured to the customer’s specifications. Corrugated producers generally sell within a 150-mile radius of their plants and compete with other corrugated producers in their local region. Competition in our corrugated products operations tends to be regional, although we also face competition from large competitors with significant national account presence.
On a national level, our primary competitors are International Paper Company, WestRock Company, Georgia-Pacific LLC, KapStone Paper and Packaging Corporation, and Pratt Industries. However, with our strategic focus on regional and local accounts, we also compete with the smaller, independent producers.
Paper
We are the third largest manufacturer of uncoated freesheet in the United States, according to industry sources and our own estimates. We manufacture and sell white papers, including both commodity and specialty papers, which may have custom or specialized features such as colors, coatings, high brightness, and recycled content. White papers consist of communication papers (cut-size office papers and printing and converting papers) and pressure sensitive papers, including release liners, which our customers use to produce labels for use in consumer and commercially-packaged products.
Facilities
We currently have three white paper mills located in the United States. Total annual white paper capacity is 990,000 tons. The following paragraphs describe our white paper mills:
Jackson. Our Jackson, Alabama mill produces both commodity and specialty papers on two paper machines.
International Falls. Our International Falls, Minnesota mill produces both commodity and specialty papers on two paper machines.
Wallula. Our Wallula, Washington mill has the ability, on one machine, to switch production between pressure sensitive papers and a variety of white paper grades. The mill also produces corrugating medium. As described above, we are converting the No. 3 machine at the mill from white paper to kraft linerboard. Upon the conversion, the Wallula mill will solely produce containerboard.
Major Raw Materials Used
Fiber supply. Fiber is the largest raw material cost in this segment. We consume wood fiber, recycled fiber, and purchased pulp. Our Jackson mill purchases recycled fiber to produce our line of recycled office papers. We purchase wood fiber through contracts and open-market purchase, and we purchase pulp from third parties pursuant to contractual agreements.
We participate in the Sustainable Forestry Initiative® (SFI) and the Forest Stewardship Council® (FSC) and are certified under the SFI sourcing standards. We procure all wood fiber for our white paper mills through our certified systems that are managed in accordance with the SFI and FSC standards. These standards are aimed at ensuring the long-term health and conservation of forestry resources.
Energy supply. We obtain energy through purchased or self-generated fuels and electricity. Fuel sources include natural gas, electricity, by-products of the manufacturing and pulping process (including black liquor and wood waste), and purchased wood waste. Each of the paper mills self-generates process steam requirements from by-products (black liquor and wood waste), as well as from the various purchased fuels. The process steam is used throughout the production process and to generate electricity.
In 2017, our white paper mills consumed about 33 million MMBTU’s of fuel to produce both steam and electricity. Of the 33 million MMBTU’s consumed, about 63% was from mill generated by-products and 37% was from purchased fuels. Of the 37% in purchased fuels, 80% was from natural gas and 20% from purchased wood waste.
Chemical supply. We consume various chemicals in the production of white papers, including starch, precipitated calcium carbonate, caustic soda, sodium chlorate, dyestuffs, and optical brighteners. Most of our chemicals are purchased under contracts, which are bid or negotiated periodically.
Sales, Marketing, and Distribution
Our white papers are sold primarily through our sales and marketing organization. We ship to customers both directly from our mills and through distribution centers and a network of outside warehouses by rail or truck. This allows us to respond quickly to customer requirements.
Customers
We have over 180 customers in approximately 500 locations. These customers include paper merchants, commercial and financial printers, envelope converters, and customers who use our pressure sensitive paper for specialty applications such as consumer and commercial product labels. We have established long-term relationships with many of our customers. Office Depot, Inc. is our largest customer in the Paper segment. We have an agreement with Office Depot in which we will supply at least 50% of Office Depot's requirements for commodity office papers through December 2018. The agreement will renew automatically through December 2019; however, there are circumstances that could cause the agreement to terminate in 2018. If this were to occur, Office Depot's purchase obligations under the agreement would phase out over two years. In 2017, our sales revenue to Office Depot represented 43% of our Paper segment sales revenue.
Competition
The markets in which our Paper segment competes are large and highly competitive. Commodity grades of white paper are globally traded, with numerous worldwide manufacturers, and as a result, these products compete primarily on the basis of price. All of our paper manufacturing facilities are located in the United States, and although we compete primarily in the domestic market, we do face competition from foreign producers. In 2016, as a result of a case brought by us and other domestic producers before United States international trade authorities, antidumping and countervailing duties at various levels were imposed on producers of uncoated freesheet papers produced in Australia, Brazil, China, Indonesia, and Portugal. These duties remain in effect. Other factors influencing competition from overseas producers include domestic and foreign demand and foreign currency exchange rates. In general, paper production does not rely on proprietary processes or formulas, except in highly specialized or custom grades.
Our largest competitors include Domtar Corporation, International Paper Company, and Georgia-Pacific LLC. We also face competition from overseas producers. Although price is the primary basis for competition in most of our paper grades, quality and service are also important competitive determinants. Our white papers compete with electronic data transmission, e-readers, electronic document storage alternatives, and paper grades we do not produce. Increasing shifts to these alternatives have had, and are likely to continue to have, an adverse effect on traditional print media and paper usage and lower demand for communication papers.
Corporate and Other
Our Corporate and Other segment includes corporate support staff services and related assets and liabilities. This segment also includes transportation assets, such as rail cars and trucks, which we use to transport some of our products from our manufacturing sites, and assets related to a 50% owned variable interest entity, Louisiana Timber Procurement Company, L.L.C. (LTP).
Employees
As of December 31, 2017, we had approximately 14,600 employees, including 4,400 salaried and 10,200 hourly employees. Approximately 65% of our hourly employees worked pursuant to collective bargaining agreements. The majority of our unionized employees are represented by the United Steel Workers (USW), the International Brotherhood of Teamsters (IBT), the International Association of Machinists (IAM), and the Association of Western Pulp and Paper Workers (AWPPW). We are currently in negotiations to renew or extend any union contracts that have recently expired or are expiring in the near future. During 2017, we experienced no work stoppages, and we believe we have satisfactory labor relations with our employees.
Environmental Matters
A discussion of the financial impact of our compliance with environmental laws is presented under the caption “Environmental Matters” in “Part II, Item 7. Management's Discussion and Analysis of Financial Condition and Results of Operations” of this Form 10-K.
Executive Officers of the Registrant
Brief statements setting forth the age at February 28, 2018, the principal occupation, employment during the past five years, the year in which such person first became an officer of PCA, and other information concerning each of our executive officers appears below.
Mark W. Kowlzan, 62, Chairman and Chief Executive Officer - Mr. Kowlzan has served as PCA's Chairman since January 2016 and as Chief Executive Officer and a director since July 2010. From 1998 through June 2010, Mr. Kowlzan led the company’s containerboard mill system, first as Vice President and General Manager and then as Senior Vice President - Containerboard. From 1996 through 1998, Mr. Kowlzan served in various senior mill-related operating positions with PCA and Tenneco Packaging, including as manager of the Counce linerboard mill. Prior to joining Tenneco Packaging, Mr. Kowlzan spent 15 years at International Paper Company, a global paper and packaging company, where he held a series of operational and managerial positions within its mill organization. Mr. Kowlzan is a member of the board of American Forest and Paper Association.
Thomas A. Hassfurther, 62, Executive Vice President - Corrugated Products - Mr. Hassfurther has served as Executive Vice President - Corrugated Products of PCA since September 2009. From February 2005 to September 2009, Mr. Hassfurther served as Senior Vice President - Sales and Marketing, Corrugated Products. Prior to this he held various senior-level management and sales positions at PCA and Tenneco Packaging. Mr. Hassfurther joined the company in 1977.
Charles J. Carter, 58, Senior Vice President - Containerboard Mill Operations - Mr. Carter has served as Senior Vice President - Containerboard Mill Operations since July 2013. Prior to this, he served as Vice President – Containerboard Mill Operations since January 2011. From March 2010 to January 2011, Mr. Carter served as PCA’s Director of Papermaking Technology. Prior to joining PCA in 2010, Mr. Carter spent 28 years with various pulp and paper companies in managerial and technical positions of increasing responsibility, most recently as Vice President and General Manager of the Calhoun, Tennessee mill of Abitibi Bowater from 2007 to 2010 and as manager of SP Newsprint’s Dublin, Georgia mill from 1999 to 2007.
Robert P. Mundy, 56, Senior Vice President and Chief Financial Officer - Mr. Mundy has served as PCA’s Senior Vice President since July 2015 and Chief Financial Officer since September 2015. He previously served as Senior Vice President and Chief Financial Officer of Verso Corporation, a leading North American supplier of coated papers to catalog and magazine publishers, from 2006 to June 2015. Verso Corporation filed for Chapter 11 bankruptcy in January 2016. Prior to that, he worked at International Paper Company, from 1983 to 2006, where he was Director of Finance of the Coated and Supercalendered Papers division from 2002 to 2006, Director of Finance Projects from 2001 to 2002, Controller of Masonite Corporation from 1999 to 2001, and Controller of the Petroleum and Minerals business from 1996 to 1999. He served in various business positions at International Paper from 1983 to 1996.
Kent A. Pflederer, 47, Senior Vice President, General Counsel and Secretary - Mr. Pflederer has served as Senior Vice President, General Counsel and Corporate Secretary since January 2013 and has led our legal department since June 2007. Prior to joining PCA, Mr. Pflederer served as Senior Counsel, Corporate and Securities, at Hospira, Inc. from 2004 to 2007 and served in the corporate and securities practice at Mayer Brown, LLP from 1996 to 2004.
Thomas W.H. Walton, 58, Senior Vice President - Sales and Marketing, Corrugated Products - Mr. Walton has served as Senior Vice President - Sales and Marketing, Corrugated Products since October 2009. Prior to this, he served as a Vice President and Area General Manager within the Corrugated Products Group since 1998. Mr. Walton joined the company in 1981 and has also held positions in production, sales, and general management.
Available Information
PCA’s internet website address is www.packagingcorp.com. Our annual reports on Form 10-K, quarterly reports on Form 10-Q, current reports on Form 8-K, and amendments to those reports filed or furnished pursuant to Section 13 or 15(d) of the Securities Exchange Act of 1934 are available free of charge through our website as soon as reasonably practicable after they are electronically filed with, or furnished to, the Securities and Exchange Commission. In addition, our Code of Ethics may be accessed in the Investor Relations section of PCA’s website. PCA’s website and the information contained or incorporated therein are not intended to be incorporated into this report.
Item 1A. RISK FACTORS
| --- | --- |
Some of the statements in this report and, in particular, statements found in Management’s Discussion and Analysis of Financial Condition and Results of Operations, that are not historical in nature are forward-looking statements within the meaning of the Private Securities Litigation Reform Act of 1995. Forward-looking statements include statements about our expectations regarding our future liquidity, earnings, expenditures, and financial condition. These statements are often identified by the words “will,” “should,” “anticipate,” “believe,” “expect,” “intend,” “estimate,” “hope,” or similar expressions. These statements reflect management’s current views with respect to future events and are subject to risks and uncertainties. There are important factors that could cause actual results to differ materially from those in forward-looking statements, many of which are beyond our control. These factors, risks and uncertainties include, but are not limited to, the factors described below.
Our actual results, performance, or achievement could differ materially from those expressed in, or implied by, these forward-looking statements, and accordingly, we can give no assurances that any of the events anticipated by the forward-looking statements will transpire or occur, or if any of them do so, what impact they will have on our results of operations or financial condition. In view of these uncertainties, investors are cautioned not to place undue reliance on these forward-looking statements. We expressly disclaim any obligation to publicly revise or otherwise update any forward-looking statements that have been made to reflect the occurrence of events after the date hereof.
In addition to the risks and uncertainties we discuss elsewhere in this Form 10-K (particularly in “Part II, Item 7. Management's Discussion and Analysis of Financial Condition and Results of Operations”) or in our other filings with the Securities and Exchange Commission (SEC), the following are important factors that could cause our actual results to differ materially from those we project in any forward-looking statement.
Industry Cyclicality - Changes in the prices of our products could materially affect our financial condition, results of operations, and liquidity. Macroeconomic conditions and fluctuations in industry capacity can create changes in prices, sales volumes, and margins for most of our products, particularly commodity grades of packaging and paper products. Prices for all of our products are driven by many factors, including general economic conditions, demand for our products, and competitive conditions in our industry, and we have little influence over the timing and extent of price changes, which may be unpredictable and volatile. In addition, our selling prices are influenced by index levels published by trade publications. Changes in how these index levels are determined or maintained may affect our sales prices. If supply exceeds demand, industry operating conditions deteriorate or other factors result in lower prices for our products, our earnings and operating cash flows would be harmed.
General Economic Conditions - If business and economic conditions deteriorate, our business, results of operations, liquidity, and financial position may be harmed. General global and U.S. economic conditions directly affect the demand and production of consumer goods, employment levels, the availability and cost of credit, and ultimately, the profitability of our business. If economic conditions deteriorate and result in higher unemployment rates, lower family income, unfavorable currency exchange rates, lower corporate earnings, lower business investment, and lower consumer spending, we may experience lower demand for our products and products of our customers which utilize our products. If economic conditions result in higher inflation, we may experience higher production and transportation costs, which we may not be able to recover through higher prices or otherwise. Changes in tax laws or tax rates may have a material impact on our future cash taxes, effective tax rate or deferred tax assets and liabilities. These conditions are beyond our control and may have a significant impact on our business, results of operations, liquidity, and financial position. See Management’s Discussion and Analysis of Financial Condition and Results of Operations in Part II, Item 7 and Note 6, Income Taxes, of the Notes to the Consolidated Financial Statements in “Part II, Item 8. Financial Statements and Supplementary Data” of this Form 10-K, for additional information on the impact of the Tax Cuts and Jobs Act (H.R.1) enacted in December 2017.
Competition - The intensity of competition in the industries in which we operate could result in downward pressure on pricing and volume, which could lower earnings and operating cash flows. Our industries are highly competitive, with no single containerboard, corrugated packaging, or white paper producer having a dominant position. Containerboard and commodity white paper products cannot generally be differentiated by producer, which tends to intensify price competition. The corrugated packaging industry is also sensitive to changes in economic conditions, as well as other factors including innovation, design, quality, and service. To the extent that one or more competitors are more successful than we are with respect to any key competitive factor, our business could be adversely affected. Our packaging products also compete, to some extent, with various other packaging materials, including products made of paper, plastics, wood, and various types of metal. If we are unable to successfully compete, we may lose market share or may be required to charge lower sales prices for our products, both of which would reduce our earnings and operating cash flows.
Our white paper products compete with electronic data transmission and document storage alternatives. Increasing shifts to electronic alternatives have had and will continue to have an adverse effect on usage of these products. As a result of such competition, we are experiencing decreasing demand for most of our existing white paper products. As the use of these alternatives grows, demand for paper products is likely to further decline. Declines in demand for our paper products may adversely affect our earnings and operating cash flows.
Some of our competitors are larger than we are and may have greater financial and other resources, greater manufacturing economies of scale, greater energy self-sufficiency, or lower operating costs, compared to our Company. We may be unable to compete effectively with these companies particularly during economic downturns. Some of the factors that may adversely affect our ability to compete in the markets in which we participate include the entry of new competitors into the markets we serve, increased competition from overseas producers, our competitors' pricing strategies, our inability to anticipate and respond to changing customer preferences, and our inability to maintain the cost-efficiency of our facilities.
Inflation and Other General Cost Increases - We may not be able to offset higher costs. We are subject to both contractual, inflationary, and other general cost increases, including with regard to our labor costs and purchases of raw materials and transportation services. General economic conditions may result in higher inflation, which may increase our exposure to higher costs. If we are unable to offset these cost increases by price increases, growth, and/or cost reductions in our operations, these inflationary and other general cost increases could have a material adverse effect on our operating cash flows, profitability, and liquidity.
In 2017, our total company costs including cost of sales (COS) and selling, general, and administrative expenses (SG&A) was $5.5 billion, and excluding non-cash costs (depreciation, depletion and amortization, pension and postretirement expense, and share-based compensation expense) was $5.1 billion. A 1% increase in COS and SG&A costs would increase costs by $55 million and cash costs by $51 million.
Cost of Fiber - An increase in the cost of fiber could increase our manufacturing costs and lower our earnings. The market price of wood fiber varies based upon availability, source, and the costs of fuels used in the harvesting and transportation of wood fiber. The cost and availability of wood fiber can also be impacted by weather, general logging conditions, geography, and regulatory activity.
The availability and cost of recycled fiber depends heavily on recycling rates and the domestic and global demand for recycled products. We purchase recycled fiber for use at four of our five containerboard mills as well as the containerboard machine at our Wallula, Washington mill. In 2017, we purchased approximately 670,000 tons of recycled fiber, net of the recycled fiber generated by our corrugated box plants. The amount of recycled fiber purchased each year varies based upon production and the prices of both recycled fiber and wood fiber.
Periods of supply and demand imbalance have created significant price volatility. Periods of higher recycled fiber costs and unusual price volatility have occurred in the past, including during 2017 as demand for domestic recycled fiber from Asian producers fluctuated significantly, and may occur again in the future, which could result in higher costs and lower earnings. A $10 per ton price increase in recycled fiber for our containerboard mills, would result in approximately $7 million of additional expense based on 2017 consumption.
Cost of Purchased Fuels and Chemicals - An increase in the cost of purchased fuels and chemicals could lead to higher manufacturing costs, resulting in reduced earnings. We have the ability to use various types of purchased fuels in our manufacturing operations, including natural gas, bark, and other purchased fuels. Fuel prices, in particular prices for oil and natural gas, have fluctuated dramatically in the past. New and more stringent environmental regulations may discourage, reduce the availability of, or make more expensive, the use of certain fuels, particularly coal and fossil fuels. In addition, costs for key chemicals used in our manufacturing operations also fluctuate. These fluctuations impact our manufacturing costs and result in earnings volatility. If fuel and chemical prices rise, our production costs and transportation costs will increase and cause higher manufacturing costs and reduced earnings. A $0.10 per million MMBTU in natural gas prices would result in approximately $3 million of additional expense, based on 2017 usage.
Transportation Costs - Reduced truck and rail availability could lead to higher costs or poorer service, resulting in lower earnings, and harm our ability to distribute our products. We ship our products primarily by truck and rail. We have experienced lower availability of third-party trucking services and interruptions or delays in rail services. We have also experienced higher costs for transportation services in general. These factors could lead to even higher transportation costs in the future and harm our ability to distribute our products in a timely manner. We may not be able to recover higher transportation costs through higher prices or otherwise, which would result in lower earnings.
Material Disruption of Manufacturing - A material disruption at one of our manufacturing facilities could prevent us from meeting customer demand, reduce our sales, and/or negatively affect our results of operations and financial condition. Our business depends on continuous operation of our facilities, particularly at our mills. Any of our manufacturing facilities, or any of our machines within such facilities, could cease operations unexpectedly for a significant period of time due to a number of events, including:
| • | Unscheduled maintenance outages. |
|---|
| • | Prolonged power failures. |
|---|
| • | Equipment failure. |
|---|
| • | Explosion of a boiler or other major facilities. |
|---|
| • | Disruption in the supply of raw materials, such as wood fiber, energy, or chemicals. |
|---|
| • | A chemical spill or release. |
|---|
| • | Closure or curtailment related to environmental concerns. |
|---|
| • | Labor difficulties. |
|---|
| • | Disruptions in the transportation infrastructure, including roads, bridges, railroad tracks, and tunnels. |
|---|
| • | Fires, floods, earthquakes, hurricanes, or other catastrophes. |
|---|
| • | Terrorism or threats of terrorism. |
|---|
| • | Other operational problems. |
|---|
We experienced an explosion at the DeRidder mill during 2017, which resulted in facility downtime and damage. Net of insurance proceeds, we incurred $5 million of property damage and business interruption losses during the year and we are party to multiple lawsuits relating to alleged injuries resulting from such explosion.
These events could harm our ability to produce our products and serve our customers and may lead to higher costs and reduced earnings.
Environmental Matters - PCA may incur significant environmental liabilities with respect to both past and future operations. We are subject to, and must comply with, a variety of federal, state and local environmental laws, particularly those relating to air and water quality, waste disposal and the cleanup of contaminated soil and groundwater. Because environmental regulations are constantly evolving, we have incurred, and will continue to incur, costs to maintain compliance with those laws. See Item 7. “Management’s Discussion and Analysis of Financial Condition and Results of Operations - Environmental Matters” for estimates of expenditures we expect to make for environmental compliance in the next few years. New and more stringent environmental regulations may be adopted and may require us to incur significant additional capital expenditures to modify or replace certain of our boilers. In addition, environmental regulations may increase the cost of our raw materials and purchased energy. Although we have established reserves to provide for known environmental liabilities, these reserves may change over time due to the enactment of new environmental laws or regulations or changes in existing laws or regulations, which might require additional significant environmental expenditures.
Mergers and Acquisitions - Our acquired businesses may underperform relative to our expectations, and we may not be able to successfully integrate these businesses into our own. We have completed several mergers and acquisitions and investments in recent years, including our acquisition of Sacramento Container Corporation during 2017. Our success will depend in part on our ability to successfully integrate, and receive the intended benefits from, these acquisitions. There may be difficulties, costs and delays involved in the integration of these businesses into ours. Integration requires modification of operational and financial systems and may result in significant additional expenses. If the acquired businesses underperform relative to our expectations, or if we fail to successfully integrate these businesses, our business, financial condition and results of operations may be materially and adversely affected.
Customer Concentration - Office Depot represents a significant portion of PCA’s paper business. We have a supply agreement with Office Depot, our largest customer in the Paper segment. The agreement requires Office Depot to buy, and us to supply, at least 50% of Office Depot's requirements for commodity office papers through December 2018.
In 2017, sales to Office Depot represented 43% of our Paper segment sales and 7% of our consolidated sales. If these sales are reduced, including if we are unable to renew the agreement at committed volumes, we would need to find new customers. We may not be able to fully replace any lost sales, and any new sales may be at lower prices or higher costs. Any significant deterioration in the financial condition of Office Depot affecting its ability to pay or any other change that makes Office Depot less willing to purchase our products will harm our business and results of operations.
Labor Relations- If we experience strikes or other work stoppages, our business will be harmed. Our workforce is highly unionized and operates under various collective bargaining agreements. We must negotiate to renew or extend any union contracts that have recently expired or are expiring in the near future. While we believe that we have generally had satisfactory labor relations, we may not be able to successfully negotiate new agreements without work stoppages or labor difficulties in the future or renegotiate them on favorable terms. If we are unable to successfully renegotiate the terms of any of these agreements, or if we experience any extended interruption of operations at any of our facilities as a result of strikes or other work stoppages, our business, results of operations and financial condition may be harmed.
Reliance on Personnel - We may fail to attract and retain qualified personnel, including key management personnel. Our ability to operate and grow our business depends on our ability to attract and retain employees with the skills necessary to operate and maintain our facilities, produce our products and serve our customers. The increasing demand for qualified personnel may make it more difficult for us to attract and retain qualified employees. Changing demographics and labor work force trends may make it difficult for us to replace retiring employees at our manufacturing and other facilities. If we fail to attract and retain qualified personnel, or if we experience labor shortages, we may experience higher costs and other difficulties, and our business may be adversely impacted.
In addition, we rely on key executive and management personnel to manage our business efficiently and effectively. As our business has grown in size and geographic scope, we have relied on these individuals to manage increasingly complex operations. The loss of any of our key personnel could adversely affect our business.
Cyber Security - Risks related to security breaches of company, customer, employee, and vendor information, as well as the technology that manages our operations and other business processes, could adversely affect our business. We rely on various information technology systems to capture, process, store, and report data and interact with customers, vendors, and employees. Despite careful security and controls design, implementation, updating, and internal and independent third-party assessments, our information technology systems, and those of our third party providers, could become subject to cyber attacks or security breaches. Network, system, and data breaches could result in misappropriation of sensitive data or operational disruptions including interruption to systems availability and denial of access to and misuse of applications required by our customers to conduct business with us. Misuse of internal applications; theft of intellectual property, trade secrets, or other corporate assets; and inappropriate disclosure of confidential information could stem from such incidents. Delayed sales, slowed production, or other issues resulting from these disruptions could result in lost sales, business delays, and negative publicity and could have a material adverse effect on our operations, financial condition, or operating cash flows.
Debt obligations - Our debt service obligations may reduce our operating flexibility. At December 31, 2017, we had $2.7 billion of debt outstanding and a $326.9 million undrawn revolving credit facility, after deducting letters of credit. All debt is comprised of fixed-rate senior notes. We and our subsidiaries are not restricted from incurring, and may incur, additional indebtedness in the future.
Our current borrowings, plus any future borrowings, may affect our ability to operate our business, including, without limitation:
| • | Result in significant cash requirements to make interest and maturity payments on our outstanding indebtedness; |
|---|
| • | Increase our vulnerability to adverse changes in our business or industry conditions; |
|---|
| • | Increase our vulnerability to increases in interest rates; |
|---|
| • | Limit our ability to obtain additional financing for working capital, capital expenditures, general corporate, and other purposes; |
|---|
| • | Limit our flexibility in planning for, or reacting to, changes in our business and our industry; and |
|---|
| • | Limit our flexibility to make acquisitions. |
|---|
Further, if we cannot service our indebtedness, we may have to take actions to secure additional cash by selling assets, seeking additional equity or reducing investments, which may not be achievable on acceptable terms or at all.
Market Price of our Common Stock - The market price of our common stock may be volatile, which could cause the value of the stock to decline. Securities markets worldwide periodically experience significant price declines and volume fluctuations due to macroeconomic factors and other factors beyond our control. This market volatility, as well as general economic, market, or political conditions, could reduce the market price of our common stock in spite of our operating performance. In addition, our operating results could be below the expectations of public market analysts and investors, and in response, the market price of our common stock could decrease significantly.
Item 1B. UNRESOLVED STAFF COMMENTS
| --- | --- |
None.
Item 2. PROPERTIES
| --- | --- |
We own and lease properties in our business. Primarily all of our leases are noncancelable and are accounted for as operating leases. These leases are not subject to early termination except for standard nonperformance clauses.
Information concerning capacity and utilization of our principal operating facilities, the segments that use those facilities, and a map of geographical locations is presented in “Part I, Item 1. Business” of this Form 10-K. We assess the condition and capacity of our manufacturing, distribution, and other facilities needed to meet our operating requirements. Our properties have been generally well maintained and are in good operating condition. In general, our facilities have sufficient capacity and are adequate for our production and distribution requirements.
We currently own buildings and land for five containerboard mills and three white paper mills. Additionally, we have 94 corrugated manufacturing operations, of which the buildings and land for 56 are owned, including 46 combining operations, or corrugated plants, one corrugated sheet-only manufacturer, and nine sheet plants. We lease the building for 11 corrugated plants and 27 sheet plants. We own warehouses and miscellaneous other properties, including sales offices and woodlands management offices. We lease space for regional design centers and numerous other distribution centers, warehouses, and facilities. The equipment in these leased facilities is, in virtually all cases, owned by us, except for forklifts and other rolling stock, which are generally leased.
We lease the cutting rights to approximately 75,000 acres of timberland located near our Valdosta mill (68,000 acres) and our Counce mill (7,000 acres). On average, these cutting rights agreements have terms with approximately 14 years remaining. Additionally, we lease approximately 9,000 acres of land for a fiber farm, located near our Wallula mill, where we plant, grow, and harvest fiber.
Our corporate headquarters is located in Lake Forest, Illinois. The headquarter facility is leased for the next four years with provisions for two additional five year lease extensions. We also lease an administrative office in Boise, Idaho, through July 2025.
Item 3. LEGAL PROCEEDINGS
| --- | --- |
Information concerning legal proceedings can be found in Note 18, Commitments, Guarantees, Indemnifications, and Legal Proceedings, of the Notes to Consolidated Financial Statements in “Part II, Item 8. Financial Statements and Supplementary Data” of this Form 10-K.
Item 4. MINE SAFETY DISCLOSURE
| --- | --- |
Not applicable.
PART II
Item 5. MARKET FOR REGISTRANT'S COMMON EQUITY, RELATED STOCKHOLDER MATTERS, AND ISSUER PURCHASES OF EQUITY SECURITIES
| --- | --- |
Market Information
PCA’s common stock is listed on the New York Stock Exchange (NYSE) under the symbol “PKG”. The following table sets forth the high and low sales prices as reported by the NYSE and the cash dividends declared per common share during the last two years.
| 2017 | 2016 | |||||||||||||||||||||||
|---|---|---|---|---|---|---|---|---|---|---|---|---|---|---|---|---|---|---|---|---|---|---|---|---|
| Market Price | Dividends | Market Price | Dividends | |||||||||||||||||||||
| Quarter Ended | High | Low | Declared | High | Low | Declared | ||||||||||||||||||
| March 31 | $ | 96.87 | $ | 84.01 | $ | 0.63 | $ | 62.67 | $ | 44.32 | $ | 0.55 | ||||||||||||
| June 30 | 113.52 | 89.73 | 0.63 | 71.31 | 58.44 | 0.55 | ||||||||||||||||||
| September 30 | 119.43 | 105.81 | 0.63 | 82.77 | 65.12 | 0.63 | ||||||||||||||||||
| December 31 | 121.38 | 108.49 | 0.63 | 88.41 | 78.03 | 0.63 |
Stockholders
On February 23, 2018, there were 66 holders of record of our common stock.
Dividend Policy
PCA expects to continue to pay regular cash dividends, although there is no assurance as to the timing or level of future dividend payments because these depend on future earnings, capital requirements, and financial condition. The timing and amount of future dividends are subject to the determination of PCA’s Board of Directors.
On August 31, 2016, PCA announced an increase of its quarterly cash dividend on its common stock from an annual payout of $2.20 per share to an annual payout of $2.52 per share. The first quarterly dividend of $0.63 per share was paid on October 14, 2016 to shareholders of record as of September 15, 2016.
During the year ended December 31, 2017, we paid $237.6 million of dividends to shareholders. On December 14, 2017 PCA's Board of Directors approved a regular quarterly cash dividend of $0.63 per share of common stock, which was paid on January 12, 2018 to shareholders of record as of December 26, 2017. The dividend payment was $59.4 million.
Purchases of Equity Securities
Stock Repurchase Program
On February 25, 2016, PCA announced that its Board of Directors authorized the repurchase of $200.0 million of the Company's outstanding common stock. At the time of the announcement, there was no remaining authority under previously announced programs. Repurchases may be made from time to time in open market or privately negotiated transactions in accordance with applicable securities regulations. The timing and amount of repurchases will be determined by the Company in its discretion based on factors such as PCA’s stock price and market and business conditions.
The Company did not repurchase any shares of its common stock under this authority during the year ended December 31, 2017. In 2016, we paid $100.3 million to repurchase 1,987,187 shares of common stock which fully depleted the $93.3 million of repurchase authority under previous authorizations by our board of directors. In 2015, we paid $154.7 million to repurchase 2,326,493 shares of common stock. As of December 31, 2017, we are authorized to repurchase $193.0 million of the Company’s common stock.
Pursuant to its equity incentive plan, the Company withholds shares from vesting employee equity awards to cover employee tax liabilities. Total shares withheld in 2017 were 97,946 to cover $10.8 million in employee tax liabilities. Total shares withheld in 2016 were 172,438 to cover $11.2 million of employee tax liabilities. Total shares withheld in 2015 were 129,983 for $8.7 million. Shares withheld are included in the number of shares repurchased in the table below.
The following table presents information related to our repurchases of common stock made under repurchase plans authorized by PCA's Board of Directors, and shares withheld to cover taxes on vesting of equity awards, during the three months ended December 31, 2017:
| Issuer Purchases of Equity Securities | |||||||||||||||||
|---|---|---|---|---|---|---|---|---|---|---|---|---|---|---|---|---|---|
| Period | Total Number of Shares Purchased (a) | Average Price Paid Per Share | Total Number of Shares Purchased as Part of Publicly Announced Plans or Programs | Approximate Dollar Value of Shares That May Yet Be Purchased Under the Plans or Programs (in millions) | |||||||||||||
| October 1-31, 2017 | — | $ | — | — | $ | 193.0 | |||||||||||
| November 1-30, 2017 | — | — | — | 193.0 | |||||||||||||
| December 1-31, 2017 | 500 | 117.76 | — | 193.0 | |||||||||||||
| Total | 500 | (a) | $ | 117.26 | — | $ | 193.0 |
| (a) | 500 shares were withheld from employees to cover income and payroll taxes on equity awards that vested during the period. |
|---|
Performance Graph
The graph below compares PCA’s cumulative 5-year total shareholder return on common stock with the cumulative total returns of the S&P 500 index; the S&P Midcap 400 index; and a Peer Group that includes two publicly-traded companies, which are International Paper Company and KapStone Paper and Packaging Corporation. The graph tracks the performance of a $100 investment (including the reinvestment of all dividends) in our common stock, in each index, and in the peer groups' common stock from December 31, 2012, through December 31, 2017. The stock price performance included in this graph is not necessarily indicative of future stock price performance.

| Cumulative Total Return | ||||||||||||||||||||||||
|---|---|---|---|---|---|---|---|---|---|---|---|---|---|---|---|---|---|---|---|---|---|---|---|---|
| December 31 | ||||||||||||||||||||||||
| 2012 | 2013 | 2014 | 2015 | 2016 | 2017 | |||||||||||||||||||
| Packaging Corporation of America | $ | 100.00 | $ | 169.39 | $ | 213.59 | $ | 178.16 | $ | 247.80 | $ | 360.53 | ||||||||||||
| S&P 500 | 100.00 | 132.39 | 150.51 | 152.59 | 170.84 | 208.14 | ||||||||||||||||||
| S&P Midcap 400 | 100.00 | 133.50 | 146.54 | 143.35 | 173.08 | 201.20 | ||||||||||||||||||
| Peer Group | 100.00 | 133.53 | 151.13 | 110.96 | 156.68 | 176.03 |
The information in the graph and table above is not deemed “filed” with the Securities and Exchange Commission and is not to be incorporated by reference in any of PCA’s filings under the Securities Act of 1933 or the Securities Exchange Act of 1934, whether made before or after the date of this Annual Report on Form 10-K, except to the extent that PCA specifically incorporates such information by reference.
Item 6. SELECTED FINANCIAL DATA
| --- | --- |
The following table sets forth selected historical financial data of PCA (dollars and shares in millions, except per share data). The information contained in the table should be read in conjunction with the disclosures in “Part II, Item 7. Management's Discussion and Analysis of Financial Condition and Results of Operations” and “Part II, Item 8. Financial Statements and Supplementary Data” of this Form 10-K.
| Year Ended December 31 | ||||||||||||||||||||
|---|---|---|---|---|---|---|---|---|---|---|---|---|---|---|---|---|---|---|---|---|
| 2017 (a) | 2016 (a) | 2015 (a) | 2014 (a) | 2013 (a) | ||||||||||||||||
| Statement of Income Data (b): | ||||||||||||||||||||
| Net Sales | $ | 6,444.9 | $ | 5,779.0 | $ | 5,741.7 | $ | 5,852.6 | $ | 3,665.3 | ||||||||||
| Net Income | 668.6 | 449.6 | 436.8 | 392.6 | 441.3 | |||||||||||||||
| Net income per common share: | ||||||||||||||||||||
| — basic | 7.09 | 4.76 | 4.47 | 3.99 | 4.57 | |||||||||||||||
| — diluted | 7.07 | 4.75 | 4.47 | 3.99 | 4.52 | |||||||||||||||
| Weighted average common shares outstanding: | ||||||||||||||||||||
| — basic | 93.5 | 93.5 | 96.6 | 97.0 | 96.6 | |||||||||||||||
| — diluted | 93.7 | 93.7 | 96.7 | 97.1 | 97.5 | |||||||||||||||
| EBITDA(c) | $ | 1,322.6 | $ | 1,138.3 | $ | 1,106.5 | $ | 1,083.7 | $ | 683.7 | ||||||||||
| Cash dividends declared per common share | 2.52 | 2.36 | 2.20 | 1.60 | 1.51 | |||||||||||||||
| Balance Sheet Data (b): | ||||||||||||||||||||
| Total assets | $ | 6,197.5 | $ | 5,777.0 | $ | 5,272.3 | $ | 5,258.7 | $ | 5,182.1 | ||||||||||
| Total debt obligations | 2,650.7 | 2,667.4 | 2,319.7 | 2,365.2 | 2,558.6 | |||||||||||||||
| Stockholders' equity | 2,182.6 | 1,759.8 | 1,633.3 | 1,521.4 | 1,356.8 |
| (a) | On October 25, 2013, we acquired Boise Inc. (Boise). Our financial results include Boise subsequent to acquisition. |
|---|
| (b) | Effective January 1, 2016, the Company adopted Accounting Standards Update (ASU) 2015-03 (Topic 835): Simplifying the Presentation of Debt Issuance Costs. We applied this guidance retrospectively, as required, and reclassified the debt issuance costs from “Other long-term assets” to “Long-term debt” on our Consolidated Balance Sheet to conform with current period presentation. Total assets for all periods presented have been updated to reflect this adoption. |
|---|
Effective December 31, 2015, the Company adopted Accounting Standards Update 2015-17, Balance Sheet Classification of Deferred Taxes. The guidance eliminates the requirement to classify deferred taxes between current and noncurrent and requires that all deferred tax assets and liabilities, along with any related valuation allowance, be classified as noncurrent on the balance sheet. Our total assets for all periods presented have been updated to reflect this adoption.
Effective January 1, 2014, the Company changed its method of accounting for inventories from lower of cost, as determined by the LIFO method, or market, to lower of cost, as determined by the average cost method, or market. The Company applied the change retrospectively to all prior periods presented herein in accordance with US generally accepted accounting principles (GAAP) relating to accounting changes.
| (c) | EBITDA represents income before interest (interest expense and interest income), income tax provision (benefit), and depreciation, amortization, and depletion. We present EBITDA because it provides a means to evaluate our performance on an ongoing basis using the same measure that is used by our management and because it is frequently used by investors and other interested parties in the evaluation of companies. EBITDA, however, is not a measure of our liquidity or financial performance under generally accepted accounting principles (GAAP) and should not be considered as an alternative to net income, income from operations, or any other performance measure derived in accordance with GAAP or as an alternative to cash flow from operating activities as a measure of our liquidity. Any analysis of non-GAAP financial measures should be done in conjunction with results presented in accordance with GAAP. The non-GAAP measures are not intended to be substitutes for GAAP financial measures and should not be used as such. See “Reconciliations of Non-GAAP Financial Measures to Reported Amounts” included in “Part II, Item 7. Management's Discussion and Analysis of Financial Condition and Results of Operations” of this Form 10-K for a reconciliation of non-GAAP measures to the most comparable GAAP measure. |
|---|
Item 7. MANAGEMENT'S DISCUSSION AND ANALYSIS OF FINANCIAL CONDITION AND RESULTS OF OPERATIONS
| --- | --- |
The following discussion and analysis of historical results of operations and financial condition should be read in conjunction with the audited financial statements and the notes thereto which appear elsewhere in this Form 10-K. This discussion includes forward-looking statements regarding our expectations with respect to our future performance, liquidity, and capital resources. Such statements, along with any other non-historical statements in the discussion, are forward-looking. See our discussion regarding forward-looking statements included under “Part I, Item 1A. Risk Factors” of this Form 10-K.
Overview
PCA is the fourth largest producer of containerboard products and the third largest producer of uncoated freesheet paper in North America, based on production capacity. We operate five containerboard mills, three paper mills, and 94 corrugated products manufacturing plants. Our containerboard mills produce linerboard and corrugating medium, which are papers primarily used in the production of corrugated products. Our corrugated products manufacturing plants produce a wide variety of corrugated packaging products, including conventional shipping containers used to protect and transport manufactured goods, multi-color boxes and displays with strong visual appeal that help to merchandise the packaged product in retail locations, and honeycomb protective packaging. In addition, we are a large producer of packaging for meat, fresh fruit and vegetables, processed food, beverages, and other industrial and consumer products. We also manufacture and sell white papers, including both commodity and specialty papers, which may have custom or specialized features such as colors, coatings, high brightness, and recycled content. We are headquartered in Lake Forest, Illinois and operate primarily in the United States.
Executive Summary
Net sales were $6.44 billion for the year ended December 31, 2017 and $5.78 billion in 2016. We reported $669 million of net income, or $7.07 per diluted share, compared to $450 million, or $4.75 per share in 2016. Net income included $100 million of income for special items (discussed below) in 2017, including $122 million of estimated income tax benefit related to the enactment in December 2017 of the Tax Cut and Jobs Act (H.R.1), compared to $12 million of expense in 2016. Excluding special items, we recorded $569 million of net income, or $6.02 per diluted share in 2017, compared to $462 million, or $4.88 per diluted share, in 2016. The increase was driven primarily by higher containerboard and corrugated products prices and mix and sales and production volumes driven by strong demand, partially offset by lower sales and production volumes and prices and mix in our Paper segment, higher input and operating costs, higher annual outage expenses, and higher depreciation expense and higher freight costs. For additional detail on special items included in reported GAAP results, see “Item 7. Reconciliations of Non-GAAP Financial Measures to Reported Amounts.”
Packaging segment income from operations was $944 million in 2017, compared to $711 million in 2016. Packaging segment EBITDA excluding special items was $1,257 million in 2017, compared to $1,019 million in 2016. The increase was driven primarily by higher containerboard and corrugated products prices and mix and sales and production volumes driven by strong demand; partially offset by higher input costs, primarily recycled fiber and energy; higher labor costs; and higher freight and depreciation expense.
Paper segment income from operations was $62 million in 2017, compared to $138 million in 2016. Paper segment EBITDA excluding special items was $153 million in 2017, compared to $199 million in 2016. The decrease was due primarily to lower paper sales and production volumes and prices and mix, higher energy costs, and higher annual outage expenses.
During the third quarter of 2017, the Company announced that it will discontinue production of uncoated freesheet and coated one-side grades at its Wallula, Washington mill in the second quarter of 2018 to begin the conversion of the No. 3 paper machine to a 400,000 ton-per-year virgin kraft linerboard machine. The Company incurred charges in the Paper segment relating to these activities during 2017 as described below under “Special Items and Earnings per Diluted Share, Excluding Special Items,” and will incur future charges. The total capital cost of the conversion is expected to be approximately $150 million.
Also, to further our corrugated products business growth strategy, on October 2, 2017, the Company acquired substantially all of the assets of Sacramento Container Corporation, and 100% of the membership interests of Northern Sheets, LLC and Central California Sheets, LLC (collectively the “Sacramento Container acquisition”) for $265 million with cash on hand. The acquired companies operate two full-line corrugated product operations and sheet feeders in McClellan, California and Kingsburg, California. The operating results of the companies acquired in the Sacramento Container acquisition are included in our results and reported in the Packaging segment from and after October 2, 2017. We are in the process of integrating these operations into our business.
During 2016, we made two acquisitions of corrugated products businesses in the Packaging segment: TimBar Corporation ("TimBar") and Columbus Container, Inc. ("Columbus Container"). On August 29, 2016, we acquired substantially all of the assets of TimBar, a large independent corrugated products producer with six domestic corrugated products production facilities for a purchase price of $386 million. To finance the acquisition, we borrowed $385 million under a new five-year term loan facility, which we have subsequently refinanced. On November 30, 2016, we acquired substantially all of the assets of Columbus Container for a purchase price of $100 million. Columbus Container is a full-service provider of corrugated packaging products, with a full-line corrugated products plant and warehousing facilities and other related operations located in Indiana and Illinois. We used available cash on hand to pay the purchase price for Columbus Container. The operating results of TimBar and Columbus Container are included in our results and reported in the Packaging segment from and after the respective dates of acquisition. Accordingly, 2016 reflects a partial year of ownership of these operations and 2017 reflects a full year of ownership of these operations. These operations have been substantially integrated into our business and have helped drive growth in our corrugated products volumes during 2017.
On December 13, 2017, we issued $1 billion of senior notes, consisting of $500 million of three year notes bearing interest at a fixed rate of 2.45% and $500 million of ten year notes bearing interest at a fixed rate of 3.40%. We used the net proceeds of the offering to repay all of our outstanding variable-rate term loan debt, which was approximately $976 million at the time of the offering. As a result, all of our outstanding long-term debt as of December 31, 2017 bears interest at fixed rates.
Special Items and Earnings per Diluted Share, Excluding Special Items
Earnings per diluted share, excluding special items, in 2017 and 2016 were as follows:
| Year Ended December 31 | ||||||||
|---|---|---|---|---|---|---|---|---|
| 2017 | 2016 | |||||||
| Earnings per diluted share | $ | 7.07 | $ | 4.75 | ||||
| Special items: | ||||||||
| Facilities closure and other costs (a) | (0.04 | ) | 0.08 | |||||
| Acquisition and integration related costs (b) | 0.01 | 0.03 | ||||||
| Wallula mill restructuring (c) | 0.21 | — | ||||||
| Expiration of timberland repurchase option (d) | (0.01 | ) | — | |||||
| Deferred debt issuance costs (e) | 0.01 |
Showing the first 8K of 84K characters. Open the full section
Item 7A. QUANTITATIVE AND QUALITATIVE DISCLOSURES ABOUT MARKET RISK
| --- | --- |
PCA is exposed to the impact of interest rate changes and changes in the market value of its financial instruments. PCA periodically enters into derivatives in order to minimize these risks, but not for trading purposes. We were not party to any derivative-based arrangements at December 31, 2017. For a discussion of derivatives and hedging activities, see Note 13, Derivative Instruments and Hedging Activities, of the Notes to Consolidated Financial Statements in “Part II, Item 8. Financial Statements and Supplementary Data” of this Form 10-K.
At December 31, 2017, the interest rates on 100% of PCA’s outstanding debt are fixed.
Item 8. FINANCIAL STATEMENTS AND SUPPLEMENTARY DATA
| --- | --- |
INDEX TO FINANCIAL STATEMENTS
REPORT OF INDEPENDENT REGISTERED PUBLIC ACCOUNTING FIRM
To the stockholders and board of directors Packaging Corporation of America:
Opinion on the Consolidated Financial Statements
We have audited the accompanying consolidated balance sheets of Packaging Corporation of America and subsidiaries (the “Company”) as of December 31, 2017 and 2016, the related consolidated statements of income and comprehensive income, changes in stockholders’ equity, and cash flows for each of the years in the three‑year period ended December 31, 2017, and the related notes (collectively, the “consolidated financial statements”). In our opinion, the consolidated financial statements present fairly, in all material respects, the financial position of the Company as of December 31, 2017 and 2016, and the results of its operations and its cash flows for each of the years in the three‑year period ended December 31, 2017, in conformity with U.S. generally accepted accounting principles.
We also have audited, in accordance with the standards of the Public Company Accounting Oversight Board (United States) (“PCAOB”), the Company’s internal control over financial reporting as of December 31, 2017, based on criteria established in Internal Control – Integrated Framework (2013) issued by the Committee of Sponsoring Organizations of the Treadway Commission, and our report dated February 28, 2018 expressed an unqualified opinion on the effectiveness of the Company’s internal control over financial reporting.
Basis for Opinion
These consolidated financial statements are the responsibility of the Company’s management. Our responsibility is to express an opinion on these consolidated financial statements based on our audits. We are a public accounting firm registered with the PCAOB and are required to be independent with respect to the Company in accordance with the U.S. federal securities laws and the applicable rules and regulations of the Securities and Exchange Commission and the PCAOB.
We conducted our audits in accordance with the standards of the PCAOB. Those standards require that we plan and perform the audit to obtain reasonable assurance about whether the consolidated financial statements are free of material misstatement, whether due to error or fraud. Our audits included performing procedures to assess the risks of material misstatement of the consolidated financial statements, whether due to error or fraud, and performing procedures that respond to those risks. Such procedures included examining, on a test basis, evidence regarding the amounts and disclosures in the consolidated financial statements. Our audits also included evaluating the accounting principles used and significant estimates made by management, as well as evaluating the overall presentation of the consolidated financial statements. We believe that our audits provide a reasonable basis for our opinion.
| /s/ KPMG LLP | |
|---|---|
| We have served as the Company’s auditor since 2014. | |
| Chicago, Illinois | |
| February 28, 2018 |
REPORT OF INDEPENDENT REGISTERED PUBLIC ACCOUNTING FIRM ON INTERNAL CONTROL OVER FINANCIAL REPORTING
To the stockholders and board of directors Packaging Corporation of America:
Opinion on Internal Control Over Financial Reporting
We have audited Packaging Corporation of America and subsidiaries’ (the “Company”) internal control over financial reporting as of December 31, 2017, based on criteria established in Internal Control – Integrated Framework (2013) issued by the Committee of Sponsoring Organizations of the Treadway Commission. In our opinion, the Company maintained, in all material respects, effective internal control over financial reporting as of December 31, 2017, based on criteria established in Internal Control – Integrated Framework (2013) issued by the Committee of Sponsoring Organizations of the Treadway Commission.
We also have audited, in accordance with the standards of the Public Company Accounting Oversight Board (United States) (“PCAOB”), the consolidated balance sheets of the Company as of December 31, 2017 and 2016, and the related consolidated statements of income and comprehensive income, changes in stockholders’ equity, and cash flows for each of the years in the three-year period ended December 31, 2017, and related notes (collectively, the consolidated financial statements), and our report dated February 28, 2018 expressed an unqualified opinion on those consolidated financial statements.
The Company acquired Sacramento Container Corporation, Northern Sheets LLC and Central California Sheets LLC (collectively, Sacramento Container) during 2017, and management excluded from its assessment of the effectiveness of the Company’s internal control over financial reporting as of December 31, 2017, Sacramento Container’s internal control over financial reporting. As of and for the year ended December 31, 2017, Sacramento Container accounted for approximately 5% of the Company’s consolidated total assets and 1% of consolidated net sales. Our audit of internal control over financial reporting of the Company also excluded an evaluation of the internal control over financial reporting of Sacramento Container.
Basis for Opinion
The Company’s management is responsible for maintaining effective internal control over financial reporting and for its assessment of the effectiveness of internal control over financial reporting, included in the accompanying Management’s Report on Internal Control Over Financial Reporting. Our responsibility is to express an opinion on the Company’s internal control over financial reporting based on our audit. We are a public accounting firm registered with the PCAOB and are required to be independent with respect to the Company in accordance with the U.S. federal securities laws and the applicable rules and regulations of the Securities and Exchange Commission and the PCAOB.
We conducted our audit in accordance with the standards of the PCAOB. Those standards require that we plan and perform the audit to obtain reasonable assurance about whether effective internal control over financial reporting was maintained in all material respects. Our audit of internal control over financial reporting included obtaining an understanding of internal control over financial reporting, assessing the risk that a material weakness exists, and testing and evaluating the design and operating effectiveness of internal control based on the assessed risk. Our audit also included performing such other procedures as we considered necessary in the circumstances. We believe that our audit provides a reasonable basis for our opinion.
Definition and Limitations of Internal Control Over Financial Reporting
A company’s internal control over financial reporting is a process designed to provide reasonable assurance regarding the reliability of financial reporting and the preparation of financial statements for external purposes in accordance with generally accepted accounting principles. A company’s internal control over financi
Showing the first 8K of 175K characters. Open the full section
Item 9. CHANGES IN AND DISAGREEMENTS WITH ACCOUNTANTS ON ACCOUNTING AND FINANCIAL DISCLOSURE
| --- | --- |
Not applicable.
Item 9A. CONTROLS AND PROCEDURES
| --- | --- |
Controls and Procedures
PCA maintains disclosure controls and procedures (as defined in Rule 13a-15(e) of the Securities Exchange Act of 1934) that are designed to provide reasonable assurance that information required to be disclosed in PCA’s filings under the Securities Exchange Act is recorded, processed, summarized and reported within the periods specified in the rules and forms of the SEC and that such information is accumulated and communicated to PCA’s management, including its Chief Executive Officer and Chief Financial Officer, as appropriate, to allow timely decisions regarding required disclosure.
Prior to filing this report, PCA completed an evaluation under the supervision and with the participation of PCA’s management, including PCA’s Chief Executive Officer and Chief Financial Officer, of the effectiveness of the design and operation of PCA’s disclosure controls and procedures as of December 31, 2017. The evaluation of PCA’s disclosure controls and procedures included a review of the controls’ objectives and design, PCA’s implementation of the controls and the effect of the controls on the information generated for use in this report. Based on this evaluation, PCA’s Chief Executive Officer and Chief Financial Officer concluded that PCA’s disclosure controls and procedures were effective at the reasonable assurance level as of December 31, 2017.
Changes in Internal Control over Financial Reporting
On October 2, 2017, PCA acquired Sacramento Container Corporation, Northern Sheets LLC and Central California Sheets LLC (collectively, “Sacramento Container”). We are currently in the process of evaluating and integrating Sacramento Container’s controls over financial reporting which may result in changes or additions to PCA’s internal control over financial reporting. Under guidelines established by the SEC, companies are permitted to exclude acquisitions from their assessment of internal control over financial reporting during the first year of an acquisition while integrating the acquired company. We excluded Sacramento Container from the assessment of internal control over financial reporting at December 31, 2017. Except as may relate to the Sacramento Container acquisition, there were no other changes in our internal control over financial reporting (as defined in Rule 13a-15(f) under the Exchange Act) that occurred during the most recent fiscal quarter ended December 31, 2017 that have materially affected, or are reasonably likely to materially affect, our internal control over financial reporting. As of and for the year ended December 31, 2017, Sacramento Container accounted for approximately 5% of the Company's consolidated total assets and approximately 1% of consolidated net sales.
Management’s Report on Internal Control Over Financial Reporting
PCA’s management is responsible for establishing and maintaining adequate internal control over financial reporting, as such term is defined in Exchange Act Rule 13a-15(f). Internal control over financial reporting is a process designed to provide reasonable assurance regarding the reliability of financial reporting and the preparation of financial statements for external purposes in accordance with generally accepted accounting principles. Internal control over financial reporting includes those policies and procedures that (1) pertain to the maintenance of records that, in reasonable detail, accurately and fairly reflect the transactions and dispositions of the Company’s assets; (2) provide reasonable assurance that transactions are recorded as necessary to permit preparation of financial statements in accordance with generally accepted accounting principles, and that receipts and expenditures are being made only with proper authorizations; and (3) provide reasonable assurance regarding prevention or timely detection of unauthorized acquisition, use, or disposition of the Company’s assets that could have a material effect on the financial statements.
Because of its inherent limitations, PCA’s internal control over financial reporting may not prevent or detect misstatements. A control system, no matter how well conceived and operated, can provide only reasonable, not absolute, assurance that objectives of the control system are met. Because of the inherent limitations in all control systems, no evaluation of controls can provide absolute assurance that all control issues and instances of fraud, if any, have been detected. Also, projections of any evaluation of effectiveness to future periods are subject to the risk that controls become inadequate because of changes in conditions, or that the degree of compliance with the policies and procedures may deteriorate.
PCA’s management, under the supervision of and with the participation of the Chief Executive Officer and Chief Financial Officer, assessed the Company’s internal control over financial reporting as of December 31, 2017, based on criteria established in Internal Control - Integrated Framework (2013) issued by the Committee of Sponsoring Organizations of the Treadway Commission (COSO). Based on this assessment and excluding the operations acquired from Sacramento Container, PCA’s management concluded that its internal control over financial reporting was effective as of December 31, 2017, based on the specified criteria.
KPMG LLP, the independent registered public accounting firm that audited PCA’s financial statements included in this Form 10-K, has also audited the effectiveness of the Company’s internal control over financial reporting. Their attestation report precedes PCA’s audited financial statements included elsewhere in this report.
Item 9B. OTHER INFORMATION
| --- | --- |
None.
PART III
Item 10. DIRECTORS, EXECUTIVE OFFICERS, AND CORPORATE GOVERNANCE
| --- | --- |
Information regarding PCA’s executive officers required by this Item 10 is set forth in Item 1 of Part I of this report under the caption “Executive Officers of the Registrant.”
The following information required by this Item 10 will be included in PCA’s Proxy Statement for the 2018 Annual Meeting of Stockholders and is incorporated by reference herein:
| • | Information regarding PCA’s directors included under the caption “Election of Directors” |
|---|
| • | Information regarding PCA’s Audit Committee and financial experts included under the caption “Election of Directors - Audit Committee” |
|---|
| • | Information regarding PCA’s code of ethics included under the caption “Election of Directors - Code of Ethics” |
|---|
| • | Information regarding PCA’s stockholder nominating procedures included under the captions “Election of Directors - Nominating and Governance Committee,” “Other Information - Recommendations for Board - Nominated Director Nominees,” and “Other Information - Procedures for Nominating Directors or Bringing Business Before the 2018 Annual Meeting” |
|---|
| • | Information regarding compliance with Section 16(a) of the Securities Exchange Act of 1934 included under the caption “Section 16(a) Beneficial Ownership Reporting Compliance” |
|---|
Item 11. EXECUTIVE COMPENSATION
| --- | --- |
Information with respect to executive compensation required by this Item 11 will be included in PCA’s Proxy Statement under the captions “Compensation Discussion and Analysis,” “Executive Officer and Director Compensation” (including all subcaptions and tables thereunder) and “Board Committees - Compensation Committee” and is incorporated herein by reference.
Item 12. SECURITY OWNERSHIP OF CERTAIN BENEFICIAL OWNERS AND MANAGEMENT AND RELATED STOCKHOLDER MATTERS
| --- | --- |
Information with respect to security ownership of certain beneficial owners and management required by this Item 12 will be included in PCA’s Proxy Statement under the caption “Ownership of Our Stock” and is incorporated herein by reference.
Authorization of Securities under Equity Compensation Plans — Securities authorized for issuance under our equity compensation plans at December 31, 2017 are as follows:
| Column | ||||||||||||
|---|---|---|---|---|---|---|---|---|---|---|---|---|
| A | B | C | ||||||||||
| Plan Category | Number of Securities to Be Issued Upon Exercise of Outstanding Options, Warrants, and Rights (a) | Weighted Average Exercise Price of Outstanding Options, Warrants, and Rights | Number of Securities Remaining Available for Future Issuance Under Equity Compensation Plans (Excluding Securities Reflected in Column A) | |||||||||
| Equity compensation plans approved by securityholders | — | $ | — | 1,008,690 | ||||||||
| Equity compensation plans not approved by securityholders | N/A | N/A | N/A | |||||||||
| Total | — | $ | — | 1,008,690 |
| (a) | Does not include 966,290 shares of unvested restricted stock and performance units granted pursuant to our Amended and Restated 1999 Long-Term Equity Incentive Plan. |
|---|
Item 13. CERTAIN RELATIONSHIPS AND RELATED TRANSACTIONS, AND DIRECTOR INDEPENDENCE
| --- | --- |
Information with respect to certain relationships and related transactions and director independence required by this Item 13 will be included in PCA’s Proxy Statement under the captions “Transactions with Related Persons” and “Election of Directors - Determination of Director Independence,” respectively, and is incorporated herein by reference.
Item 14. PRINCIPAL ACCOUNTING FEES AND SERVICES
| --- | --- |
Information with respect to fees and services of the principal accountant required by this Item 14 will be included in PCA’s Proxy Statement under the caption “Ratification of Appointment of the Independent Registered Public Accounting Firm” under the subcaptions “- Fees to the Independent Registered Public Accounting Firm” and “- Audit Committee Preapproval Policy for Audit and Non-Audit Fees” and are incorporated herein by reference.
PART IV
Item 15. EXHIBITS, FINANCIAL STATEMENT SCHEDULES
| --- | --- |
| (a) | The following documents are filed as a part of this report: |
|---|
| (1) | The financial statements listed in the “Index to Financial Statements.” |
|---|
| (2) | Financial Statement Schedule. |
|---|
All schedules for which provision is made in the applicable accounting regulations of the Securities and Exchange Commission are not required under the related instructions, are inapplicable or not material, or the information called for thereby is otherwise included in the financial statements or the accompanying notes to the financial statements and therefore, have been omitted.
| (3) | Exhibits |
|---|
| Exhibit Number | Description | |
|---|---|---|
| 31.1 | Certification of Chief Executive Officer, As Adopted Pursuant to Section 302 of the Sarbanes-Oxley Act of 2002.† | |
| 31.2 | Certification of Chief Financial Officer, As Adopted Pursuant to Section 302 of the Sarbanes-Oxley Act of 2002.† | |
| 32 | Certification of Chief Executive Officer and Chief Financial Officer Pursuant to 18 U.S.C. §1350, As Adopted Pursuant to Section 906 of the Sarbanes-Oxley Act of 2002.† | |
| 101 | The following financial information from Packaging Corporation of America’s Annual Report on Form 10-K for the year ended December 31, 2017, formatted in XBRL (eXtensible Business Reporting Language): (i) Consolidated Statements of Income for the years ended December 31, 2017, 2016, and 2015, (ii) Consolidated Balance Sheets at December 31, 2017 and 2016, (iii) Consolidated Statements of Cash Flows for the years ended December 31, 2017, 2016, and 2015, (iv) Consolidated Statements of Changes in Stockholders’ Equity for the years ended December 31, 2017, 2016, and 2015, (v) the Notes to Consolidated Financial Statements, and (vi) Financial Statement Schedule-Valuation and Qualifying Accounts. |
| * | Management contract or compensatory plan or arrangement. |
|---|
| ** | Confidential information in this exhibit has been omitted and filed separately with the Securities and Exchange Commission pursuant to a confidential treatment request under Rule 406 of the Securities Act of 1933, as amended. |
|---|
| † | Filed herewith. |
|---|
SIGNATURES
Pursuant to the requirements of Section 13 or 15(d) of the Securities Exchange Act of 1934, the registrants have duly caused this report to be signed on their behalf by the undersigned, thereunto duly authorized on February 28, 2018.
| Packaging Corporation of America | ||
|---|---|---|
| /s/ MARK W. KOWLZAN | ||
| Mark W. Kowlzan | ||
| Chairman of the Board and Chief Executive Officer | ||
| /s/ ROBERT P. MUNDY | ||
| Robert P. Mundy | ||
| Senior Vice President and Chief Financial Officer |
Pursuant to the requirements of the Securities Exchange Act of 1934, this report has been signed below on February 28, 2018, by the following persons on behalf of the registrants and in the capacities indicated.
| Signature | Capacity | |
|---|---|---|
| /s/ MARK W. KOWLZAN | ||
| Mark W. Kowlzan | Chairman of the Board and Chief Executive Officer | |
| (Principal Executive Officer) | ||
| /s/ ROBERT P. MUNDY | ||
| Robert P. Mundy | Senior Vice President and Chief Financial Officer | |
| (Principal Financial and Accounting Officer) | ||
| * | ||
| Cheryl K. Beebe | Director | |
| * | ||
| Duane Farrington | Director | |
| * | ||
| Hasan Jameel | Director | |
| * | ||
| Robert C. Lyons | Director | |
| * | ||
| Thomas P. Maurer | Director | |
| * | ||
| Samuel M. Mencoff | Director | |
| * | ||
| Roger B. Porter | Director | |
| * | ||
| Thomas S. Souleles | Director | |
| * | ||
| Paul T. Stecko | Director | |
| * | ||
| James D. Woodrum | Director | |
| /s/ ROBERT P. MUNDY | ||
| Robert P. Mundy | ||
| (Attorney-In-Fact) |