 filings.tools
Packaging Corp of America 10-K 2023-12-31
Filed 2024-02-29. 22 sections, 327K characters. Original on sec.gov · Markdown · JSON
Cover and table of contents
UNITED STATES
SECURITIES AND EXCHANGE COMMISSION
Washington, D.C. 20549
Form 10-K
| ☒ | ANNUAL REPORT PURSUANT TO SECTION 13 OR 15(d) OF THE SECURITIES EXCHANGE ACT OF 1934 |
For the fiscal year ended December 31, 2023
| ☐ | TRANSITION REPORT PURSUANT TO SECTION 13 OR 15(d) OF THE SECURITIES EXCHANGE ACT OF 1934 FOR THE TRANSITION PERIOD FROM TO |
Commission file number 1-15399
(Exact Name of Registrant as Specified in its Charter)
| Delaware | 36-4277050 | |
| (State or Other Jurisdiction of Incorporation or Organization) | (I.R.S. Employer Identification No.) | |
| 1 North Field Court**,** Lake Forest**,** Illinois | 60045 | |
| (Address of Principal Executive Offices) | (Zip Code) |
Registrant's telephone number, including area code: (847) 482-3000
Securities registered pursuant to Section 12(b) of the Act:
| Title of each class | Trading Symbol(s) | Name of each exchange on which registered |
| Common Stock, par value $0.01 per share | PKG | New York Stock Exchange |
Securities registered pursuant to Section 12(g) of the Act: None
Indicate by check mark if the registrant is a well-known seasoned issuer, as defined in Rule 405 of the Securities Act. Yes ☒ No ☐
Indicate by check mark if the registrant is not required to file reports pursuant to Section 13 or Section 15(d) of the Act. Yes ☐ No ☒
Indicate by check mark whether the registrant (1) has filed all reports required to be filed by Section 13 or 15(d) of the Securities Exchange Act of 1934 during the preceding 12 months (or for such shorter period that the registrant was required to file such reports), and (2) has been subject to such filing requirements for the past 90 days. Yes ☒ No ☐
Indicate by check mark whether the registrant has submitted electronically every Interactive Data File required to be submitted pursuant to Rule 405 of Regulation S-T (§232.405 of this chapter) during the preceding 12 months (or for such shorter period that the registrant was required to submit such files). Yes ☒ No ☐
Indicate by check mark whether the registrant is a large accelerated filer, an accelerated filer, a non-accelerated filer, a smaller reporting company, or an emerging growth company. See the definitions of “large accelerated filer,” “accelerated filer,” “smaller reporting company,” and “emerging growth company” in Rule 12b-2 of the Exchange Act.
| Large accelerated filer | ☒ | Accelerated filer | ☐ | |||
| Non-accelerated filer | ☐ | Smaller reporting company | ☐ | |||
| Emerging growth company | ☐ |
If an emerging growth company, indicate by check mark if the registrant has elected not to use the extended transition period for complying with any new or revised financial accounting standards provided pursuant to Section 13(a) of the Exchange Act. ☐
Indicate by check mark whether the registrant has filed a report on and attestation to its management’s assessment of the effectiveness of its internal control over financial reporting under Section 404(b) of the Sarbanes-Oxley Act (15 U.S.C. 7262(b)) by the registered public accounting firm that prepared or issued its audit report. ☒
If securities are registered pursuant to Section 12(b) of the Act, indicate by check mark whether the financial statements of the registrant included in the filing reflect the correction of an error to previously issued financial statements. ☐
Indicate by check mark whether any of those error corrections are restatements that required a recovery analysis of incentive-based compensation received by any of the registrant’s executive officers during the relevant recovery period pursuant to §240.10D-1(b). ☐
Indicate by check mark whether the registrant is a shell company (as defined in Rule 12b-2 of the Exchange Act). Yes ☐ No ☒
At June 30, 2023, the last day of the Registrant's most recently completed second fiscal quarter, the aggregate market value of Registrant's common equity held by non-affiliates was approximately $11,671,075,503 based upon the closing sale price as reported on the New York Stock Exchange. This calculation of market value has been made for the purposes of this report only and should not be considered as an admission or conclusion by the Registrant that any person is in fact an affiliate of the Registrant.
On February 23, 2024, there were 89,624,119 shares of Common Stock outstanding.
DOCUMENTS INCORPORATED BY REFERENCE
Specified portions of the Proxy Statement for the Registrant's 2024 Annual Meeting of Stockholders are incorporated by reference to the extent indicated in Part III of this Form 10-K.
Table of Contents
PART I
Item 1. BUSINESS
Packaging Corporation of America (“we,” “us,” “our,” “PCA,” or the “Company”) is the third largest producer of containerboard products and a leading producer of uncoated freesheet (UFS) paper in North America. We operate eight mills and 86 corrugated products plants and related facilities. We are headquartered in Lake Forest, Illinois and operate primarily in the United States.
We report in three reportable segments: Packaging, Paper and Corporate and Other. For segment financial information see Note 18, Segment Information, of the Notes to Consolidated Financial Statements in “Part II, Item 8, Financial Statements and Supplementary Data” of this Form 10-K.
Production and Shipments
The following table summarizes the Packaging segment's containerboard production and corrugated products shipments and the Paper segment's UFS production.
| First Quarter | Second Quarter | Third Quarter | Fourth Quarter | Full Year | ||||||||||||||||||||
| Containerboard Production (thousand tons) | 2023 | 1,086 | 1,112 | 1,118 | 1,213 | 4,529 | ||||||||||||||||||
| 2022 | 1,233 | 1,256 | 1,116 | 961 | 4,566 | |||||||||||||||||||
| 2021 | 1,195 | 1,193 | 1,256 | 1,243 | 4,887 | |||||||||||||||||||
| Corrugated Products Shipments (billion square feet) | 2023 | 14.7 | 14.9 | 15.2 | 15.7 | 60.5 | ||||||||||||||||||
| 2022 | 16.8 | 16.5 | 15.4 | 14.7 | 63.4 | |||||||||||||||||||
| 2021 | 16.4 | 16.5 | 16.4 | 16.4 | 65.7 | |||||||||||||||||||
| UFS Production (thousand tons) | 2023 | 126 | 116 | 109 | 121 | 472 | ||||||||||||||||||
| 2022 | 126 | 127 | 123 | 130 | 506 | |||||||||||||||||||
| 2021 | 145 | 149 | 148 | 130 | 572 |
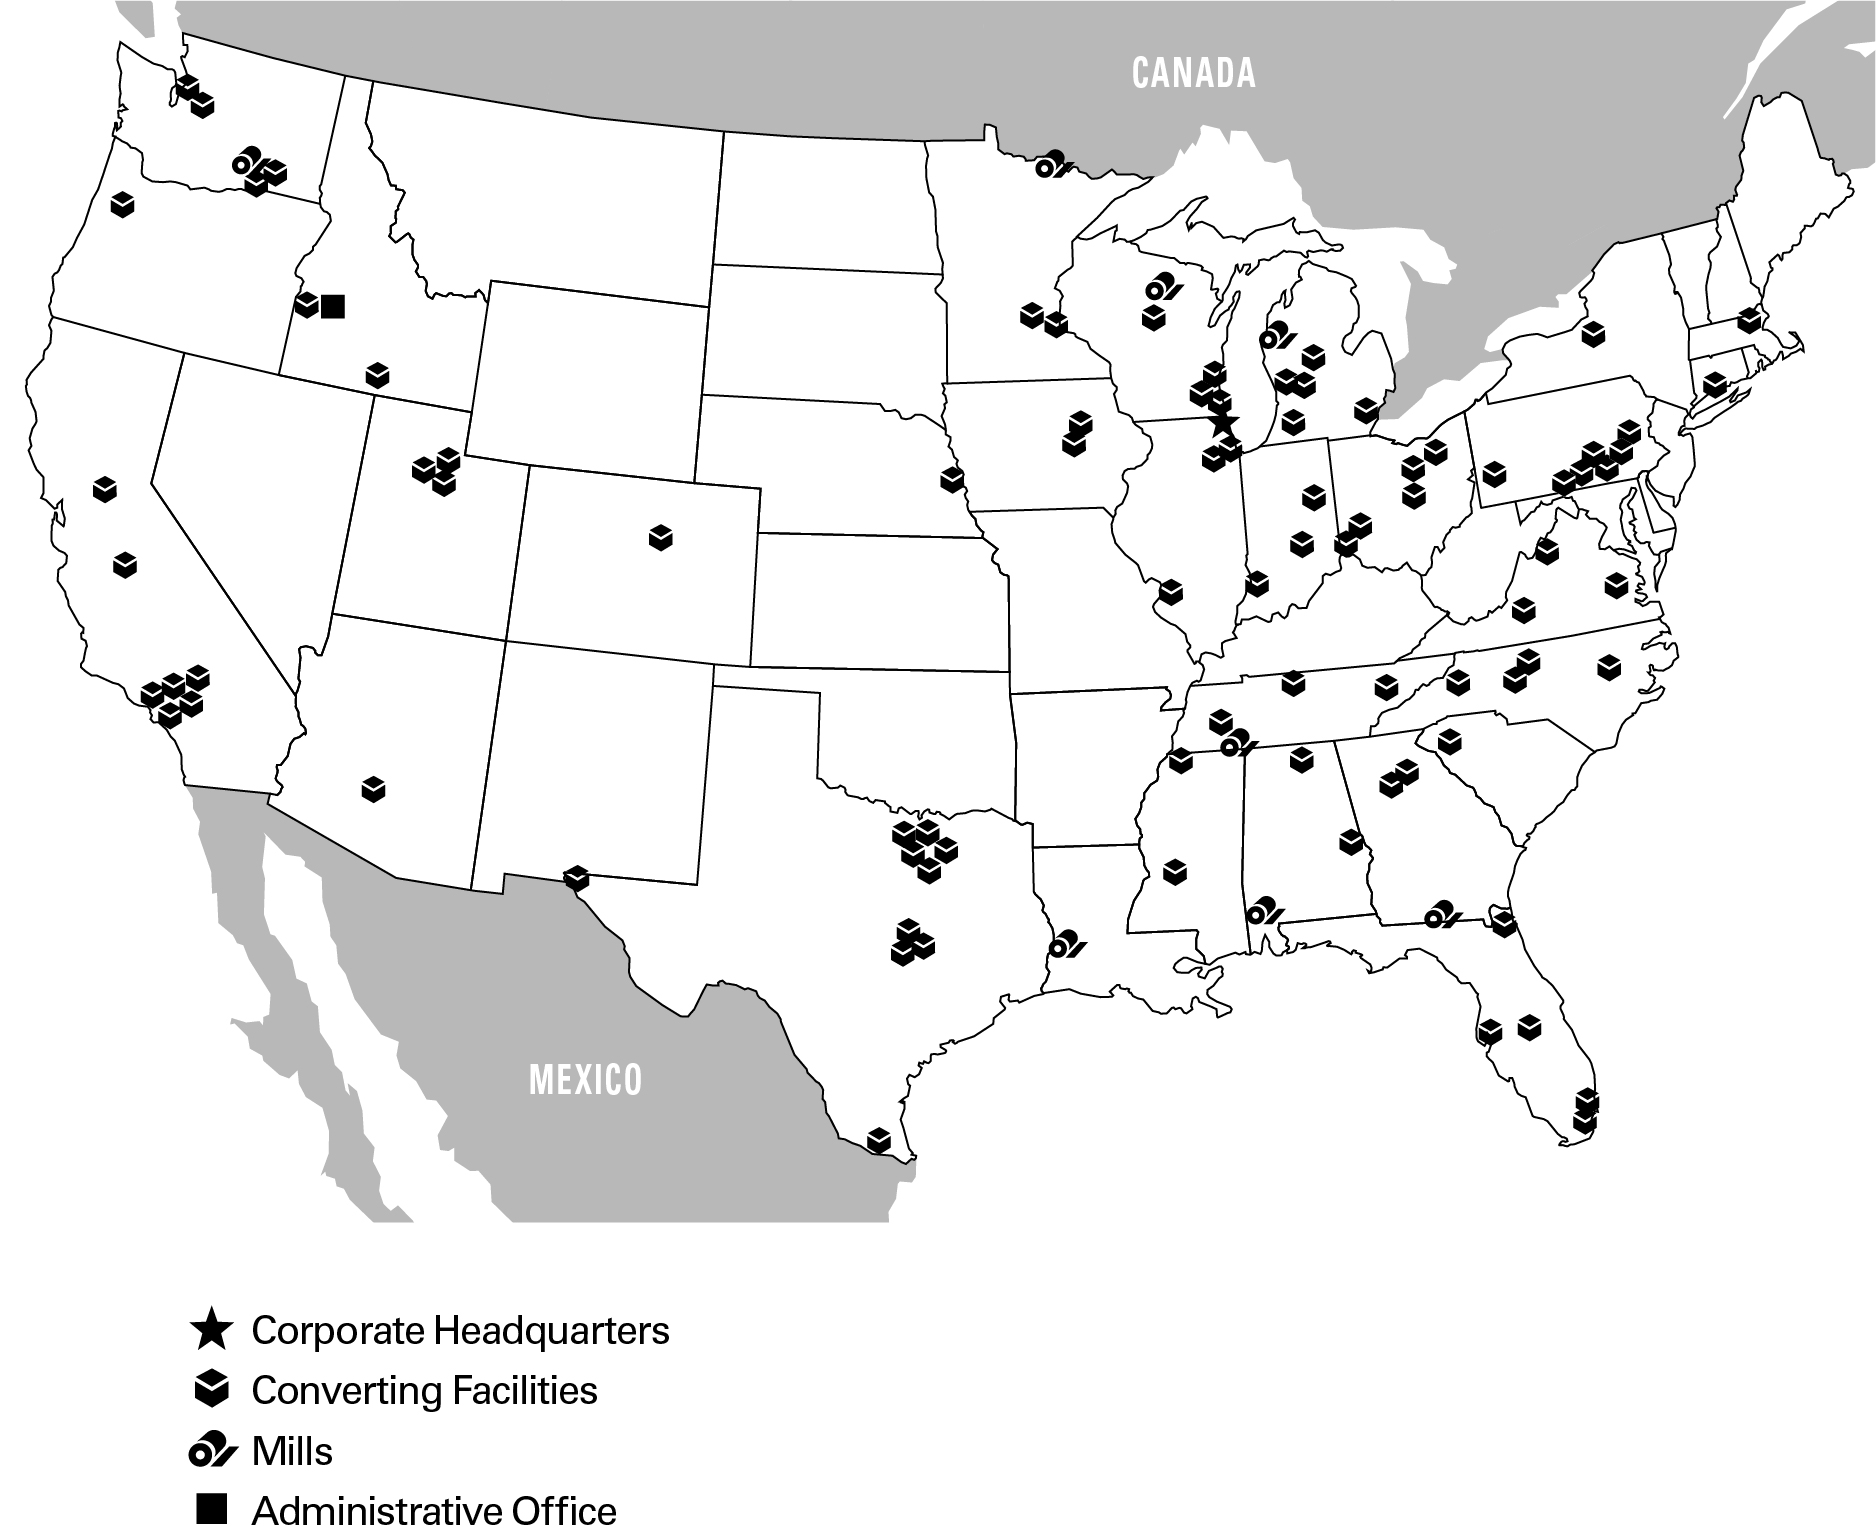
Below is a map of our locations:
Packa****ging
Packaging Products
Our containerboard mills produce linerboard and corrugating medium, which are papers primarily used in the production of corrugated products. Our corrugated products manufacturing plants produce a wide variety of corrugated packaging products, including conventional shipping containers used to protect and transport manufactured goods, multi-color boxes and displays with strong visual appeal that help to merchandise the packaged product in retail locations, and honeycomb protective packaging. In addition, we are a large producer of packaging for meat, fresh fruit and vegetables, processed food, beverages, and other industrial and consumer products. Our products are sustainable and are produced from renewable raw materials, predominately using energy derived from biogenic fuels in our production processes and are recyclable at end-of-life.
During the year ended December 31, 2023, our Packaging segment produced 4.5 million tons of containerboard at our mills. Our corrugated products manufacturing plants sold 60.5 billion square feet (BSF) of corrugated products. The Packaging segment’s net sales to third parties totaled $7.1 billion in 2023.
Facilities
We manufacture containerboard, which includes a variety of performance and specialty grades, at our containerboard mills. Total annual containerboard capacity was approximately 5.1 million tons as of December 31, 2023. We also produce corrugated and protective packaging products at 86 manufacturing locations. The following provides more details of our primary operating facilities:
Counce. Our Counce, Tennessee mill produces kraft linerboard on two machines. The mill can produce basis weights from 26 lb. to 90 lb.
DeRidder. Our DeRidder, Louisiana mill produces kraft linerboard on its No. 1 machine and kraft linerboard and corrugating medium on its No. 3 machine. The mill can produce linerboard in basis weights of 26 lb. to 69 lb. and medium in basis weights of 23 lb. to 33 lb.
Valdosta. Our Valdosta, Georgia mill produces kraft linerboard on one machine. The mill can produce basis weights from 35 lb. to 96 lb.
Tomahawk. Our Tomahawk, Wisconsin mill produces corrugating medium on two machines. The mill can produce basis weights from 23 lb. to 47 lb.
Filer City. Our Filer City, Michigan mill produces corrugating medium on three machines. The mill can produce basis weights from 20 lb. to 47 lb.
Wallula. Our Wallula, Washington mill produces corrugating medium on its No. 2 machine and kraft linerboard and corrugating medium on its No. 3 machine. The mill can produce medium in basis weights from 23 lb. to 33 lb. and linerboard in basis weights from 31 lb. to 52 lb.
Jackson. Our Jackson, Alabama mill produces kraft linerboard on its No. 3 machine and kraft linerboard and corrugating medium on its No. 1 machine. The mill can produce linerboard in basis weights from 22 lb. to 34 lb. and medium in basis weights from 23 lb. to 33 lb.
Before October 2020, Jackson had historically operated as a UFS paper mill, with its results of operations reported in our Paper segment. Beginning in October 2020, operating results for the Jackson mill are included in both the Packaging and Paper segments. During the fourth quarter of 2020, in order to meet strong packaging demand and maintain appropriate inventory levels, we temporarily began producing linerboard on the No. 3 machine and, in the first quarter of 2021, we announced the discontinuation of producing uncoated freesheet paper grades on the machine and the permanent conversion of the machine to produce linerboard. Beginning in the third quarter of 2021, we began producing corrugating medium on the No. 1 machine. The production of corrugating medium on the No. 1 machine has continued to date, and consequently, the operating results for the Jackson mill are included in the Packaging segment for the periods presented.
As of December 31, 2023, we operated 86 corrugated manufacturing and protective packaging operations, a technical and development center, seven regional design centers, a rotogravure printing operation, and a complement of packaging supplies and distribution centers. Of the 86 manufacturing facilities, 58 are combining operations, commonly called corrugated plants, which manufacture corrugated sheets and finished corrugated packaging products, 27 are sheet plants, which procure combined sheets and manufacture finished corrugated packaging products, and one is a corrugated sheet-only manufacturer.
Corrugated products plants tend to be located in close proximity to customers to minimize freight costs. Each of our plants serves a market radius of approximately 150 miles. Our sheet plants are generally located in close proximity to our larger corrugated plants, which enables us to offer additional services and converting capabilities such as small volume and quick turnaround items.
Major Raw Materials Used
Fiber supply. Fiber is the largest raw material cost to manufacture containerboard. We consume both virgin wood fiber and recycled fiber in our containerboard mills, and all of our fiber comes from renewable resources. Our mill system has the capability to shift a portion of its fiber consumption between softwood, hardwood, and recycled sources. All of our mills can utilize virgin wood fiber and all of our mills, other than the Valdosta mill, can utilize some recycled fiber in their containerboard production. Our corrugated manufacturing operations generate recycled fiber as a by-product from the manufacturing process, which is consumed by our mills. In 2023, our usage of recycled fiber, net of internal generation, represents 18% of our containerboard production.
We procure wood fiber through leases of cutting rights, long-term supply agreements, and market purchases and believe we have adequate sources of fiber supply for the foreseeable future.
As part of our renewable virgin fiber sourcing efforts, we participate in the Sustainable Forestry Initiative® (SFI), the Programme for the Endorsement of Forest Certification (PEFC), as well as the Forest Stewardship Council® (FSC®), and we are certified under their sourcing and chain of custody standards. These standards are aimed at ensuring the long-term health and conservation of forestry resources. We are committed to sourcing wood fiber through environmentally, socially, and economically sustainable practices and promoting resource and conservation stewardship ethics.
Energy supply. Energy at our packaging mills is obtained through self-generated or purchased fuels and electricity. Fuel sources include by-products of the containerboard manufacturing and pulping process (including black liquor and wood waste), natural gas, purchased wood waste, and other purchased fuels. Each of our mills self-generates process steam requirements from by-products (black liquor and wood waste), as well as from the various purchased fuels. The process steam is used throughout the production process and also to generate electricity.
In 2023, our packaging mills consumed about 82 million MMBTUs of fuel to produce both steam and electricity. Of the 82 million MMBTUs consumed, about 63% was from mill-generated biogenic fuels that are by-products of our containerboard manufacturing and pulping process and 37% was from purchased fuels. Of the purchased fuels, 71% was from natural gas, 27% was from purchased wood waste and 2% was from other purchased fuels.
Chemical supply. We consume various chemicals in the production of containerboard, including caustic soda, starch, sulfuric acid, soda ash, and lime. Most of our chemicals are purchased under contracts, which are bid or negotiated periodically.
Sales, Marketing, and Distribution
Our corrugated products are sold through our direct sales and marketing organization, independent brokers, and distribution partners. We have sales representatives and a sales manager at most of our corrugated manufacturing operations and also have corporate account managers who serve customer accounts with a national presence. Additionally, our design centers maintain an on-site dedicated graphics sales force. In addition to direct sales and marketing personnel, we utilize new product development engineers and product graphics and design specialists. These individuals are located at both the corrugated plants and the design centers. General marketing support is provided at our corporate headquarters.
Our containerboard sales group is responsible for linerboard and corrugating medium order processing and supply to our corrugated plants, to outside domestic customers, and to export customers. These personnel also coordinate and execute all containerboard trade agreements with other containerboard manufacturers.
Containerboard produced in our mills is primarily shipped by rail or truck. Our corrugated products are delivered by truck due to proximity of our corrugated manufacturing operations to customers and load size. Our corrugated manufacturing operations typically serve customers within a 150-mile radius.
Customers
We sell containerboard and corrugated products to approximately 14,000 customers in approximately 30,000 locations. About 70 % of our corrugated products sales are to regional and local accounts, which are broadly diversified across industries and geographic locations. The remaining 30 % of our corrugated products customer base consists primarily of national accounts that have multiple locations and are served by a number of PCA plants. No single customer exceeds 10% of segment sales.
The primary end-use markets in the United States for corrugated products are shown below as reported in the 2022 Fibre Box Association annual report:
| Food, beverages, and agricultural products | 42 | % | ||
| Retail and wholesale trade | 28 | % | ||
| Paper and other products | 10 | % | ||
| Chemical, plastic, and rubber products | 10 | % | ||
| Miscellaneous manufacturing | 10 | % |
Competition
As of December 31, 2023, we were the third largest producer of containerboard products in North America, according to industry sources and our own estimates. According to industry sources, corrugated products are produced by about 400 U.S. companies operating approximately 1,100 plants. The primary basis for competition for most of our packaging products includes quality, service, price, product design, and innovation. Most corrugated products are manufactured to the customer’s specifications. Corrugated producers generally sell within a 150-mile radius of their plants and compete with other corrugated producers in their local region. Competition in our corrugated products operations tends to be regional, although we also face competition from competitors with significant national account presence.
On a national level, our primary competitors are International Paper, WestRock Company, and Georgia-Pacific LLC. However, with our strategic focus on regional and local accounts, we also compete with many smaller, independent producers.
Pap****er
We are a leading producer of UFS in North America, according to industry sources and our own estimates. We manufacture and sell papers, including both commodity and specialty papers, which may have custom or specialized features such as colors, coatings, high brightness, and recycled content. Our papers consist of communication papers, including cut-size office papers, and printing and converting papers. Our products are sustainable and are produced from renewable raw materials, predominately using energy derived from biogenic fuels in our production processes and are recyclable at end-of-life.
Facilities
We currently have one paper mill located in International Falls, Minnesota that produces both commodity and specialty papers on two paper machines. The mill has the capacity to produce approximately 500,000 tons annually.
Major Raw Materials Used
Fiber supply. Fiber is the largest raw material cost in this segment. We consume wood fiber, recycled fiber, and purchased pulp. We purchase wood fiber through contracts and open-market purchase, and we purchase recycled fiber and pulp from third parties pursuant to contractual agreements.
As part of our renewable virgin fiber sourcing efforts, we participate in the Sustainable Forestry Initiative® (SFI), the Programme for the Endorsement of Forest Certification (PEFC), as well as the Forest Stewardship Council® (FSC®), and we are certified under their sourcing and chain of custody standards. These standards are aimed at ensuring the long-term health and conservation of forestry resources. We are committed to sourcing wood fiber through environmentally, socially, and economically sustainable practices and promoting resource and conservation stewardship ethics.
Energy supply. We obtain energy through self-generated or purchased fuels and electricity. Fuel sources include by-products of the manufacturing and pulping process (including black liquor and wood waste), natural gas, electricity, and purchased wood waste. The paper mill self-generates process steam requirements from by-products (black liquor and wood waste), as well as from the various purchased fuels. The process steam is used throughout the production process and to generate electricity.
In 2023, our paper mill consumed about 11 million MMBTUs of fuel to produce both steam and electricity. Of the 11 million MMBTUs consumed, about 76% was from mill-generated biogenic fuels that are by-products of the manufacturing and pulping process and 24% was from purchased natural gas.
Chemical supply. We consume various chemicals in the production of white papers, including starch, precipitated calcium carbonate, caustic soda, and sodium chlorate. Most of our chemicals are purchased under contracts, which are bid or negotiated periodically.
Sales, Marketing, and Distribution
Our papers are sold primarily through our sales and marketing organization. We ship to customers both directly from our mills and through distribution centers and a network of outside warehouses by rail or truck. This allows us to respond quickly to customer requirements.
Customers
We have about 40 customers in approximately 150 locations. These customers include office products distributors and retailers, paper merchants, and envelope and other converters. We have established long-term relationships with many of our customers. ODP Corporation ("ODP"), formerly Office Depot, Inc., along with its subsidiaries and affiliates, is our largest customer in the Paper segment. Effective January 1, 2024, we have amended the agreement with ODP in which we will continue to supply commodity and non-commodity office papers through December 31, 2025. If the agreement is not renewed by the parties, ODP's obligation to purchase paper would phase down over a two-year period beginning January 1, 2026. In 2023, our sales revenue to ODP represented 61% of our Paper segment sales revenue and 5% of our consolidated sales revenue.
Competition
The markets in which our Paper segment competes are large and highly competitive. Commodity grades of UFS paper are globally traded, with numerous worldwide manufacturers, and as a result, these products compete primarily on the basis of price. Our paper manufacturing facility is located in the United States, and although we compete primarily in the domestic market, we do face competition from foreign producers. In 2016, as a result of a case brought by us and other domestic producers before United States international trade authorities, antidumping and countervailing duties at various levels were imposed on producers of uncoated freesheet papers produced in Australia, Brazil, China, Indonesia, and Portugal. These duties remain in effect after sunset review of duty orders by the U.S. International Trade Commission in January 2022. Other factors influencing competition from overseas producers include domestic and foreign demand and foreign currency exchange rates.
Our largest competitors include Domtar Corporation, a division of Paper Excellence, and Sylvamo Corporation. We also face competition from foreign producers and smaller North American producers. Although price is the primary basis for competition in most of our paper grades, quality and service are also important competitive determinants. Our papers compete with electronic data transmission, e-readers, electronic document storage alternatives, and paper grades we do not produce. Increasing shifts to these alternatives have had, and are likely to continue to have, an adverse effect on traditional print media and paper usage and lower demand for communication papers.
Corporate and Other
Our Corporate and Other segment includes corporate support staff services and related assets and liabilities. This segment also includes transportation assets such as rail cars and trucks, which we use to transport some of our products to and from our manufacturing sites, and assets related to a 50% owned variable interest entity, Louisiana Timber Procurement Company, L.L.C. (LTP).
Hum****an Capital
PCA’s success depends on a highly engaged, results-oriented workforce operating in an entrepreneurial culture. Our primary objective is to place the right people in the right roles and empower them to succeed.
Safety is a core value at PCA and we believe that all accidents are preventable and an injury-free environment is achievable. We have implemented a robust occupational health and safety management system to assure accountability throughout the organization for safe work practices. Key components to our system include commitment from management, extensive training of employees, hazard identification and communication and regular safety audits.
PCA has, at times, experienced labor shortages and/or higher than historical employee turnover in certain of our facilities. However, PCA has not experienced significant disruptions in its operations and has managed to maintain adequate availability of its workforce and supply of raw materials and services to continue to serve its customers.
We have extensive recruiting, training and development programs designed to attract and retain a highly talented workforce aligned with our objectives to relentlessly serve our customers and achieve operational excellence throughout our organization. As demand for qualified personnel is increasing, we are expanding our efforts in these critical areas along with efforts to continue to develop, promote and maintain a diverse workforce with a culture and an environment of respect and inclusion. We believe it is essential to hire and promote diverse candidates and employees in order to bring the best ideas to serve our customers. We have established a Diversity, Equity, and Inclusion Council consisting of leaders throughout our organization to hone our strategy and to create a roadmap for inclusive leadership. We publicly disclose in our annual responsibility report our employee demographics in the form of our annual EEO-1 report. Our responsibility report is available on our website and is not intended to be incorporated by reference herein.
PCA regularly conducts employee engagement surveys to measure our employees’ overall satisfaction as well as gain a better understanding of how to improve our employees’ work experience. Our last survey, conducted in 2022, had a high level of participation, assuring us that the results were an accurate reflection of the feelings and opinions of our employees. Our employees reaffirmed our strong safety culture, our dedication to being socially and environmentally responsible and responded favorably to questions on diversity, equity and inclusion. Our overall engagement index, which is in line with other U.S. manufacturing companies, is only one benchmark we consider in measuring employee satisfaction. Our commitment to continuous improvement means we use employee feedback to foster progress. Based on our 2022 survey responses, our plants formed action teams to identify and address areas for improvement specific to their location. We remain committed to seeking feedback from our employees as we work together to continue to make PCA a great place to work. Our next employee engagement survey will be conducted as scheduled in the first half of 2024.
As of December 31, 2023, we had approximately 14,900 employees, including 4,300 salaried and 10,600 hourly employees. Approximately 63% of our hourly employees worked pursuant to collective bargaining agreements. The majority of our unionized employees are represented by the United Steel Workers (USW), the Printing Packaging Production Workers Union (PPPWU), the Association of Western Pulp and Paper Workers (AWPPW), the International Association of Machinists (IAM), and the International Brotherhood of Teamsters (IBT). We are currently in negotiations to renew or extend union contracts that have recently expired or are expiring in the near future. During 2023, we experienced no work stoppages, and we believe we have satisfactory labor relations with our employees.
Regulatory and Environmenta****l Matters
A discussion of the financial impact of our compliance with environmental laws is presented under the caption “Regulatory and Environmental Matters” in “Part II, Item 7. Management's Discussion and Analysis of Financial Condition and Results of Operations” of this Form 10-K.
Executive Officers of the Registrant
Brief statements setting forth the age at February 29, 2024, the principal occupation, employment during the past five years, the year in which such person first became an officer of PCA, and other information concerning each of our executive officers appears below.
Mark W. Kowlzan, 68, Chairman and Chief Executive Officer - Mr. Kowlzan has served as PCA's Chairman since January 2016 and as Chief Executive Officer and a director since July 2010. From 1998 through June 2010, Mr. Kowlzan led the company’s containerboard mill system, first as Vice President and General Manager and then as Senior Vice President - Containerboard. From 1996 through 1998, Mr. Kowlzan served in various senior mill-related operating positions with PCA and Tenneco Packaging, including as manager of the Counce linerboard mill. Prior to joining Tenneco Packaging, Mr. Kowlzan spent 15 years at International Paper, a global paper and packaging company, where he held a series of operational and managerial positions within its mill organization. Mr. Kowlzan is a member of the board of American Forest and Paper Association.
Charles J. Carter, 64, Executive Vice President - Mill Operations - Mr. Carter has led our mill operations since January 2011. From March 2010 to January 2011, Mr. Carter served as PCA’s Director of Papermaking Technology. Prior to joining PCA in 2010, Mr. Carter spent 28 years with various pulp and paper companies in managerial and technical positions of increasing responsibility, most recently as Vice President and General Manager of the Calhoun, Tennessee mill of Abitibi Bowater from 2007 to 2010 and as manager of SP Newsprint’s Dublin, Georgia mill from 1999 to 2007.
Thomas A. Hassfurther, 68, Executive Vice President - Corrugated Products - Mr. Hassfurther has served as Executive Vice President - Corrugated Products of PCA since September 2009. From February 2005 to September 2009, Mr. Hassfurther served as Senior Vice President - Sales and Marketing, Corrugated Products. Prior to this he held various senior-level management and sales positions at PCA and Tenneco Packaging. Mr. Hassfurther joined the company in 1977.
Robert P. Mundy, 62, Executive Vice President and Chief Financial Officer - Mr. Mundy has served as our Chief Financial Officer since 2015. He previously served as Senior Vice President and Chief Financial Officer of Verso Corporation, a leading North American supplier of coated papers to catalog and magazine publishers, from 2006 to June 2015. Verso Corporation filed for Chapter 11 bankruptcy in January 2016. Prior to that, he worked at International Paper from 1983 to 2006, where he was Director of Finance of the Coated and Supercalendered Papers division from 2002 to 2006, Director of Finance Projects from 2001 to 2002, Controller of Masonite Corporation from 1999 to 2001, and Controller of the Petroleum and Minerals business from 1996 to 1999. He served in various business positions at International Paper from 1983 to 1996.
Pamela A. Barnes, 59, Senior Vice President – Finance and Controller - Ms. Barnes has served as Senior Vice President – Finance and Controller since May 2019. Ms. Barnes previously served as a Vice President in PCA’s finance organization from 2012 to 2019. After joining the company in 1992, she has held various positions of increasing responsibility, including serving as PCA’s Treasurer since 1999. Before joining PCA, Ms. Barnes worked for Deloitte & Touche.
Jeff S. Kaser, 58, Senior Vice President – Corrugated Products - Mr. Kaser has served as Senior Vice President — Corrugated Products since May 2020. Prior to this, he served as a Vice President and Area General Manager in PCA's corrugated products business since 2012, leading PCA’s Midwest Area, Mid-Atlantic Area and Pennsylvania Region. Mr. Kaser joined PCA in 1987 and has also held plant positions in sales, sales management and general management.
Darla J. Olivier, 54, Senior Vice President – Tax, ESG and Government Affairs - Ms. Olivier has led our tax department since 1994 and served as Vice President—Tax from October 2010 to January 2022. In January 2022, she was promoted to Senior Vice President—Tax, ESG and Government Affairs, and leads our sustainability reporting and government affairs functions. Before joining PCA, Ms. Olivier worked for Coopers & Lybrand LLP, Alberto-Culver Company and SPX Corporation.
Kent A. Pflederer, 53, Senior Vice President, General Counsel and Secretary - Mr. Pflederer has served as Senior Vice President, General Counsel and Corporate Secretary since January 2013 and has led our legal department since June 2007. Prior to joining PCA, Mr. Pflederer served as Senior Counsel, Corporate and Securities, at Hospira, Inc. from 2004 to 2007 and served in the corporate and securities practice at Mayer Brown, LLP from 1996 to 2004.
Bruce A. Ridley, 68, Senior Vice President – Environmental Health and Safety and Operational Services - Mr. Ridley has served as Senior Vice President – Environmental Health and Safety and Operational Services since May 2019. Mr. Ridley previously served as Vice President of Operations from 2012 to 2019 and at PCA’s Tomahawk, Wisconsin containerboard mill as the Operations Manager and Mill Manager from 1999 to 2011. Before joining PCA, he held several positions of increasing responsibility at multiple locations during his 19 years with International Paper and two years with Champion International.
Robert A. Schneider, 58, Senior Vice President and Chief Information Officer - Mr. Schneider has served as our Chief Information Officer since 2000 and was promoted to Senior Vice President in 2019. Mr. Schneider joined the company in 1989 and has held various management and other positions of increasing responsibility in information systems for PCA.
D. Ray Shirley, 52, Senior Vice President – Corporate Engineering and Process Technology - Mr. Shirley has served as PCA’s Senior Vice President – Corporate Engineering and Process Technology since May 2019. Mr. Shirley previously served as PCA’s Vice President – Containerboard Mills Engineering and Process Technology from 2012 to 2019 and as Mill Manager at PCA’s Counce, Tennessee containerboard mill from 2010 to 2012. He has served in various management roles within the company, including the Operations Manager at the Filer City, Michigan containerboard mill. Before joining PCA in 1996, Mr. Shirley worked for Georgia-Pacific Corporation.
Available Information
PCA’s internet website address is www.packagingcorp.com. Our annual reports on Form 10-K, quarterly reports on Form 10-Q, current reports on Form 8-K, and amendments to those reports filed or furnished pursuant to Section 13 or 15(d) of the Securities Exchange Act of 1934 are available free of charge through our website as soon as reasonably practicable after they are electronically filed with, or furnished to, the Securities and Exchange Commission. In addition, our Code of Ethics may be accessed in the Investor Relations section of PCA’s website. PCA’s website and the information contained or incorporated therein are not intended to be incorporated into this report.
Item 1A. RISK FACTORS
Some of the statements in this report and, in particular, statements found in Management’s Discussion and Analysis of Financial Condition and Results of Operations, that are not historical in nature are forward-looking statements within the meaning of the Private Securities Litigation Reform Act of 1995. Forward-looking statements include statements about our expectations regarding our future liquidity; earnings; expenditures; environmental, social, and governance (ESG) goals; and financial condition. These statements are often identified by the words “will,” “should,” “anticipate,” “believe,” “expect,” “intend,” “estimate,” "goals," “hope,” or similar expressions. These statements reflect management’s current views with respect to future events and are subject to risks and uncertainties. There are important factors that could cause actual results to differ materially from those in forward-looking statements, many of which are beyond our control. These factors, risks and uncertainties include, but are not limited to, the factors described below.
Our actual results, performance, or achievement could differ materially from those expressed in, or implied by, these forward-looking statements, and accordingly, we can give no assurances that any of the events anticipated by the forward-looking statements will transpire or occur, or if any of them do so, what impact they will have on our results of operations or financial condition. In view of these uncertainties, investors are cautioned not to place undue reliance on these forward-looking statements. We expressly disclaim any obligation to publicly revise or otherwise update any forward-looking statements that have been made to reflect the occurrence of events after the date hereof.
In addition to the risks and uncertainties we discuss elsewhere in this Form 10-K (particularly in “Part II, Item 7. Management's Discussion and Analysis of Financial Condition and Results of Operations”) or in our other filings with the Securities and Exchange Commission (SEC), the following are important factors that could cause our actual results to differ materially from those we project in any forward-looking statement.
Risks Related to our Operations, Business and Industry
General Economic Conditions – A deterioration in general economic conditions may harm our business, results of operations, cash flows, and financial position. General global and domestic economic conditions directly affect the levels of demand and production of consumer goods, levels of employment, the availability and cost of credit, and ultimately, the demand for our products and the profitability of our business. The U.S. economy has experienced persistent inflation, and we have experienced, and continue to experience, cost inflation across our business. Inflation has resulted in, and may continue to result in, higher production and transportation costs, which we may not be able to recover through higher prices charged to our customers or otherwise. Interest rates have increased, which may result in lower consumer demand and higher borrowing costs, and may cause general economic conditions to deteriorate. During the first half of 2023, we experienced a deterioration in operating conditions involving our Packaging business as a result of general economic conditions and lower demand with customers adjusting their ordering patterns to reduce their inventories, which negatively affected our profitability. However, demand rebounded in the second half of 2023. The economic outlook for 2024 remains uncertain. If global economic conditions deteriorate, economies could experience a recession, which may result in higher unemployment rates, lower disposable income, lower Company earnings and investment, and lower consumer spending. These factors may result in lower demand for our products and negatively affect our business, results of operations and cash flows.
In addition, changes in trade policy, including renegotiating or potentially terminating existing bilateral or multilateral agreements as well as the imposition of tariffs, could impact global markets and demand for our and our customers’ products and the costs associated with certain of our capital investments. Further changes in tax laws or tax rates may have a material impact on our future cash taxes, effective tax rate or deferred tax assets and liabilities. These conditions are beyond our control and may have a material impact on our business, results of operations, liquidity, and financial position.
Industry Cyclicality – Changes in the prices of our products could materially affect our financial condition, results of operations, and liquidity. Macroeconomic conditions and fluctuations in industry capacity can create changes in prices, sales volumes, and margins for most of our products, particularly commodity grades of packaging and paper products. Prices for all of our products are driven by many factors, including demand for our products, industry capacity and decisions made by other producers with respect to capacity and production, and other competitive conditions in our industry. These factors are affected by general global and domestic economic conditions, customer purchasing decisions, and operating conditions involving our business and industry. We have little influence over the timing and extent of price changes of our products, which may be unpredictable and volatile. In addition, as many of our customer contracts include price adjustment provisions based upon published surveyed prices for containerboard or certain grades of UFS papers reported by trade publications, our selling prices are influenced by price levels determined and published by trade publications. Published containerboard prices have decreased beginning in the fourth quarter of 2022 and throughout 2023, which resulted in lower prices for our containerboard and corrugated products and lower profitability. Changes in how these surveyed price levels are determined or maintained may affect our sales prices. If supply exceeds demand, operating conditions involving our business and industry deteriorate, or other factors result in lower prices for our products, our earnings, and operating cash flows would be harmed.
Competition – The intensity of competition in the industries in which we operate could result in downward pressure on pricing and volume, which could lower earnings and operating cash flows. Our industries are highly competitive, with no single containerboard, corrugated packaging, or UFS paper producer having a dominant position. Certain containerboard grades and UFS paper products cannot generally be differentiated by producer, which tends to intensify price competition. The corrugated packaging industry is also sensitive to changes in economic conditions, as well as other factors including innovation, design, quality, and service. To the extent that one or more competitors are more successful than we are with respect to any key competitive factor, our business could be adversely affected. Our packaging products also compete, to some extent, with various other packaging materials, including products made of paper, plastics, wood, and various types of metal. If we are unable to successfully compete, we may lose market share or may be required to charge lower sales prices for our products, both of which would reduce our earnings and operating cash flows.
UFS paper products compete with electronic data transmission and document storage alternatives. Increasing shifts to electronic alternatives have had and will continue to have an adverse effect on usage of these products. As a result of such competition, the industry is experiencing decreasing demand for existing UFS paper products. As the use of these alternatives grows, demand for UFS paper products is likely to further decline. Declines in demand for our paper products may adversely affect our earnings and operating cash flows.
Some of our competitors are larger than we are and may have greater financial and other resources, greater manufacturing economies of scale, greater energy self-sufficiency, or lower operating costs, compared to our company. Some of the factors that may adversely affect our ability to compete in the markets in which we participate include the entry of new competitors into the markets we serve, increased competition from overseas producers, our competitors' pricing strategies, changes in customer preferences, and the cost-efficiency of our facilities.
Cost of Fiber – An increase in the cost of fiber could increase our manufacturing costs and lower our earnings. The market price of wood fiber varies based upon availability, source, and the costs of fuels used in the harvesting and transportation of wood fiber. The cost and availability of wood fiber can also be impacted by weather, general logging conditions, geography, and regulatory activity.
The availability and cost of recycled fiber depends heavily on recycling rates and the domestic and global supply and demand for recycled products. We purchase recycled fiber for use at six of our containerboard mills. In 2023, we purchased approximately 809,000 tons of recycled fiber at our containerboard mills, net of the recycled fiber generated by our corrugated box plants. The amount of recycled fiber purchased each year varies based upon production and the prices of both recycled fiber and wood fiber.
Periods of higher recycled fiber costs and unusual price volatility have occurred in the past, including during 2023. Prices for recycled fiber may continue to fluctuate significantly in the future, and a significant increase could result in higher costs and lower earnings. A $10 per ton price increase in recycled fiber for our containerboard mills would result in approximately $8 million of additional expense based on 2023 consumption.
Cost of Purchased Fuels and Chemicals – An increase in the cost of purchased fuels and chemicals could lead to higher manufacturing costs, resulting in reduced earnings. We have, at times, experienced significant cost inflation and volatility for key inputs such as fuels and chemicals. We have the ability to use various types of purchased fuels in our manufacturing operations, including natural gas, bark, and other purchased fuels. Fuel prices, in particular prices for oil and natural gas, have fluctuated in the past. New and more stringent environmental regulations may discourage, reduce the availability of, or make more expensive, the use of certain fuels, such as natural gas, which represents the majority of our purchased fuels. In addition, costs for key chemicals used in our manufacturing operations also fluctuate. These fluctuations impact our manufacturing costs and result in earnings volatility. If fuel and chemical prices rise, our production costs and transportation costs will increase and cause higher manufacturing costs and reduced earnings if we are unable to recover such increases through higher prices of our products or other means. A $0.10 per million MMBTU increase in natural gas prices would result in approximately $3 million of additional expense, based on 2023 usage.
Customer Concentration – We rely on certain large customers. Our packaging and paper segments each have large customers, the loss of which could adversely affect the segment’s sales and profitability. In particular, because our businesses operate in highly competitive industry segments, we regularly bid for new business or for renewal of existing business. The loss of business from our larger customers, or the renewal of business on less favorable terms, may adversely impact our financial results.
ODP Corporation ("ODP"), formerly Office Depot, Inc., along with its subsidiaries and affiliates, is our largest customer in the Paper segment. Effective January 1, 2024, we have amended the agreement with ODP in which we will continue to supply commodity and non-commodity office papers through December 31, 2025. If the agreement is not renewed by the parties, ODP's obligation to purchase paper would phase down over a two-year period beginning January 1, 2026.
In 2023, sales to ODP represented 61% of our Paper segment sales and 5% of our consolidated sales. If these sales are reduced, including if we are unable to renew the agreement at historical volume levels, we would need to find new customers. We may not be able to fully replace any lost sales, and any new sales may be at lower prices or higher costs. Any significant deterioration in the financial condition of ODP affecting its ability to pay or any other change that makes ODP less willing to purchase our products will harm our Paper business and results of operations.
Transportation Costs – Reduced truck and rail availability could lead to higher costs or poorer service, resulting in lower earnings, and harm our ability to distribute our products. We ship our products primarily by truck and rail. We have at times experienced lower availability of third-party trucking services, including truck and driver shortages, and service issues, interruptions, and delays in rail services, which are exacerbated in periods of high demand for such services. While we have generally been able to manage through these issues and have not experienced material disruptions in our ability to serve our customers, these issues have resulted, at times, in significantly higher costs for transportation services. If these factors persist, we could experience even higher transportation costs in the future and difficulties shipping our products in a timely manner. We may not be able to recover higher transportation costs through higher prices or otherwise, which would result in lower earnings.
Material Disruption of Operations – A material disruption at one of our manufacturing facilities could prevent us from meeting customer demand, reduce our sales, and/or negatively affect our results of operations and financial condition. Our business depends on continuous operation of our facilities, particularly at our mills. Any of our manufacturing facilities, or any of our machines within such facilities, could cease operations unexpectedly for a significant period of time due to a number of events, including:
Unscheduled maintenance outages.
Prolonged power failures.
Equipment or information system breakdowns or failures.
Explosion of a boiler or other major facilities.
Disruption in the supply of raw materials, such as wood fiber, energy, or chemicals.
A spill or release of pollutants or hazardous substances.
Closure or curtailment related to environmental concerns.
Labor difficulties.
Disruptions in the transportation infrastructure, including roads, bridges, railroad tracks, and tunnels.
Terrorism or threats of terrorism.
The effect of a pandemic or other health event, such as the COVID-19 pandemic.
Other operational problems.
These events could harm our ability to produce our products and serve our customers and may lead to higher costs and reduced earnings.
Extreme Weather Events – Our facilities are susceptible to extreme weather events, which could disrupt our business. Extreme weather events like hurricanes, tornadoes, floods and winter storms have caused disruptions to our business both directly and indirectly in recent history. Climate change may increase the frequency and intensity of these extreme weather events. Certain weather events may cause damage to our facilities and require us to temporarily halt operations. These types of events may also disrupt our customers' and suppliers’ operations. Disruptions to the supply chain may cause the cost of goods to temporarily increase. Damage to our facilities may cause insurance premiums to increase and also require us to incur additional costs to mitigate future risks.
ESG – We may not achieve or make satisfactory progress on our goals and targets to reduce emissions and satisfy other ESG metrics. Investors, customers, governmental authorities, and other interested parties have an increased focus on ESG matters, including with respect to climate change, greenhouse gas emissions, and sustainable business practices. This increased awareness with respect to ESG matters, including climate change, is expected to result in more prescriptive reporting requirements with respect to ESG metrics and expectations that companies establish goals and commitments regarding ESG metrics and take actions to achieve those goals and commitments.
We have voluntarily established targets and goals with respect to greenhouse gas emissions, which are discussed elsewhere in this report under the caption "Regulatory and Environmental Matters" in "Part II, Item 7. Management’s Discussion and Analysis of Financial Condition and Results of Operations” of this Form 10-K. Our ability to achieve those targets and goals will depend on certain factors beyond our control, including regulatory actions, emergence of and advances in technology, and availability of required products and services. Our efforts to achieve ESG targets and goals may result in higher costs and capital expenditures with a low return on investment and may distract management efforts from other operational matters. We may not achieve or make satisfactory progress on our ESG goals and targets. If we are unable to meet these goals and targets, our reputation with investors, customers and other stakeholders and businesses may be harmed.
Reliance on Personnel – We may fail to attract and retain qualified personnel, including key management personnel. Our ability to operate and grow our business depends on our ability to attract and retain employees with the skills necessary to operate and maintain our facilities, produce our products and serve our customers. The increasing demand for qualified personnel may make it more difficult for us to attract and retain qualified employees. Changing demographics and labor work force trends may make it difficult for us to replace retiring employees at our manufacturing and other facilities. U.S. labor market conditions remain tight, and we have, at times, experienced labor shortages and/or higher than historical employee turnover in certain of our facilities. If we fail to attract and retain qualified personnel, or if we experience labor shortages, we may experience higher costs and other difficulties, and our business may be adversely impacted.
In addition, we rely on key executive and management personnel to manage our business efficiently and effectively. As our business has grown in size and geographic scope, we have relied on these individuals to manage increasingly complex operations. The loss of any of our key personnel could adversely affect our business.
Cybersecurity – Risks related to security breaches of company, customer, employee, and vendor information, as well as the technology that manages our operations and other business processes, could adversely affect our business. We rely on various information technology and process control systems to capture, process, store, and report data, operate our manufacturing and converting facilities, and interact with customers, vendors, and employees. Despite careful security and controls design, implementation, updating, and internal and independent third-party assessments, our information technology and process control systems, and those of our third-party providers, could become subject to cyber-attacks or security breaches. Network, system, and data breaches could result in misappropriation of sensitive data or operational disruptions including interruption to systems availability and denial of access to and misuse of applications required by our customers and vendors to conduct business with us. Misuse of internal applications; theft of intellectual property, trade secrets, or other corporate assets; and inappropriate disclosure of confidential information could stem from such incidents. Delayed shipments, slowed production, or other issues resulting from these disruptions could result in lost sales, business delays, and negative publicity and could have a material adverse effect on our operations, financial condition, or operating cash flows. For further discussion pertaining to cybersecurity strategy and related roles and responsibilities, see “Part I, Item 1C. Cybersecurity” of this Form 10-K.
Environmental Matters – PCA may incur significant environmental liabilities with respect to both past and future operations. We are subject to, and must comply with, a variety of federal, state and local environmental laws, particularly those relating to air and water quality, waste disposal and the cleanup of contaminated soil and groundwater. Failure to comply with these regulations could result in fines, which may be significant, or other adverse regulatory action. Because environmental regulations are constantly evolving, we have incurred, and will continue to incur, costs to maintain compliance with those laws. See Item 7. “Management’s Discussion and Analysis of Financial Condition and Results of Operations - Environmental Matters” for estimates of expenditures we expect to make for environmental compliance in the next few years. New and more stringent environmental regulations may be adopted and may require us to incur additional operating expenses and/or significant additional capital expenditures to modify or replace certain of our boilers and other equipment. For example, the EPA recently enacted more stringent particulate matter emissions standards, which may make it more difficult to obtain or maintain air permits and more difficult and expensive to comply with the limitations set forth in our permits. We are assessing the impact of these new standards on our business and operations. In addition, environmental regulations may increase the cost of our raw materials and purchased energy. Although we have established reserves to provide for known environmental liabilities, these reserves may change over time due to the enactment of new environmental laws or regulations or changes in existing laws or regulations, which might require additional significant environmental expenditures.
Labor Relations – If we experience strikes or other work stoppages, our business will be harmed. Our workforce is highly unionized and operates under various collective bargaining agreements. We must negotiate to renew or extend any union contracts that have recently expired or are expiring in the near future. While we believe that we have satisfactory labor relations, we may not be able to successfully negotiate new agreements without work stoppages or labor difficulties in the future or renegotiate them on favorable terms. If we are unable to successfully renegotiate the terms of any of these agreements, or if we experience any extended interruption of operations at any of our facilities as a result of strikes or other work stoppages, our business, results of operations and financial condition may be harmed.
Financial Risks
Inflation and Other General Cost Increases – We may not be able to offset higher costs. We are subject to both contractual, inflationary, and other general cost increases, including with regard to our labor costs and purchases of raw materials and transportation services. General economic conditions have resulted in higher inflation, which has led to higher costs across our business. If we are unable to offset these cost increases by price increases, growth, and/or cost reductions in our operations, these inflationary and other general cost increases could have a material adverse effect on our operating cash flows, profitability, and liquidity.
In 2023, our total company costs including cost of sales (COS) and selling, general, and administrative expenses (SG&A) was $6.7 billion, and excluding non-cash costs (depreciation, depletion and amortization, pension and postretirement expense, and share-based compensation expense) was $6.1 billion. A 1% increase in COS and SG&A costs would increase costs by $67 million and cash costs by $61 million.
Debt obligations – Our debt service obligations may reduce our operating flexibility. At December 31, 2023, we had $2.9 billion of debt outstanding and a $323 million undrawn revolving credit facility, after deducting letters of credit. All debt is comprised of fixed-rate senior notes. We and our subsidiaries are not restricted from incurring, and may incur, additional indebtedness in the future.
Our current borrowings, plus any future borrowings, may affect our ability to operate our business, including, without limitation:
Result in significant cash requirements to make interest and maturity payments on our outstanding indebtedness;
Increase our vulnerability to adverse changes in our business or industry conditions;
Increase our vulnerability to increases in interest rates;
Limit our ability to obtain additional financing for working capital, capital expenditures, general corporate, and other purposes;
Limit our flexibility in planning for, or reacting to, changes in our business and our industry; and
Limit our flexibility to make acquisitions.
Further, if we cannot service our indebtedness, we may have to take actions to secure additional cash by selling assets, seeking additional equity or reducing investments, which may not be achievable on acceptable terms or at all.
Pension Plans – Our pension plans may require additional funding. We record a liability associated with our pensions equal to the excess of the benefit obligations over the fair value of the assets funding the plans. The actual required amounts and timing of future cash contributions will be sensitive to changes in the applicable discount rates and returns on plan assets and could also be impacted by future changes in the laws and regulations applicable to plan funding. Fluctuations in the market performance of our plan assets will affect our pension plan costs in future periods. Changes in assumptions regarding expected long-term rate of return on plan assets, our discount rate, expected compensation levels, or mortality will also increase or decrease pension costs.
Market Price of our Common Stock - The market price of our common stock may be volatile, which could cause the value of the stock to decline. Securities markets worldwide periodically experience significant price declines and volume fluctuations due to macroeconomic factors and other factors beyond our control. This market volatility, as well as general economic, market, or political conditions, could reduce the market price of our common stock with little regard to our operating performance. In addition, our operating results could be below the expectations of public market analysts and investors, and in response, the market price of our common stock could decrease significantly.
Item 1B. UNRESOLVED STAFF COMMENTS
None.
Item 1C. CYBERSECURITY
Risk Management and Strategy
The Company maintains a cyber risk management program to prevent, detect and respond to information security threats. This program is supervised by a dedicated Chief Information Security Officer (CISO) whose team is responsible for leading enterprise-wide cybersecurity strategy, policy, standards, architecture and processes. The CISO manages the program in collaboration with the Company’s businesses and functions. To mitigate the risk of cybersecurity threats and data breaches we also have established policies and procedures, including a Cybersecurity & Data Breach Incident Response Policy and identified an Incident Response Team (IRT) with defined roles, responsibilities and means of communication. As part of our broader risk management and control framework we have implemented cybersecurity controls over the information technology and process control systems of the Company and of its third-party service providers. The Company engages third-party organizations to assess the controls around sensitive data, including but not limited to financial, employee, customer and vendor data as well as data affecting our process controls and data used to operate our manufacturing and converting facilities. We work with an independent assessor to conduct interim assessments and track ongoing efforts to continuously improve the Company’s cyber risk management program. The most recent assessment was completed at the end of 2022. In addition, the Company utilizes an independent audit firm to perform specific attack and penetration reviews on an annual basis. While we have experienced threats to our data and systems, as of December 31, 2023, we are not aware of any cybersecurity incidents that have materially impacted, or are reasonably likely to materially impact, our operations or financial condition.
Board Roles and Responsibilities
The Audit Committee of the Board of Directors oversees the Company’s cyber risk management program. The Chief Information Officer (CIO) and the Vice President of Network Services present frequent updates to the Audit Committee and, as necessary, to the full Board of Directors. These regular reports include detailed updates on the Company’s performance preparing for, preventing, detecting, responding to and recovering from cyber incidents. In addition, we have established processes to notify the Audit Committee of active incidents, as deemed necessary. The Company’s program is periodically evaluated by third-party experts, and the results of those reviews are reported to the Board of Directors.
Management Responsibilities
The Incident Response Team that we have established as part of our cyber risk management program coordinates the Company’s response to incidents and communicates with internal and external stakeholders. The team includes members of our Senior Leadership and draws upon additional staff, consultants, advisors and service providers as needed.
We are continuously focused on ensuring our Company is protected from potential cyber threats. Our Information Technology (IT) team is comprised of employees with a diverse mix of skills, backgrounds, perspectives, and relevant expertise, that undergo extensive training as part of their employment with the Company. We believe these measures together with our cyber risk management program as well as our policies, processes and procedures set a high benchmark for our employees to address and respond to cybersecurity threats.
Our IT team regularly monitors best practices and as needed, implements changes to the Company’s cyber risk management program to ensure a robust program is maintained. Aspects of this program include plans and procedures for identifying, communicating and containing security incidents, regular risk assessments and testing of the Company’s internal infrastructure to identify vulnerabilities, procedures for recovering from disruptions to our operations, maintaining global security policies, and comprehensive end user training and cybersecurity drills for personnel.
See “Part I, Item 1A. Risk Factors” of this Form 10-K for a discussion of cybersecurity risks.
Item 2. PROPERTIES
We own and lease properties in our business. Primarily all of our leases are non-cancelable and are accounted for as operating leases. These leases are not subject to early termination except for standard nonperformance clauses.
Information regarding our principal operating facilities, the segments that use those facilities, and a map of geographical locations is presented in “Part I, Item 1. Business” of this Form 10-K. We assess the condition and capacity of our manufacturing, distribution, and other facilities needed to meet our operating requirements. Our properties have been generally well maintained and are in good operating condition. In general, our facilities have sufficient capacity and are adequate for our production and distribution requirements.
As of December 31, 2023, we own buildings and land for our eight mills. Additionally, we have 86 corrugated manufacturing operations, of which the buildings and land for 53 are owned, including 45 combining operations, or corrugated plants, one corrugated sheet-only manufacturer, and seven sheet plants. We lease the buildings for 13 corrugated plants and 20 sheet plants. We own warehouses and miscellaneous other properties, including sales offices and woodlands management offices. We lease space for regional design centers and numerous other distribution centers, warehouses, and facilities. The equipment in these leased facilities is, in virtually all cases, owned by us, except for forklifts and other rolling stock, which are generally leased.
We own our corporate headquarters building, which is located in Lake Forest, Illinois.
Item 3. LEGAL PROCEEDINGS
Information concerning legal proceedings can be found in Note 19, Commitments, Guarantees, Indemnifications, and Legal Proceedings, of the Notes to Consolidated Financial Statements in “Part II, Item 8. Financial Statements and Supplementary Data” of this Form 10-K.
Item 4. MINE SAFETY DISCLOSURE
Not applicable.
PAR****T II
Item 5. MARKET FOR REGISTRANT’S COMMON EQUITY, RELATED STOCKHOLDER MATTERS, AND ISSUER PURCHASES OF EQUITY SECURITIES
Market Information
PCA’s common stock is listed on the New York Stock Exchange (NYSE) under the symbol “PKG.”
Stockholders
On February 23, 2024, there were 140 holders of record of our common stock.
Purchases of Equity Securities
Share Repurchase Program
On January 26, 2022, PCA announced that its Board of Directors authorized the repurchase of $1 billion of the Company’s outstanding common stock from time to time in open market or privately negotiated transactions in accordance with applicable securities laws. At the time of the announcement, there was no remaining authority under previously announced programs. Repurchases may be made from time to time in open market or privately negotiated transactions in accordance with applicable securities regulations. The timing and amount of repurchases will be determined by the Company in its discretion based on factors such as PCA’s stock price and market and business conditions.
During the third quarter of 2023, we paid $41.5 million, including fees, to repurchase 0.3 million shares of common stock. All shares repurchased have been retired. At December 31, 2023, $436.0 million of the authorized amount remained available for repurchase of the Company’s common stock. During the third and fourth quarters of 2022, we paid $522.6 million, including fees, to repurchase 4.0 million shares of common stock. During the fourth quarter of 2021, we paid $193.0 million, including fees, to repurchase 1.4 million shares of common stock, which was the entire remaining amount of repurchase authority we had under previously announced share repurchase programs.
Pursuant to its equity incentive plan, the Company withholds shares from vesting employee equity awards to cover employee tax liabilities. We withheld 120,534 shares in 2023 to cover $15.7 million in employee tax liabilities, 110,827 shares in 2022 to cover $15.4 million in employee tax liabilities, and 95,437 shares in 2021 to cover $12.9 million in employee tax liabilities.
During the three months ended December 31, 2023, there were no repurchases of common stock made under repurchase plans authorized by PCA’s Board of Directors and no shares withheld from employees to cover income and payroll taxes on equity awards that vested.
Performance Graph
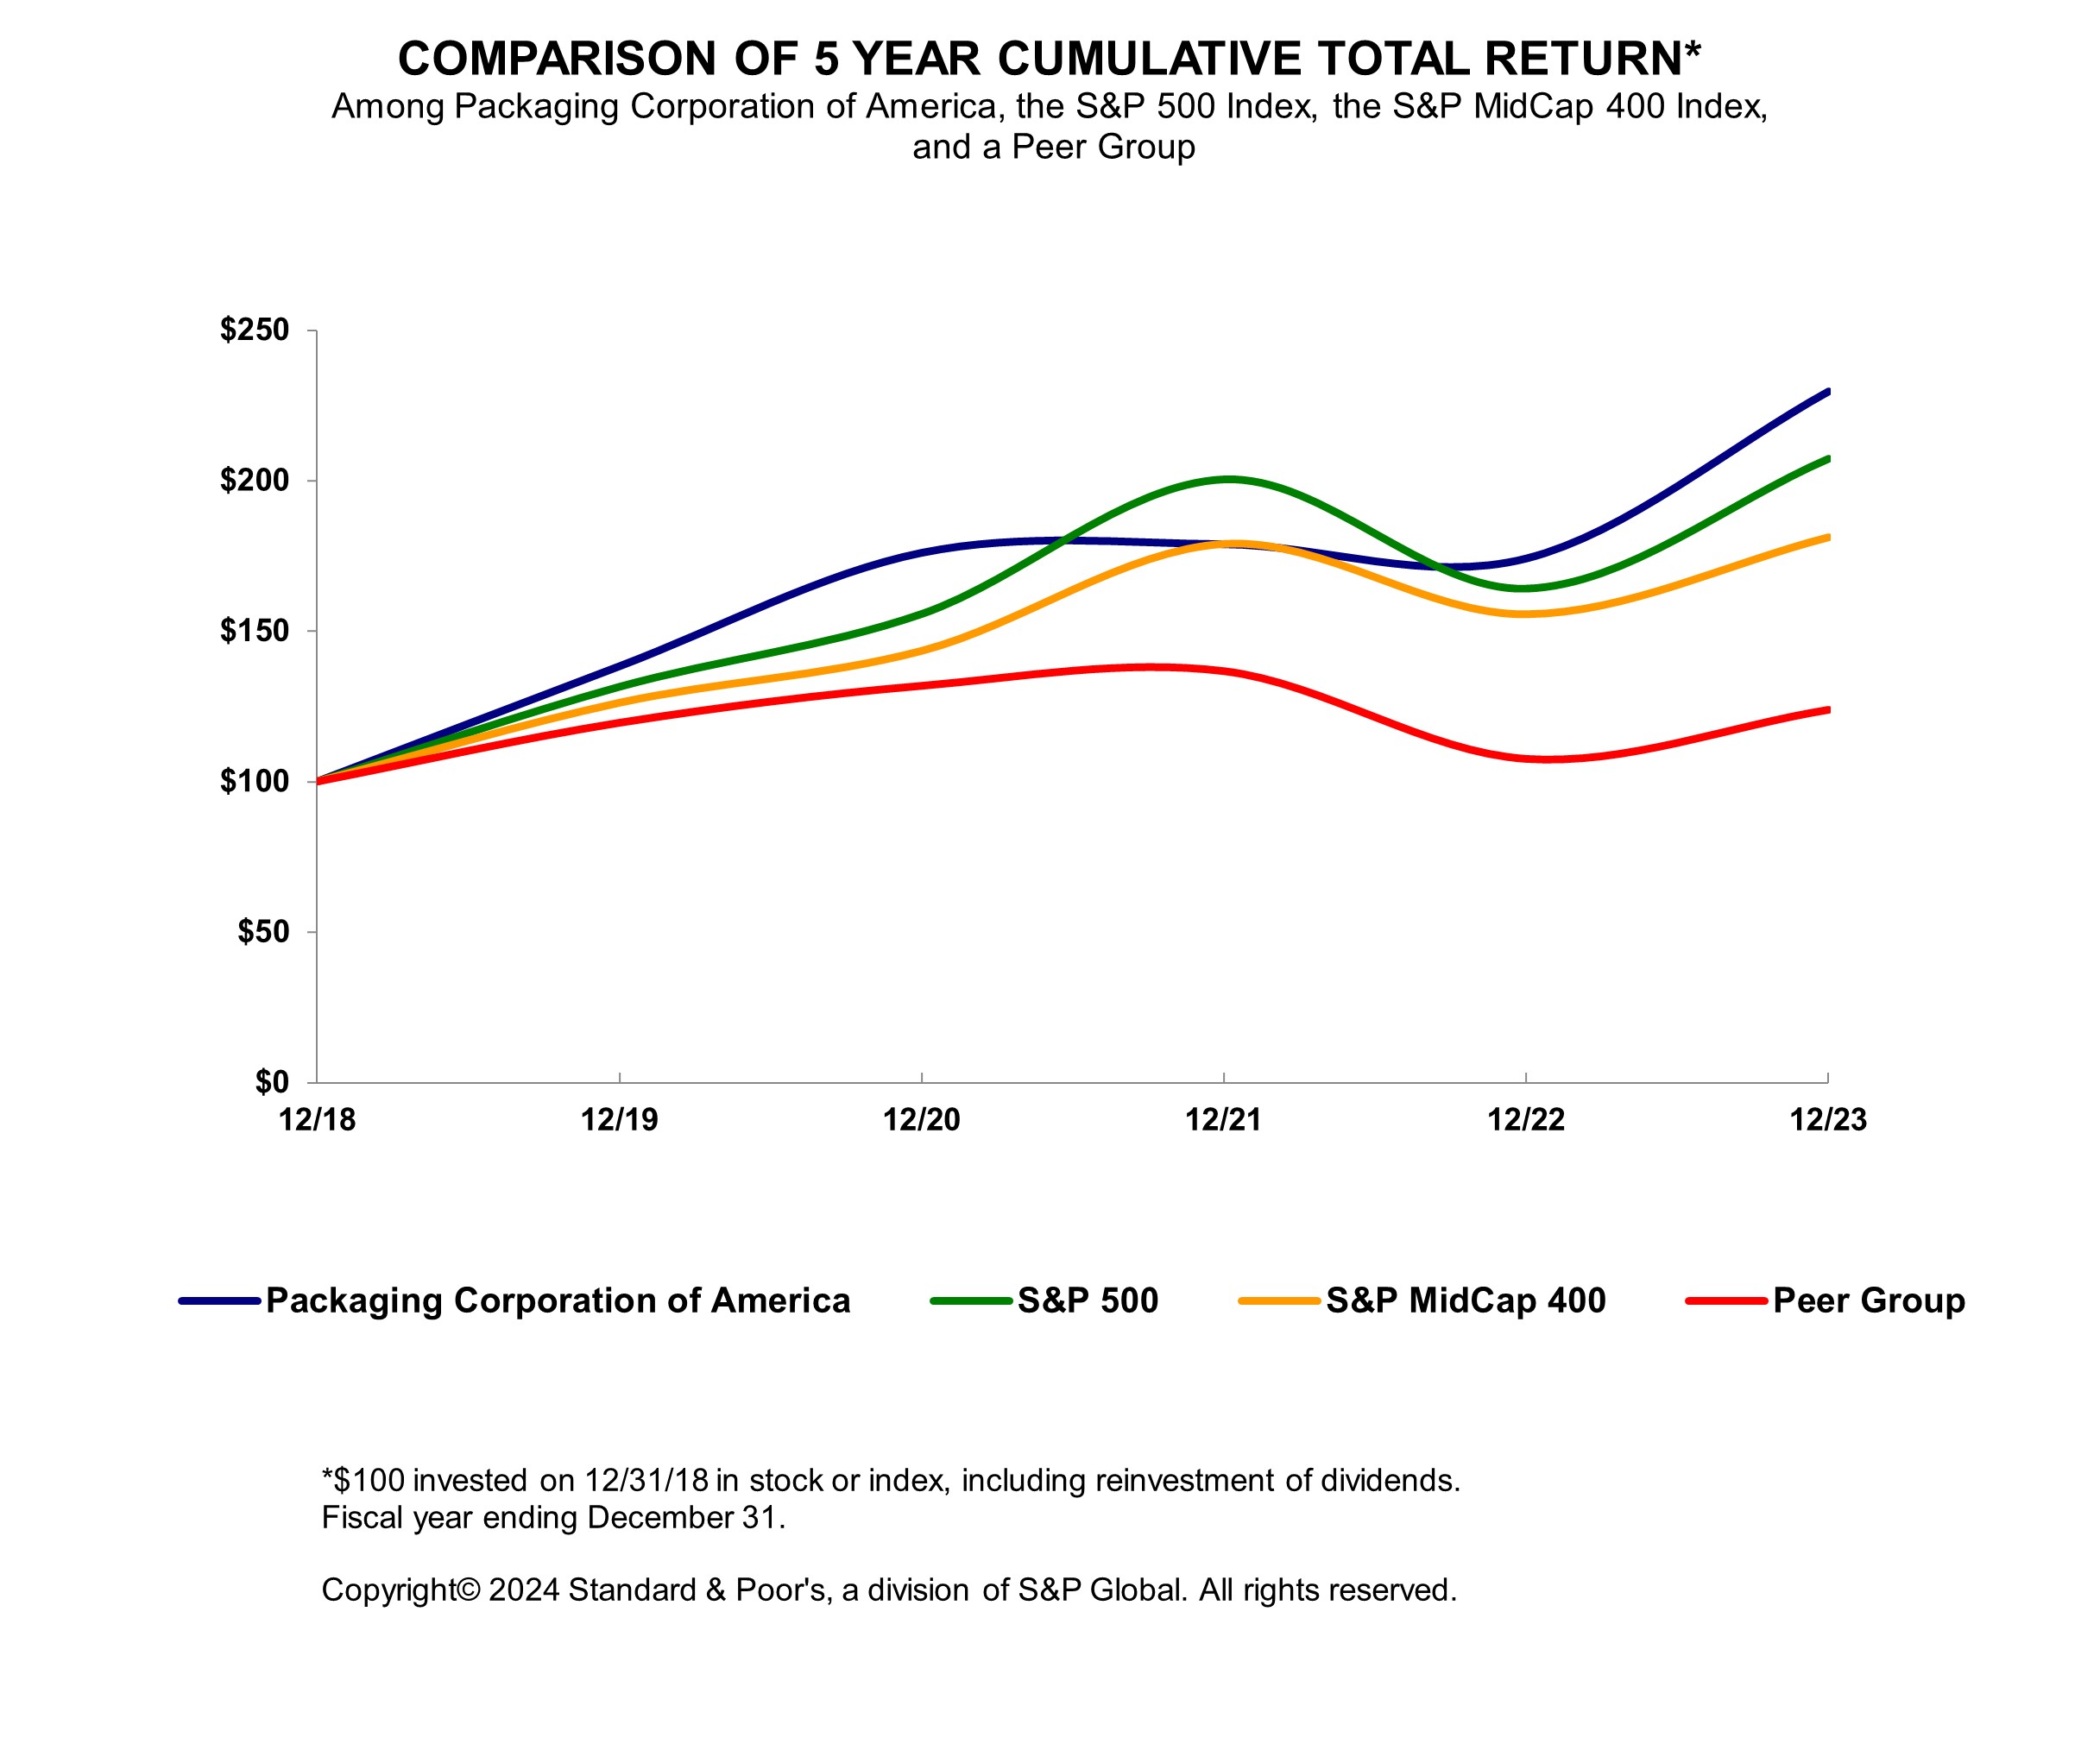
The graph below compares PCA’s cumulative 5-year total shareholder return on common stock with the cumulative total returns of the S&P 500 index; the S&P Midcap 400 index; and a customized peer group of two companies that includes: International Paper and WestRock Company. The graph tracks the performance of a $100 investment (including the reinvestment of all dividends) in our common stock, in each index, and in each peer group’s common stock from December 31, 2018 through December 31, 2023. The stock price performance included in this graph is not necessarily indicative of future stock price performance.
| Cumulative Total Return | ||||||||||||||||||||||||
| December 31, | ||||||||||||||||||||||||
| 2018 | 2019 | 2020 | 2021 | 2022 | 2023 | |||||||||||||||||||
| Packaging Corporation of America | $ | 100.00 | $ | 138.35 | $ | 176.07 | $ | 178.90 | $ | 174.18 | $ | 229.71 | ||||||||||||
| S&P 500 | 100.00 | 131.49 | 155.68 | 200.37 | 164.08 | 207.21 | ||||||||||||||||||
| S&P Midcap 400 | 100.00 | 126.20 | 143.44 | 178.95 | 155.58 | 181.15 | ||||||||||||||||||
| Peer Group | 100.00 | 119.60 | 131.91 | 136.81 | 107.55 | 123.93 |
The information in the graph and table above is not deemed “filed” with the Securities and Exchange Commission and is not to be incorporated by reference in any of PCA’s filings under the Securities Act of 1933 or the Securities Exchange Act of 1934, whether made before or after the date of this Annual Report on Form 10-K, except to the extent that PCA specifically incorporates such information by reference.
Item 6. [RESERVED]
Item 7. MANAGEMENT’S DISCUSSION AND ANALYSIS OF FINANCIAL CONDITION AND RESULTS OF OPERATIONS
The following discussion and analysis of historical results of operations and financial condition should be read in conjunction with the audited financial statements and the notes thereto which appear elsewhere in this Form 10-K. This discussion includes forward-looking statements regarding our expectations with respect to our future performance, liquidity, ESG goals, and capital resources. Such statements, along with any other non-historical statements in the discussion, are forward-looking. See our discussion regarding forward-looking statements included under “Part I, Item 1A. Risk Factors” of this Form 10-K. For our discussion and analysis of our results of operations, financial condition and cash flows for the year ended December 31, 2021, the earliest of the years presented in the accompanying audited financial statements included in Item 8 herein, please refer to our Annual Report on Form 10-K for the year ended December 31, 2022, filed with the Securities and Exchange Commission on February 23, 2023. Such information is presented in Item 7 of such report under the subcaptions “Results of Operations —Year Ended December 31, 2022, Compared with Year Ended December 31, 2021” and “Liquidity and Capital Resources” and is incorporated by reference herein.
Over****view
PCA is the third largest producer of containerboard products and a leading producer of uncoated freesheet paper in North America. We operate eight mills and 86 corrugated products manufacturing plants. Our containerboard mills produce linerboard and corrugating medium, which are papers primarily used in the production of corrugated products. Our corrugated products manufacturing plants produce a wide variety of corrugated packaging products, including conventional shipping containers used to protect and transport manufactured goods, multi-color boxes and displays with strong visual appeal that help to merchandise the packaged product in retail locations, and honeycomb protective packaging. In addition, we are a large producer of packaging for meat, fresh fruit and vegetables, processed food, beverages, and other industrial and consumer products. We also manufacture and sell UFS papers, including both commodity and specialty papers, which may have custom or specialized features such as colors, coatings, high brightness, and recycled content. We are headquartered in Lake Forest, Illinois and operate primarily in the United States.
Executive Summary
Net sales were $7.8 billion for the year ended December 31, 2023 and $8.5 billion for 2022. We reported $765 million of net income, or $8.48 per diluted share, in 2023, compared to $1,030 million, or $11.03 per diluted share, in 2022. Net income included $19 million of expense for special items in 2023, compared to $10 million of expense for special items in 2022. Special items in both periods are described later in this section. Excluding special items, we recorded $784 million of net income, or $8.70 per diluted share, in 2023, compared to $1,040 million, or $11.14 per diluted share, in 2022. The decrease was driven primarily by lower prices and mix in our Packaging segment and lower volumes in our Packaging and Paper segments, partially offset by higher prices and mix in our Paper segment, lower operating and converting costs, and lower annual outage expense. For additional detail on special items included in reported GAAP results, as well as segment income (loss) excluding special items, earnings before non-operating pension expense, interest, income taxes, and depreciation, amortization, and depletion (EBITDA), and EBITDA excluding special items, see “Item 7. Reconciliations of Non-GAAP Financial Measures to Reported Amounts.” PCA ended the year with $1,206 million of cash and marketable debt securities and, including borrowing availability under its revolving credit facility, $1,529 million in liquidity.
Packaging segment income from operations was $1,074 million in 2023, compared to $1,424 million for 2022. Packaging segment EBITDA excluding special items was $1,556 million in 2023, compared to $1,849 million in 2022. The decrease was driven primarily by lower containerboard and corrugated products prices and mix, lower volumes, and higher freight and logistic expenses, partially offset by lower operating and converting costs and lower annual outage expense. Packaging volumes were down during the first half of the year as challenging economic conditions continued in 2023, with customers reducing orders to manage their inventories. Customer ordering patterns began to normalize, and volumes began to improve mid-year, and by the fourth quarter, corrugated shipments were up 6.9% in total over fourth quarter 2022. Overall, our corrugated products shipments were down (4.6%) for the year.
In order to match our supply with the demand for our products, we reduced production of containerboard at our packaging mills during the first three quarters of 2023, including idling the Wallula, WA mill in June. We began ramping up production in the fourth quarter to meet increasing demand and restarted the No. 3 machine at the Wallula mill. For more information on our containerboard production and corrugated products shipments, refer to the table presented under the caption “Production and Shipments” in “Part I, Item 1. Business” of this Form 10-K.
After increasing during the first three quarters of 2022, containerboard prices published by industry publications began to decline during the fourth quarter of 2022 and continued to decline throughout 2023. We notified customers of a $70 per ton price increase for linerboard and a $100 per ton price increase for medium effective January 1, 2024.
Over the past several years, we made extensive capital investments throughout the packaging segment to improve productivity and efficiencies at our containerboard mills and corrugated products facilities and believe that our success in execution of these capital investments has helped us to mitigate cost inflation and better serve our customers.
Paper segment income from operations was $119 million in 2023, compared to $103 million in 2022. Paper segment EBITDA excluding special items was $151 million in 2023, compared to $132 million in 2022. The increase was due primarily to higher paper prices and mix and lower freight and logistic expenses, partially offset by lower volumes and higher operating costs. Lower volumes were driven by declining uncoated freesheet demand and sales of remaining paper at the Jackson, AL mill in 2022.
We have undertaken activities to convert the Jackson mill from production of paper products, which the mill historically produced, to production of containerboard. For more information, see the Packaging caption in “Part I, Item 1. Business” and Note 1, Nature of Operations and Basis of Presentation, of the Notes to Consolidated Financial Statements in “Part II, Item 8. Financial Statements and Supplementary Data” of this Form 10-K.
Special Items and Earnings per Diluted Share, Excluding Special Items
Earnings per diluted share, excluding special items, in 2023 and 2022 were as follows:
| Year Ended December 31, | ||||||||
| 2023 | 2022 | |||||||
| Earnings per diluted share | $ | 8.48 | $ | 11.03 | ||||
| Special items: | ||||||||
| Facilities closure and other costs (a) | 0.12 | 0.01 | ||||||
| Jackson mill conversion-related activities (b) | 0.09 | 0.11 | ||||||
| Acquisition and integration-related activities (c) | — | (0.01 | ) | |||||
| Total special items expense | 0.21 | 0.11 | ||||||
| Earnings per diluted share, excluding special items | $ 8.70 (d) | $ | 11.14 |
(a)
For 2023, includes $14.4 million of charges related to the closure of corrugated products facilities and design centers, partially offset by a gain on sale of a corrugated products facility. For 2022, includes $0.7 million of charges consisting of closure costs related to corrugated products facilities. These costs were partially offset by insurance proceeds received for a natural disaster at one of the corrugated products facilities, a gain on sale of assets related to a corrugated products facility, and a favorable lease buyout for a closed corrugated products facility.
(b)
For 2023 and 2022, includes $11.1 million and $14.1 million, respectively, of charges related to the announced discontinuation of production of uncoated freesheet paper grades on the No. 3 machine at the Jackson, Alabama mill associated with the permanent conversion of the machine to produce linerboard and other paper-to-containerboard conversion related activities.
(c)
Includes $1.0 million of income from a favorable inventory adjustment related to the December 2021 Advance Packaging Corporation acquisition, partially offset by acquisition and integration related costs.
(d)
Amount may not foot due to rounding.
Management excludes special items, as it believes these items are not necessarily reflective of the ongoing results of operations of our business. We present these measures because they provide a means to evaluate the performance of our segments and our company on an ongoing basis using the same measures that are used by our management, because these measures assist in providing a meaningful comparison between periods presented and because these measures are frequently used by investors and other interested parties in the evaluation of companies and the performance of their segments. A reconciliation of diluted earnings per share to diluted earnings per share excluding special items is included above and the reconciliations of other non-GAAP measures used in this Management's Discussion and Analysis of Financial Condition and Results of Operations, to the most comparable measure reported in accordance with GAAP, are included later in Item 7 under “Reconciliations of Non-GAAP Financial Measures to Reported Amounts.” Any analysis of non-GAAP financial measures should be done in conjunction with results presented in accordance with GAAP. The non-GAAP measures are not intended to be substitutes for GAAP financial measures and should not be used as such.
Industry and Busi****ness Conditions
Trade publications reported North American industry-wide corrugated products shipments were down (5.0%) during 2023, compared to 2022. Reported industry containerboard production decreased (3.1%) compared to 2022, and reported industry containerboard inventories at the end of 2023 were approximately 2.6 million tons, down (3.1%) compared to 2022. Reported containerboard export shipments increased 2.6% compared to 2022. For linerboard, index prices decreased $10 per ton in January 2023, followed by additional decreases of $20 per ton in February 2023, $20 per ton in May 2023, and $20 per ton in November 2023, a total decrease of $70 per ton during 2023. For corrugating medium, index prices decreased $30 per ton in January 2023, followed by additional decreases of $20 per ton in February 2023, $40 per ton in May 2023, and $20 per ton in November 2023, a total decrease of $110 per ton during 2023.
The market for communication papers competes heavily with electronic data transmission and document storage alternatives. Increasing shifts to these alternatives have reduced usage of traditional print media and communication papers. Trade publications reported North American uncoated freesheet paper shipments decreased (9.7%) in 2023, compared to 2022. Although average prices reported by a trade publication for cut size office papers were higher by $57 per ton, or 4%, in 2023 compared to 2022, index prices declined throughout the year. For cut size office papers, index prices decreased $20 per ton in April 2023, followed by additional decreases of $10 per ton in June 2023 and $20 per ton in October 2023, a total decrease of $50 per ton during 2023. For offset printing papers, index prices decreased $30 per ton in April 2023, followed by additional decreases of $10 per ton in June 2023, $20 per ton in August 2023, $10 per ton in September 2023, and $15 per ton in November 2023, a total decrease of $85 per ton during 2023.
Outlook
For the first quarter of 2024, compared to the fourth quarter of 2023, in our Packaging segment, we expect higher total corrugated products shipments from continued strong demand along with two additional shipping days in the first quarter. Containerboard volume is expected to be lower due to a prolonged outage at the Jackson mill for the conversion of the No. 3 machine and a scheduled maintenance outage at our Counce, TN mill. We have restarted the No. 2 machine at the Wallula mill, which will partially offset the effect of these outages. Prices and mix should be slightly higher as we implement our January price increases, which will be partially offset by a decrease in the published prices that occurred late in 2023. We expect export containerboard prices to be flat. In our Paper segment, we expect an improved mix to move prices slightly higher with flat sales volume. Recycled fiber and energy prices will be higher, and seasonally colder weather will negatively impact usages and yields for energy, wood and chemicals along with higher operating costs associated with the restart of full operations at the Wallula mill compared to fourth quarter operations. Labor and benefits costs will have seasonal timing-related increases that occur at the beginning of a new year related to annual wage and benefit increases, the restart of payroll taxes, and share-based compensation expenses. Scheduled outage expenses will be higher and will include the significant first quarter impact of the conversion outage at our Jackson mill. Considering these items, we expect first quarter earnings to be lower than the fourth quarter of 2023.
Results of Operations
Year Ended December 31, 2023, Compared with Year Ended December 31, 2022
The historical results of operations of PCA for the years ended December 31, 2023 and 2022 are set forth below (dollars in millions):
| Year Ended December 31, | ||||||||||||
| 2023 | 2022 | Change | ||||||||||
| Packaging | $ | 7,135.6 | $ | 7,780.7 | $ | (645.1 | ) | |||||
| Paper | 595.4 | 622.1 | (26.7 | ) | ||||||||
| Corporate and other and eliminations | 71.4 | 75.2 | (3.8 | ) | ||||||||
| Net sales | $ | 7,802.4 | $ | 8,478.0 | $ | (675.6 | ) | |||||
| Packaging | $ | 1,074.3 | $ | 1,423.7 | $ | (349.4 | ) | |||||
| Paper | 118.9 | 103.0 | 15.9 | |||||||||
| Corporate and other | (118.1 | ) | (106.0 | ) | (12.1 | ) | ||||||
| Income from operations | 1,075.1 | 1,420.7 | (345.6 | ) | ||||||||
| Non-operating pension (expense) income | (7.7 | ) | 14.5 | (22.2 | ) | |||||||
| Interest expense, net | (53.3 | ) | (70.4 | ) | 17.1 | |||||||
| Income before taxes | 1,014.1 | 1,364.8 | (350.7 | ) | ||||||||
| Income tax expense | (248.9 | ) | (335.0 | ) | 86.1 | |||||||
| Net income | $ | 765.2 | $ | 1,029.8 | $ | (264.6 | ) | |||||
| Net income excluding special items (a) | $ | 784.4 | $ | 1,040.2 | $ | (255.8 | ) | |||||
| EBITDA (a) | $ | 1,592.8 | $ | 1,877.5 | $ | (284.7 | ) | |||||
| EBITDA excluding special items (a) | $ | 1,603.8 | $ | 1,885.5 | $ | (281.7 | ) |
(a)
See “Reconciliations of Non-GAAP Financial Measures to Reported Amounts” included in this Item 7 for a reconciliation of non-GAAP measures to the most comparable GAAP measure.
Net Sales
Net sales decreased $676 million, or (8.0%), to $7,802 million in 2023, compared to $8,478 million in 2022.
Packaging. Net sales decreased $645 million, or (8.3%), to $7,136 million, compared to $7,781 million in 2022, due to lower prices and mix ($397 million) and lower volumes ($248 million). In 2023, our domestic containerboard prices decreased (10.5%) and export prices decreased (29.7%) compared to 2022. Our containerboard outside shipments decreased (1.1%), and total corrugated products shipments were down (4.6%) in total and (4.3%) per workday, compared to 2022.
Paper. Net sales decreased $27 million, or (4.3%), to $595 million, compared to $622 million in 2022. The decrease was due to lower volume ($65 million), partially offset by higher prices and mix ($38 million).
Gross Profit
Gross profit decreased $392 million in 2023, compared to 2022. The decrease was driven primarily by lower prices and mix in our Packaging segment, and lower volumes in our Packaging and Paper segments, partially offset by higher prices and mix in our Paper segment, lower operating and converting costs, and lower annual outage expense. In 2023, gross profit included $15 million of special items expense related to Jackson mill conversion-related activities and corrugated facility closure and other costs, compared to $7 million of special items expense related to Jackson mill conversion-related activities, corrugated facility closure and other costs, and income related to acquisition and integration-related activities in 2022.
Selling, General, and Administrative Expenses
Selling, general, and administrative expenses (SG&A) decreased $28 million in 2023 compared to 2022. The decrease was primarily due to lower employee-related expenses, outside services, and bad debt expense.
Other Expense, Net
Other expense, net for the years ended December 31, 2023 and 2022 are set forth below (dollars in millions):
| Year Ended December 31, | ||||||||
| 2023 | 2022 | |||||||
| Asset disposals and write-offs | $ | (31.7 | ) | $ | (44.5 | ) | ||
| Jackson mill conversion-related activities | (1.8 | ) | (6.9 | ) | ||||
| Facilities closure and other (costs) income | (7.9 | ) | 0.1 | |||||
| Other | (1.5 | ) | (10.0 | ) | ||||
| Total | $ | (42.9 | ) | $ | (61.3 | ) |
We discuss these items in more detail in Note 6, Other Expense, Net of the Condensed Notes to the Consolidated Financial Statements in “Part II, Item 8. Financial Statements” of this Form 10-K.
Income from Operations
Income from operations decreased $346 million, or (24.3%), for the year ended December 31, 2023, compared to 2022. Income from operations in 2023 included $25 million of expense for special items compared to $14 million in 2022. Special items in 2023 included $14 million of expense related to corrugated facility closure and other costs and $11 million for Jackson mill conversion-related activities. Special items in 2022 consisted of $14 million of expense for Jackson mill conversion-related activities, $1 million of corrugated facility closure and other costs, and $1 million of income related to acquisition and integration-related activities.
Packaging. Segment income from operations decreased $349 million to $1,074 million, compared to $1,424 million in 2022. The decrease in 2023 related primarily to lower containerboard and corrugated products prices and mix ($373 million), lower sales and production volumes ($123 million), higher depreciation expense ($47 million), and higher freight expense ($14 million), partially offset by lower operating and converting costs ($163 million), lower annual outage expense ($36 million), and other costs ($18 million). Special items in 2023 included $14 million of expense for corrugated facility closure and other costs. Special items in 2022 included $5 million of expense for Jackson mill conversion-related activities, corrugated facility closure and other costs, and income related to acquisition and integration-related activities.
Paper. Segment income from operations increased $16 million to $119 million, compared to $103 million in 2022. The increase, excluding special items, primarily related to higher paper prices and mix ($40 million), lower freight expense ($14 million), and lower other costs ($2 million), partially offset by lower sales and production volumes ($23 million), higher operating costs ($13 million), and higher annual outage expense ($1 million). Special items in 2023 included $11 million of expense for Jackson mill conversion-related activities. Special items in 2022 included $9 million of expense for Jackson mill conversion-related activities.
Non-Operating Pension Expense, Interest Expense, Net and Income Taxes
During 2023, non-operating pension expense increased $22 million compared to 2022. The increase in non-operating pension expense was related to unfavorable 2022 asset performance, partially offset by favorable assumption changes.
Interest expense, net, during 2023 decreased $17 million compared to 2022. The decrease in interest expense, net in 2023 was primarily due to higher interest income due to higher rates on invested cash balances compared to 2022.
During 2023, we recorded $249 million of income tax expense, compared to $335 million of income tax expense during 2022. The effective tax rate for both 2023 and 2022 was 24.5%.
Liquidity and Ca****pital Resources
Sources and Uses of Cash
Our primary sources of liquidity are net cash provided by operating activities and available borrowing capacity under our revolving credit facility. We ended the year with $648 million of cash and cash equivalents, $558 million of marketable debt securities, and $323 million of unused borrowing capacity under the revolving credit facility, net of letters of credit. On November 30, 2023, we issued $400 million of 5.70% senior notes due 2033 through a registered public offering and invested the net proceeds received from this issuance in time deposits, which are included in marketable debt securities. We intend to use the net proceeds from this issuance, together with a portion of cash on hand, to redeem, repurchase, or otherwise repay at or prior to maturity our outstanding 3.65% senior notes due 2024, which mature on September 15, 2024. See Note 10, Debt, of the Consolidated Financial Statements included in “Part II, Item 8. Financial Statements and Supplementary Data” of this Form 10-K as well as information provided below under “—Investing Activities” and “—Financing Activities” for further information.
Currently, our primary uses of cash are for operations, capital expenditures, acquisitions, debt service, common stock dividends, and repurchases of common stock. We believe that net cash generated from operating activities, cash on hand, available borrowings under our revolving credit facility and available capital through access to capital markets will be adequate to meet our liquidity and capital requirements, including payments of any declared common stock dividends, for the foreseeable future. As our debt or credit facilities become due, we will need to repay, extend or replace such facilities. Our ability to do so will be subject to future economic conditions and financial, business, and other factors, many of which are beyond our control.
Below is a summary table of our cash flows, followed by a discussion of our sources and uses of cash through operating activities, investing activities, and financing activities (dollars in millions):
| Year Ended December 31, | ||||||||
| 2023 | 2022 | |||||||
| Net cash provided by (used for): | ||||||||
| Operating activities | $ | 1,315.1 | $ | 1,495.0 | ||||
| Investing activities | (875.1 | ) | (833.7 | ) | ||||
| Financing activities | (112.0 | ) | (960.0 | ) | ||||
| Net increase (decrease) in cash and cash equivalents | $ | 328.0 | $ | (298.7 | ) |
Operating Activities
Our operating cash flow is primarily driven by our earnings and changes in operating assets and liabilities, such as accounts receivable, inventories, accounts payable and other accrued liabilities, as well as other factors described below. Cash requirements for operating activities are subject to PCA’s operating needs and the timing of collection of receivables and payments of payables and expenses.
During 2023, net cash provided by operating activities was $1,315 million, compared to $1,495 million for 2022, a decrease of $180 million. Cash from operations excluding changes in cash used for operating assets and liabilities decreased $258 million, primarily due to lower income from operations in 2023 as discussed above. Cash increased by $78 million due to changes in operating assets and liabilities, primarily due to the following:
a)
a net favorable change in income taxes due to lower tax payments during 2023 compared to 2022;
b)
a net favorable change in inventories in 2023 compared to 2022 due to a smaller increase in Packaging segment inventory levels in 2023, primarily in raw materials and finished goods, partially offset by an increase in Paper segment inventory levels due to softening demand during 2023; and
c)
a net favorable change in accounts payable in 2023 compared to 2022 primarily related to higher production volumes during the last quarter of 2023 compared to 2022.
These favorable changes were partially offset by:
a)
a net unfavorable change in accounts receivable levels in 2023 compared to 2022 due to higher sales and production volumes in the Packaging segment during the latter portion of 2023, partially offset by lower pricing in the Packaging segment in 2023; and
b)
a net unfavorable change in accrued liabilities in 2023 compared to 2022 primarily related to lower accruals for employee compensation and benefit liabilities and a decrease in customer rebates related to the timing of payments and lower sales volumes in 2023.
Investing Activities
We used $875 million for investing activities in 2023, compared to $834 million in 2022. In 2023, we spent $470 million for internal capital investments, compared to $824 million in 2022. Additionally, in November 2023, we invested the net proceeds received from the issuance of our $400 million of 5.70% senior notes due 2033 in time deposits, which are included in marketable debt securities.
The details of capital expenditures for property and equipment, excluding acquisitions, by segment for the years ended December 31, 2023 and 2022 are included in the table below (dollars in millions).
| Year Ended December 31, | ||||||||
| 2023 | 2022 | |||||||
| Packaging | $ | 426.8 | $ | 753.5 | ||||
| Paper | 9.7 | 14.1 | ||||||
| Corporate and Other | 33.2 | 56.6 | ||||||
| $ | 469.7 | $ | 824.2 |
We expect capital investments in 2024 to be between $470 million and $490 million. These expenditures could increase or decrease as a result of a number of factors, including our financial results, strategic opportunities, future economic conditions, and our regulatory compliance requirements. We currently estimate capital expenditures to comply with environmental regulations will be about $15 million in 2024. Our estimated environmental expenditures could vary significantly depending upon the enactment of new environmental laws and regulations. For additional information, see “Environmental Matters” in this Management's Discussion and Analysis of Financial Condition and Results of Operations.
Financing Activities
In 2023, net cash used for financing activities was $112 million, compared to $960 million of cash used for financing activities in 2022, a decrease of $848 million. We paid $449 million in dividends on our common stock in 2023, compared to $420 million paid in 2022. We repurchased and retired 0.3 million shares of the Company's common stock for $42 million in 2023, compared to repurchases of 4.0 million shares for $523 million in 2022.
In November 2023, we issued $400 million of 5.70% senior notes due 2033 through a registered public offering. The Company paid $4 million of debt issuance costs associated with the new notes, of which $3 million was funded using the net proceeds received from the issuance of new notes and $1 million was funded using cash on hand. The net proceeds received from the issuance of the new notes were invested in time deposits. We intend to use the net proceeds from this issuance, together with a portion of cash on hand, to redeem, repurchase, or otherwise repay at or prior to maturity our outstanding 3.65% senior notes due 2024, which mature on September 15, 2024.
See Note 10, Debt, of the Consolidated Financial Statements included in “Part II, Item 8. Financial Statements and Supplementary Data” of this Form 10-K for more information on our debt.
Commit****ments
Contractual Obligations
Our cash requirements greater than twelve months from contractual obligations and commitments include:
Debt obligations and interest payments. See Note 10, Debt, of the Consolidated Financial Statements included in “Part II, Item 8. Financial Statements and Supplementary Data” of this Form 10-K for more information on our debt obligations and interest payments and the timing of expected future payments.
Operating and finance leases. See Note 3, Leases, of the Consolidated Financial Statements included in “Part II, Item 8. Financial Statements and Supplementary Data” of this Form 10-K for more information on our lease obligations and the timing of expected future payments.
Asset retirement obligations. See Note 13, Asset Retirement Obligations, of the Consolidated Financial Statements included in “Part II, Item 8. Financial Statements and Supplementary Data” of this Form 10-K for more information on our asset retirement obligation at the end of the period.
Purchase commitments. Purchase commitments relate to various purchase agreements for items such as minimum amounts of energy and fiber purchases. See Note 19, Commitments, Guarantees, Indemnifications, and Legal Proceedings, of the Consolidated Financial Statements included in “Part II, Item 8. Financial Statements and Supplementary Data” of this Form 10-K for more information on our purchase commitments and the timing of expected future payments.
Employee benefit obligations. See Note 12, Employee Benefits Plans and Other Postretirement Benefits, of the Consolidated Financial Statements included in “Part II, Item 8. Financial Statements and Supplementary Data” of this Form 10-K for more information on our employee benefit obligations and the timing of expected future benefit payments under our pension plans and postretirement plans.
Off-B****alance Sheet Arrangements
The Company does not have any off-balance sheet arrangements as of December 31, 2023.
Inflation and Other G****eneral Cost Increases
We are subject to both contractual, inflation, and other general cost increases. If we are unable to offset these cost increases by price increases, growth, and/or cost reductions in our operations, these inflation and other general cost increases could have a material adverse effect on our operating cash flows, profitability, and liquidity.
In 2023, our total company costs including cost of sales (COS) and selling, general, and administrative expenses (SG&A) was $6.7 billion, and excluding non-cash costs (depreciation, depletion and amortization, pension and postretirement expense, and share-based compensation expense) was $6.1 billion. A 1% increase in COS and SG&A costs would increase costs by $67 million and cash costs by $61 million.
Certain items of product input costs have historically been subject to more cost volatility including fiber, purchased energy, and chemicals.
Energy
Our mills represent about 90% of our total purchased fuel costs. In 2023, our Packaging and Paper mills consumed about 93 million MMBTUs of fuel, including internally generated and externally purchased, to produce both steam and electricity. The following table for 2023 provides the total MMBTUs purchased externally by fuel type each quarter and the average cost per MMBTU by fuel type for the year. The cost per MMBTU includes the cost of the fuel plus our transportation and delivery costs.
| 2023 Fuel Purchased (millions of MMBTUs) | 2023 Avg. | |||||||||||||||||||||||
| Fuel Type | First Quarter | Second Quarter | Third Quarter | Fourth Quarter | Full Year | Cost / MMBTU | ||||||||||||||||||
| Natural gas | 6.6 | 5.6 | 5.2 | 6.6 | 24.0 | $ | 5.19 | |||||||||||||||||
| Purchased bark | 2.6 | 1.8 | 1.7 | 2.1 | 8.2 | 2.57 | ||||||||||||||||||
| Other purchased fuels | 0.2 | 0.2 | 0.1 | 0.1 | 0.6 | 10.92 | ||||||||||||||||||
| Total mills | 9.4 | 7.6 | 7.0 | 8.8 | 32.8 | $ | 4.64 |
In addition, the mills purchased 21.03 million CkWh (hundred kilowatt-hours) of electricity in 2023. The purchases by quarter and the average cost per CkWh were as follows:
| 2023 Purchased Electricity (millions of CkWh) | 2023 Avg. | |||||||||||||||||||||||
| First Quarter | Second Quarter | Third Quarter | Fourth Quarter | Full Year | Cost / CkWh | |||||||||||||||||||
| Purchased electricity | 5.4 | 5.2 | 5.1 | 5.3 | 21.0 | $ | 6.50 |
Regulatory and Environment****al Matters
Our operations are subject to our compliance with the laws and regulations in the jurisdictions in which we operate, primarily in the United States. Of particular importance are laws and regulations relating to the environment and health and safety matters.
Environmental compliance requirements are a significant factor affecting our business. We employ processes in the manufacture of containerboard, paper, and pulp, which result in various discharges, emissions and waste disposal. These processes are subject to numerous federal, state, local and foreign environmental laws and regulations. We operate and expect to continue to operate, under environmental permits and similar authorizations from various governmental authorities that regulate such discharges, emissions, and waste disposal. The most significant of these laws affecting the Company are:
Resource Conservation and Recovery Act (RCRA);
Clean Water Act (CWA);
Clean Air Act (CAA);
The Emergency Planning and Community Right-to-Know-Act (EPCRA);
Toxic Substance Control Act (TSCA); and
Safe Drinking Water Act (SDWA).
We believe that we are currently in material compliance with these and all applicable environmental rules and regulations. Because environmental regulations are constantly evolving, the Company has incurred, and will continue to incur, costs to maintain compliance with these and other environmental laws. The Company works diligently to anticipate and budget for the impact of applicable environmental regulations and does not currently expect that future environmental compliance obligations will materially affect its business or financial condition. For both the years ended December 31, 2023 and 2022, we spent $50 million, and in 2021, we spent $44 million, to comply with the requirements of these and other environmental laws. Additionally, we had $14 million of environmental capital expenditures in 2023, $11 million in 2022, and $10 million in 2021.
In January 2013, the U.S. Environmental Protection Agency (the “EPA”) established a three-year deadline for compliance with the Boiler MACT regulations, establishing air emissions standards and certain other requirements for industrial boilers. PCA's compliance actions involved modifying or replacing certain boilers, and all PCA mills are in full compliance with Boiler MACT requirements. On July 29, 2016, the U.S. Court of Appeals for the District of Columbia Circuit issued a ruling on the consolidated cases challenging Boiler MACT. The court vacated key portions of the rule, including emission limits for certain subcategories of solid fuel boilers, and remanded issues to the EPA for further rulemaking. At this time, we cannot predict with certainty how this decision will impact our existing Boiler MACT compliance efforts or whether we will incur additional costs to comply with any revised standards.
As is the case with any industrial operation, PCA has, in the past, incurred costs associated with the remediation of soil or groundwater contamination, as required by the federal Comprehensive Environmental Response, Compensation and Liability Act, commonly known as the federal “Superfund” law, and analogous state laws. Cleanup requirements arise with respect to properties the Company currently owns or operates, former facilities and off-site facilities where the Company has disposed of hazardous substances. As part of the sale to PCA of the containerboard and corrugated products business of Pactiv Corporation in April 1999, Pactiv agreed to retain all liability for all former facilities and all sites associated with pre-closing off-site waste disposal. Pactiv also retained environmentally impaired real property in Filer City, Michigan unrelated to current mill operations. In addition, OfficeMax (now an indirect, wholly owned subsidiary of ODP) retains responsibility for certain environmental liabilities related to some of the businesses, facilities, and assets we acquired from Boise. Generally, this responsibility relates to hazardous substance releases and other environmental incidents that arose before 2004. Some of these liabilities could be significant; however, ODP may not have sufficient funds to satisfy its indemnification obligations, and in some cases, we may not be entitled to such indemnification.
Because liability for remediation costs under environmental laws is strict, meaning that liability is imposed without fault, joint and several, meaning that liability is imposed on each party without regard to contribution, and retroactive, PCA could receive notifications of cleanup liability in the future and this liability could be material. From 2006 through 2023, there were no significant environmental remediation costs at PCA's mills and corrugated plants. As of December 31, 2023, we maintained an environmental reserve of $25.8 million relating to on-site landfills and surface impoundments as well as ongoing and anticipated remedial projects. The Company believes that it is not reasonably possible that future environmental expenses above the $25.8 million accrued at December 31, 2023, will have a material impact on its financial condition, results of operations, and cash flows.
While legislation regarding the regulation of greenhouse gas emissions has been proposed at the federal level, it is uncertain whether such legislation will be passed and, if so, what the breadth and scope of such legislation will be. The result of the regulation of greenhouse gas emissions could be an increase in our future environmental compliance costs through carbon cap and trade systems, carbon or other related taxes, or additional capital expenditures to modify facilities to reduce carbon emissions, which may be material. However, climate change legislation and the resulting future energy policy could also provide us with opportunities if the use of renewable energy is encouraged. We currently self-generate the majority of our power requirements at our mills using renewable biogenic fuel such as bark, black liquor and biomass, which are derived from renewable and sustainable resources. While we believe we are well-positioned to take advantage of any renewable energy incentives, it is uncertain what the ultimate costs and opportunities of any climate change legislation will be and how our business and industry will be affected.
We are seeking to further improve our environmental impact and have voluntarily set goals to reduce our absolute Scope 1 and 2 (market-based) greenhouse gas emissions by 35% by 2030 from a 2021 baseline year and to reach net-zero carbon emissions within our own operations and our value chain by 2050. In addition, we and our industry support the American Forest & Paper Association's goal of a 50% reduction in Scope 1 and Scope 2 greenhouse gas emissions intensity by 2030 from a 2005 baseline. We have a carbon neutrality team, consisting of a cross-functional group of key operational, engineering, environmental, and sustainability personnel to lead our efforts. Our strategy to achieve greenhouse gas emissions reductions is premised upon the carbon neutrality of the biogenic fuels used in our operations and we believe that meaningful reductions in greenhouse gas emissions can be achieved through investment in more efficient operations utilizing carbon-neutral fuels and in emerging and advancing technologies. We regularly work to identify and implement projects that will improve our efficiency. To what extent and when we embark upon major capital projects to reduce emissions will depend in part upon technology advancements, emerging regulatory and tax policies involving greenhouse gas emissions and incentives to invest in projects that reduce emissions. We also regularly assess the use of alternative, non-emitting energy sources at our own facilities (such as solar) and opportunities to support additive carbon-free grid power via renewable energy certificates (RECs) and power purchase agreements (PPAs), where feasible to do so, and partnering with utilities to procure carbon-free power where opportunities exist. We annually report key data to our stakeholders regarding our greenhouse gas emissions, among other things, in our responsibility report. Our responsibility report is available on our website and is not intended to be incorporated by reference herein.
We are also subject to extensive federal, state and local laws related to workplace health and safety, and our safety management system includes measures to assure compliance with these laws and regulations. We do not believe that future compliance with health and safety laws and regulations will have a material adverse effect on our financial condition, results of operations or cash flows.
Critical Accounting Po****licies and Estimates
Management’s discussion and analysis of financial condition and results of operations are based upon the Company’s consolidated financial statements, which have been prepared in accordance with accounting principles generally accepted in the United States of America. The preparation of these financial statements requires us to make estimates and judgments that affect the reported amounts of assets, liabilities, revenues and expenses, and related disclosures of contingent assets and liabilities. On an ongoing basis, PCA evaluates its estimates, including those related to business combinations, goodwill and intangible assets, pensions and other postretirement benefits, environmental liabilities, income taxes, and long-lived asset impairment, among others. PCA bases its estimates on historical experience and on various other assumptions that are believed to be reasonable under the circumstances, the results of which form the basis for making judgments about the carrying values of assets and liabilities that are not readily apparent from other sources. Actual results may differ from these estimates under different assumptions or conditions.
Critical accounting estimates are those that are most important to the portrayal of our financial condition and results. These estimates require management's most difficult, subjective, or complex judgments. We review the development, selection, and disclosure of our critical accounting estimates with the Audit Committee of our Board of Directors. The Company believes that of its significant accounting policies, the following involve a higher degree of judgment and/or complexity:
Pensions
The Company accounts for defined benefit pension plans in accordance with Accounting Standards Codification (“ASC”) 715, Compensation - Retirement Benefits. The calculation of pension expense and pension liabilities requires decisions about a number of key assumptions that can significantly affect expense and liability amounts, including discount rates, expected return on plan assets, expected rate of compensation increases, longevity and service lives of participants, expected contributions, and other factors. The pension assumptions used to measure pension expense and liabilities are discussed in Note 12, Employee Benefit Plans and Other Postretirement Benefits, of the Notes to Consolidated Financial Statements in “Part II, Item 8. Financial Statements and Supplementary Data” of this Form 10-K.
We recognize the funded status of our pension plans on our Consolidated Balance Sheet and recognize the actuarial and experienced gains and losses and the prior service costs and credits as a component of “Accumulated Other Comprehensive Loss” in our Consolidated Statement of Changes in Stockholders' Equity. Actual results that differ from assumptions are accumulated and amortized over future periods and, therefore, generally affect recognized expense in future periods. At December 31, 2023, we had $70.7 million of actuarial losses and prior service costs, net of tax, recorded in “Accumulated other comprehensive loss” on our Consolidated Balance Sheet. Accumulated losses in excess of 10% of the greater of the projected benefit obligation or the market-related value of assets will be recognized on a straight-line basis over the average remaining service period of active employees in the PCA plans (which is between six and nine years) and over the average remaining lifetime of inactive participants of the Boise plan (which is approximately 23 years), to the extent that losses are not offset by gains in subsequent years. While we believe that the assumptions used to measure our pension obligations are reasonable, differences in actual experience or changes in assumptions may materially affect our pension obligations and future expense.
We believe that the accounting estimate related to pensions is a critical accounting estimate because it is highly susceptible to change from period to period. As discussed above, the future effects of pension plans on our financial position and results of operations will depend on economic conditions, employee demographics, mortality rates, retirement rates, investment performance, and funding decisions, among other factors. The following table presents selected assumptions used and expected to be used in the measurement of pension expense in the following periods (dollars in millions):
| Year Ending December 31, | Year Ended December 31, | |||||||||||
| 2024 | 2023 | 2022 | ||||||||||
| Pension expense | $ | 8.4 | $ | 22.1 | $ | 5.3 | ||||||
| Assumptions | ||||||||||||
| Discount rate | 4.86 | % | 5.06 | % | 2.89 | % | ||||||
| Expected rate of return on plan assets | 5.80 | % | 5.52 | % | 4.08 | % |
A change of 0.25% in either direction to the discount rate or the expected rate of return on plan assets would have had the following effect on 2023 and 2024 pension expense (dollars in millions):
| Increase (Decrease) in Pension Expense(a) | ||||||||||||
| Base Expense | 0.25% Increase | 0.25% Decrease | ||||||||||
| 2023 | ||||||||||||
| Discount rate | $ | 22.1 | $ | (2.0 | ) | $ | 2.2 | |||||
| Expected rate of return on plan assets | 22.1 | (2.6 | ) | 2.6 | ||||||||
| 2024 | ||||||||||||
| Discount rate | $ | 8.4 | $ | 0.7 | $ | 1.7 | ||||||
| Expected rate of return on plan assets | 8.4 | (2.8 | ) | 2.8 |
(a)
The sensitivities shown above are specific to 2023 and 2024. The sensitivities may not be additive, so the impact of changing multiple factors simultaneously cannot be calculated by combining the individual sensitivities shown.
For more information related to our pension benefit plans, see Note 12, Employee Benefit Plans and Other Postretirement Benefits, of the Notes to Consolidated Financial Statements in “Part II, Item 8. Financial Statements and Supplementary Data” of this Form 10-K.
New and Recently Adopte****d Accounting Standards
For a listing of our new and recently adopted accounting standards, see Note 2, Summary of Significant Accounting Policies, of the Notes to Consolidated Financial Statements in “Part II, Item 8. Financial Statements and Supplementary Data” of this Form 10-K.
Reconciliations of Non-GAAP Finan****cial Measures to Reported Amounts
Net income excluding special items, EBITDA, and EBITDA excluding special items are non-GAAP financial measures. Management excludes special items, as it believes that these items are not necessarily reflective of the ongoing operations of our business. These measures are presented because they provide a means to evaluate the performance of our segments and our Company on an ongoing basis using the same measures that are used by our management, because these measures assist in providing a meaningful comparison between periods and because these measures are frequently used by investors and other interested parties in the evaluation of companies and the performance of their segments. Any analysis of non-GAAP financial measures should be done in conjunction with results presented in accordance with GAAP. The non-GAAP measures are not intended to be substitutes for GAAP financial measures and should not be used as such. Reconciliations of the non-GAAP measures to the most comparable measure reported in accordance with GAAP for the years ended December 31, 2023 and 2022 follow (dollars in millions):
| Year Ended December 31, | ||||||||||||||||||||||||
| 2023 | 2022 | |||||||||||||||||||||||
| Income before Taxes | Income Taxes | Net Income | Income before Taxes | Income Taxes | Net Income | |||||||||||||||||||
| As reported in accordance with GAAP | $ | 1,014.1 | $ | (248.9 | ) | $ | 765.2 | $ | 1,364.8 | $ | (335.0 | ) | $ | 1,029.8 | ||||||||||
| Special items: | ||||||||||||||||||||||||
| Facilities closure and other costs (a) | 14.4 | (3.6 | ) | 10.8 | 0.7 | (0.2 | ) | 0.5 | ||||||||||||||||
| Jackson mill conversion-related activities (b) | 11.1 | (2.7 | ) | 8.4 | 14.1 | (3.5 | ) | 10.6 | ||||||||||||||||
| Acquisition and integration related activities (c) | — | — | — | (1.0 | ) | 0.3 | (0.7 | ) | ||||||||||||||||
| Total special items | 25.5 | (6.3 | ) | 19.2 | 13.8 | (3.4 | ) | 10.4 | ||||||||||||||||
| Excluding special items | $ | 1,039.6 | $ | (255.2 | ) | $ | 784.4 | $ | 1,378.6 | $ | (338.4 | ) | $ | 1,040.2 |
(a)
For 2023, includes charges related to the closure of corrugated products facilities and design centers. These costs were partially offset by a gain on sale of a corrugated products facility. For 2022, includes charges consisting of closure costs related to corrugated products facilities. These costs were partially offset by insurance proceeds received for a natural disaster at one of the corrugated products facilities, a gain on sale of assets related to a corrugated products facility, and a favorable lease buyout for a closed corrugated products facility.
(b)
For 2023 and 2022, includes charges related to the announced discontinuation of production of uncoated freesheet paper grades on the No. 3 machine at the Jackson, Alabama mill associated with the permanent conversion of the machine to produce linerboard and other paper-to-containerboard conversion related activities.
(c)
Includes income from a favorable inventory adjustment related to the December 2021 Advance Packaging Corporation acquisition, partially offset by acquisition and integration related costs.
The following table reconciles net income to EBITDA and EBITDA excluding special items for the periods indicated (dollars in millions):
| Year Ended December 31, | ||||||||
| 2023 | 2022 | |||||||
| Net income | $ | 765.2 | $ | 1,029.8 | ||||
| Non-operating pension expense (income) | 7.7 | (14.5 | ) | |||||
| Interest expense, net | 53.3 | 70.4 | ||||||
| Provision for income taxes | 248.9 | 335.0 | ||||||
| Depreciation, amortization, and depletion | 517.7 | 456.8 | ||||||
| EBITDA | $ | 1,592.8 | $ | 1,877.5 | ||||
| Special items: | ||||||||
| Facilities closure and other costs | $ | 8.9 | $ | 0.4 | ||||
| Jackson mill conversion-related activities | 2.1 | 8.6 | ||||||
| Acquisition and integration related activities | — | (1.0 | ) | |||||
| EBITDA excluding special items | $ | 1,603.8 | $ | 1,885.5 |
The following table reconciles segment income (loss) to EBITDA and EBITDA excluding special items (dollars in millions):
| Year Ended December 31, | ||||||||
| 2023 | 2022 | |||||||
| Packaging | ||||||||
| Segment income | $ | 1,074.3 | $ | 1,423.7 | ||||
| Depreciation, amortization, and depletion | 472.5 | 420.2 | ||||||
| EBITDA | 1,546.8 | 1,843.9 | ||||||
| Facilities closure and other costs | 8.9 | 0.4 | ||||||
| Jackson mill conversion-related activities | — | 5.3 | ||||||
| Acquisition and integration related activities | — | (1.0 | ) | |||||
| EBITDA excluding special items | $ | 1,555.7 | $ | 1,848.6 | ||||
| Paper | ||||||||
| Segment income | $ | 118.9 | $ | 103.0 | ||||
| Depreciation, amortization, and depletion | 29.6 | 26.1 | ||||||
| EBITDA | 148.5 | 129.1 | ||||||
| Jackson mill conversion-related activities | 2.1 | 3.3 | ||||||
| EBITDA excluding special items | $ | 150.6 | $ | 132.4 | ||||
| Corporate and Other | ||||||||
| Segment loss | $ | (118.1 | ) | $ | (106.0 | ) | ||
| Depreciation, amortization, and depletion | 15.6 | 10.5 | ||||||
| EBITDA | (102.5 | ) | (95.5 | ) | ||||
| EBITDA excluding special items | $ | (102.5 | ) | $ | (95.5 | ) | ||
| EBITDA | $ | 1,592.8 | $ | 1,877.5 | ||||
| EBITDA excluding special items | $ | 1,603.8 | $ | 1,885.5 |
Item 7A. QUANTITATIVE AND QUALITATIVE DISCLOSURES ABOUT MARKET RISK
PCA is exposed to the impact of commodity price changes, interest rate changes, and changes in the market value of its financial instruments. To manage these risks, we may from time to time enter into transactions, including certain physical commodity transactions, that are determined to be derivatives. As of December 31, 2023, we are party to certain physical commodity transactions related to natural gas supply contracts. For a discussion of derivatives and hedging activities, see Note 2, Summary of Significant Accounting Policies, of the Notes to Consolidated Financial Statements in “Part II, Item 8. Financial Statements and Supplementary Data” of this Form 10-K.
At December 31, 2023, the interest rates on 100% of PCA’s outstanding debt are fixed.
Item 8. FINANCIAL STATEMENTS AND SUPPLEMENTARY DATA
INDEX TO FINANCIAL STATEMENTS
REPORT OF INDEPENDENT REGIST****ERED PUBLIC ACCOUNTING FIRM
To the Stockholders and Board of Directors
Packaging Corporation of America:
Opinions on the Consolidated Financial Statements and Internal Control Over Financial Reporting
We have audited the accompanying consolidated balance sheets of Packaging Corporation of America and subsidiaries (the Company) as of December 31, 2023 and 2022, the related consolidated statements of income and comprehensive income, changes in stockholders’ equity, and cash flows for each of the years in the three-year period ended December 31, 2023, and the related notes (collectively, the consolidated financial statements). We also have audited the Company’s internal control over financial reporting as of December 31, 2023, based on criteria established in Internal Control – Integrated Framework (2013) issued by the Committee of Sponsoring Organizations of the Treadway Commission.
In our opinion, the consolidated financial statements referred to above present fairly, in all material respects, the financial position of the Company as of December 31, 2023 and 2022, and the results of its operations and its cash flows for each of the years in the three-year period ended December 31, 2023, in conformity with U.S. generally accepted accounting principles. Also in our opinion, the Company maintained, in all material respects, effective internal control over financial reporting as of December 31, 2023 based on criteria established in Internal Control – Integrated Framework (2013) issued by the Committee of Sponsoring Organizations of the Treadway Commission.
Basis for Opinions
The Company’s management is responsible for these consolidated financial statements, for maintaining effective internal control over financial reporting, and for its assessment of the effectiveness of internal control over financial reporting, included in the accompanying Management's Report on Internal Control Over Financial Reporting. Our responsibility is to express an opinion on the Company’s consolidated financial statements and an opinion on the Company’s internal control over financial reporting based on our audits. We are a public accounting firm registered with the Public Company Accounting Oversight Board (United States) (PCAOB) and are required to be independent with respect to the Company in accordance with the U.S. federal securities laws and the applicable rules and regulations of the Securities and Exchange Commission and the PCAOB.
We conducted our audits in accordance with the standards of the PCAOB. Those standards require that we plan and perform the audits to obtain reasonable assurance about whether the consolidated financial statements are free of material misstatement, whether due to error or fraud, and whether effective internal control over financial reporting was maintained in all material respects.
Our audits of the consolidated financial statements included performing procedures to assess the risks of material misstatement of the consolidated financial statements, whether due to error or fraud, and performing procedures that respond to those risks. Such procedures included examining, on a test basis, evidence regarding the amounts and disclosures in the consolidated financial statements. Our audits also included evaluating the accounting principles used and significant estimates made by management, as well as evaluating the overall presentation of the consolidated financial statements. Our audit of internal control over financial reporting included obtaining an understanding of internal control over financial reporting, assessing the risk that a material weakness exists, and testing and evaluating the design and operating effectiveness of internal control based on the assessed risk. Our audits also included performing such other procedures as we considered necessary in the circumstances. We believe that our audits provide a reasonable basis for our opinions.
Definition and Limitations of Internal Control Over Financial Reporting
A company’s internal control over financial reporting is a process designed to provide reasonable assurance regarding the reliability of financial reporting and the preparation of financial statements for external purposes in accordance with generally accepted accounting principles. A company’s internal control over financial reporting includes those policies and procedures that (1) pertain to the maintenance of records that, in reasonable detail, accurately and fairly reflect the transactions and dispositions of the assets of the company; (2) provide reasonable assurance that transactions are recorded as necessary to permit preparation of financial statements in accordance with generally accepted accounting principles, and that receipts and expenditures of the company are being made only in accordance with authorizations of management and directors of the company; and (3) provide reasonable assurance regarding prevention or timely detection of unauthorized acquisition, use, or disposition of the company’s assets that could have a material effect on the financial statements.
Because of its inherent limitations, internal control over financial reporting may not prevent or detect misstatements. Also, projections of any evaluation of effectiveness to future periods are subject to the risk that controls may become inadequate because of changes in conditions, or that the degree of compliance with the policies or procedures may deteriorate.
Critical Audit Matter
The critical audit matter communicated below is a matter arising from the current period audit of the consolidated financial statements that was communicated or required to be communicated to the audit committee and that: (1) relates to accounts or disclosures that are material to the consolidated financial statements and (2) involved our especially challenging, subjective, or complex judgments. The communication of a critical audit matter does not alter in any way our opinion on the consolidated financial statements, taken as a whole, and we are not, by communicating the critical audit matter below, providing a separate opinion on the critical audit matter or on the accounts or disclosures to which it relates.
Evaluation of the value of the pension benefit obligation
As discussed in Notes 2 and 12 to the consolidated financial statements, the Company’s estimated pension benefit obligation totaled $1,202 million as of December 31, 2023. The pension benefit obligation is measured at the actuarial present value as of a date of all benefits attributed by the pension benefit formula to employee service rendered before that date. The determination of the Company’s pension benefit obligation is dependent, in part, on the selection of certain actuarial assumptions, including the discount rate.
We identified the evaluation of the value of the pension benefit obligation as a critical audit matter because of the specialized skills required to evaluate the measurement of the pe
Showing the first 8K of 166K characters. Open the full section
Item 9. CHANGES IN AND DISAGREEMENTS WITH ACCOUNTANTS ON ACCOUNTING AND FINANCIAL DISCLOSURE
Not applicable.
Item 9A. CONTROLS AND PROCEDURES
Controls and Procedures
PCA maintains disclosure controls and procedures (as defined in Rule 13a-15(e) of the Securities Exchange Act of 1934) that are designed to provide reasonable assurance that information required to be disclosed in PCA’s filings under the Securities Exchange Act is recorded, processed, summarized and reported within the periods specified in the rules and forms of the SEC and that such information is accumulated and communicated to PCA’s management, including its Chief Executive Officer and Chief Financial Officer, as appropriate, to allow timely decisions regarding required disclosure.
Prior to filing this report, PCA completed an evaluation under the supervision and with the participation of PCA’s management, including PCA’s Chief Executive Officer and Chief Financial Officer, of the effectiveness of the design and operation of PCA’s disclosure controls and procedures as of December 31, 2023. The evaluation of PCA’s disclosure controls and procedures included a review of the controls’ objectives and design, PCA’s implementation of the controls and the effect of the controls on the information generated for use in this report. Based on this evaluation, PCA’s Chief Executive Officer and Chief Financial Officer concluded that PCA’s disclosure controls and procedures were effective at the reasonable assurance level as of December 31, 2023.
During the quarter ended December 31, 2023, there were no changes to internal controls over financial reporting that have materially affected, or are reasonably likely to materially affect, PCA's internal control over financial reporting.
Management’s Report on Internal Control Over Financial Reporting
PCA’s management is responsible for establishing and maintaining adequate internal control over financial reporting, as such term is defined in Exchange Act Rule 13a-15(f). Internal control over financial reporting is a process designed to provide reasonable assurance regarding the reliability of financial reporting and the preparation of financial statements for external purposes in accordance with generally accepted accounting principles. Internal control over financial reporting includes those policies and procedures that (1) pertain to the maintenance of records that, in reasonable detail, accurately and fairly reflect the transactions and dispositions of the Company’s assets; (2) provide reasonable assurance that transactions are recorded as necessary to permit preparation of financial statements in accordance with generally accepted accounting principles, and that receipts and expenditures are being made only with proper authorizations; and (3) provide reasonable assurance regarding prevention or timely detection of unauthorized acquisition, use, or disposition of the Company’s assets that could have a material effect on the financial statements.
Because of its inherent limitations, PCA’s internal control over financial reporting may not prevent or detect misstatements. A control system, no matter how well conceived and operated, can provide only reasonable, not absolute, assurance that objectives of the control system are met. Because of the inherent limitations in all control systems, no evaluation of controls can provide absolute assurance that all control issues and instances of fraud, if any, have been detected. Also, projections of any evaluation of effectiveness to future periods are subject to the risk that controls become inadequate because of changes in conditions, or that the degree of compliance with the policies and procedures may deteriorate.
PCA’s management, under the supervision of and with the participation of the Chief Executive Officer and Chief Financial Officer, assessed the Company’s internal control over financial reporting as of December 31, 2023, based on criteria established in Internal Control - Integrated Framework (2013) issued by the Committee of Sponsoring Organizations of the Treadway Commission (COSO). Based on this assessment, PCA’s management concluded that its internal control over financial reporting was effective as of December 31, 2023 based on the specified criteria.
KPMG LLP, the independent registered public accounting firm that audited PCA’s financial statements included in this Form 10-K, has also audited the effectiveness of the Company’s internal control over financial reporting. Their attestation report precedes PCA’s audited financial statements included elsewhere in this report.
Item 9B. OTHER INFORMATION
During the three months ended December 31, 2023, none of the Company's directors or officers adopted or terminated any contract, instruction, or written plan for the purchase or sale of our securities intended to satisfy the affirmative defense conditions of Rule 10b5-1(c) under the Exchange Act or any non-Rule 10b5-1 trading arrangements as defined in Item 408(a) of Regulation S-K.
Item 9C. DISCLOSURE REGARDING FOREIGN JURISDICTIONS THAT PREVENT INSPECTIONS
Not applicable.
PART III
Item 10. DIRECTORS, EXECUTIVE OFFICERS, AND CORPORATE GOVERNANCE
Information regarding PCA’s executive officers required by this Item 10 is set forth in Item 1 of Part I of this report under the caption “Executive Officers of the Registrant.”
The following information required by this Item 10 will be included in PCA’s Proxy Statement for the 2024 Annual Meeting of Stockholders and is incorporated by reference herein:
Information regarding PCA’s directors included under the caption “Election of Directors”
Information regarding PCA’s Audit Committee and financial experts included under the caption “Election of Directors - Audit Committee”
Information regarding PCA’s codes of ethics included under the caption “Election of Directors - Code of Ethics”
Information regarding PCA’s stockholder nominating procedures included under the captions “Election of Directors - Nominating and Governance Committee,” “Other Information - Recommendations for Board - Nominated Director Nominees,” and “Other Information - Procedures for Nominating Directors or Bringing Business Before the 2024 Annual Meeting”
Information regarding compliance with Section 16(a) of the Securities Exchange Act of 1934 included under the caption “Delinquent Section 16(a) Reports”
Item 11. EXECUTIVE COMPENSATION
Information with respect to executive compensation required by this Item 11 will be included in PCA’s Proxy Statement under the captions “Compensation Discussion and Analysis,” "Compensation Committee Report," “Executive Officer Compensation” (including all subcaptions and tables thereunder), "Director Compensation," and “Board Committees - Compensation Committee” and is incorporated herein by reference.
Item 12. SECURITY OWNERSHIP OF CERTAIN BENEFICIAL OWNERS AND MANAGEMENT AND RELATED STOCKHOLDER MATTERS
Information with respect to security ownership of certain beneficial owners and management required by this Item 12 will be included in PCA’s Proxy Statement under the caption “Ownership of Our Stock” and is incorporated herein by reference.
Authorization of Securities under Equity Compensation Plans — Securities authorized for issuance under our equity compensation plans at December 31, 2023 are as follows:
| Column | ||||||||||||
| A | B | C | ||||||||||
| Plan Category | Number of Securities to Be Issued Upon Exercise of Outstanding Options, Warrants, and Rights (a) | Weighted Average Exercise Price of Outstanding Options, Warrants, and Rights | Number of Securities Remaining Available for Future Issuance Under Equity Compensation Plans (Excluding Securities Reflected in Column A) | |||||||||
| Equity compensation plans approved by securityholders | — | $ | — | 662,089 | ||||||||
| Equity compensation plans not approved by securityholders | N/A | N/A | N/A | |||||||||
| Total | — | $ | — | 662,089 |
(a)
Assumes that outstanding performance units pay out at the target level. Does not include 1,044,500 shares of unvested restricted stock and performance units granted pursuant to our Amended and Restated 1999 Long-Term Equity Incentive Plan.
Item 13. CERTAIN RELATIONSHIPS AND RELATED TRANSACTIONS, AND DIRECTOR INDEPENDENCE
Information with respect to certain relationships and related transactions and director independence required by this Item 13 will be included in PCA’s Proxy Statement under the captions “Transactions with Related Persons” and “Election of Directors - Determination of Director Independence,” respectively, and is incorporated herein by reference.
Item 14. PRINCIPAL ACCOUNTING FEES AND SERVICES
Information with respect to fees and services of the principal accountant required by this Item 14 will be included in PCA’s Proxy Statement under the caption “Ratification of Appointment of the Independent Registered Public Accounting Firm” under the subcaptions “- Fees to the Independent Registered Public Accounting Firm” and “- Audit Committee Preapproval Policy for Audit and Non-Audit Fees” and are incorporated herein by reference.
PAR****T IV
Item 15. EXHIBITS, FINANCIAL STATEMENT SCHEDULES
(a)
The following documents are filed as a part of this report:
(1)
The financial statements listed in the “Index to Financial Statements.”
(2)
Financial Statement Schedule.
All schedules for which provision is made in the applicable accounting regulations of the Securities and Exchange Commission are not required under the related instructions, are inapplicable or not material, or the information called for thereby is otherwise included in the financial statements or the accompanying notes to the financial statements and therefore, have been omitted.
(3)
Exhibits
- Management contract or compensatory plan or arrangement.
** Confidential information in this exhibit has been omitted.
† Filed herewith.
SIG****NATURES
Pursuant to the requirements of Section 13 or 15(d) of the Securities Exchange Act of 1934, the registrants have duly caused this report to be signed on their behalf by the undersigned, thereunto duly authorized on February 29, 2024.
| Packaging Corporation of America | ||
| /s/ MARK W. KOWLZAN | ||
| Mark W. Kowlzan | ||
| Chairman of the Board and Chief Executive Officer | ||
| Principal Executive Officer | ||
| /s/ ROBERT P. MUNDY | ||
| Robert P. Mundy | ||
| Executive Vice President and Chief Financial Officer | ||
| Principal Financial Officer | ||
| /s/ PAMELA A. BARNES | ||
| Pamela A. Barnes | ||
| Senior Vice President, Finance and Controller | ||
| Principal Accounting Officer |
Pursuant to the requirements of the Securities Exchange Act of 1934, this report has been signed below on February 29, 2024, by the following persons on behalf of the registrants and in the capacities indicated.
| Signature | Capacity | |
| /s/ MARK W. KOWLZAN | ||
| Mark W. Kowlzan | Chairman of the Board and Chief Executive Officer | |
| (Principal Executive Officer) | ||
| /s/ ROBERT P. MUNDY | ||
| Robert P. Mundy | Executive Vice President and Chief Financial Officer | |
| (Principal Financial Officer) | ||
| /s/ PAMELA A. BARNES | Senior Vice President, Finance and Controller | |
| Pamela A. Barnes | (Principal Accounting Officer) | |
| * | ||
| Cheryl K. Beebe | Director | |
| * | ||
| Duane Farrington | Director | |
| * | ||
| Donna A. Harman | Director | |
| * | ||
| Robert C. Lyons | Director | |
| * | ||
| Thomas P. Maurer | Director | |
| * | ||
| Samuel M. Mencoff | Director | |
| * | ||
| Roger B. Porter | Director | |
| * | ||
| Thomas S. Souleles | Director | |
| * | ||
| Paul T. Stecko | Director | |
| /s/ ROBERT P. MUNDY | ||
| Robert P. Mundy | ||
| (Attorney-In-Fact) |