 filings.tools
Packaging Corp of America (PKG) 10-K risk factor changes: FY2023 vs FY2022
The 2023-12-31 10-K against the 2022-12-31 one, compared heading by heading and sentence by sentence.
All filing items837 rewritten240 added219 removed1,687 unchanged
Summary
counted, not written
- Item 1A headings could not be compared: the parser did not find an Item 1A in both filings.
- Sentence by sentence, 240 added, 219 removed, 837 rewritten and 1,687 unchanged across 14 items that differ.
- New this year: Item 1C. CYBERSECURITY.
Sentences by item
22 items, with every count and a link to each item that changed
Underlined words on a shaded ground are new in FY2023; struck-through words were in FY2022. Sentences that are wholly new or wholly gone are labelled rather than marked.
Item 7. MANAGEMENT’S DISCUSSION AND ANALYSIS OF FINANCIAL CONDITION AND RESULTS OF OPERATIONS
174 rewritten, 57 added, 52 removed, 218 unchanged
For our discussion and analysis of our results of operations, financial condition and cash flows for the year ended December 31, [removed: 2020,] [added: 2021,] the earliest of the years presented in the accompanying audited financial statements included in Item 8 herein, please refer to our Annual Report on Form 10-K for the year ended December 31, [removed: 2021,] [added: 2022,] filed with the Securities and Exchange Commission on February [removed: 24, 2022.][added: 23, 2023.]
Such information is presented in Item 7 of such report under the subcaptions “Results of Operations —Year Ended December 31, [removed: 2021,] [added: 2022,] Compared with Year Ended December 31, [removed: 2020”] [added: 2021”] and “Liquidity and Capital Resources” and is incorporated by reference herein.
We operate eight mills and [removed: 89] [added: 86] corrugated products manufacturing plants.
Net sales were [removed: $8.5] [added: $7.8] billion for the year ended December 31, [removed: 2022] [added: 2023] and [removed: $7.7] [added: $8.5] billion for [removed: 2021.][added: 2022.]
We reported [removed: $1,030] [added: $765] million of net income, or [removed: $11.03] [added: $8.48] per diluted share, in [removed: 2022,] [added: 2023,] compared to [removed: $841] [added: $1,030] million, or [removed: $8.83] [added: $11.03] per diluted share, in [removed: 2021.][added: 2022.]
Net income included [removed: $10] [added: $19] million of expense for special items in [removed: 2022,] [added: 2023,] compared to [removed: $53] [added: $10] million of expense for special items in [removed: 2021.][added: 2022.]
Excluding special items, we recorded [removed: $1,040] [added: $784] million of net income, or [removed: $11.14] [added: $8.70] per diluted share, in [removed: 2022,] [added: 2023,] compared to [removed: $894] [added: $1,040] million, or [removed: $9.39] [added: $11.14] per diluted share, in [removed: 2021.][added: 2022.]
The [removed: increase] [added: decrease] was driven primarily by [removed: higher] [added: lower] prices and mix in our Packaging [added: segment] and [removed: Paper segments, partially offset by] lower volumes in our Packaging and Paper segments, [added: partially offset by] higher [added: prices and mix in our Paper segment, lower] operating and converting costs, [removed: higher freight] and [removed: logistic expenses, and higher] [added: lower] annual outage expense.
Reconciliations of Non-GAAP Financial Measures to Reported Amounts.” PCA ended the year with [removed: $470] [added: $1,206] million of cash and marketable debt securities and, including borrowing availability under its revolving credit facility, [removed: $791] [added: $1,529] million in liquidity.
Packaging segment income from operations was [removed: $1,424] [added: $1,074] million in [removed: 2022,] [added: 2023,] compared to [removed: $1,306] [added: $1,424] million for [removed: 2021.][added: 2022.]
Packaging segment EBITDA excluding special items was [removed: $1,849] [added: $1,556] million in [removed: 2022,] [added: 2023,] compared to [removed: $1,688] [added: $1,849] million in [removed: 2021.][added: 2022.]
The [removed: increase] [added: decrease] was driven primarily by [removed: higher] [added: lower] containerboard and corrugated products prices and mix, [removed: partially offset by] lower [removed: sales and production] volumes, [removed: higher operating] and [removed: converting costs,] higher freight and logistic expenses, [added: partially offset by lower operating] and [removed: higher] [added: converting costs and lower] annual outage expense.
Overall, our corrugated products shipments were down [removed: 3.4%] [added: (4.6%)] for the [removed: year as those trends continued through the second half of the] year.
After increasing [removed: throughout 2021 and through] [added: during] the first three quarters of 2022, containerboard prices published by industry publications began to decline during the fourth quarter of [removed: 2022.][added: 2022 and continued to decline throughout 2023.]
Paper segment income from operations was [removed: $103] [added: $119] million in [removed: 2022,] [added: 2023,] compared to [removed: $39] [added: $103] million in [removed: 2021.][added: 2022.]
Paper segment EBITDA excluding special items was [removed: $132] [added: $151] million in [removed: 2022,] [added: 2023,] compared to [removed: $72] [added: $132] million in [removed: 2021.][added: 2022.]
The increase was due primarily to higher paper prices and mix and lower [removed: operating costs,] [added: freight and logistic expenses,] partially offset by lower [removed: sales and production volumes, higher annual outage expense,] [added: volumes] and higher [removed: freight and logistic expenses.][added: operating costs.]
Earnings per diluted share, excluding special items, in [removed: 2022] [added: 2023] and [removed: 2021] [added: 2022] were as follows:
| Earnings per diluted share | | $ | [removed: 11.03] [added: 8.48] | | | $ | [removed: 8.83] [added: 11.03] | |
| Jackson mill conversion-related activities [removed: (a)] [added: (b)] | | [removed: 0.11] | [added: 0.09] | | | [removed: 0.11] | [added: 0.11] | |
| Facilities closure and other costs [removed: (income) (b)] [added: (a)] | | | [removed: 0.01] [added: 0.12] | | | | [removed: (0.03] [added: 0.01] | [removed: )] |
| Acquisition and integration-related activities (c) | | | [removed: (0.01] [added: —] | [removed: )] | | [removed: 0.01] | [added: (0.01] | [added: )] |
| Total special items expense | | | [removed: 0.11] [added: 0.21] | | | | [removed: 0.56] [added: 0.11] | |
| Earnings per diluted share, excluding special items | | $ [added: 8.70 (d)] | [removed: 11.14] | | | $ | [removed: 9.39] [added: 11.14] | |
For [removed: 2022] [added: 2023] and [removed: 2021,] [added: 2022,] includes [removed: $14.1] [added: $11.1] million and [removed: $14.0] [added: $14.1] million, respectively, of charges related to the announced discontinuation of production of uncoated freesheet paper grades on the No. 3 machine at the Jackson, Alabama mill associated with the permanent conversion of the machine to produce linerboard and other paper-to-containerboard conversion related activities.
[removed: For 2022, includes] [added: Includes] $1.0 million of income from a favorable inventory adjustment related to the December 2021 Advance Packaging Corporation acquisition, partially offset by acquisition and integration related costs.
Trade publications reported North American industry-wide corrugated products shipments were down [removed: 3.8%] [added: (5.0%)] during [removed: 2022,] [added: 2023,] compared to [removed: 2021.][added: 2022.]
Reported industry containerboard production decreased [removed: 5.2%] [added: (3.1%)] compared to [removed: 2021,] [added: 2022,] and reported industry containerboard inventories at the end of [removed: 2022] [added: 2023] were approximately [removed: 2.7] [added: 2.6] million tons, down [removed: 2.1%] [added: (3.1%)] compared to [removed: 2021.][added: 2022.]
Reported containerboard export shipments [removed: decreased 7.7%] [added: increased 2.6%] compared to [removed: 2021.][added: 2022.]
[removed: Prices] [added: For corrugating medium, index prices] decreased [added: $30 per ton in January 2023, followed by additional decreases of] $20 per ton [removed: for linerboard and] [added: in February 2023,] $40 per ton [removed: for corrugating medium] in [removed: November, followed by an additional decrease] [added: May 2023, and $20 per ton] in [removed: December] [added: November 2023, a total decrease] of [removed: $20] [added: $110] per ton [removed: each.][added: during 2023.]
Trade publications reported North American uncoated freesheet paper shipments [removed: were flat] [added: decreased (9.7%)] in [removed: 2022,] [added: 2023,] compared to [removed: 2021.][added: 2022.]
For the first quarter of [added: 2024, compared to the fourth quarter of] 2023, in our Packaging [removed: segment] [added: segment,] we expect [added: higher total] corrugated products [added: shipments from continued strong] demand [removed: on a per day basis to be similar to fourth quarter levels, although we expect higher total volume as there are four] [added: along with two] additional shipping days [removed: compared to] [added: in] the [removed: fourth quarter of 2022.][added: first quarter.]
[removed: We] [added: In our Paper segment, we] expect [added: an improved mix to move prices] slightly higher [removed: paper prices on] [added: with] flat sales volume.
Considering these items, we expect first quarter earnings to be lower than the fourth quarter of [removed: 2022.][added: 2023.]
Year Ended December 31, [removed: 2022,] [added: 2023,] Compared with Year Ended December 31, [removed: 2021][added: 2022]
The historical results of operations of PCA for the years ended December 31, [removed: 2022] [added: 2023] and [removed: 2021] [added: 2022] are set forth below (dollars in millions):
| | | [removed: 2022] [added: 2023] | | | | [removed: 2021] [added: 2022] | | | | Change | | |
| Corporate and other and eliminations | | | [removed: 75.2] [added: 71.4] | | | | [removed: 78.0] [added: 75.2] | | | | [removed: (2.8] [added: (3.8] | ) |
| Net sales | | $ | [removed: 8,478.0] [added: 7,802.4] | | | $ | [removed: 7,730.3] [added: 8,478.0] | | | $ | [removed: 747.7] [added: (675.6] | [added: )] |
| Corporate and other | | | [removed: (106.0] [added: (118.1] | ) | | | [removed: (103.7] [added: (106.0] | ) | | | [removed: (2.3] [added: (12.1] | ) |
Packaging volumes were down during the first half of the year as challenging economic conditions continued in 2023, with customers reducing orders to manage their inventories.
Customer ordering patterns began to normalize, and volumes began to improve mid-year, and by the fourth quarter, corrugated shipments were up 6.9% in total over fourth quarter 2022.
In order to match our supply with the demand for our products, we reduced production of containerboard at our packaging mills during the first three quarters of 2023, including idling the Wallula, WA mill in June.
We began ramping up production in the fourth quarter to meet increasing demand and restarted the No. 3 machine at the Wallula mill.
We notified customers of a $70 per ton price increase for linerboard and a $100 per ton price increase for medium effective January 1, 2024.
Lower volumes were driven by declining uncoated freesheet demand and sales of remaining paper at the Jackson, AL mill in 2022.
For 2023, includes $14.4 million of charges related to the closure of corrugated products facilities and design centers, partially offset by a gain on sale of a corrugated products facility.
Amount may not foot due to rounding.
For linerboard, index prices decreased $10 per ton in January 2023, followed by additional decreases of $20 per ton in February 2023, $20 per ton in May 2023, and $20 per ton in November 2023, a total decrease of $70 per ton during 2023.
Although average prices reported by a trade publication for cut size office papers were higher by $57 per ton, or 4%, in 2023 compared to 2022, index prices declined throughout the year.
For cut size office papers, index prices decreased $20 per ton in April 2023, followed by additional decreases of $10 per ton in June 2023 and $20 per ton in October 2023, a total decrease of $50 per ton during 2023.
For offset printing papers, index prices decreased $30 per ton in April 2023, followed by additional decreases of $10 per ton in June 2023, $20 per ton in August 2023, $10 per ton in September 2023, and $15 per ton in November 2023, a total decrease of $85 per ton during 2023.
Containerboard volume is expected to be lower due to a prolonged outage at the Jackson mill for the conversion of the No. 3 machine and a scheduled maintenance outage at our Counce, TN mill.
We have restarted the No. 2 machine at the Wallula mill, which will partially offset the effect of these outages.
Prices and mix should be slightly higher as we implement our January price increases, which will be partially offset by a decrease in the published prices that occurred late in 2023.
We expect export containerboard prices to be flat.
Recycled fiber and energy prices will be higher, and seasonally colder weather will negatively impact usages and yields for energy, wood and chemicals along with higher operating costs associated with the restart of full operations at the Wallula mill compared to fourth quarter operations.
Labor and benefits costs will have seasonal timing-related increases that occur at the beginning of a new year related to annual wage and benefit increases, the restart of payroll taxes, and share-based compensation expenses.
Scheduled outage expenses will be higher and will include the significant first quarter impact of the conversion outage at our Jackson mill.
| Packaging | | $ | 7,135.6 | | | $ | 7,780.7 | | | $ | (645.1 | ) |
| Paper | | | 595.4 | | | | 622.1 | | | | (26.7 | ) |
| Packaging | | $ | 1,074.3 | | | $ | 1,423.7 | | | $ | (349.4 | ) |
| Paper | | | 118.9 | | | | 103.0 | | | | 15.9 | |
Net sales decreased $676 million, or (8.0%), to $7,802 million in 2023, compared to $8,478 million in 2022.
*Paper.* Net sales decreased $27 million, or (4.3%), to $595 million, compared to $622 million in 2022.
Gross profit decreased $392 million in 2023, compared to 2022.
The decrease was primarily due to lower employee-related expenses, outside services, and bad debt expense.
Special items in 2023 included $14 million of expense for corrugated facility closure and other costs.
The decrease in interest expense, net in 2023 was primarily due to higher interest income due to higher rates on invested cash balances compared to 2022.
On November 30, 2023, we issued $400 million of 5.70% senior notes due 2033 through a registered public offering and invested the net proceeds received from this issuance in time deposits, which are included in marketable debt securities.
We intend to use the net proceeds from this issuance, together with a portion of cash on hand, to redeem, repurchase, or otherwise repay at or prior to maturity our outstanding 3.65% senior notes due 2024, which mature on September 15, 2024.
Financial Statements and Supplementary Data” of this Form 10-K as well as information provided below under “—Investing Activities” and “—Financing Activities” for further information.
| | | 2023 | | | | 2022 | | |
a net favorable change in income taxes due to lower tax payments during 2023 compared to 2022;
c)
a net favorable change in accounts payable in 2023 compared to 2022 primarily related to higher production volumes during the last quarter of 2023 compared to 2022.
a net unfavorable change in accrued liabilities in 2023 compared to 2022 primarily related to lower accruals for employee compensation and benefit liabilities and a decrease in customer rebates related to the timing of payments and lower sales volumes in 2023.
Additionally, in November 2023, we invested the net proceeds received from the issuance of our $400 million of 5.70% senior notes due 2033 in time deposits, which are included in marketable debt securities.
| | | 2023 | | | | 2022 | | |
| | | $ | 469.7 | | | $ | 824.2 | |
Packaging volumes remained strong at or above 2021 levels through the middle of the year.
Volume then began to decline as general economic conditions deteriorated and our customers began to reduce their inventories and orders accordingly, which has resulted in lower demand for our products.
In order to achieve appropriate production levels for our demand and necessary inventory levels, we reduced our production of containerboard at our packaging mills during the second half of the year.
We continued to experience cost inflation across our business, including in the areas of labor and benefits, chemicals, energy, repairs, materials, and supplies, as well as higher transportation costs.
The Jackson mill produced only containerboard, and no paper products, during 2022, which drove lower sales and production volumes.
| | | 2022 | | | | 2021 | | |
| Debt refinancing (d) | | | — | | | | 0.47 | |
For 2021, includes $3.6 million of income primarily consisting of an adjustment of the required asset retirement obligation related to the 2020 closure of the San Lorenzo, California facility, a gain on sale of transportation assets and corrugated products facilities, and insurance proceeds received for a natural disaster at one of the corrugated products facilities, partially offset by closure costs related to corrugated products facilities.
For 2021, includes $0.9 million of charges for acquisition and integration costs related to the acquisition.
(d)
Includes $58.9 million of costs related to the Company's debt refinancing completed in October 2021, which included a redemption premium and the write-off of the remaining balance of unamortized debt issuance costs.
Prices reported by trade publications increased by $60 per ton for linerboard and $70 per ton for corrugating medium in March 2022.
In January 2023, prices decreased $10 per ton for linerboard and $30 per ton for corrugating medium.
Average prices reported by a trade publication for cut size office papers increased $40 per ton in February and March 2022, $90 per ton in May 2022, and $65 per ton in September 2022.
The average price was higher by $259, or 22%, in 2022 compared to 2021.
Prices for containerboard and corrugated products are expected to decrease as a result of the recent decreases in the published domestic containerboard prices, and prices for containerboard in export markets are expected to be lower as well.
Labor costs and certain indirect costs will increase as some containerboard mill operations were temporarily idled during the fourth quarter and resumed operations during the first quarter.
In addition, we anticipate higher labor and benefits costs and other timing-related expenses that occur at the beginning of a new year as well as higher prices for many chemicals, particularly starch and caustic soda.
However, we expect lower wood and recycled fiber prices, lower energy prices, and lower scheduled maintenance outage expenses during the first quarter when compared to the fourth quarter of 2022.
Lastly, we expect higher interest and non-operating pension expenses and a higher tax rate, but we expect to benefit on an earnings per share basis from recent share repurchases.
| Packaging | | $ | 7,780.7 | | | $ | 7,052.6 | | | $ | 728.1 | |
| Paper | | | 622.1 | | | | 599.7 | | | | 22.4 | |
| Packaging | | $ | 1,423.7 | | | $ | 1,306.0 | | | $ | 117.7 | |
| Paper | | | 103.0 | | | | 39.1 | | | | 63.9 | |
Net sales increased $748 million, or 9.7%, to $8,478 million in 2022, compared to $7,730 million in 2021.
*Paper.* Net sales increased $22 million, or 3.7%, to $622 million, compared to $600 million in 2021.
Gross profit increased $218 million in 2022, compared to 2021.
The increase was primarily due to higher information technology expenses, outside services, travel, and employee salaries and fringe benefits.
The decrease in interest expense, net in 2022 was primarily due to higher charges ($59 million) in the prior year related to the Company's October 2021 debt refinancing, lower interest rates on the Company's fixed-rate debt ($8 million) as a result of the Company's debt refinancing, higher interest income ($8 million) due to higher rates on invested cash balances, and higher capitalized interest ($4 million) related to the Company's increased levels of capital expenditures in 2022.
The higher effective tax rate for 2022 was primarily due to higher nondeductible employee remuneration paid to covered employees.
an unfavorable change in accounts payable in 2022 compared to 2021 primarily due to lower Packaging production and sales volumes, which resulted in lower purchasing and manufacturing activities in 2022; and
an unfavorable change in our income tax receivables due to higher tax payments in 2022.
During 2021, we acquired Advance Packaging Corporation for $193 million, including a purchase price adjustment based upon net working capital.
| | | $ | 824.2 | | | $ | 605.1 | |
We expect capital investments in 2023 to be approximately $475 million.
In 2021, we issued $700 million of 3.05% Senior Notes due 2051 (the "New Notes"), the proceeds of which were used to redeem $700 million of 4.50% Senior Notes due 2023 in October 2021.
We also paid $8 million of debt issuance costs associated with the 2021 debt refinancing and $1 million of debt issuance costs related to the New Revolving Credit Agreement that was entered into on June 8, 2021.
Financial Statements and Supplementary Data" of this Form 10-K for more information on our approved capital projects with future spending in connection with the expansion and replacement of existing facilities and equipment.
| Natural gas | | | 7.6 | | | | 6.4 | | | | 5.0 | | | | 5.3 | | | | 24.3 | | | $ | 7.17 | |
| Purchased bark | | | 1.6 | | | | 1.7 | | | | 2.0 | | | | 2.1 | | | | 7.4 | | | | 2.36 | |
An excerpt. Shown here: 40 of 174 rewritten, 40 of 57 added and 40 of 52 removed. The counts are complete. For every sentence, read Item 7. MANAGEMENT’S DISCUSSION AND ANALYSIS OF FINANCIAL CONDITION AND RESULTS OF OPERATIONS in the FY2023 filing and the FY2022 filing.
Item 7A. QUANTITATIVE AND QUALITATIVE DISCLOSURES ABOUT MARKET RISK
2 rewritten, 0 added, 0 removed, 4 unchanged
As of December 31, [removed: 2022,] [added: 2023,] we are party to certain physical commodity transactions related to natural gas supply contracts.
At December 31, [removed: 2022,] [added: 2023,] the interest rates on 100% of PCA’s outstanding debt are fixed.
Item 1. BUSINESS
80 rewritten, 21 added, 24 removed, 322 unchanged
We operate eight mills and [removed: 89] [added: 86] corrugated products plants and related facilities.
For segment financial information see Note [removed: 19,] [added: 18,] Segment Information, of the Notes to Consolidated Financial Statements in “Part II, Item 8, Financial Statements and Supplementary Data” of this Form 10-K.
| [removed: Containerboard Production (thousand tons)] | | | 2022 | | | | 1,233 | | | | 1,256 | | | | 1,116 | | | | 961 | | | | 4,566 | |
| [removed: Corrugated Products Shipments (billion square feet)] | | | 2022 | | | | 16.8 | | | | 16.5 | | | | 15.4 | | | | 14.7 | | | | 63.4 | |
| [removed: UFS Production (thousand tons)] | | | 2022 | | | | 126 | | | | 127 | | | | 123 | | | | 130 | | | | 506 | |
[removed: 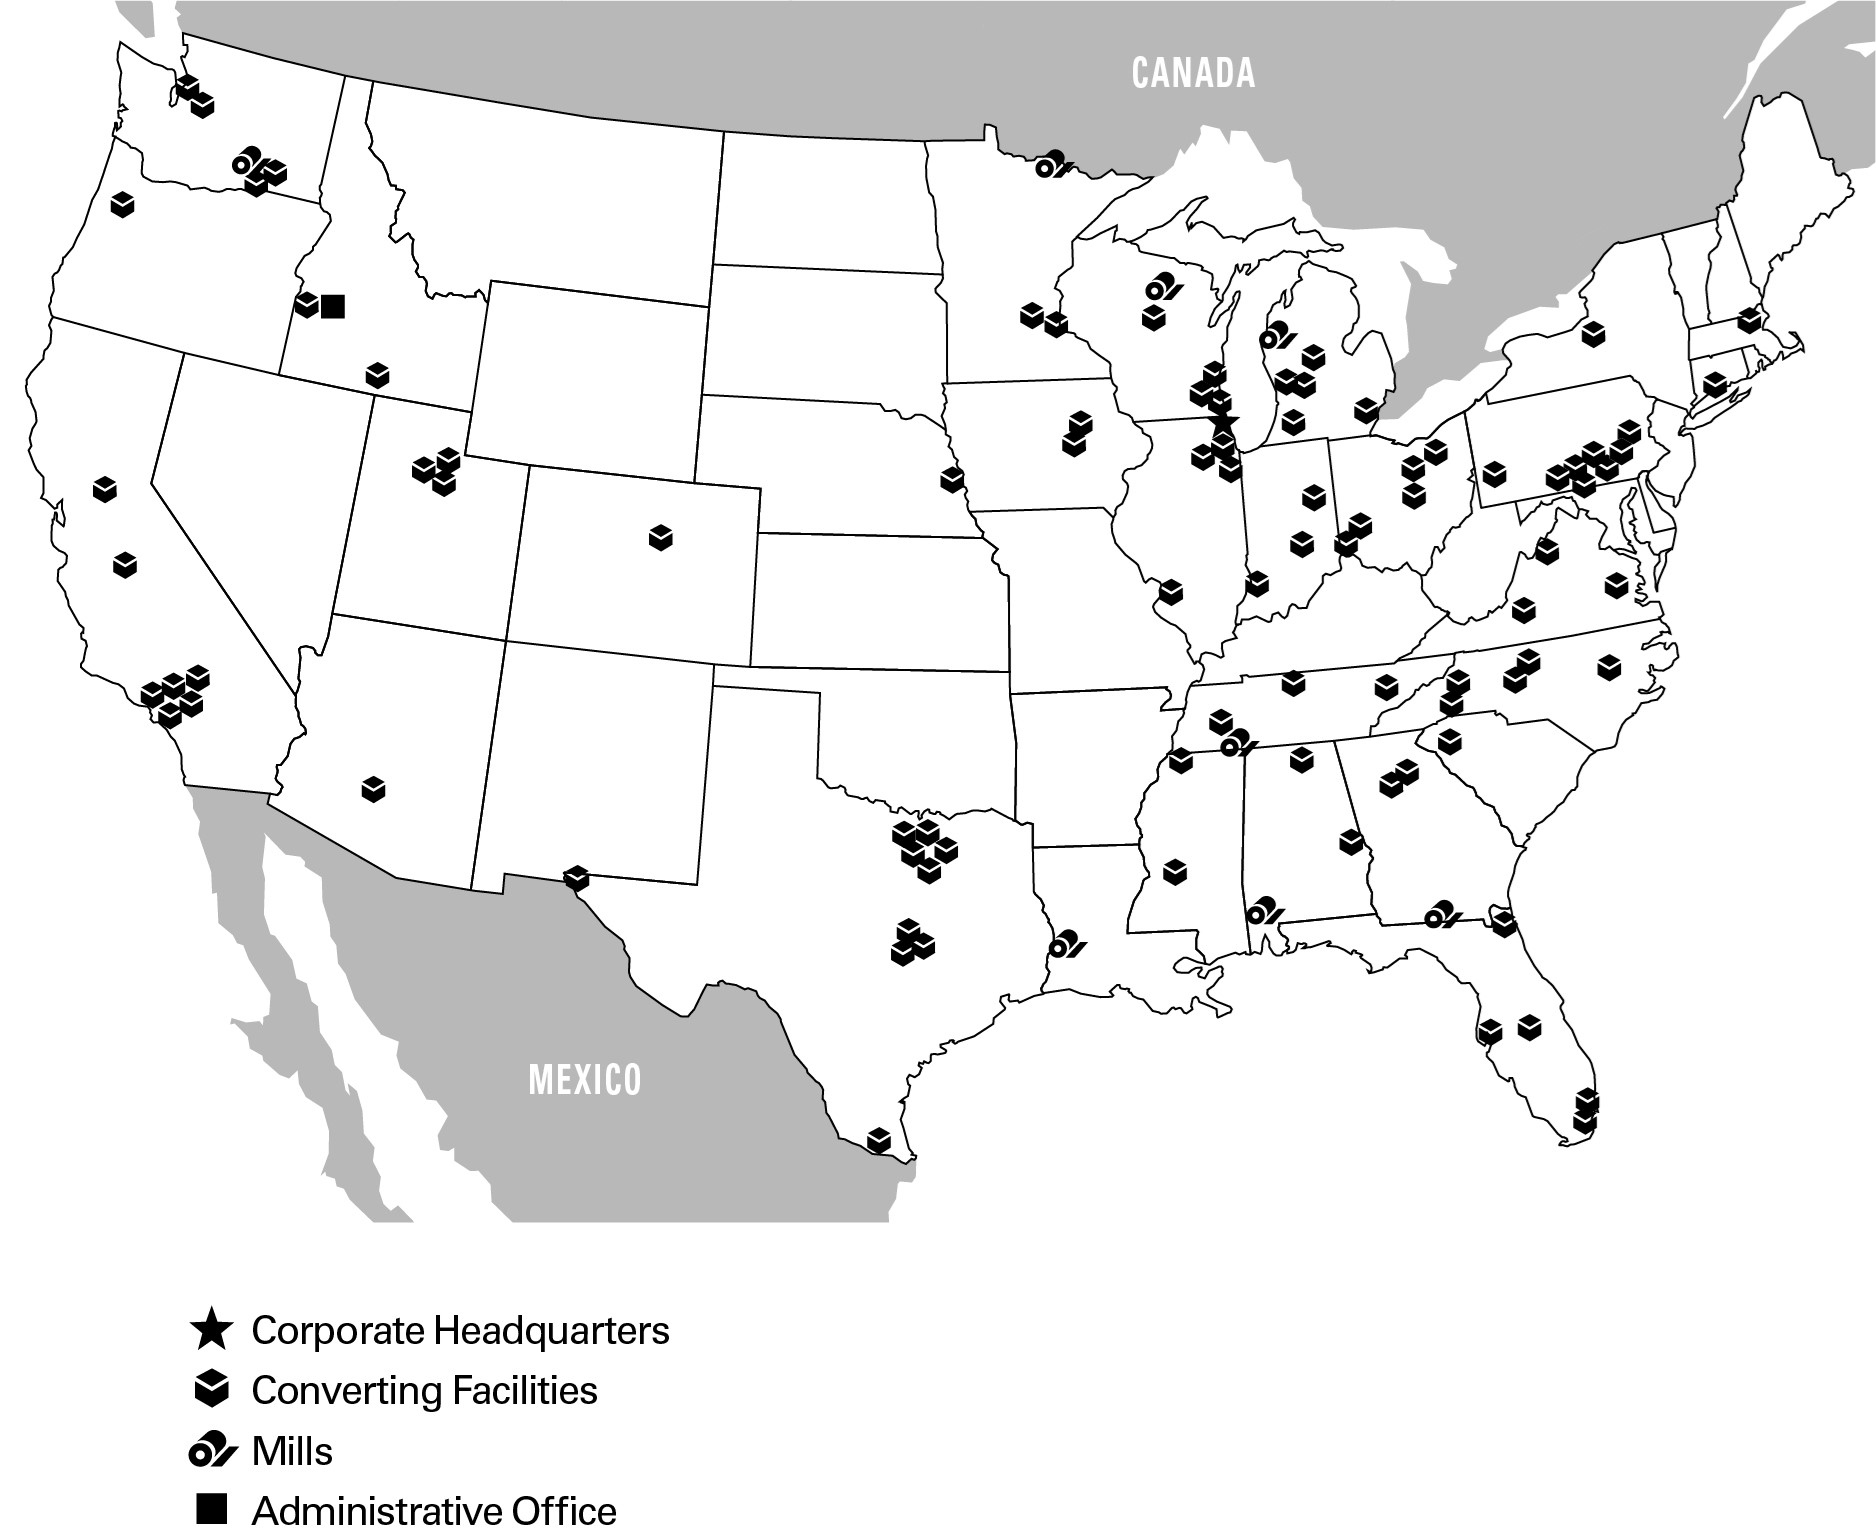][added: 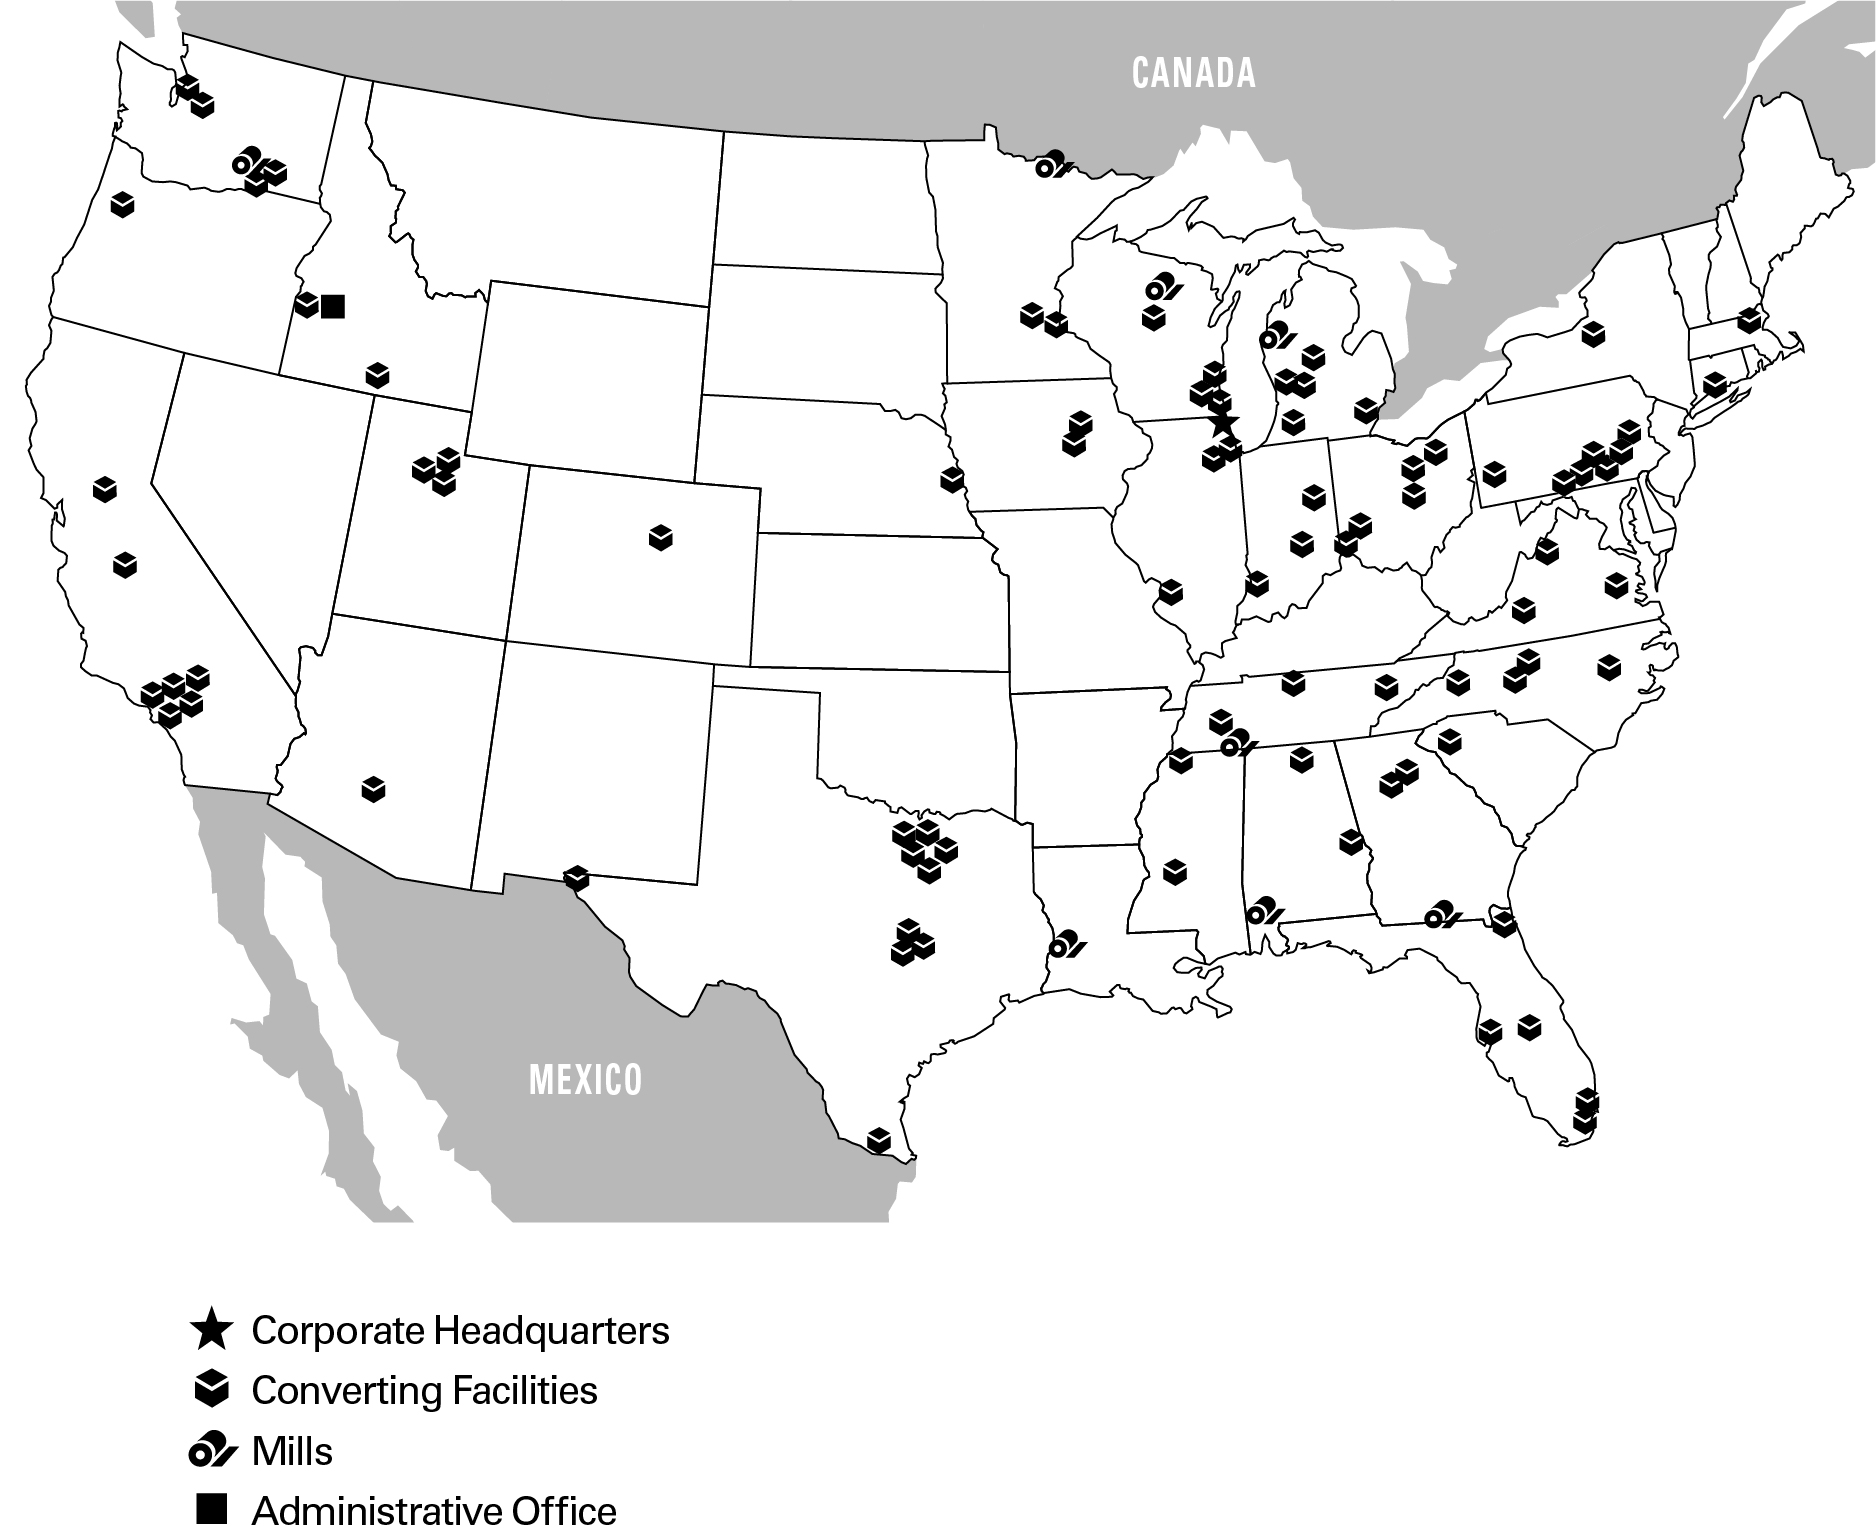]
During the year ended December 31, [removed: 2022,] [added: 2023,] our Packaging segment produced [removed: 4.6] [added: 4.5] million tons of containerboard at our mills.
Our corrugated products manufacturing plants sold [removed: 63.4] [added: 60.5] billion square feet (BSF) of corrugated products.
The Packaging segment’s net sales to third parties totaled [removed: $7.8] [added: $7.1] billion in [removed: 2022.][added: 2023.]
Total annual containerboard capacity was approximately [removed: 5.0] [added: 5.1] million tons as of December 31, [removed: 2022.][added: 2023.]
We also produce corrugated and protective packaging products at [removed: 89] [added: 86] manufacturing locations.
*Wallula.* Our Wallula, Washington mill produces corrugating medium on its No. 2 machine and kraft linerboard [added: and corrugating medium] on its No. 3 machine.
*Jackson.* Our Jackson, Alabama mill produces kraft linerboard on its No. 3 machine and [added: kraft linerboard and] corrugating medium on its No. 1 machine.
As of December 31, [removed: 2022,] [added: 2023,] we operated [removed: 89] [added: 86] corrugated manufacturing and protective packaging operations, a technical and development center, [removed: 10] [added: seven] regional design centers, a rotogravure printing operation, and a complement of packaging supplies and distribution centers.
Of the [removed: 89] [added: 86] manufacturing facilities, 58 are combining operations, commonly called corrugated plants, which manufacture corrugated sheets and finished corrugated packaging products, [removed: 30] [added: 27] are sheet plants, which procure combined sheets and manufacture finished corrugated packaging products, and one is a corrugated sheet-only manufacturer.
In [removed: 2022,] [added: 2023,] our usage of recycled fiber, net of internal generation, represents [removed: 17%] [added: 18%] of our containerboard production.
In [removed: 2022,] [added: 2023,] our packaging mills consumed about [removed: 80] [added: 82] million MMBTUs of fuel to produce both steam and electricity.
Of the [removed: 80] [added: 82] million MMBTUs consumed, about 63% was from mill-generated biogenic fuels that are by-products of our containerboard manufacturing and pulping process and 37% was from purchased fuels.
Of the purchased fuels, [removed: 73%] [added: 71%] was from natural gas, [removed: 25%] [added: 27%] was from purchased wood waste and 2% was from other purchased fuels.
Our corrugated products are delivered by truck due to [removed: our large number] [added: proximity] of [added: our corrugated manufacturing operations to] customers and [removed: their demand for timely service.][added: load size.]
We sell containerboard and corrugated products to approximately [removed: 15,000] [added: 14,000] customers in approximately [removed: 31,000] [added: 30,000] locations.
About [removed: 70%] [added: 70 %] of our corrugated products sales are to regional and local accounts, which are broadly diversified across industries and geographic locations.
The remaining [removed: 30%] [added: 30 %] of our corrugated products customer base consists primarily of national accounts that have multiple locations and are served by a number of PCA plants.
The primary end-use markets in the United States for corrugated products are shown below as reported in the [removed: 2021] [added: 2022] Fibre Box Association annual report:
| Food, beverages, and agricultural products | | | [removed: 48] [added: 42] | % |
| Retail and wholesale trade | | | [removed: 22] [added: 28] | % |
As of December 31, [removed: 2022,] [added: 2023,] we were the third largest producer of containerboard products in North America, according to industry sources and our own estimates.
According to industry sources, corrugated products are produced by about [removed: 445] [added: 400] U.S. companies operating approximately [removed: 1,150] [added: 1,100] plants.
In [removed: 2022,] [added: 2023,] our paper mill consumed about 11 million MMBTUs of fuel to produce both steam and electricity.
Of the 11 million MMBTUs consumed, about [removed: 75%] [added: 76%] was from mill-generated biogenic fuels that are by-products of the manufacturing and pulping process and [removed: 25%] [added: 24%] was from purchased natural gas.
Effective January 1, [removed: 2023,] [added: 2024,] we have [removed: a new] [added: amended the] agreement with ODP in which we will continue to supply commodity and non-commodity office papers through December 31, [removed: 2024.][added: 2025.]
If the agreement is not renewed by the parties, ODP's obligation to purchase paper would phase down over a two-year period beginning January 1, [removed: 2025.][added: 2026.]
In [removed: 2022,] [added: 2023,] our sales revenue to ODP represented [removed: 48%] [added: 61%] of our Paper segment sales revenue and [removed: 4%] [added: 5%] of our consolidated sales revenue.
Our [removed: survey continued to have] [added: last survey, conducted in 2022, had] a high level of participation, assuring us that the [removed: survey] results [removed: are] [added: were] an accurate reflection of the feelings and opinions of our employees.
As of December 31, [removed: 2022,] [added: 2023,] we had approximately [removed: 15,100] [added: 14,900] employees, including [removed: 4,400] [added: 4,300] salaried and [removed: 10,700] [added: 10,600] hourly employees.
Approximately [removed: 61%] [added: 63%] of our hourly employees worked pursuant to collective bargaining agreements.
The majority of our unionized employees are represented by the United Steel Workers (USW), the [removed: International Brotherhood] [added: Printing Packaging Production Workers Union (PPPWU), the Association] of [removed: Teamsters (IBT),] [added: Western Pulp and Paper Workers (AWPPW),] the International Association of Machinists (IAM), and the [removed: Association] [added: International Brotherhood] of [removed: Western Pulp and Paper Workers (AWPPW).][added: Teamsters (IBT).]
During [removed: 2022,] [added: 2023,] we experienced no work stoppages, and we believe we have satisfactory labor relations with our employees.
Brief statements setting forth the age at February [removed: 23, 2023,] [added: 29, 2024,] the principal occupation, employment during the past five years, the year in which such person first became an officer of PCA, and other information concerning each of our executive officers appears below.
Kowlzan, [removed: 67,] [added: 68,] Chairman and Chief Executive Officer - Mr. Kowlzan has served as PCA's Chairman since January 2016 and as Chief Executive Officer and a director since July 2010.
| Containerboard Production (thousand tons) | | | 2023 | | | | 1,086 | | | | 1,112 | | | | 1,118 | | | | 1,213 | | | | 4,529 | |
| Corrugated Products Shipments (billion square feet) | | | 2023 | | | | 14.7 | | | | 14.9 | | | | 15.2 | | | | 15.7 | | | | 60.5 | |
| UFS Production (thousand tons) | | | 2023 | | | | 126 | | | | 116 | | | | 109 | | | | 121 | | | | 472 | |
The production of corrugating medium on the No. 1 machine has continued to date, and consequently, the operating results for the Jackson mill are included in the Packaging segment for the periods presented.
PCA regularly conducts employee engagement surveys to measure our employees’ overall satisfaction as well as gain a better understanding of how to improve our employees’ work experience.
Our employees reaffirmed our strong safety culture, our dedication to being socially and environmentally responsible and responded favorably to questions on diversity, equity and inclusion.
Our overall engagement index, which is in line with other U.S. manufacturing companies, is only one benchmark we consider in measuring employee satisfaction.
Our commitment to continuous improvement means we use employee feedback to foster progress.
Based on our 2022 survey responses, our plants formed action teams to identify and address areas for improvement specific to their location.
We remain committed to seeking feedback from our employees as we work together to continue to make PCA a great place to work.
Our next employee engagement survey will be conducted as scheduled in the first half of 2024.
During the first half of 2023, we experienced a deterioration in operating conditions involving our Packaging business as a result of general economic conditions and lower demand with customers adjusting their ordering patterns to reduce their inventories, which negatively affected our profitability.
However, demand rebounded in the second half of 2023.
The economic outlook for 2024 remains uncertain.
Effective January 1, 2024, we have amended the agreement with ODP in which we will continue to supply commodity and non-commodity office papers through December 31, 2025.
If the agreement is not renewed by the parties, ODP's obligation to purchase paper would phase down over a two-year period beginning January 1, 2026.
U.S. labor market conditions remain tight, and we have, at times, experienced labor shortages and/or higher than historical employee turnover in certain of our facilities.
For further discussion pertaining to cybersecurity strategy and related roles and responsibilities, see “Part I, Item 1C.
Cybersecurity” of this Form 10-K.
For example, the EPA recently enacted more stringent particulate matter emissions standards, which may make it more difficult to obtain or maintain air permits and more difficult and expensive to comply with the limitations set forth in our permits.
We are assessing the impact of these new standards on our business and operations.
| | | | 2020 | | | | 1,047 | | | | 1,072 | | | | 1,048 | | | | 1,174 | | | | 4,341 | |
| | | | 2020 | | | | 15.3 | | | | 15.1 | | | | 16.0 | | | | 16.4 | | | | 62.8 | |
| | | | 2020 | | | | 224 | | | | 148 | | | | 129 | | | | 147 | | | | 648 | |
We experienced higher freight costs in 2022 due to truck and driver shortages and limited boxcar availability, as well as fuel surcharges.
During 2022, we were committed to conducting safe operations through the COVID-19 pandemic in accordance with the guidelines of the Center for Disease Control and applicable health and safety regulations.
PCA has experienced some labor shortage issues due to labor market conditions in general which, earlier in the year, were exacerbated by the pandemic.
To promote employee engagement and improve the work experience of our employees, PCA regularly conducts employee engagement surveys.
In 2022, PCA worked with a new external partner who specializes in developing, administering, and interpreting employee surveys.
With their help, we transitioned our survey to an online format which made it more accessible to our employees.
We also adopted updated methodologies and industry comparisons to measure employee engagement.
According to the survey, PCA’s overall employee engagement level is in line with other U.S. manufacturing companies.
In their survey responses, our employees reaffirmed our strong safety culture, and that they feel the company is socially and environmentally responsible.
For the first time, our survey introduced a question related to Diversity and Inclusion and our employees’ perceptions on this topic were favorable.
In addition, most employees acknowledged that they know what is expected from them and how their work contributes to PCA’s success.
Our next survey is scheduled for early 2024.
During 2022, PCA reached new six-year master labor agreements covering seven mills and 25 container plants.
Beginning in mid-2022, we have experienced a deterioration in operating conditions involving our Packaging business as a result of general economic conditions and our customers lowering their inventories.
This has resulted in lower demand for our containerboard and corrugated products and lower production, which is continuing into 2023 and has negatively affected our profitability.
We may be unable to compete effectively with these companies particularly during economic downturns.
These issues became more pronounced in 2021 and persisted at times during 2022.
Our business was affected by the COVID-19 pandemic and measures to control it during the last three years, which included travel bans and restrictions, quarantines, shelter in place orders, and standards affecting employers such as mask mandates, vaccine mandates, and testing protocols.
PCA experienced some disruptions as a result of labor shortage issues due to the pandemic between 2020 and mid-2022.
The pandemic also disrupted supply chains and transportation services.
U.S. labor market conditions remain tight and labor shortages were exacerbated by the COVID-19 pandemic.
An excerpt. Shown here: 40 of 80 rewritten, all 21 added and all 24 removed. The counts are complete. For every sentence, read Item 1. BUSINESS in the FY2023 filing and the FY2022 filing.
Item 3. LEGAL PROCEEDINGS
1 rewritten, 0 added, 0 removed, 1 unchanged
Information concerning legal proceedings can be found in Note [removed: 20,] [added: 19,] Commitments, Guarantees, Indemnifications, and Legal Proceedings, of the Notes to Consolidated Financial Statements in “Part II, Item 8.
Cover and table of contents
27 rewritten, 2 added, 0 removed, 102 unchanged
For the fiscal year ended December 31, [removed: 2022][added: 2023]
[removed: ][added: ]
Indicate by check mark whether any of those error corrections are restatements that required a recovery analysis of incentive-based compensation received by any of the registrant’s executive [removed: officers] [added: officers] during the relevant recovery period pursuant to §240.10D-1(b).
At June 30, [removed: 2022,] [added: 2023,] the last day of the Registrant's most recently completed second fiscal quarter, the aggregate market value of Registrant's common equity held by non-affiliates was approximately [removed: $12,686,128,813] [added: $11,671,075,503] based upon the closing sale price as reported on the New York Stock Exchange.
On February [removed: 17, 2023,] [added: 23, 2024,] there were [removed: 89,693,421] [added: 89,624,119] shares of Common Stock outstanding.
Specified portions of the Proxy Statement for the Registrant's [removed: 2023] [added: 2024] Annual Meeting of Stockholders are incorporated by reference to the extent indicated in Part III of this Form 10-K.
| Item 1A. | [Risk Factors](#item_1a_risk_factors) | [removed: 11] [added: 10] |
| Item 1B. | [Unresolved Staff Comments](#item_1b_unresolved_staff_comments) | [removed: 16] [added: 15] |
| Item 3. | [Legal Proceedings](#item_3_legal_proceedings) | [removed: 16] [added: 17] |
| Item 4. | [Mine Safety Disclosure](#item_4_mine_safety_disclosure) | [removed: 16] [added: 17] |
| Item 5. | [Market for Registrant's Common Equity, Related Stockholder Matters, and Issuer Purchases of Equity Securities](#item_5_market_for_registrants_common) | [removed: 17] [added: 18] |
| Item 6. | [Selected Financial Data](#item_6_selected_financial_data) | [removed: 18] [added: 19] |
| Item 7. | [Management's Discussion and Analysis of Financial Condition and Results of Operations](#item_7_managements_discussion_analysis_f) | [removed: 19] [added: 20] |
| | [Overview](#overview) | [removed: 19] [added: 20] |
| | [Executive Summary](#executive_summary) | [removed: 19] [added: 20] |
| | [Industry and Business Conditions](#industry_business_conditions) | [removed: 21] [added: 22] |
| | [Results of Operations](#results_operations) | [removed: 21] [added: 23] |
| | [Liquidity and Capital Resources](#liquidity_capital_resources) | [removed: 23] [added: 24] |
| | [Commitments](#commitments) | [removed: 25] [added: 26] |
| | [Off-Balance Sheet Arrangements](#off_balance_sheet_arrangements) | [removed: 25] [added: 27] |
| | [Inflation and Other General Cost Increases](#inflation_or_general_cost_increases) | [removed: 25] [added: 27] |
| | [Regulatory and Environmental [removed: Matters](#em1)] [added: Matters](#environmental_matters)] | [removed: 26] [added: 28] |
| | [Critical Accounting Policies and Estimates](#critical_accounting_policies_estimates) | [removed: 28] [added: 29] |
| | [New and Recently Adopted Accounting Standards](#new_recently_adopted_accounting_stards) | [removed: 29] [added: 30] |
| | [Reconciliations of Non-GAAP Financial Measures to Reported Amounts](#reconciliations_nongaap_financial_measur) | [removed: 29] [added: 31] |
| Item 7A. | [Quantitative and Qualitative Disclosures About Market Risk](#item_7a_quantitative_and_qualitative) | [removed: 31] [added: 32] |
| Item 8. | [Financial Statements and Supplementary Data](#item_8_financial_statements_supplementar) | [removed: 32] [added: 33] |
| Item 1C. | [Cybersecurity](#item_1c_cybersecurity) | 16 |
| | | |
Item 1C. CYBERSECURITY
0 rewritten, 27 added, 0 removed, 0 unchanged
New section this year
Risk Management and Strategy
The Company maintains a cyber risk management program to prevent, detect and respond to information security threats.
This program is supervised by a dedicated Chief Information Security Officer (CISO) whose team is responsible for leading enterprise-wide cybersecurity strategy, policy, standards, architecture and processes.
The CISO manages the program in collaboration with the Company’s businesses and functions.
To mitigate the risk of cybersecurity threats and data breaches we also have established policies and procedures, including a Cybersecurity & Data Breach Incident Response Policy and identified an Incident Response Team (IRT) with defined roles, responsibilities and means of communication.
As part of our broader risk management and control framework we have implemented cybersecurity controls over the information technology and process control systems of the Company and of its third-party service providers.
The Company engages third-party organizations to assess the controls around sensitive data, including but not limited to financial, employee, customer and vendor data as well as data affecting our process controls and data used to operate our manufacturing and converting facilities.
We work with an independent assessor to conduct interim assessments and track ongoing efforts to continuously improve the Company’s cyber risk management program.
The most recent assessment was completed at the end of 2022.
In addition, the Company utilizes an independent audit firm to perform specific attack and penetration reviews on an annual basis.
While we have experienced threats to our data and systems, as of December 31, 2023, we are not aware of any cybersecurity incidents that have materially impacted, or are reasonably likely to materially impact, our operations or financial condition.
Board Roles and Responsibilities
The Audit Committee of the Board of Directors oversees the Company’s cyber risk management program.
The Chief Information Officer (CIO) and the Vice President of Network Services present frequent updates to the Audit Committee and, as necessary, to the full Board of Directors.
These regular reports include detailed updates on the Company’s performance preparing for, preventing, detecting, responding to and recovering from cyber incidents.
In addition, we have established processes to notify the Audit Committee of active incidents, as deemed necessary.
The Company’s program is periodically evaluated by third-party experts, and the results of those reviews are reported to the Board of Directors.
Management Responsibilities
The Incident Response Team that we have established as part of our cyber risk management program coordinates the Company’s response to incidents and communicates with internal and external stakeholders.
The team includes members of our Senior Leadership and draws upon additional staff, consultants, advisors and service providers as needed.
We are continuously focused on ensuring our Company is protected from potential cyber threats.
Our Information Technology (IT) team is comprised of employees with a diverse mix of skills, backgrounds, perspectives, and relevant expertise, that undergo extensive training as part of their employment with the Company.
We believe these measures together with our cyber risk management program as well as our policies, processes and procedures set a high benchmark for our employees to address and respond to cybersecurity threats.
Our IT team regularly monitors best practices and as needed, implements changes to the Company’s cyber risk management program to ensure a robust program is maintained.
Aspects of this program include plans and procedures for identifying, communicating and containing security incidents, regular risk assessments and testing of the Company’s internal infrastructure to identify vulnerabilities, procedures for recovering from disruptions to our operations, maintaining global security policies, and comprehensive end user training and cybersecurity drills for personnel.
See “Part I, Item 1A.
Risk Factors” of this Form 10-K for a discussion of cybersecurity risks.
Item 2. PROPERTIES
3 rewritten, 0 added, 0 removed, 12 unchanged
As of December 31, [removed: 2022,] [added: 2023,] we own buildings and land for our eight mills.
Additionally, we have [removed: 89] [added: 86] corrugated manufacturing operations, of which the buildings and land for 53 are owned, including 45 combining operations, or corrugated plants, one corrugated sheet-only manufacturer, and seven sheet plants.
We lease the buildings for 13 corrugated plants and [removed: 23] [added: 20] sheet plants.
Item 5. MARKET FOR REGISTRANT’S COMMON EQUITY, RELATED STOCKHOLDER MATTERS, AND ISSUER PURCHASES OF EQUITY SECURITIES
10 rewritten, 5 added, 17 removed, 18 unchanged
PCA’s common stock is listed on the New York Stock Exchange (NYSE) under the symbol [removed: “PKG”.][added: “PKG.”]
On February [removed: 17, 2023,] [added: 23, 2024,] there were [removed: 142] [added: 140] holders of record of our common stock.
During the third and fourth quarters of 2022, we paid [removed: $523] [added: $522.6] million, including fees, to repurchase 4.0 million shares of common stock.
At December 31, [removed: 2022, $477] [added: 2023, $436.0] million of the authorized amount remained available for repurchase of the [removed: Company's] [added: Company’s] common stock.
During the fourth quarter of 2021, we paid [removed: $193] [added: $193.0] million, including fees, to repurchase 1.4 million shares of common stock, which was the entire remaining amount of repurchase authority we had under previously announced share repurchase programs.
We withheld [removed: 110,827] [added: 120,534] shares in [removed: 2022] [added: 2023] to cover [removed: $15.4] [added: $15.7] million in employee tax liabilities, [removed: 95,437] [added: 110,827] shares in [removed: 2021] [added: 2022] to cover [removed: $12.9] [added: $15.4] million in employee tax liabilities, and [removed: 107,627] [added: 95,437] shares in [removed: 2020] [added: 2021] to cover [removed: $10.5] [added: $12.9] million in employee tax liabilities.
[removed: The following table presents information related to our] [added: During the three months ended December 31, 2023, there were no] repurchases of common stock made under repurchase plans authorized by [removed: PCA's] [added: PCA’s] Board of [removed: Directors,] [added: Directors] and [added: no] shares withheld [added: from employees] to cover [added: income and payroll] taxes on [removed: vesting of] equity [removed: awards, during the three months ended December 31, 2022:][added: awards that vested.]
The graph tracks the performance of a $100 investment (including the reinvestment of all dividends) in our common stock, in each index, and in each peer [removed: group's] [added: group’s] common stock from December 31, [removed: 2017] [added: 2018] through December 31, [removed: 2022.][added: 2023.]
[removed: 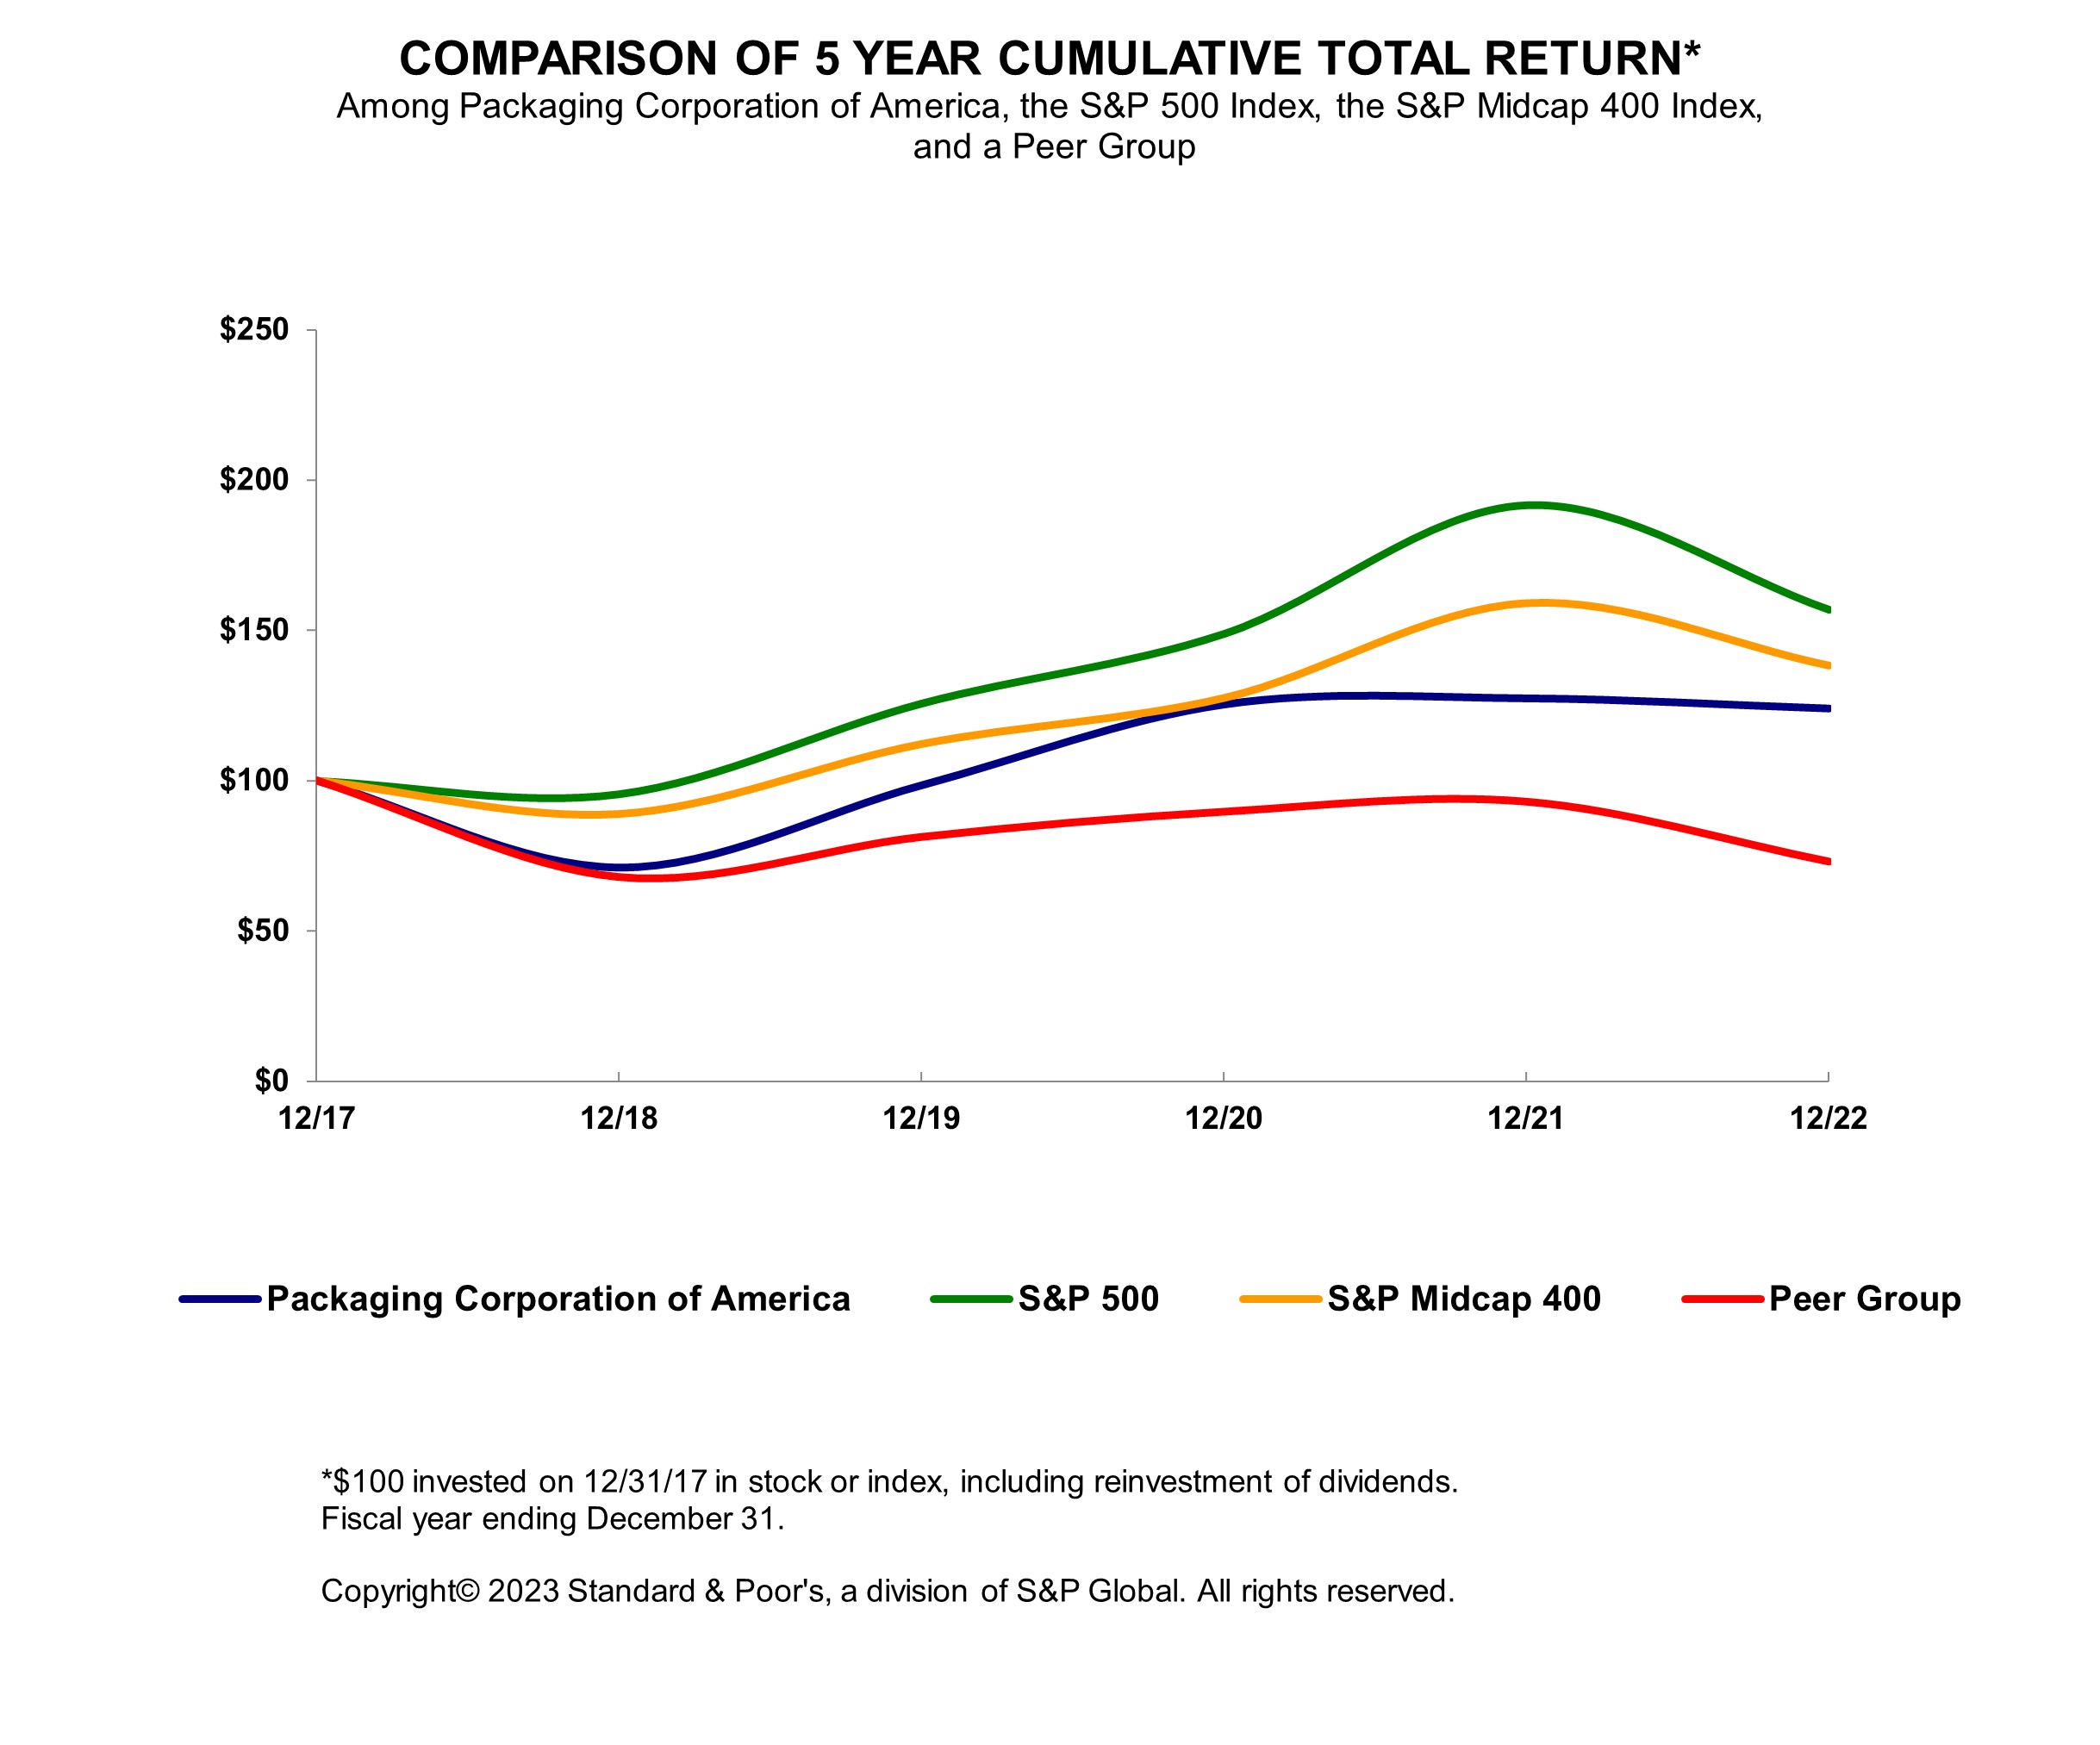][added: 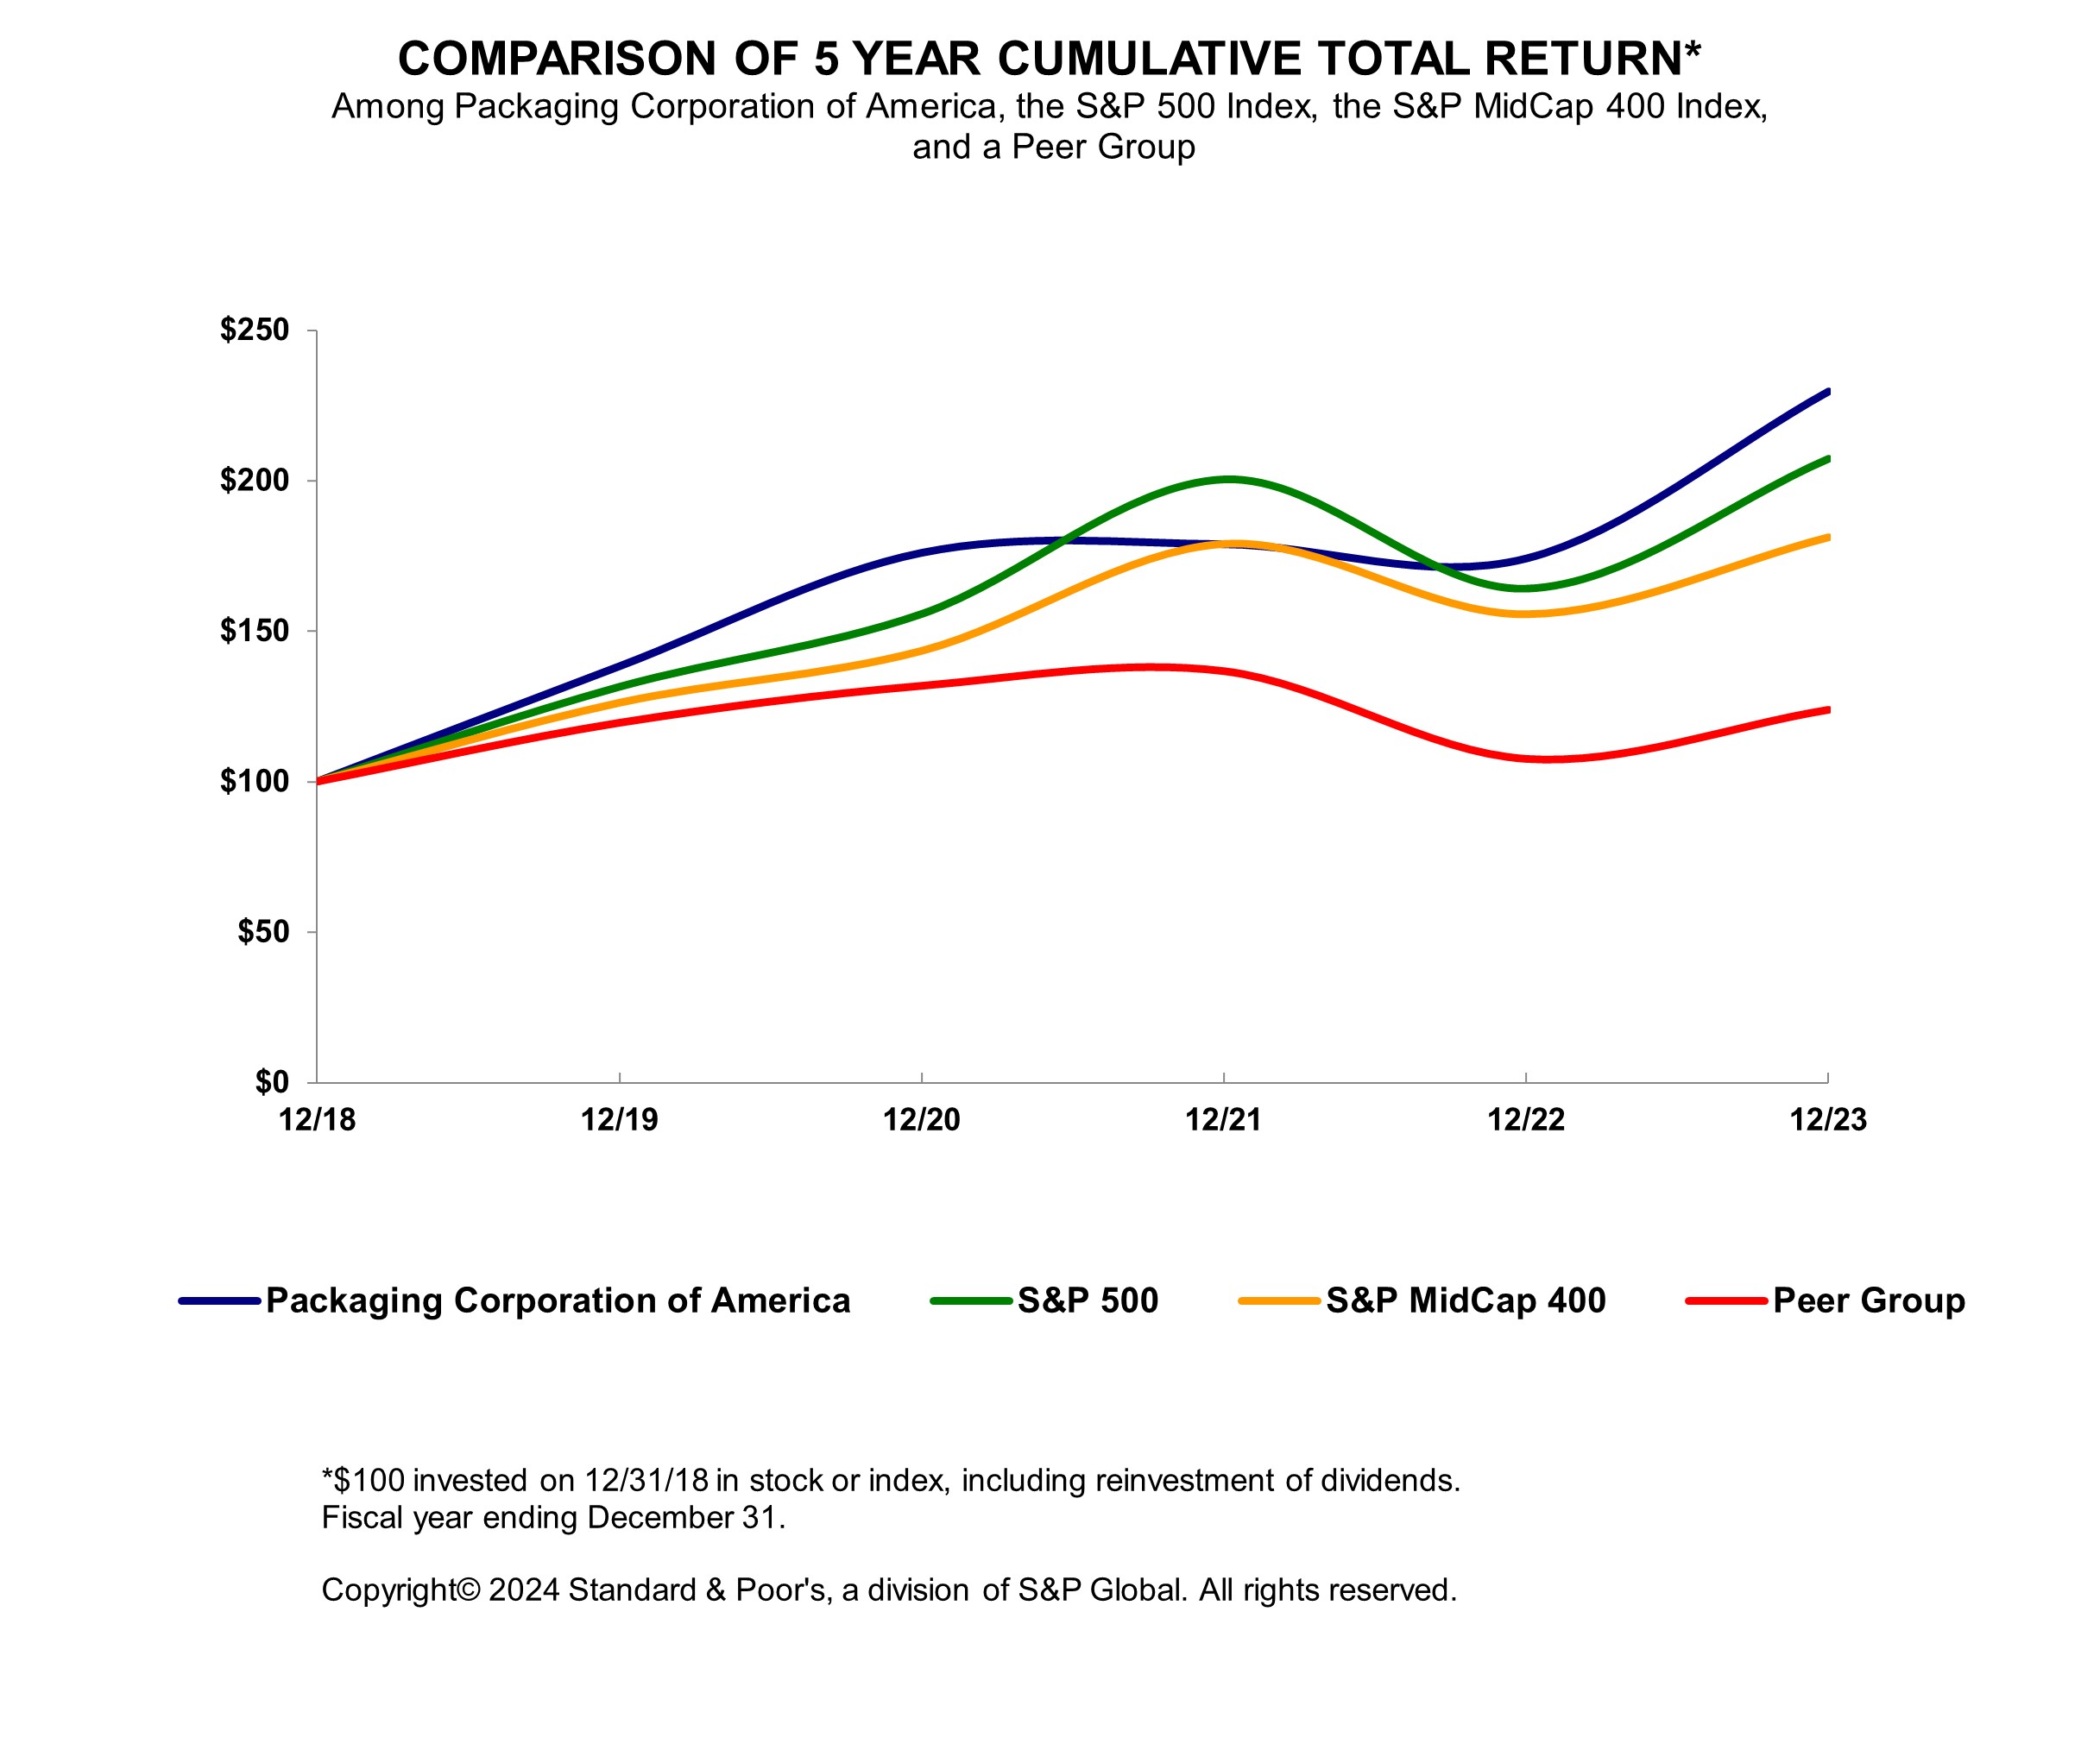]
| | | [removed: 2017 | | | |] 2018 | | | | 2019 | | | | 2020 | | | | 2021 | | | | 2022 | | | [added: | 2023 | | |]
During the third quarter of 2023, we paid $41.5 million, including fees, to repurchase 0.3 million shares of common stock.
| Packaging Corporation of America | | $ | 100.00 | | | $ | 138.35 | | | $ | 176.07 | | | $ | 178.90 | | | $ | 174.18 | | | $ | 229.71 | |
| S&P 500 | | | 100.00 | | | | 131.49 | | | | 155.68 | | | | 200.37 | | | | 164.08 | | | | 207.21 | |
| S&P Midcap 400 | | | 100.00 | | | | 126.20 | | | | 143.44 | | | | 178.95 | | | | 155.58 | | | | 181.15 | |
| Peer Group | | | 100.00 | | | | 119.60 | | | | 131.91 | | | | 136.81 | | | | 107.55 | | | | 123.93 | |
The Company did not repurchase any shares of its common stock during the year ended December 31, 2020.
| | | | | | | | | | | | | | | | | | |
| --- | --- | --- | --- | --- | --- | --- | --- | --- | --- | --- | --- | --- | --- | --- | --- | --- | --- |
| Issuer Purchases of Equity Securities | | | | | | | | | | | | | | | | | |
| Period | | Total Number of Shares Purchased (a) | | | | | Average Price Paid Per Share (b) | | | | Total Number of Shares Purchased as Part of Publicly Announced Plans or Programs | | | | Approximate Dollar Value of Shares That May Yet Be Purchased Under the Plans or Programs (in millions) | | |
| October 1-31, 2022 | | | 333,321 | | | | $ | 118.83 | | | | 333,200 | | | $ | 818.4 | |
| November 1-30, 2022 | | | 2,073,127 | | | | | 125.70 | | | | 2,073,127 | | | | 557.8 | |
| December 1-31, 2022 | | | 597,185 | | | | | 134.59 | | | | 596,700 | | | | 477.5 | |
| Total | | | 3,003,633 | | | | $ | 126.70 | | | | 3,003,027 | | | $ | 477.5 | |
(a)
Includes 606 shares withheld from employees to cover income and payroll taxes on equity awards that vested during the period.
(b)
Excludes commissions.
| Packaging Corporation of America | | $ | 100.00 | | | $ | 71.14 | | | $ | 98.42 | | | $ | 125.25 | | | $ | 127.27 | | | $ | 123.91 | |
| S&P 500 | | | 100.00 | | | | 95.62 | | | | 125.72 | | | | 148.85 | | | | 191.58 | | | | 156.89 | |
| S&P Midcap 400 | | | 100.00 | | | | 88.92 | | | | 112.21 | | | | 127.54 | | | | 159.12 | | | | 138.34 | |
| Peer Group | | | 100.00 | | | | 67.94 | | | | 81.26 | | | | 89.63 | | | | 92.95 | | | | 73.08 | |
Item 8. FINANCIAL STATEMENTS AND SUPPLEMENTARY DATA
518 rewritten, 123 added, 119 removed, 817 unchanged
| [Reports of Independent Registered Public Accounting Firm (KPMG LLP, Chicago, IL, Auditor Firm ID: 185)](#report_independent_registered_public_acc) | [removed: 33] [added: 34] |
| [Consolidated Statements of Income and Comprehensive Income for the years ended December 31, [added: 2023,] 2022, [removed: 2021,] and [removed: 2020](#consolidated_statements_income_comprehen)] [added: 2021](#consolidated_statements_income_comprehen)] | [removed: 35] [added: 36] |
| [Consolidated Balance Sheets as of December 31, [removed: 2022] [added: 2023] and [removed: 2021](#consolidated_balance_sheets)] [added: 2022](#consolidated_balance_sheets)] | [removed: 36] [added: 37] |
| [Consolidated Statements of Cash Flows for the years ended December 31, [added: 2023,] 2022, [removed: 2021,] and [removed: 2020](#consolidated_statements_cash_flows)] [added: 2021](#consolidated_statements_cash_flows)] | [removed: 37] [added: 38] |
| [Consolidated Statement of Changes in Stockholders' Equity for the years ended December 31, [added: 2023,] 2022, [removed: 2021,] and [removed: 2020](#consolidated_statements_changes_in_stock)] [added: 2021](#consolidated_statements_changes_in_stock)] | [removed: 38] [added: 39] |
| [Notes to Consolidated Financial Statements](#notes_to_consolidated_financial_statemen) | [removed: 39] [added: 40] |
We have audited the accompanying consolidated balance sheets of Packaging Corporation of America and subsidiaries (the Company) as of December 31, [removed: 2022] [added: 2023] and [removed: 2021,] [added: 2022,] the related consolidated statements of income and comprehensive income, changes in stockholders’ equity, and cash flows for each of the years in the three-year period ended December 31, [removed: 2022,] [added: 2023,] and the related notes (collectively, the consolidated financial statements).
We also have audited the Company’s internal control over financial reporting as of December 31, [removed: 2022,] [added: 2023,] based on criteria established in [removed: Internal] [added: *Internal] Control – Integrated Framework [removed: (2013)] [added: (2013)*] issued by the Committee of Sponsoring Organizations of the Treadway Commission.
In our opinion, the consolidated financial statements referred to above present fairly, in all material respects, the financial position of the Company as of December 31, [removed: 2022] [added: 2023] and [removed: 2021,] [added: 2022,] and the results of its operations and its cash flows for each of the years in the three-year period ended December 31, [removed: 2022,] [added: 2023,] in conformity with U.S. generally accepted accounting principles.
Also in our opinion, the Company maintained, in all material respects, effective internal control over financial reporting as of December 31, [removed: 2022] [added: 2023] based on criteria established in [removed: Internal] [added: *Internal] Control – Integrated Framework [removed: (2013)] [added: (2013)*] issued by the Committee of Sponsoring Organizations of the Treadway Commission.
As discussed in [removed: Note 13] [added: Notes 2 and 12] to the consolidated financial statements, the Company’s estimated pension benefit obligation totaled [removed: $1,167] [added: $1,202] million as of December 31, [removed: 2022.][added: 2023.]
| | | [removed: 2022] [added: 2023] | | | | [removed: 2021] [added: 2022] | | | | [removed: 2020] [added: 2021] | | |
| Net sales | | $ | [removed: 8,478.0] [added: 7,802.4] | | | $ | [removed: 7,730.3] [added: 8,478.0] | | | $ | [removed: 6,658.2] [added: 7,730.3] | |
| Cost of sales | | | [removed: (6,387.4] [added: (6,103.5] | ) | | | [removed: (5,857.3] [added: (6,387.4] | ) | | | [removed: (5,288.8] [added: (5,857.3] | ) |
| Gross profit | | | [removed: 2,090.6] [added: 1,698.9] | | | | [removed: 1,873.0] [added: 2,090.6] | | | | [removed: 1,369.4] [added: 1,873.0] | |
| Selling and administrative expenses | | | [removed: (608.6] [added: (580.9] | ) | | | [removed: (576.8] [added: (608.6] | ) | | | [removed: (539.6] [added: (576.8] | ) |
| Other expense, net | | | [removed: (61.3] [added: (42.9] | ) | | | [removed: (54.8] [added: (61.3] | ) | | | [removed: (50.7] [added: (54.8] | ) |
| Income from operations | | | [removed: 1,420.7] [added: 1,075.1] | | | | [removed: 1,241.4] [added: 1,420.7] | | | | [removed: 723.9] [added: 1,241.4] | |
| Non-operating pension [added: (expense)] income | | | [removed: 14.5] [added: (7.7] | [added: )] | | | [removed: 19.7] [added: 14.5] | | | | [removed: 2.3] [added: 19.7] | |
| Interest expense, net | | | [removed: (70.4] [added: (53.3] | ) | | | [removed: (152.4] [added: (70.4] | ) | | | [removed: (93.5] [added: (152.4] | ) |
| Income before taxes | | | [removed: 1,364.8] [added: 1,014.1] | | | | [removed: 1,108.7] [added: 1,364.8] | | | | [removed: 632.7] [added: 1,108.7] | |
| Provision for income taxes | | | [removed: (335.0] [added: (248.9] | ) | | | [removed: (267.6] [added: (335.0] | ) | | | [removed: (171.7] [added: (267.6] | ) |
| Net income | | $ | [removed: 1,029.8] [added: 765.2] | | | $ | [removed: 841.1] [added: 1,029.8] | | | $ | [removed: 461.0] [added: 841.1] | |
| Basic | | $ | [removed: 11.08] [added: 8.52] | | | $ | [removed: 8.87] [added: 11.08] | | | $ | [removed: 4.86] [added: 8.87] | |
| Diluted | | $ | [removed: 11.03] [added: 8.48] | | | $ | [removed: 8.83] [added: 11.03] | | | $ | [removed: 4.84] [added: 8.83] | |
| Dividends declared per common share | | $ | [removed: 4.75] [added: 5.00] | | | $ | [removed: 4.00] [added: 4.75] | | | $ | [removed: 3.37] [added: 4.00] | |
| Other comprehensive [removed: (loss) income,] [added: income (loss),] net of tax: | | | | | | | | | | | | |
| Foreign currency translation adjustment | | $ | [removed: —] [added: 0.1] | | | $ | [removed: 0.4] [added: —] | | | $ | [removed: —] [added: 0.4] | |
| Changes in unrealized [removed: (losses)] gains [added: (losses)] on marketable debt securities, net of tax of [removed: $0.5] [added: ($0.6)] million, [removed: $0.2] [added: $0.5] million, and [removed: ($0.1)] [added: $0.2] million for [added: 2023,] 2022, [removed: 2021,] and [removed: 2020,] [added: 2021,] respectively | | | [removed: (1.7] [added: 1.8] | [removed: )] | | | [removed: (0.5] [added: (1.7] | ) | | | [removed: 0.3] [added: (0.5] | [added: )] |
| Amortization of pension and postretirement plans actuarial loss and prior service cost, net of tax of [removed: ($1.5)] [added: ($2.1)] million, [removed: ($3.3)] [added: ($1.5)] million, and [removed: ($3.6)] [added: ($3.3)] million for [added: 2023,] 2022, [removed: 2021,] and [removed: 2020,] [added: 2021,] respectively | | | [removed: 4.7] [added: 6.4] | | | | [removed: 10.0] [added: 4.7] | | | | [removed: 10.7] [added: 10.0] | |
| Changes in unfunded employee benefit obligations, net of tax of [removed: $10.1] [added: ($7.8)] million, [removed: ($19.9)] [added: $10.1] million, and [removed: ($1.3)] [added: ($19.9)] million for [added: 2023,] 2022, [removed: 2021,] and [removed: 2020,] [added: 2021,] respectively | | | [removed: (30.2] [added: 23.2] | [removed: )] | | | [removed: 59.4] [added: (30.2] | [added: )] | | | [removed: 4.0] [added: 59.4] | |
| Other comprehensive [removed: (loss)] income [added: (loss)] | | | [removed: (27.2] [added: 31.5] | [removed: )] | | | [removed: 69.3] [added: (27.2] | [added: )] | | | [removed: 15.0] [added: 69.3] | |
| Comprehensive income | | $ | [removed: 1,002.6] [added: 796.7] | | | $ | [removed: 910.4] [added: 1,002.6] | | | $ | [removed: 476.0] [added: 910.4] | |
| | | [added: 2023 | | | |] 2022 | | | | 2021 | | |
| Cash and cash equivalents | | $ | [removed: 320.0] [added: 648.0] | | | $ | [removed: 618.7] [added: 320.0] | |
| [removed: Short-term] [added: Long-term] marketable debt securities | | | [removed: 85.2] [added: 64.1] | | | | [removed: 86.1] [added: 64.9] | |
| Accounts receivable, net of allowance for credit losses and customer deductions of [removed: $19.6] [added: $13.1] million and [removed: $14.3] [added: $19.6] million as of December 31, [removed: 2022] [added: 2023] and [removed: 2021,] [added: 2022,] respectively | | | [removed: 1,031.8] [added: 1,033.2] | | | | [removed: 1,071.0] [added: 1,031.8] | |
| Inventories | | | [removed: 977.3] [added: 1,013.1] | | | | [removed: 902.5] [added: 977.3] | |
| Prepaid expenses and other current assets | | | [removed: 58.3] [added: 62.3] | | | | [removed: 47.0] [added: 58.3] | |
| Federal and state income taxes receivable | | | [removed: 35.7] [added: 4.3] | | | | [removed: 7.4] [added: 35.7] | |
| | February 29, 2024 |
| Net income | | $ | 765.2 | | | $ | 1,029.8 | | | $ | 841.1 | |
| | | 2023 | | | | 2022 | | |
| Short-term marketable debt securities ($93.5 million and $85.2 million measured at fair value as of December 31, 2023 and 2022, respectively) | | | 493.5 | | | | 85.2 | |
| Current maturities of long-term debt | | $ | 399.6 | | | $ | — | |
| Net income | | $ | 765.2 | | | $ | 1,029.8 | | | $ | 841.1 | |
| Purchases of held-to-maturity debt securities | | | (400.0 | ) | | | — | | | | — | |
| Common stock repurchases and retirements | | | (286 | ) | | | — | | | | (2.5 | ) | | | (39.0 | ) | | | — | | | | | (41.5 | ) |
| Share-based compensation and other | | | 337 | | | | — | | | | 41.9 | | | | — | | | | — | | | | | 41.9 | |
| Comprehensive income | | | — | | | | — | | | | — | | | | 765.2 | | | | 31.5 | | | | | 796.7 | |
| Balance at December 31, 2023 | | | 89,625 | | | $ | 0.9 | | | $ | 620.1 | | | $ | 3,447.2 | | | $ | (70.9 | ) | | | $ | 3,997.3 | |
The production of corrugating medium on the No.1 machine has continued to date, and consequently, the operating results for the Jackson mill are included in the Packaging segment for the periods presented.
In these consolidated financial statements, certain amounts in prior periods' consolidated financial statements have been reclassified to conform with the current period presentation.
The Company also has time deposits classified and accounted for as held-to-maturity (HTM) investments, as we have the intent and ability to hold these investments to maturity.
The Company reports its AFS marketable debt securities at fair value and held-to-maturity investments at amortized cost, which approximates fair value.
| | | 2023 | | | | 2022 | | |
| | | 2023 | | | | 2022 | | |
At December 31, 2023 and December 31, 2022, purchases of property, plant, and equipment included in accounts payable were $24.2 million and $43.7 million, respectively.
At December 31, 2023, deferred debt issuance costs were $19.9 million, of which $0.3 million was recorded in “Current maturities of long-term debt” and $19.6 million was recorded in “Long-term debt” on our Consolidated Balance Sheets.
ASU 2021-08 requires contract assets and contract liabilities acquired in a business combination to be recognized and measured by the acquirer on the acquisition date in accordance with ASC 606, *Revenue from Contracts with Customers*.
Effective April 1, 2023, we adopted ASU 2020-04, *Reference Rate Reform* (Topic 848): *Facilitation of the Effects of Reference Rate Reform on Financial Reporting*.
The Company's fixed-rate outstanding debt will not be impacted by the reference rate reform.
In April 2023, we amended our Senior Unsecured Credit Agreement to formally replace the LIBOR benchmark rate with the Term SOFR rate.
In December 2023, the FASB issued ASU 2023-09, *Income Taxes* (Topic 740): *Improvement to the Income Tax Disclosures.* This ASU provides for more transparency about income tax information through improvements to income tax disclosures primarily related to the rate reconciliation and income taxes paid information.
This ASU is effective for fiscal years beginning after December 15, 2024 on a prospective basis.
Early adoption is permitted.
The Company is currently assessing the impact of the disclosure requirements on its consolidated financial statements.
In November 2023, the FASB issued ASU 2023-07, *Segment Reporting* (Topic 280): *Improvements to Reportable Segment Disclosures*.
This ASU improves reportable segment disclosure requirements, primarily through enhanced disclosures about significant segment expenses.
This ASU is effective for fiscal years beginning after December 15, 2023 and interim periods starting within fiscal years beginning after December 15, 2024 on a retrospective basis.
Early adoption is permitted.
The Company is currently assessing the impact of the disclosure requirements on its consolidated financial statements.
| | 2023 | | | | 2022 | | |
| | 2023 | | | | 2022 | | |
| | 2023 | | | | 2022 | | |
| 2028 | | | 22.4 | | | | 1.8 | |
| Thereafter | | | 39.4 | | | | — | |
| Net income | | $ | 765.2 | | | $ | 1,029.8 | | | $ | 841.1 | |
For 2023, includes charges consisting of closure costs related to corrugated products facilities and design centers, partially offset by a gain on sale of a corrugated products facility.
| Total | | $ | 16.4 | | | $ | 0.2 | | | $ | — | | | $ | 16.6 | |
| | February 23, 2023 |
| | | | | | | | | | | | | |
| --- | --- | --- | --- | --- | --- | --- | --- | --- | --- | --- | --- | --- |
| Goodwill impairment | | | — | | | | — | | | | (55.2 | ) |
| Long-term marketable debt securities | | | 64.9 | | | | 60.0 | |
| Goodwill impairment | | | — | | | | — | | | | 55.2 | |
| Balance at January 1, 2020 | | | 94,655 | | | $ | 0.9 | | | $ | 524.8 | | | $ | 2,704.8 | | | $ | (159.5 | ) | | | $ | 3,071.0 | |
| Share-based compensation | | | 283 | | | | — | | | | 30.8 | | | | — | | | | — | | | | | 30.8 | |
| Comprehensive income | | | — | | | | — | | | | — | | | | 461.0 | | | | 15.0 | | | | | 476.0 | |
| Other | | | — | | | | — | | | | (0.4 | ) | | | (0.3 | ) | | | — | | | | | (0.7 | ) |
Beginning in October 2020, operating results for the Jackson mill are included in both the Packaging and Paper segments.
During the fourth quarter of 2020, in order to meet strong packaging demand and maintain appropriate inventory levels, we temporarily began producing linerboard on the No. 3 machine at our Jackson, Alabama mill.
| | | |
| --- | --- | --- |
In 2022, 2021, and 2020, we recognized incremental depreciation expense of $5.7 million, $4.7 million, and $4.5 million, respectively.
For 2020, the incremental depreciation expense related to closures of corrugated products facilities.
In the second quarter of 2020, we recorded an impairment to write off the remaining goodwill balance associated with our Paper segment.
ASC 805 requires separate recognition of assets acquired and liabilities assumed from goodwill at the acquisition date fair values.
The Company did not adopt any new accounting standards during 2022.
The ASU is effective for annual periods beginning after December 15, 2022, and interim periods within those annual periods, with early adoption permitted.
While the Company's fixed-rate outstanding debt will not be impacted by the reference rate reform, the Company is still evaluating the impact of this guidance on its revolving credit facility, as the interest rate associated with any future borrowings against the revolving credit facility is based on LIBOR.
There were no other accounting standards recently issued that had or are expected to have a material impact on our financial position or results of operations.
| 2023 | | $ | 81.2 | | | $ | 2.7 | |
| Thereafter | | | 52.3 | | | | 1.8 | |
Acquisitions
Advance Packaging Acquisition
On December 11, 2021, PCA acquired the assets of Advance Packaging Corporation ("Advance Packaging"), an independent corrugated products producer, for $194.9 million, including working capital adjustments.
Assets acquired include full-line corrugated products operations in Grand Rapids, Michigan.
Advance Packaging is a full-service producer of corrugated packaging products, including graphics, retail displays, sustainable shipping containers, and protective packaging.
Advance Packaging's financial results are included in the Packaging segment from the date of acquisition.
During the second quarter of 2022, we received $1.9 million from the seller related to a final working capital adjustment.
We recorded the adjustment as a decrease to goodwill, which decreased the purchase price to $193.0 million.
The Company accounted for the Advance Packaging acquisition using the acquisition method of accounting in accordance with ASC 805, *Business Combinations*.
The total purchase price has been allocated to tangible and intangible assets acquired and liabilities assumed based on respective fair values, as follows (dollars in millions):
| | | 12/31/2021 Allocation | | | | Adjustments | | | | Revised Allocation | | |
| Goodwill | | $ | 60.0 | | | $ | (1.0 | ) | | $ | 59.0 | |
| Other intangible assets | | | 50.2 | | | | (1.4 | ) | | | 48.8 | |
| Other net assets | | | 18.0 | | | | — | | | | 18.0 | |
| Net assets acquired | | $ | 194.9 | | | $ | (1.9 | ) | | $ | 193.0 | |
Goodwill is calculated as the excess of the purchase price over the fair value of the net assets acquired.
An excerpt. Shown here: 40 of 518 rewritten, 40 of 123 added and 40 of 119 removed. The counts are complete. For every sentence, read Item 8. FINANCIAL STATEMENTS AND SUPPLEMENTARY DATA in the FY2023 filing and the FY2022 filing.
Item 9A. CONTROLS AND PROCEDURES
5 rewritten, 0 added, 0 removed, 13 unchanged
Prior to filing this report, PCA completed an evaluation under the supervision and with the participation of PCA’s management, including PCA’s Chief Executive Officer and Chief Financial Officer, of the effectiveness of the design and operation of PCA’s disclosure controls and procedures as of December 31, [removed: 2022.][added: 2023.]
Based on this evaluation, PCA’s Chief Executive Officer and Chief Financial Officer concluded that PCA’s disclosure controls and procedures were effective at the reasonable assurance level as of December 31, [removed: 2022.][added: 2023.]
During the quarter ended December 31, [removed: 2022,] [added: 2023,] there were no changes to internal controls over financial reporting that have materially affected, or are reasonably likely to materially affect, PCA's internal control over financial reporting.
PCA’s management, under the supervision of and with the participation of the Chief Executive Officer and Chief Financial Officer, assessed the Company’s internal control over financial reporting as of December 31, [removed: 2022,] [added: 2023,] based on criteria established in *Internal Control - Integrated Framework (2013)* issued by the Committee of Sponsoring Organizations of the Treadway Commission (COSO).
Based on this assessment, PCA’s management concluded that its internal control over financial reporting was effective as of December 31, [removed: 2022] [added: 2023] based on the specified criteria.
Item 9B. OTHER INFORMATION
0 rewritten, 1 added, 1 removed, 0 unchanged
During the three months ended December 31, 2023, none of the Company's directors or officers adopted or terminated any contract, instruction, or written plan for the purchase or sale of our securities intended to satisfy the affirmative defense conditions of Rule 10b5-1(c) under the Exchange Act or any non-Rule 10b5-1 trading arrangements as defined in Item 408(a) of Regulation S-K.
None.
Item 10. DIRECTORS, EXECUTIVE OFFICERS, AND CORPORATE GOVERNANCE
2 rewritten, 0 added, 0 removed, 5 unchanged
The following information required by this Item 10 will be included in PCA’s Proxy Statement for the [removed: 2023] [added: 2024] Annual Meeting of Stockholders and is incorporated by reference herein:
Information regarding PCA’s stockholder nominating procedures included under the captions “Election of Directors - Nominating and Governance Committee,” “Other Information - Recommendations for Board - Nominated Director Nominees,” and “Other Information - Procedures for Nominating Directors or Bringing Business Before the [removed: 2023] [added: 2024] Annual Meeting”
Item 12. SECURITY OWNERSHIP OF CERTAIN BENEFICIAL OWNERS AND MANAGEMENT AND RELATED STOCKHOLDER MATTERS
3 rewritten, 1 added, 1 removed, 9 unchanged
*Authorization of Securities under Equity Compensation Plans —* Securities authorized for issuance under our equity compensation plans at December 31, [removed: 2022] [added: 2023] are as follows:
| Equity compensation plans approved by securityholders | | | — | | | $ | — | | | | [removed: 1,010,073] [added: 662,089] | |
Does not include [removed: 1,014,363] [added: 1,044,500] shares of unvested restricted stock and performance units granted pursuant to our Amended and Restated 1999 Long-Term Equity Incentive Plan.
| Total | | | — | | | $ | — | | | | 662,089 | |
| Total | | | — | | | $ | — | | | | 1,010,073 | |
Item 15. EXHIBITS, FINANCIAL STATEMENT SCHEDULES
12 rewritten, 3 added, 5 removed, 156 unchanged
| [removed: 4.13] [added: 4.15] | | [Description of Common Stock. (Incorporated herein by reference to Exhibit 4.13 to PCA's Annual Report on Form 10-K for the year ended December 31, 2019, File No. 1-15399).](https://www.sec.gov/Archives/edgar/data/75677/000156459020006774/pkg-ex413_182.htm) |
| 10.1 | | [removed: [Credit] [added: [First Amendment to Credit] Agreement, dated [removed: June 8, 2021] [added: April 27, 2023,] between Packaging Corporation of America and the lenders and agents named therein. (Incorporated herein by reference to Exhibit 10.1 to PCA’s [removed: Current] [added: Quarterly] Report on Form [removed: 8-K filed] [added: 10-Q for the period ended] June [removed: 11, 2021,] [added: 30, 2023,] File No. [removed: 1-15399).](https://www.sec.gov/Archives/edgar/data/0000075677/000119312521188809/d32713dex101.htm)] [added: 1-15399).](https://www.sec.gov/Archives/edgar/data/75677/000095017023038396/pkg-ex10_1.htm)] |
| 10.4 | | [Packaging Corporation of America Supplemental Executive Retirement Plan, as Amended and Restated Effective as of January 1, [removed: 2023.*†](https://www.sec.gov/Archives/edgar/data/75677/000095017023003990/pkg-ex10_4.htm)] [added: 2023. (Incorporated herein by reference to Exhibit 10.4 to PCA's Annual Report on Form 10-K for the year ended December 31, 2022, File No. 1-15399).*](https://www.sec.gov/Archives/edgar/data/75677/000095017023003990/pkg-ex10_4.htm)] |
| 21.1 | | [Subsidiaries of the [removed: Registrant.†](https://www.sec.gov/Archives/edgar/data/75677/000095017023003990/pkg-ex21_1.htm)] [added: Registrant.†](https://www.sec.gov/Archives/edgar/data/75677/000095017024022794/pkg-ex21_1.htm)] |
| 23.1 | | [Consent of KPMG [removed: LLP.†](https://www.sec.gov/Archives/edgar/data/75677/000095017023003990/pkg-ex23_1.htm)] [added: LLP.†](https://www.sec.gov/Archives/edgar/data/75677/000095017024022794/pkg-ex23_1.htm)] |
| 24.1 | | [Powers of [removed: Attorney.†](https://www.sec.gov/Archives/edgar/data/75677/000095017023003990/pkg-ex24_1.htm)] [added: Attorney.†](https://www.sec.gov/Archives/edgar/data/75677/000095017024022794/pkg-ex24_1.htm)] |
| 31.1 | | [Certification of Chief Executive Officer, As Adopted Pursuant to Section 302 of the Sarbanes-Oxley Act of [removed: 2002.†](https://www.sec.gov/Archives/edgar/data/75677/000095017023003990/pkg-ex31_1.htm)] [added: 2002.†](https://www.sec.gov/Archives/edgar/data/75677/000095017024022794/pkg-ex31_1.htm)] |
| 31.2 | | [Certification of Chief Financial Officer, As Adopted Pursuant to Section 302 of the Sarbanes-Oxley Act of [removed: 2002.†](https://www.sec.gov/Archives/edgar/data/75677/000095017023003990/pkg-ex31_2.htm)] [added: 2002.†](https://www.sec.gov/Archives/edgar/data/75677/000095017024022794/pkg-ex31_2.htm)] |
| 32 | | [Certification of Chief Executive Officer and Chief Financial Officer Pursuant to 18 U.S.C. §1350, As Adopted Pursuant to Section 906 of the Sarbanes-Oxley Act of [removed: 2002.†](https://www.sec.gov/Archives/edgar/data/75677/000095017023003990/pkg-ex32.htm)] [added: 2002.†](https://www.sec.gov/Archives/edgar/data/75677/000095017024022794/pkg-ex32.htm)] |
| 101.SCH | | Inline XBRL Taxonomy Extension Schema [removed: Document] [added: With Embedded Linkbase Documents] |
Pursuant to the requirements of Section 13 or 15(d) of the Securities Exchange Act of 1934, the registrants have duly caused this report to be signed on their behalf by the undersigned, thereunto duly authorized on February [removed: 23, 2023.][added: 29, 2024.]
Pursuant to the requirements of the Securities Exchange Act of 1934, this report has been signed below on February [removed: 23, 2023,] [added: 29, 2024,] by the following persons on behalf of the registrants and in the capacities indicated.
| 4.13 | | [Officers' Certificate, dated November 30, 2023, pursuant to Section 301 of the Indenture establishing 5.700% Senior Notes due 2033. (Incorporated herein by reference to Exhibit 4.1 to PCA's Current Report on Form 8-K filed November 30, 2023, File No. 1-15399).](https://www.sec.gov/Archives/edgar/data/75677/000119312523285607/d16849dex41.htm) |
| 4.14 | | [5.700% Senior Notes due 2033 (Incorporated herein by reference to Exhibit 4.2 to PCA's Current Report on Form 8-K filed November 30, 2023, File No. 1-15399).](https://www.sec.gov/Archives/edgar/data/75677/000119312523285607/d16849dex42.htm) |
| 97 | | [Packaging Corporation of America Clawback Policy, adopted as of December 1, 2023.†](https://www.sec.gov/Archives/edgar/data/75677/000095017024022794/pkg-ex97.htm) |
| | | |
| 101.CAL | | Inline XBRL Taxonomy Extension Calculation Linkbase Document |
| 101.DEF | | Inline XBRL Taxonomy Extension Definition Linkbase Document |
| 101.LAB | | Inline XBRL Taxonomy Extension Label Linkbase Document |
| 101.PRE | | Inline XBRL Taxonomy Extension Presentation Linkbase Document |