 filings.tools
Prologis (PLD) 10-K risk factor changes: FY2024 vs FY2023
The 2024-12-31 10-K against the 2023-12-31 one, compared heading by heading and sentence by sentence.
Item 1A40 rewritten3 added5 removed246 unchanged
All filing items1,293 rewritten715 added465 removed2,341 unchanged
Summary
counted, not written
- Item 1A lists 28 risk factor headings: 0 new, 2 reworded and 26 unchanged since FY2023. 0 headings from FY2023 no longer appear.
- Sentence by sentence, 715 added, 465 removed, 1,293 rewritten and 2,341 unchanged across 19 items that differ.
New Item 1A headings (0)
No risk factor heading in this filing is absent from FY2023.
Removed Item 1A headings (0)
Every FY2023 risk factor heading is still here, word for word or reworded.
Reworded Item 1A headings (2)
- As a global company, we are subject to social, geopolitical and economic risks
[removed: of doing][added: associated with conducting] business in many countries and our results of operations and financial condition may be materially and adversely affected. - Our customers may be unable to meet their lease
[removed: obligations,][added: obligations or] we may be unable to lease vacant[removed: space or][added: space,] renew leases or re-lease space on favorable terms as leases expire.
A heading is new when no FY2023 heading matches it after ignoring case and punctuation, and reworded when it shares at least 60 percent of its words with one that went away. All current risk factor headings.
Sentences by item
24 items, with every count and a link to each item that changed
Underlined words on a shaded ground are new in FY2024; struck-through words were in FY2023. Sentences that are wholly new or wholly gone are labelled rather than marked.
Item 1A. Risk Factors
40 rewritten, 3 added, 5 removed, 246 unchanged
As a global company, we are subject to social, geopolitical and economic risks [removed: of doing] [added: associated with conducting] business in many countries and our results of operations and financial condition may be materially and adversely affected.
We conduct a significant portion of our business and employ a substantial number of people outside of the U.S. During [removed: 2023,] [added: 2024,] we generated approximately [removed: $632] [added: $688] million or [removed: 7.9%] [added: 8.4%] of our consolidated revenues from operations outside the U.S. Circumstances and developments related to international operations that could negatively [removed: affect] [added: impact] us include, but are not limited to, the following factors:
the responsibility of complying with multiple and potentially conflicting laws, [removed: e.g., with respect to] [added: such as those regarding] corrupt practices, human rights, employment and licensing;
changes in general economic conditions [removed: from] [added: due to] inflation, elevated interest rates, regional or country-specific business cycles, supply chain disruptions, economic downturns or recessions and economic instability, including government shutdowns and withdrawals from the European Union or other international trade alliances or agreements;
existing customers and potential customers of our logistics facilities may be adversely affected by the decrease in economic activity, changes in regulation or disruptions in the supply chain, which [added: could] in turn [removed: could] disrupt their business and [added: affect] their ability to enter into new leasing transactions or satisfy rental payments;
government, labor or other restrictions may [added: add new or additional compliance requirements as a developer or] prevent us from completing the development or leasing of properties currently under development or making our properties ready for our customers to move in;
our ability to recover our investments in real estate assets may be [removed: impacted] [added: hindered] by current market conditions;
To the extent there is turmoil in the global financial markets, this turmoil has the potential to adversely [removed: affect] [added: affect:] (i) the value of our properties; (ii) the availability or the terms of financing that we have or may anticipate utilizing; (iii) our ability to make principal and [added: interest payments on, or refinance any outstanding debt when due; and (iv) the ability of our customers to enter into new leasing transactions or satisfy rental payments under existing leases.]
At December 31, [removed: 2023,] [added: 2024,] approximately [removed: $10.6] [added: $11.5] billion or [removed: 11.4%] [added: 12.1%] of our total consolidated assets were invested in a currency other than the U.S. dollar, principally the British pound sterling, Canadian dollar, [removed: euro,] [added: euro] and Japanese yen.
For the year ended December 31, [removed: 2023, $303.7] [added: 2024, $382.7] million or [removed: 5.1%] [added: 6.3%] of our total consolidated segment NOI was denominated in a currency other than the U.S. dollar.
As a result, we are [removed: subject] [added: exposed] to foreign currency risk due to potential fluctuations in exchange rates between foreign currencies and the U.S. dollar.
Although we attempt to mitigate the potential adverse effects of changes in foreign currency [removed: rates] [added: rates,] there can be no assurance that those attempts will be successful.
General economic conditions and other events or occurrences that affect areas in which our properties are geographically [removed: concentrated,] [added: concentrated] may impact financial results.
At December 31, [removed: 2023, 30.0%] [added: 2024, 30.6%] of our consolidated operating properties or [removed: $22.7] [added: $24.0] billion (based on consolidated gross book value, or investment before depreciation) were located in California (Central Valley, San Francisco Bay Area and Southern California markets), which represented [removed: 23.2%] [added: 23.4%] of the aggregate square footage of our operating properties and [removed: 31.7%] [added: 31.8%] of our consolidated operating property NOI.
Of these markets, no single market contributed more than 10% of our total consolidated investment before depreciation in operating [removed: properties, with the exception of New Jersey/New York City at 10.6%.][added: properties.]
Our O&M portfolio, which includes our consolidated properties and properties owned by our unconsolidated co-investment ventures, has concentrations of properties in the same markets mentioned above, as well as in markets in [removed: Japan] [added: Japan, Mexico,] and the U.K., and are subject to the economic conditions in those markets.
Our customers may be unable to meet their lease [removed: obligations,] [added: obligations or] we may be unable to lease vacant [removed: space or] [added: space,] renew leases or re-lease space on favorable terms as leases expire.
At December 31, [removed: 2023,] [added: 2024,] our top 10 customers accounted for [removed: 15.8%] [added: 15.9%] of our consolidated NER and [removed: 14.5%] [added: 14.3%] of our O&M NER.
[added: A customer may experience a downturn in its business,] which may cause the loss of the customer or may weaken its financial condition, resulting in the customer’s failure to make rental payments when due or requiring a restructuring that might reduce cash flow from the lease.
We are also subject to the risk that, upon [removed: the expiration of leases they] [added: lease expiration, existing customers] may not [removed: be renewed by existing customers,] [added: renew,] the space may not be re-leased to new customers or the terms of renewal or [removed: re-leasing (including] [added: re-leasing, including] the cost of required renovations or concessions to [removed: customers)] [added: customers,] may be less favorable to us than current lease terms.
Our competitors may offer space at rental rates below current market rates or below [removed: the rental rates] [added: what] we currently [removed: charge our customers] [added: charge,] and we may be pressured to reduce our [removed: rental] rates [removed: below those we currently charge] to retain customers when leases [removed: expire] [added: expire,] or [removed: we may lose] [added: risk losing] potential customers.
Our real estate development and redevelopment strategy is [added: primarily] focused on monetizing land and redevelopment sites in the future through development of logistics facilities to hold for long-term investment and for contribution or sale to a co-investment venture or third party, depending on market conditions, our liquidity needs and other factors.
We may also develop, renovate [removed: and] [added: or] redevelop properties within existing or newly formed co-investment [removed: ventures.][added: ventures, or develop and redevelop properties into data centers.]
we may not be able to obtain, or may experience delays in obtaining, all necessary zoning, land-use, building, occupancy and other governmental permits and [removed: authorizations;][added: authorizations, or sufficient, reliable power for our data centers;]
[removed: we may incur higher construction costs, due primarily to this inflationary environment, or additional costs related to regulation that] exceed our estimates and projects may not be completed, delivered or stabilized as planned due to defects or other issues;
At December 31, [removed: 2023,] [added: 2024,] we had investments in co-investment ventures, both public and private, that owned real estate with a gross book value of approximately [removed: $62.9] [added: $67.3] billion.
We have contributed, and may continue to [removed: contribute,] [added: contribute] assets into such vehicles.
In addition, through Prologis [removed: Essentials] [added: Essentials,] we are investing in the development of new business lines that are complementary to our core business.
Our logistics facilities and the global supply chain are and may continue to be exposed to [removed: catastrophic] [added: severe] weather events, such as [removed: severe storms, fires] [added: storms] or floods.
We may also be adversely impacted by transition risks, such as potential impacts to the supply chain as a real estate developer or changes in laws [removed: and regulations, such as stricter energy efficiency standards] or [removed: greenhouse gas regulations for] [added: regulations, including] the [removed: commercial building sectors.][added: need to invest in low-carbon technologies like solar and battery storage, electric vehicle charging, and LED lighting.]
We cannot give any assurance that other such conditions do not [removed: exist or] [added: currently exist,] may not arise in the [removed: future.][added: future or that we will successfully integrate them into our business.]
We may incur additional costs [removed: to remedy damages] [added: for remediation] caused by such disruptions.
Third-party security events at vendors, sub-processors, and service providers could also impact our data and operations [removed: via] [added: through] unauthorized access to information or disruption of services which may ultimately result in losses.
Although security incidents have had an insignificant financial impact on our operating results, the [removed: growing] [added: rising] frequency of attempts may lead to increased costs to protect the company and respond to any events, including additional personnel, consultants and protection technologies.
Any compromise of our security could result in a violation of applicable privacy and other laws, unauthorized access to information of ours and others, significant legal and financial exposure, damage to our reputation, loss or misuse of the information and a loss of confidence in our security measures, which could [removed: harm] [added: negatively impact] our business.
If we experience a loss that is uninsured or that exceeds insured limits with respect to one or more of our properties or if the insurance companies fail to meet their coverage commitments to us in the event of an insured loss, then we could lose the capital invested in the damaged properties, as well as the anticipated future revenues from those properties and, if there [added: is recourse debt, then we would remain obligated for any mortgage debt or other financial obligations related to the properties.]
[removed: These short-term] borrowing needs could result from differences in timing between the actual receipt of cash and inclusion of income for federal income tax purposes, or the effect of nondeductible capital expenditures, the creation of reserves or required debt or amortization payments.
Our credit ratings at December 31, [removed: 2023] [added: 2024] were A [removed: and A3] from Standard & Poor's [removed: and Moody’s, respectively, each] with a stable [added: outlook and A3 from Moody's with a positive] outlook.
[removed: Historically, we have satisfied these distribution requirements] by making cash distributions to our stockholders, but we may choose to satisfy these requirements by making distributions of cash or other property, including, in limited circumstances, our own stock.
Provided that each subsidiary REIT qualifies as a REIT, our interest in such subsidiary REIT will be treated as a qualifying real estate asset for purposes of the REIT asset tests, and any dividend income or gains derived by us from such subsidiary [added: REIT will generally be treated as income that qualifies for purposes of the REIT 95% and 75% gross income tests.]
we may incur higher construction costs, due primarily to this inflationary environment, or additional costs related to regulation that
These short-term
Historically, we have satisfied these distribution requirements
These items may materially and adversely affect our financial condition, results of operations, cash flows and real estate values.
interest payments on, or refinance any outstanding debt when due; and (iv) the ability of our customers to enter into new leasing transactions or satisfy rental payments under existing leases.
A customer may experience a downturn in its business,
is recourse debt, then we would remain obligated for any mortgage debt or other financial obligations related to the properties.
REIT will generally be treated as income that qualifies for purposes of the REIT 95% and 75% gross income tests.
Item 7. Management’s Discussion and Analysis of Financial Condition and Results of Operations
233 rewritten, 79 added, 82 removed, 330 unchanged
A discussion regarding our financial condition and results of operations for [removed: 2023] [added: 2024] compared to [removed: 2022] [added: 2023] is presented below.
Information on [removed: 2021] [added: 2022] is included in graphs only to show year over year trends in our results of operations and operating metrics.
Our financial condition for [removed: 2021,] [added: 2022,] results of operations for [removed: 2021,] [added: 2022,] and [removed: 2022] [added: 2023] compared to [removed: 2021] [added: 2022] and details on the acquisition of Duke Realty Corporation and Duke Realty Limited Partnership (collectively "Duke" or the "Duke Transaction") is referenced throughout this document and can be found under Item 7.
Management’s Discussion and Analysis of Financial Condition and Results of Operations, which is incorporated by reference herein to our Annual Report on [Form [removed: 10-K](https://www.sec.gov/ix?doc=/Archives/edgar/data/1045609/000156459023001902/pld-10k_20221231.htm)] [added: 10-K](https://www.sec.gov/ix?doc=/Archives/edgar/data/0001045609/000095017024014539/pld-20231231.htm)] for the fiscal year ended December 31, [removed: 2022,] [added: 2023,] filed with the SEC on February [removed: 14, 2023,] [added: 13, 2024,] and is available on the SEC’s website at www.sec.gov and our Investor Relations website at [removed: www.ir.prologis.com.][added: ir.prologis.com.]
[removed: Market rents continued] [added: Due] to [removed: grow] [added: increases] in [removed: most of] [added: market rents over] the [removed: global logistics markets, which along with] [added: last several years,] our existing lease [removed: mark-to-market, drove significant] [added: mark-to-market continued to drive] rent change on rollover and same-store growth in our O&M portfolio.
Our [removed: O&M] operating portfolio occupancy was [removed: 97.6%] [added: 95.8%] at December 31, [removed: 2023] [added: 2024] and rent change on leases that commenced during the year was [removed: 76.4%,] [added: 68.7%,] on a net effective [removed: basis] [added: basis, both metrics] based on our ownership share.
[removed: We] [added: Overall, we] believe we are [removed: well positioned] [added: well-positioned] to organically grow revenues over the [removed: long-term given] [added: long-term, as our in-place leases have considerable upside potential to capture] the cumulative growth in market rents over the last several [removed: years and our existing high lease mark-to-market.][added: years.]
We completed the following significant activities in [removed: 2023,] [added: 2024,] as described in the Notes to the Consolidated Financial Statements:
We generated net proceeds of [removed: $2.1] [added: $4.8] billion and realized net gains of [removed: $623 million,] [added: $1.3 billion,] principally from the contribution of properties to [removed: our] unconsolidated co-investment ventures in [removed: Europe, Japan and Mexico and] the [removed: sale of a] U.S. [removed: portfolio] [added: and Europe and sales] of [removed: assets] [added: non-strategic properties] to [removed: a third-party.][added: third parties in the U.S.]
At December 31, [removed: 2023,] [added: 2024,] we had total available liquidity of [removed: $6.0] [added: $7.4] billion, including borrowing capacity on our credit facilities of [removed: $5.5] [added: $6.1] billion and unrestricted cash balances of [removed: $530 million.][added: $1.3 billion.]
At December 31, [removed: 2023,] [added: 2024,] our total debt [removed: portfolio of $29.0] [added: was $30.9] billion [removed: had] [added: with] a weighted average maturity of 9 years and an effective interest rate of [removed: 3.0%.][added: 3.1%.]
We issued senior notes of [removed: $5.4] [added: $4.2] billion (principal in millions):
| | | | | Aggregate Principal | | | | | | | | Issuance Date Weighted Average | | | | | | | [added: |]
| | [removed: |] Issuance Date | | [added: |] Borrowing Currency | | | | USD (1) | | | | Interest Rate | | Years | | | | [added: |] Maturity Dates |
[added: | | (1)] The exchange rate used to calculate into U.S. dollars was the spot rate at the settlement [removed: date.][added: date of each issuance. | | | | | | | | | | | | | | | | | | |]
We evaluate our business operations based on the NOI of our two [removed: operating] [added: reportable] segments: Real Estate (Rental Operations and Development) and Strategic Capital.
| Rental revenues | | $ | [removed: 6,819] [added: 7,515] | | | $ | [removed: 4,913] [added: 6,819] | |
| Development management and other revenues | | | [removed: 5] [added: 14] | | | | [removed: 21] [added: 5] | |
| Rental expenses | | | [removed: (1,625] [added: (1,765] | ) | | | [removed: (1,206] [added: (1,625] | ) |
| Other expenses | | | [removed: (54] [added: (47] | ) | | | [removed: (40] [added: (54] | ) |
| Real Estate Segment – NOI | | | [removed: 5,145] [added: 5,717] | | | | [removed: 3,688] [added: 5,145] | |
| Strategic capital revenues | | | [removed: 1,200] [added: 672] | | | | [removed: 1,040] [added: 1,200] | |
| Strategic capital expenses | | | [removed: (385] [added: (292] | ) | | | [removed: (304] [added: (385] | ) |
| Strategic Capital Segment – NOI | | | [removed: 815] [added: 380] | | | | [removed: 736] [added: 815] | |
| General and administrative expenses | | | [removed: (390] [added: (419] | ) | | | [removed: (331] [added: (390] | ) |
| Depreciation and amortization expenses | | | [removed: (2,485] [added: (2,580] | ) | | | [removed: (1,813] [added: (2,485] | ) |
| Operating income before gains on real estate transactions, net | | | [removed: 3,085] [added: 3,098] | | | | [removed: 2,280] [added: 3,085] | |
| Gains on dispositions of development properties and land, net | | | [removed: 462] [added: 414] | | | | [removed: 598] [added: 462] | |
| Gains on other dispositions of investments in real estate, net | | | [removed: 161] [added: 904] | | | | [removed: 589] [added: 161] | |
| Operating income | | $ | [removed: 3,708] [added: 4,416] | | | $ | [removed: 3,467] [added: 3,708] | |
See Note 17 to the Consolidated Financial Statements for more information on our segments and a reconciliation of each [removed: business] [added: reportable] segment’s NOI to *Operating Income* and *Earnings Before Income Taxes.*
This [removed: operating] [added: reportable] segment principally includes rental revenue and rental expenses recognized from our consolidated properties.
[removed: We allocate the costs of our property management and] leasing functions to the Real Estate Segment through *Rental Expenses* and the Strategic Capital Segment through *Strategic Capital Expenses,* both in the Consolidated Financial Statements, based on the square footage of the relative portfolios.
| Real Estate Segment – NOI | | $ | [removed: 5,145] [added: 5,717] | | | $ | [removed: 3,688] [added: 5,145] | |
The [added: $572 million] change in Real Estate Segment (“RES”) NOI in [removed: 2023] [added: 2024] compared to [removed: 2022 of approximately $1.5 billion] [added: 2023,] was impacted by the following activities (in millions):
[removed: ][added: ]
[removed: Acquisition activity] [added: The increase due to acquisitions] is principally due to the [removed: Duke Transaction on October 3, 2022 and a] [added: additional NOI in 2024 from the] $3.1 billion real estate portfolio acquired in the U.S. on June 29, 2023.
Acquisition activity also includes the [removed: amortization of] fair value lease [removed: adjustments] [added: amortization] to rental revenues due to in-place leases that were primarily below market at the time of the acquisition.
Significant rent change [added: due to higher rental rates on the rollover of leases] during both periods continues to be a key driver [removed: in] [added: of] increasing rental income.
We calculate changes in NOI from development completions period over period by comparing the change in NOI generated on the pool of developments that completed on or after January 1, [removed: 2022] [added: 2023] through December 31, [removed: 2023.][added: 2024.]
Summary of 2024
Our operating results were strong in 2024, despite the softening of rents and occupancy in our global logistics markets.
This lease mark-to-market has remained meaningfully positive despite recent quarters of lower or even negative market rental growth due to the compounded nature of market rent growth.
In the near term, our proprietary metrics indicate renewed activity in customer leasing decisions as we entered 2025, despite the current economic and geopolitical environment.
Additionally, we expect our development activity to increase as market conditions warrant.
We earned promotes from unconsolidated co-investment ventures aggregating $139 million ($43 million net of related strategic capital expenses, which includes stock compensation amortization for promotes earned in prior periods), primarily from the value we created in executing the redevelopment, leasing and sale of a data center in the fourth quarter of 2024.
Our publicly traded vehicle, FIBRA Prologis, completed tender offers to acquire 89.9% of Terrafina, a Mexican FIBRA, through a combination of stock and cash and began consolidating Terrafina, which owned a portfolio of 41 million square feet of industrial real estate properties at December 31, 2024.
As a result, our ownership interest in FIBRA Prologis decreased to 34.6% at December 31, 2024.
In India, we acquired 225 acres of land to support future development opportunities in this new market.
In March 2024, we established a commercial paper program, under which we may issue, repay and re-issue short-term unsecured commercial paper notes (“CPNs”) denominated in U.S. dollars.
At any point in time, we are required to maintain available commitments under our credit facilities in an amount at least equal to the CPNs outstanding.
| | | | | | | | | | | | | | | | | | | | |
| --- | --- | --- | --- | --- | --- | --- | --- | --- | --- | --- | --- | --- | --- | --- | --- | --- | --- | --- | --- |
| | January | | $ | | 1,250 | | | $ | 1,250 | | | 5.1% | | 17.3 | | | | | March 2034 – 2054 |
| | February | | CN¥ | | 1,500 | | | $ | 211 | | | 3.5% | | 3.0 | | | | | February 2027 |
| | March | | C$ | | 550 | | | $ | 405 | | | 4.7% | | 5.0 | | | | | March 2029 |
| | May | | € | | 550 | | | $ | 592 | | | 4.0% | | 10.0 | | | | | May 2034 |
| | May | | £ | | 350 | | | $ | 439 | | | 5.6% | | 16.0 | | | | | May 2040 |
| | July | | $ | | 1,100 | | | $ | 1,100 | | | 5.1% | | 17.5 | | | | | January 2035 – March 2054 |
| | September | | CN¥ | | 1,350 | | | $ | 190 | | | 3.3% | | 5.0 | | | | | September 2029 |
| | Total | | | | | | | $ | 4,187 | | | 4.8% | | | 13.7 | | | | |
| | | | | | | | | | | | | | | | | | | | |
| | | 2024 | | | | 2023 | | |
This segment also includes the operating results of our renewable energy assets.
We allocate the costs of our property management and
| | | 2024 | | | | 2023 | | |
| Rental revenues | | $ | 7,515 | | | $ | 6,819 | |
| Development management and other revenues | | | 14 | | | | 5 | |
| Rental expenses | | | (1,765 | ) | | | (1,625 | ) |
| Other expenses | | | (47 | ) | | | (54 | ) |
| |
| --- |
| | | 2024 | | | | 2023 | | |
This includes the development of data centers with an aggregate TEI of $0.9 billion, on a consolidated basis.
| |
| --- |
| | | 2024 | | | | 2023 | | |
| Strategic capital expenses | | | (292 | ) | | | (385 | ) |
| | | 2024 | | | | 2023 | | | | 2024 | | | | 2023 | | | | 2024 | | | | 2023 | | | | 2024 | | | | 2023 | | | | 2024 | | | | 2023 | | | |
For promotes earned after January 2024, we amended the Prologis Promote Plan ("PPP") to award up to 25% of the third-party portion of the promotes earned by us from the co-investment ventures to our employees.
Summary of 2023
Our operating results were strong in 2023.
While uncertainties remain in the economic and geopolitical environment, our 2023 results are representative of the prospects we see for our business.
On June 29, 2023, we acquired a real estate portfolio comprised of 70 operating properties in the U.S., aggregating 14 million square feet, for cash consideration of $3.1 billion.
This activity also includes the sale of our investment in an unconsolidated office joint venture.
In April 2023, we formed PJLF, an unconsolidated co-investment venture in Japan, with two investors through the initial contribution of assets for which we received cash and equity ownership.
We made additional contributions to PJLF during 2023.
At December 31, 2023, our ownership interest was 16.3%.
We earned promotes aggregating $675 million ($495 million net of related strategic capital expenses), primarily during the second quarter of 2023 from the third-party investors in USLF in the U.S.
On April 5, 2023, we amended and restated our 2021 global senior credit facility (the "2021 Global Facility") as the 2023 Global Facility, increasing its borrowing capacity to $3.0 billion and extended the initial maturity date to June 2027.
On August 25, 2023, we amended and restated the Japanese yen revolver, increasing its borrowing capacity for total commitments of ¥58.5 billion ($414 million at December 31, 2023) and extended the initial maturity date to August 2027.
In the third quarter of 2023, we entered into Chinese renminbi term loans totaling CN¥1.7 billion ($239 million) with an issuance date weighted average interest rate of 3.5% maturing between September 2024 to 2026.
| | | | | | | | | | | | | | | | | | | |
| --- | --- | --- | --- | --- | --- | --- | --- | --- | --- | --- | --- | --- | --- | --- | --- | --- | --- | --- |
| | | January | | € | 1,250 | | | $ | 1,354 | | | 4.1% | | | 13.8 | | | January 2030 – 2043 |
| | | March | | $ | 1,200 | | | $ | 1,200 | | | 4.9% | | | 17.7 | | | June 2033 – 2053 |
| | | May | | € | 750 | | | $ | 809 | | | 4.6% | | | 10.0 | | | May 2033 |
| | | June | | $ | 2,000 | | | $ | 2,000 | | | 5.1% | | | 13.2 | | | June 2028 – 2053 |
| | | Total | | | | | | $ | 5,363 | | | 4.7% | | | 13.9 | | | |
(1)
In January 2024, we issued senior notes of $1.3 billion with weighted average effective interest rates of 5.2% and a weighted average maturity of 17 years.
In February 2024, we issued senior notes of CN¥ 1.5 billion ($211 million) with an effective interest rate of 3.6% and a maturity of 3 years.
| | | | | | | | | |
| --- | --- | --- | --- | --- | --- | --- | --- | --- |
| | | 2023 | | | | 2022 | | |
(2)
During both periods, we experienced positive rental rate growth.
Rental rate growth is a combination of higher rental rates on rollover of leases (or rent change) and contractual rent increases on existing leases.
If a lease has a contractual rent increase driven by a metric that is not known at the time the lease commences, such as the consumer price index or a similar metric, the rent increase is not included in rent leveling and therefore impacts the rental revenue we recognize.
(3)
In October 2022, we completed the Duke Transaction, which increased our average consolidated square feet for 2023.
Included in TEI for 2023 was incremental spend of $161 million related to a development start that was previously reported.
Our capital expenditures continue to increase year over year as we grow the consolidated operating portfolio through development and acquisitions.
We plan to continue allocating capital in 2024 to renovate and improve our operating portfolio, including the addition of sustainable and efficient building features.
| | | | | | | | | | | | | | | | | | | | | | | | | | | | | | | | | | | | | | | | | | |
| | | 2023 | | | | 2022 | | | | 2023 | | | | 2022 | | | | 2023 | | | | 2022 | | | | 2023 | | | | 2022 | | | | 2023 | | | | 2022 | | | |
In April 2023, we formed PJLF in Japan with two investors.
(5)
The asset valuations are prepared by third-party valuation firms.
Included above is promote revenue earned from USLF in the second quarter of 2023 and PELF in the third quarter of 2022.
An excerpt. Shown here: 40 of 233 rewritten, 40 of 79 added and 40 of 82 removed. The counts are complete. For every sentence, read Item 7. Management’s Discussion and Analysis of Financial Condition and Results of Operations in the FY2024 filing and the FY2023 filing.
Item 7A. Quantitative and Qualitative Disclosures About Market Risk
16 rewritten, 4 added, 6 removed, 25 unchanged
Our sensitivity analysis estimates the exposure to market risk sensitive instruments assuming a hypothetical 10% adverse change in foreign currency exchange rates or interest rates at December 31, [removed: 2023.][added: 2024.]
At December 31, [removed: 2023,] [added: 2024,] after consideration of our ability to borrow in the foreign currencies in which we invest and also derivative and nonderivative financial instruments as discussed in Note 15 to the Consolidated Financial Statements, we had minimal net equity denominated in a currency other than the U.S. dollar.
For the year ended December 31, [removed: 2023, $546] [added: 2024, $602] million or [removed: 6.8%] [added: 7.3%] of our total consolidated revenue was denominated in foreign currencies.
At December 31, [removed: 2023,] [added: 2024,] we had foreign currency contracts denominated principally in British pound sterling, Canadian dollar, euro and Japanese yen, with an aggregate notional amount of [removed: $1.6] [added: $1.5] billion.
Although the impact to net earnings is mitigated through higher translated U.S. dollar earnings from these currencies, a weakening of the U.S. dollar against these currencies by 10% could result in a [removed: $162] [added: $145] million cash payment on settlement of these contracts.
To mitigate that risk, we generally borrow with fixed rate [removed: debt] [added: debt,] and we may use derivative instruments to fix the interest rate on our variable rate debt.
At December 31, [removed: 2023, $26.9] [added: 2024, $30.2] billion of our debt bore interest at fixed rates and therefore the fair value of these instruments was affected by changes in market interest rates.
At December 31, [removed: 2023, $2.7] [added: 2024, $1.3] billion of our debt bore interest at variable rates.
The following table summarizes the future repayment of debt and scheduled principal payments at December 31, [removed: 2023] [added: 2024] (dollars in millions):
| | [removed: 2024] [added: 2025] | | | | [removed: 2025] [added: 2026] | | | | [removed: 2026] [added: 2027] | | | | [removed: 2027] [added: 2028] | | | | Thereafter | | | | Total | | | | Fair Value | | |
| Weighted average interest rate [removed: (2)] [added: (1)] | | [removed: 2.0] [added: 3.4] | % | | | [removed: 3.2] [added: 3.4] | % | | | [removed: 3.3] [added: 2.3] | % | | | [removed: 2.0] [added: 3.3] | % | | | [removed: 2.9] [added: 3.2] | % | | | [removed: 2.8] [added: 3.2] | % | | | | |
| Secured mortgage debt | | [removed: \-] [added: 45] | | | | [removed: 38] [added: \-] | | | | \- | | | | \- | | | | \- | | | | [removed: 38] [added: 45] | | | | [removed: 38] [added: 44] | |
| Senior notes | | [removed: 166] [added: \-] | | | | \- | | | | \- | | | | \- | | | | \- | | | | [removed: 166] [added: \-] | | | | [removed: 166] [added: \-] | |
The weighted average interest rates represent the effective interest rates (including amortization of debt issuance costs and noncash premiums and discounts) at December 31, [removed: 2023] [added: 2024] for the debt outstanding and include the impact of designated interest rate swaps, which effectively fix the interest rate on certain variable rate debt.
At December 31, [removed: 2023,] [added: 2024,] the weighted average effective interest rate on our variable rate debt was [removed: 3.6%,] [added: 2.9%,] which was calculated using an average balance on our credit facilities throughout the year and our other variable rate debt balances at December 31, [removed: 2023.][added: 2024.]
On the basis of our sensitivity analysis, a 10% increase in interest rates on our average outstanding variable rate debt balances would result in additional annual interest expense of [removed: $8] [added: $5] million for the year ended December 31, [removed: 2023,] [added: 2024,] which equates to a change in interest rates of [removed: 36] [added: 29] basis points on our average outstanding variable rate debt balances and [removed: 3] [added: 1] basis [removed: points] [added: point] on our average total debt [removed: portfolio] balances.
| Fixed rate debt | $ | 261 | | | $ | 1,469 | | | $ | 1,948 | | | $ | 2,552 | | | $ | 23,936 | | | $ | 30,166 | | | $ | 27,330 | |
| Credit facilities | $ | \- | | | $ | 163 | | | $ | 62 | | | $ | \- | | | $ | \- | | | $ | 225 | | | $ | 225 | |
| Term loans | | 209 | | | | 542 | | | | \- | | | | 64 | | | | 199 | | | | 1,014 | | | | 1,012 | |
| Total variable rate debt | $ | 254 | | | $ | 705 | | | $ | 62 | | | $ | 64 | | | $ | 199 | | | $ | 1,284 | | | $ | 1,281 | |
| Fixed rate debt (1) | $ | 365 | | | $ | 176 | | | $ | 1,463 | | | $ | 1,796 | | | $ | 23,090 | | | $ | 26,890 | | | $ | 24,096 | |
| Credit facilities | $ | \- | | | $ | \- | | | $ | 355 | | | $ | 624 | | | $ | \- | | | $ | 979 | | | $ | 979 | |
| Term loans | | \- | | | | 726 | | | | 601 | | | | \- | | | | 177 | | | | 1,504 | | | | 1,503 | |
| Total variable rate debt | $ | 166 | | | $ | 764 | | | $ | 956 | | | $ | 624 | | | $ | 177 | | | $ | 2,687 | | | $ | 2,686 | |
At December 31, 2023, we had one interest rate swap agreement to fix €150 million ($156 million) of our floating rate euro senior notes which is included in fixed rate debt.
(2)
Item 1. Business
106 rewritten, 53 added, 54 removed, 138 unchanged
Prologis is the global leader in logistics real estate with a focus on high-barrier, [removed: high-growth] [added: high growth] markets.
We own, manage and develop well-located, high-quality logistics facilities in [removed: 19] [added: 20] countries across four continents.
Our portfolio [removed: focuses] [added: centers] on the world’s most vibrant centers of commerce and our scale across these locations allows us to better serve our customers’ diverse logistics requirements.
[removed: The importance of logistics] [added: Logistics] supply chains [removed: has increased dramatically] [added: remain essential] to our customers and the global economy.
[removed: The long-term trends] [added: Long-term trends, including the growth] of e-commerce [removed: adoption] and [added: modernization of the] supply [removed: chain resiliency] [added: chain,] continue to drive [removed: the need for increased warehouse] [added: demand toward creating supply chain resiliency through leasing additional] space to store and distribute goods.
We believe this demand is driven by three primary factors: (i) [added: the re-positioning of our] customer supply chains [removed: re-positioning] to [removed: address] [added: accommodate] the [removed: significant] shift [removed: to] [added: toward] e-commerce and heightened service expectations; (ii) [added: growth in] overall consumption and [removed: household growth;] [added: households;] and (iii) our customers’ [removed: desire for more] [added: increased focus on building] supply chain [removed: resiliency.][added: efficiency.]
We believe these [removed: forces] [added: factors] will [removed: keep] [added: sustain] demand [removed: strong] [added: and low vacancy rates] over the [removed: long-term.][added: long term.]
We [removed: also] invest significant capital into new logistics properties through [removed: our] [added: acquisitions and] development [removed: activity] [added: activity, including both built-to-suit] and [removed: third-party acquisitions.][added: speculative development and redevelopment of properties into industrial properties and data centers.]
Proceeds from [removed: the disposition of properties,] [added: property dispositions,] generally [removed: through the contribution of] [added: achieved by contributing] newly developed properties to our co-investment ventures and [removed: the sales] [added: selling] of non-strategic properties to third parties, [removed: allow] [added: enable] us to recycle capital back into our [added: ongoing] investment activities.
While the majority of our properties in the U.S. are wholly owned, we hold a significant ownership interest in properties both in the U.S. and internationally through our investment in [removed: the] co-investment ventures.
Partnering with [added: many of] the world’s largest institutional investors through co-investment ventures allows us to expand our investment capacity, enhance and diversify our real estate returns and mitigate our exposure to foreign currency movements.
Our [removed: 1.2] [added: 1.3] billion square foot portfolio has provided the foundation upon which we have built a platform of solutions to address challenges that our customers face in global fulfillment today.
Through Prologis Essentials, we [removed: focus on innovative ways] [added: provide solutions] to meet our customers’ operations and energy and sustainability needs.
[removed: Finally, our long-standing dedication to] [added: Moreover, the principles of] Environmental, [removed: Social] [added: Social,] and Governance (“ESG”) [removed: practices] [added: are ingrained in our business strategy through our integrated approach to global impact and sustainability, which we believe] creates value for our customers, investors, [removed: employees] [added: employees,] and [removed: the communities in which we do business.][added: communities.]
At December 31, [removed: 2023,] [added: 2024,] we owned or had investments in, on a [removed: wholly-owned] [added: wholly owned] basis or through co-investment ventures, properties and development projects expected to total approximately [removed: 1.2] [added: 1.3] billion square feet across the following geographies:
[removed: ][added: ]
Our business comprises two [removed: operating] [added: reportable] segments: Real Estate (Rental Operations and Development) and Strategic Capital.
[removed: ][added: |  |]
NOI from the Real Estate Segment is calculated directly from the Consolidated Financial Statements as *Rental Revenues* and *Development Management and Other Revenues* less *Rental Expenses* and *Other Expenses.* NOI from the Strategic Capital Segment is calculated directly from the Consolidated Financial Statements as *Strategic [removed: Capital* *Revenues*] [added: Capital Revenues*] less *Strategic [removed: Capital* *Expenses.*][added: Capital Expenses.*]
Rental Operations. Rental operations comprise the largest component of our [removed: operating] [added: reportable] segments and generally contributes [removed: 85% to] 90% [added: to 95%] of our consolidated revenues, earnings and FFO.
For leases that commenced during [removed: 2023] [added: 2024] within the consolidated operating portfolio, the weighted average lease term was [removed: 66] [added: 64] months.
Development. [removed: Given the scarcity of modern logistics facilities in our target markets, our] [added: Our] development business provides the opportunity to build [removed: to] [added: modern logistics facilities that address] the evolving requirements of our customers while deepening our [removed: market presence.][added: presence in our target markets.]
We believe we have a competitive advantage due [removed: to] [added: to:] (i) the strategic locations of our global land bank and redevelopment [removed: sites;] [added: sites for the development of future industrial properties or data centers;] (ii) the development expertise of our local teams; (iii) the depth of our customer relationships; (iv) our ability to integrate sustainable design features that provide operational efficiencies for our customers; and (v) our procurement capabilities that allow us to secure high-demand construction materials at [added: a] lower cost.
Generally, we develop properties in the U.S. to hold for the [removed: long-term] [added: long term or to contribute to our unconsolidated co-investment venture,] and outside the U.S. [removed: for contribution] to [added: contribute to] our unconsolidated co-investment ventures.
[removed: Through the Strategic Capital Segment we] [added: We] partner with many of the world’s largest institutional investors through [removed: unconsolidated] co-investment ventures.
The business is capitalized [removed: principally] through private and public [removed: equity of which 93%] [added: equity, that] is [removed: either in perpetual] [added: comprised of 95%] open-ended [removed: or] [added: ventures,] long-term ventures and two publicly traded vehicles (Nippon Prologis REIT, Inc. in Japan and FIBRA [removed: Prologis] [added: Prologis, which controls Terrafina, also a publicly traded FIBRA] in Mexico).
We align our interests with our partners by holding significant ownership interests in [removed: our nine unconsolidated] [added: the] co-investment [removed: ventures (ranging from 15% to 50%).][added: ventures.]
[removed: This] [added: As the majority of our investments are in unconsolidated co-investment ventures, this] structure allows us to reduce our exposure to foreign currency movements for investments outside the U.S. [added: Management of the unconsolidated co-investment ventures comprises our Strategic Capital Segment.]
This segment [removed: produces] [added: generates] durable, long-term cash flows and generally contributes [removed: 10%] [added: 5%] to [removed: 15%] [added: 10%] of our consolidated revenues, earnings and FFO, excluding [removed: promotes, all while requiring minimal capital other than our investment in the venture.][added: promotes.]
We generate strategic capital [removed: revenues or fees] [added: revenue] from our unconsolidated co-investment ventures, principally through asset management and property management services.
[removed: Asset] [added: Revenue earned from asset] management fees [removed: are] [added: is] primarily driven by the quarterly valuation of the real estate properties owned by the respective ventures.
[added: The majority of the strategic capital revenues are generated outside the U.S.] In certain ventures, we also have the ability to earn revenues through incentive fees (“promotes” or “promote revenues”) periodically during the life of a venture, upon liquidation of a venture or upon stabilization of individual venture assets based primarily on the total return of the investments over certain financial hurdles.
We believe that the quality and scale of our portfolio, our ability to [removed: build out] [added: develop] our land bank and redevelopment sites, our strategic capital business, the depth of our customer relationships and the strength of our balance sheet are differentiators that allow us to drive growth in revenues, NOI, earnings, FFO and cash flows.
[removed: 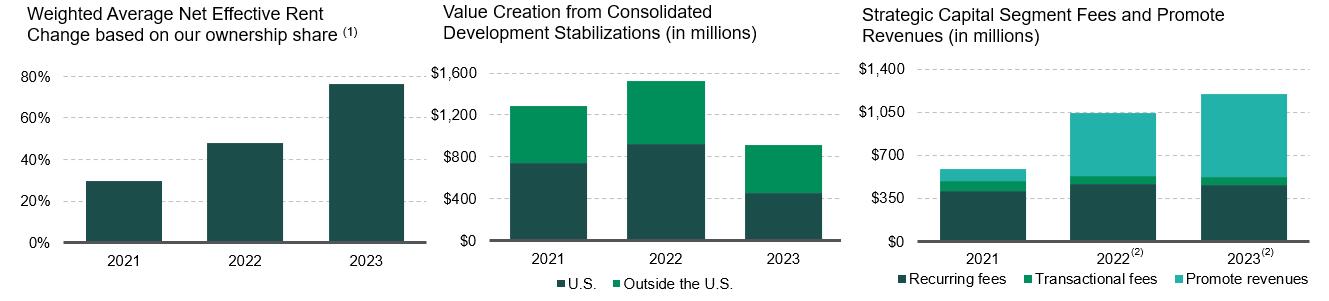][added: ]
Net effective rent ("NER") is calculated at the beginning of the lease using estimated total cash base rent to be received over the term and annualized and excludes [removed: amortization of] fair value lease [removed: adjustments] [added: amortization] from acquisitions.
[removed: Due to strong market rent growth over the last] [added: As a result of] several [removed: years,] [added: years of increases in market rents,] our in-place leases have considerable upside potential to [added: capture these higher rents and to] drive future organic NOI growth.
We estimate that our [added: share of the] lease mark-to-market is approximately [removed: 57%] [added: 30%] (on an NER basis), which represents the [removed: growth rate from in-place rents to] [added: amount by which] current market rents [added: exceed our in-place rents] based on our share of the O&M portfolio at December 31, [removed: 2023.][added: 2024.]
Therefore, even [removed: if there was no additional] [added: without further] market rent [removed: growth in the future,] [added: growth,] we [added: would] expect our lease renewals to [removed: translate into significant increases] [added: result] in [added: higher] future rental income.
One of the ways in which we create value is through our focus on sourcing well-located land and redevelopment sites through acquisition [removed: opportunities, including our innovative approach with Covered Land Plays ("CLP"), which are income producing assets acquired with the intention to redevelop for higher and better use as industrial properties.][added: opportunities.]
Based on our current estimates, our consolidated [removed: land,] [added: land and other real estate investments,] including options and [removed: CLP, has] [added: CLPs, have] the potential to support the development of [removed: $35.7] [added: $36.9] billion [removed: ($40.0] [added: ($41.5] billion on an O&M basis) of TEI of [removed: new logistics space.][added: newly developed buildings.]
This sustained demand has contributed to meaningful rent growth and low vacancy rates in recent years.
In the near term, our proprietary metrics reveal renewed activity in customer leasing decisions as we entered 2025 despite the current economic and geopolitical environment.
REPORTABLE SEGMENTS
| |
| --- |
Nine of the co-investment ventures are unconsolidated entities, and one is consolidated, with our ownership in the co-investment ventures ranging from 15% to 55%.
| |
| --- |
Rent Growth. We have experienced positive rent growth every quarter since 2013.
This lease mark-to-market has remained meaningfully positive despite recent quarters of lower or even negative market rental growth due to the compounded nature of market rent growth.
This strategy has enabled us to create value by converting income-producing assets acquired for redevelopment into industrial properties, known as Covered Land Plays ("CLPs"), as well as converting existing industrial properties into higher uses, such as data centers.
| |
| --- |
Adjusted G&A expenses is calculated from our
Balance Sheet Strength. We have a long-held strategy to build and maintain a strong and flexible balance sheet by using conservative levels of financial leverage.
capabilities to convert properties to data centers in key markets, with total TEI of $0.9 billion on an O&M basis currently under development;
an internal venture capital group, Prologis Ventures, through which we invest in growth stage companies focused on innovating across the logistics sector; and
Our properties are positioned at critical points in the supply chain, most notably our infill and Last Touch® facilities, which are located within and adjacent to major cities to ensure same-day delivery to consumers.
Additionally, we own import and national distribution centers with access to major seaports and intermodal hubs, as well as regional distribution centers that facilitate broader market reach.
| 1. Amazon | 6.0 | | 34 | | 1. Amazon | 4.9 | | 46 |
| 2. Home Depot | 2.8 | | 17 | | 2. Home Depot | 1.8 | | 19 |
| 3. FedEx | 1.7 | | 7 | | 3. FedEx | 1.3 | | 11 |
| 4. UPS | 1.0 | | 6 | | 4. DHL | 1.1 | | 13 |
| 6. NFI Industries | 0.7 | | 4 | | 6. CEVA Logistics | 1.0 | | 13 |
| 8. Walmart | 0.7 | | 6 | | 8. UPS | 0.8 | | 9 |
| 9. Lululemon | 0.7 | | 2 | | 9. Maersk | 0.8 | | 7 |
| 10. GigaCloud | 0.7 | | 3 | | 10. Kuehne + Nagel | 0.7 | | 9 |
| Top 10 Customers | 15.9 | | 89 | | Top 10 Customers | 14.3 | | 152 |
| 12. GXO | 0.6 | | 4 | | 12. Walmart | 0.6 | | 8 |
| 13. Wayfair | 0.6 | | 6 | | 13. NFI Industries | 0.5 | | 4 |
| 14. Ryder | 0.6 | | 3 | | 14. Pepsi | 0.4 | | 4 |
| 15. Maersk | 0.5 | | 3 | | 15. GigaCloud | 0.4 | | 3 |
| 16. DVS A/S | 0.5 | | 2 | | 16. Lululemon | 0.4 | | 2 |
| 17. Western Post | 0.5 | | 2 | | 17. Mercado Libre | 0.4 | | 5 |
| 18. Imperial Dade | 0.5 | | 2 | | 18. Ryder | 0.4 | | 4 |
| 19. Berkshire Hathaway | 0.4 | | 3 | | 19. Burlington Stores | 0.4 | | 3 |
| 20. CEVA Logistics | 0.4 | | 3 | | 20. Samsung | 0.4 | | 5 |
| 21. The Clorox Company | 0.4 | | 3 | | 21. DB Schenker | 0.4 | | 6 |
| 22. Samsung | 0.4 | | 3 | | 22. Wayfair | 0.4 | | 6 |
| 23. Lasership, Inc. | 0.4 | | 1 | | 23. ZOZO | 0.4 | | 5 |
This demand has translated into meaningful increases in rents and low vacancy.
The principles of ESG are an important aspect of our business strategy that we believe delivers a strategic business advantage.
OPERATING SEGMENTS
The majority of the strategic capital revenues are generated outside the U.S.
(2) Included in 2022 and 2023 were significant promotes earned in Europe and the U.S, respectively.
We do not have any significant promote opportunities in 2024.
Rent Growth. We expect rents in our markets to continue to increase due to demand and low vacancy.
This is evident in the positive rent change we have experienced in every quarter since 2013 and was significant to our operating results over the last several years.
Prior to the current rising interest rate environment, we were able to take advantage of lower interest rates through our refinancing activities and substantially addressed our debt maturities until 2026.
As shown in the graph above, the acquisition of Duke Realty Corporation and Duke Realty Limited Partnership (collectively "Duke" or the "Duke Transaction") on October 3, 2022 is an example of this.
We increased our O&M portfolio significantly in the fourth quarter of 2022 as a result of the acquisition and had minimal increases to G&A expenses.
Prologis Ventures, our corporate venture capital group, tracks the leading edge of innovation and technologies within real estate and the supply chain, creating important capabilities that connect Prologis with the C-suites of our customers; and
We have invested in properties located within infill and urban areas in our largest global markets with same day access (defined as Last Touch®) and next day access (defined as city distribution), to the consumer population.
We have also invested in facilities located at key transportation hubs on the edge of these major infill and urban areas and gateway distribution facilities that incorporate access to major sea and intermodal ports.
| 1. Amazon | 6.4 | | 34 | | 1. Amazon | 5.0 | | 43 |
| 2. Home Depot | 2.2 | | 15 | | 2. Home Depot | 1.5 | | 17 |
| 3. FedEx | 1.9 | | 8 | | 3. FedEx | 1.4 | | 11 |
| 4. UPS | 1.0 | | 6 | | 4. Geodis | 1.3 | | 17 |
| 6. Wal-Mart | 0.8 | | 6 | | 6. CEVA Logistics | 0.9 | | 13 |
| 8. Wayfair | 0.6 | | 6 | | 8. UPS | 0.8 | | 9 |
| 9. DSV Panalpina | 0.6 | | 2 | | 9. GXO | 0.8 | | 10 |
| 10. NFI Industries | 0.6 | | 3 | | 10. DSV Panalpina | 0.8 | | 8 |
| Top 10 Customers | 15.8 | | 90 | | Top 10 Customers | 14.5 | | 148 |
| 12. Maersk | 0.5 | | 3 | | 12. Wal-Mart | 0.6 | | 7 |
| 13. GXO | 0.5 | | 4 | | 13. ZOZO | 0.4 | | 5 |
| 14. U.S. Government | 0.5 | | 2 | | 14. DB Schenker | 0.4 | | 6 |
| 15. Ryder | 0.5 | | 2 | | 15. U.S. Government | 0.4 | | 3 |
| 16. Berkshire Hathaway | 0.5 | | 3 | | 16. Wayfair | 0.4 | | 6 |
| 17. Lululemon | 0.4 | | 2 | | 17. Pepsi | 0.4 | | 3 |
| 19. OnTrac | 0.4 | | 1 | | 19. Cainiao (Alibaba) | 0.4 | | 5 |
| 20. Kellogg | 0.4 | | 3 | | 20. NFI Industries | 0.4 | | 3 |
| 21. Tesla | 0.4 | | 1 | | 21. Samsung | 0.4 | | 5 |
| 22. CEVA Logistics | 0.4 | | 3 | | 22. Ryder | 0.3 | | 3 |
| 23. Uline | 0.4 | | 2 | | 23. Tesla | 0.3 | | 2 |
| 24. Kuehne + Nagel | 0.4 | | 2 | | 24. Logisteed | 0.3 | | 4 |
| 25. Target | 0.3 | | 2 | | 25. Mercado Libre | 0.3 | | 4 |
| Top 25 Customers | 22.4 | | 126 | | Top 25 Customers | 20.5 | | 215 |
We are committed to our diversity, equity, inclusion and belonging (“DEIB”) hiring practices.
In 2023, we set a goal to achieve two DEIB certifications by 2025: (i) Management Leadership for Tomorrow’s “Black Equity at Work;” and (ii) Management Leadership for Tomorrow’s “Hispanic Equity at Work.” Our CEO is also a signatory to the CEO Action for Diversity and Inclusion.
We focus on learning and development at every level of the organization.
An excerpt. Shown here: 40 of 106 rewritten, 40 of 53 added and 40 of 54 removed. The counts are complete. For every sentence, read Item 1. Business in the FY2024 filing and the FY2023 filing.
Cover and table of contents
19 rewritten, 4 added, 1 removed, 147 unchanged
| ☑ | | ANNUAL REPORT PURSUANT TO SECTION 13 OR 15(d) OF THE SECURITIES EXCHANGE ACT OF 1934 For the fiscal year ended December 31, [removed: 2023] [added: 2024] |
[removed: ][added: ]
Indicate by check mark whether the registrant has submitted electronically every Interactive Data File required to be submitted pursuant to Rule 405 of Regulation S-T [added: (§ 232.405 of this chapter)] during the preceding 12 months (or for such shorter periods that the registrant was required to submit such files).
Based on the closing price of Prologis, Inc.’s common stock on June 30, [removed: 2023] [added: 2024] the aggregate market value of the voting common equity held by nonaffiliates of Prologis, Inc. was [removed: $112,988,239,238.][added: $103,726,874,356.]
The number of shares of Prologis, Inc.’s common stock outstanding at February [removed: 9, 2024,] [added: 12, 2025,] was approximately [removed: 924,881,000.][added: 926,860,000.]
Portions of Part III of this report are incorporated by reference to the registrant’s definitive proxy statement for the [removed: 2023] [added: 2025] annual meeting of its stockholders or will be provided in an amendment filed on Form 10-K/A.
This report combines the annual reports on Form 10-K for the year ended December 31, [removed: 2023,] [added: 2024,] of Prologis, Inc. and Prologis, L.P. Unless stated otherwise or the context otherwise requires, references to “Prologis, Inc.” or the “Parent” mean Prologis, Inc. and its consolidated subsidiaries; and references to “Prologis, L.P.” or the “Operating Partnership” or the “OP” mean Prologis, L.P., and its consolidated subsidiaries.
At December 31, [removed: 2023,] [added: 2024,] the Parent owned a [removed: 97.58%] [added: 97.57%] common general partnership interest in the OP and substantially all of the preferred units in the OP.
The remaining [removed: 2.42%] [added: 2.43%] common limited partnership interests are owned by unaffiliated investors and certain current and former directors and officers of the Parent.
| | | [removed: [Operating] [added: [Reportable] Segments](#operatingsegments) | | 5 |
| | | [Future Growth](#futuregrowth) | | [removed: 6] [added: 7] |
| | | [Code of Ethics and Business [removed: Conduct](#code_ethics)] [added: Conduct](#codeethics)] | | 11 |
| | | [Environmental [removed: Matters](#environ2)] [added: Matters](#environmentalmatters)] | | 13 |
| | | [Governmental [removed: Matters](#govmatters)] [added: Matters](#governmentalmatters)] | | 13 |
| | | [Insurance [removed: Coverage](#insurance)] [added: Coverage](#insurancecoverage)] | | 13 |
| 1C. | | [Cybersecurity](#cybersecurity) | | [removed: 22] [added: 23] |
| | | [Purchases of Equity Securities](#purchasesofequitysecurities) | | [removed: 28] [added: 29] |
| | | [Securities Authorized for Issuance Under Equity Compensation Plans](#securitiesauthori) | | [removed: 28] [added: 29] |
All statements that address operating performance, events or developments that we expect or anticipate will occur in the future — including statements relating to rent and occupancy growth, acquisition and development activity, contribution and disposition activity, general conditions in the geographic areas where we operate, [added: expectations regarding new lines of business,] our debt, capital structure and financial position, our ability to earn revenues from co-investment [removed: ventures,] [added: ventures or] form new co-investment ventures and the availability of capital in existing or new co-investment ventures — are forward-looking statements.
| Prologis, L.P. | | 5.625% Notes due 2040 | | PLD/40 | | New York Stock Exchange |
[Table of Contents](#toc_page)
| | | [Global Impact and Sustainability](#esg) | | 12 |
[Table of Contents](#toc_page)
| | | [Environmental, Social and Governance](#esg) | | 11 |
Item 1B. Unresolved Staff Comments
0 rewritten, 1 added, 0 removed, 1 unchanged
[Table of Contents](#toc_page)
Item 1C. Cybersecurity
3 rewritten, 0 added, 2 removed, 16 unchanged
Our Chief Technology Officer, who reports directly to our Chief Executive Officer, holds over 25 years of experience in information technology, specifically infrastructure, information security and fraud, and identity solutions at large global companies, and our Vice President of Information Technology (“IT”) Governance, who reports to our Chief Technology Officer, holds [added: over] 20 years of experience in various information security roles.
The IRT is tasked with taking appropriate action to safeguard the integrity of our information systems, data and network resources, investigate whether a breach occurred, define disclosures, communicate effectively with key audiences, including the Board as necessary, mitigate cybersecurity incident risks and provide a resolution through our [added: cybersecurity incident communication protocols.]
The processes implemented by our IT leadership and IRT to oversee and identify cybersecurity risks are based on the Prologis Information Security Policy governed by the [removed: NIST] [added: United States National Institute of Standards and Technology] Cybersecurity Framework.
[Table of Contents](#toc_page)
cybersecurity incident communication protocols.
Item 2. Properties
44 rewritten, 63 added, 65 removed, 76 unchanged
No individual property or market amounted to 10% or more of our consolidated total assets at December 31, [removed: 2023,] [added: 2024,] or generated revenue equal to 10% or more of our consolidated total revenues for the year ended December 31, [removed: 2023,] [added: 2024,] with the exception of the Southern California market.
| Baltimore/Washington D.C. | | | [removed: 14] [added: 120] | | | | [removed: 2,143] [added: 1] | | | | [removed: \-] [added: 62] | | | | [removed: 18] [added: \-] | | | | [removed: 2,549] [added: \-] | |
| Dallas/Ft. Worth | | | [removed: 46] [added: 51] | | | | [removed: 3,817] [added: 4,637] | | | | \- | | | | [removed: 53] [added: 60] | | | | [removed: 4,420] [added: 5,510] | |
| Lehigh Valley | | | [removed: 31] [added: 105] | | | | [removed: 4,065] [added: 1] | | | | [removed: \-] [added: 38] | | | | [removed: 35] [added: \-] | | | | [removed: 4,431] [added: \-] | |
| New Jersey/New York City | | | [removed: 45] [added: 43] | | | | [removed: 7,982] [added: 7,750] | | | | [removed: 5] [added: 3] | | | | 54 | | | | [removed: 9,408] [added: 9,639] | |
| San Francisco Bay Area | | | [removed: 22] [added: 56] | | | | [removed: 3,503] [added: 1] | | | | [removed: 20] [added: 95] | | | | [removed: 27] [added: 1] | | | | [removed: 4,185] [added: 215] | |
| Seattle | | | 17 | | | | [removed: 2,748] [added: 2,848] | | | | \- | | | | 25 | | | | [removed: 3,634] [added: 3,748] | |
| Value-added properties (4) | | | [removed: 3] [added: 2] | | | | [removed: 418] [added: 255] | | | | \- | | | | [removed: 4] [added: 5] | | | | [removed: 640] [added: 645] | |
| Baltimore/Washington D.C. | | | [removed: 96] [added: 14] | | | | [removed: 1] [added: 1,988] | | | | [removed: 57] [added: \-] | | | [removed: *] | [added: 18] | | | | [removed: 124] [added: 2,625] | |
| Chicago | | | 84 | | | | 1 | | | | 24 | | | [added: *] | [removed: 1] | | | | [removed: 184] [added: 63] | |
| New Jersey/New York City | | | [removed: 183] [added: 168] | | | | [removed: 3] [added: 2] | | | | [removed: 337] [added: 364] | | | | 1 | | | | [removed: 295] [added: 286] | |
| San Francisco Bay Area | | | [removed: 70] [added: 23] | | | | [removed: 1] [added: 3,883] | | | | [removed: 111] [added: 20] | | | | [removed: 2] [added: 28] | | | | [removed: 500] [added: 4,574] | |
| Seattle | | | [removed: 97] [added: 61] | | | | 1 | | | | 54 | | | [added: *] | [removed: 1] | | | | [removed: 171] [added: 76] | |
| South Florida | | | 100 | | | | 1 | | | | [removed: 96] [added: 111] | | | | 1 | | | | [removed: 231] [added: 167] | |
| Germany | | | [removed: 38] [added: 33] | | | | 1 | | | | [removed: 30] [added: 21] | | | [added: *] | [removed: 1] | | | | [removed: 126] [added: 46] | |
| Netherlands | | [added: *] | [removed: 23] | | | | [removed: 1] [added: 26] | | | | [removed: 15] [added: \-] | | | [removed: *] | [added: 30] | | | | [removed: 62] [added: 3,189] | |
In addition to the amounts reflected here, we also have [removed: $128] [added: $41] million of encumbrances related to [removed: two prestabilized properties and] one land parcel included in the consolidated portfolio.
At December 31, [removed: 2023,] [added: 2024,] we had investments in real estate properties that were expected to be contributed to our unconsolidated co-investment ventures totaling [removed: $308] [added: $226] million and aggregating [removed: 3] [added: 2] million square feet.
Value-added properties are properties we have either acquired at a discount and believe we could provide greater returns post-stabilization or properties we expect to repurpose to [removed: a] higher [removed: and better use.][added: uses.]
As noted in the table below, our current investment in the development portfolio was [removed: $4.4] [added: $2.8] billion, leaving approximately [removed: $3.4] [added: $1.9] billion of additional required investment.
At December 31, [removed: 2023,] [added: 2024,] based on TEI, approximately [removed: 26%] [added: 20%] of the properties in the development portfolio were completed but not yet stabilized, [removed: 48%][added: 60% of the properties were expected to be completed before December 31, 2025, and the remaining properties were expected to be]
The following table summarizes our investment in consolidated real estate properties at December 31, [removed: 2023] [added: 2024] (in millions):
| Operating properties, excluding assets held for sale or contribution | | $ | [removed: 75,436] [added: 78,279] | |
| Development portfolio, including cost of land | | | [removed: 4,367] [added: 2,829] | |
| Other real estate investments (1) | | | [removed: 5,088] [added: 5,684] | |
| Total consolidated real estate properties | | $ | [removed: 88,667] [added: 91,246] | |
Included in other real estate investments [removed: were:] [added: were principally:] (i) land parcels we own and lease to third parties; (ii) [added: renewable energy assets, including solar panels and electric vehicle chargers, and energy storage systems; (iii)] non-strategic real estate [removed: assets, primarily acquired from the Duke Transaction,] [added: assets] that we do not intend to operate long term; [removed: (iii)] [added: and (iv)] non-industrial real estate assets that we intend to redevelop as industrial properties or [removed: other higher use assets; and (iv) energy assets.][added: data centers.]
We generally lease our properties on a long-term basis (the [added: weighted] average term for leases commenced, including new leases and renewals, in [removed: 2023] [added: 2024] was [removed: 66] [added: 64] months).
The following table summarizes the lease expirations of our consolidated operating portfolio for leases in place at December 31, [removed: 2023] [added: 2024] (dollars and square feet in millions):
| Total consolidated | | | [removed: 616] [added: 615] | | | | | | | | | | | | | |
We have signed leases that were due to expire in [removed: 2024,] [added: 2025,] totaling [removed: 25] [added: 28] million square feet in our consolidated portfolio [removed: (3.3%] [added: (3.4%] of total NER).
These are excluded from [removed: 2024] [added: 2025] expirations and are reflected at their respective expiration year.
The following table summarizes our consolidated and unconsolidated co-investment ventures at December 31, [removed: 2023] [added: 2024] (in millions):
| Prologis U.S. Logistics Venture (“USLV”) | | | [removed: 78] [added: 77] | | | $ | [removed: 8,167] [added: 8,279] | | | $ | 4 | | | $ | \- | |
| Prologis Targeted U.S. Logistics Fund (“USLF”) | | | [removed: 126] [added: 134] | | | $ | [removed: 13,162] [added: 15,004] | | | $ | [removed: 14] [added: 55] | | | $ | \- | |
| FIBRA Prologis | | | [removed: 47] [added: 66] | | | | [removed: 3,284] [added: 5,170] | | | | [removed: 2] [added: 19] | | | | \- | |
| Prologis Brazil Logistics Venture ("PBLV") and other joint ventures | | | [removed: 18] [added: 19] | | | | [removed: 936] [added: 820] | | | | [removed: 33] [added: 11] | | | | [removed: 109] [added: 182] | |
| Subtotal Other Americas | | | [removed: 65] [added: 85] | | | | [removed: 4,220] [added: 5,990] | | | | [removed: 35] [added: 30] | | | | [removed: 109] [added: 182] | |
| Prologis European Logistics Fund (“PELF”) | | | [removed: 164] [added: 169] | | | | [removed: 18,786] [added: 18,779] | | | | 7 | | | | [removed: 54] [added: 12] | |
| Prologis European Logistics Partners (“PELP”) | | | [removed: 59] [added: 63] | | | | [removed: 6,868] [added: 7,217] | | | | [removed: 86] [added: 82] | | | | [removed: 43] [added: 88] | |
| Atlanta | | | 45 | | | $ | 3,792 | | | $ | \- | | | | 52 | | | $ | 4,399 | |
| Central Valley | | | 21 | | | | 1,841 | | | | \- | | | | 23 | | | | 1,990 | |
| Chicago | | | 54 | | | | 5,166 | | | | \- | | | | 70 | | | | 6,753 | |
| Houston | | | 32 | | | | 3,327 | | | | \- | | | | 38 | | | | 3,872 | |
| Lehigh Valley | | | 32 | | | | 4,082 | | | | \- | | | | 37 | | | | 4,662 | |
| South Florida | | | 22 | | | | 3,993 | | | | 59 | | | | 29 | | | | 5,183 | |
| Southern California | | | 106 | | | | 18,323 | | | | 7 | | | | 125 | | | | 20,702 | |
| Remaining Markets – U.S. (18 markets) (2) | | | 160 | | | | 14,140 | | | | 64 | | | | 195 | | | | 17,077 | |
| Subtotal U.S. | | | 620 | | | | 75,770 | | | | 153 | | | | 754 | | | | 90,734 | |
| Brazil | | * | | | | | 45 | | | | \- | | | | 19 | | | | 865 | |
| Canada | | | 13 | | | | 1,202 | | | | 125 | | | | 13 | | | | 1,202 | |
| Mexico | | | 1 | | | | 59 | | | | \- | | | | 66 | | | | 5,165 | |
| Subtotal Other Americas | | | 14 | | | | 1,306 | | | | 125 | | | | 98 | | | | 7,232 | |
| France | | | 1 | | | | 57 | | | | \- | | | | 36 | | | | 3,421 | |
| Germany | | * | | | | | 13 | | | | \- | | | | 33 | | | | 3,470 | |
| U.K. | | | 2 | | | | 344 | | | | \- | | | | 33 | | | | 8,069 | |
| Remaining Countries – Europe (8 countries) (2) | | | 3 | | | | 328 | | | | \- | | | | 104 | | | | 8,328 | |
| Subtotal Europe | | | 6 | | | | 768 | | | | \- | | | | 236 | | | | 26,477 | |
| China | | | \- | | | | \- | | | | \- | | | | 52 | | | | 2,934 | |
| Japan | | | 3 | | | | 265 | | | | \- | | | | 51 | | | | 7,009 | |
| Singapore | | | 1 | | | | 141 | | | | \- | | | | 1 | | | | 141 | |
| Subtotal Asia | | | 4 | | | | 406 | | | | \- | | | | 104 | | | | 10,084 | |
| Total operating portfolio (3) | | | 644 | | | | 78,250 | | | | 278 | | | | 1,192 | | | | 134,527 | |
| Total operating properties | | | 646 | | | $ | 78,505 | | | $ | 278 | | | | 1,197 | | | $ | 135,172 | |
| Atlanta | | | 464 | | | | 5 | | | $ | 53 | | | | 1 | | | $ | 162 | |
| Central Valley | | | 802 | | | | 13 | | | | 206 | | | | 1 | | | | 68 | |
| Dallas/Ft. Worth | | | 392 | | | | 6 | | | | 139 | | | | 1 | | | | 119 | |
| Houston | | | 428 | | | | 6 | | | | 165 | | | | \- | | | | \- | |
| Southern California | | | 586 | | | | 11 | | | | 743 | | | | 1 | | | | 185 | |
| Remaining Markets – U.S. (13 markets) | | | 2,284 | | | | 34 | | | | 814 | | | | 4 | | | | 1,483 | |
| Subtotal U.S. | | | 5,650 | | | | 83 | | | | 2,868 | | | | 11 | | | | 2,824 | |
| Brazil | | | 605 | | | | 13 | | | | 211 | | | | \- | | | | \- | |
| Canada | | | 272 | | | | 5 | | | | 442 | | | | 2 | | | | 292 | |
| Mexico | | | 662 | | | | 12 | | | | 224 | | | | 3 | | | | 344 | |
| Subtotal Other Americas | | | 1,539 | | | | 30 | | | | 877 | | | | 5 | | | | 636 | |
| France | | | 181 | | | | 4 | | | | 132 | | | * | | | | | 21 | |
| Netherlands | | | 55 | | | | 1 | | | | 52 | | | | 1 | | | | 172 | |
| U.K. | | | 311 | | | | 6 | | | | 233 | | | | 1 | | | | 331 | |
| Remaining Countries – Europe (7 countries) | | | 654 | | | | 12 | | | | 122 | | | | 3 | | | | 183 | |
| Subtotal Europe | | | 1,234 | | | | 24 | | | | 560 | | | | 5 | | | | 753 | |
| Atlanta | | | 46 | | | $ | 3,876 | | | $ | \- | | | | 52 | | | $ | 4,358 | |
| Central PA | | | 18 | | | | 1,545 | | | | \- | | | | 20 | | | | 1,783 | |
| Central Valley | | | 21 | | | | 1,824 | | | | \- | | | | 23 | | | | 1,969 | |
| Chicago | | | 56 | | | | 5,193 | | | | \- | | | | 72 | | | | 6,747 | |
| Houston | | | 32 | | | | 3,277 | | | | \- | | | | 38 | | | | 3,810 | |
| South Florida | | | 22 | | | | 3,983 | | | | 14 | | | | 29 | | | | 5,008 | |
| Southern California | | | 103 | | | | 17,260 | | | | 9 | | | | 122 | | | | 19,613 | |
| Remaining Markets – U.S. (18 markets) (2) | | | 136 | | | | 11,795 | | | | 66 | | | | 166 | | | | 14,132 | |
| Subtotal U.S. | | | 609 | | | | 73,011 | | | | 114 | | | | 734 | | | | 86,047 | |
| Brazil | | * | | | | | 57 | | | \- | | | | | 18 | | | | 994 | |
| Canada | | | 10 | | | | 907 | | | | 138 | | | | 10 | | | | 907 | |
| Mexico | | | 1 | | | | 48 | | | \- | | | | | 48 | | | | 3,328 | |
| Subtotal Other Americas | | | 11 | | | | 1,012 | | | | 138 | | | | 76 | | | | 5,229 | |
| France | | | 1 | | | | 58 | | | \- | | | | | 35 | | | | 3,460 | |
| Germany | | | 1 | | | | 150 | | | \- | | | | | 32 | | | | 3,395 | |
| Netherlands | | * | | | | | 15 | | | \- | | | | | 30 | | | | 3,405 | |
| U.K. | | | 2 | | | | 293 | | | \- | | | | | 32 | | | | 7,770 | |
| Remaining Countries – Europe (8 countries) (2) | | | 4 | | | | 358 | | | \- | | | | | 101 | | | | 8,407 | |
| Subtotal Europe | | | 8 | | | | 874 | | | | \- | | | | 230 | | | | 26,437 | |
| China | | \- | | | | \- | | | | \- | | | | | 49 | | | | 3,158 | |
| Japan | | | 2 | | | | 164 | | | \- | | | | | 48 | | | | 7,255 | |
| Singapore | | | 1 | | | | 145 | | | \- | | | | | 1 | | | | 145 | |
| Subtotal Asia | | | 3 | | | | 309 | | | | \- | | | | 98 | | | | 10,558 | |
| Total operating portfolio (3) | | | 631 | | | | 75,206 | | | | 252 | | | | 1,138 | | | | 128,271 | |
| Total operating properties | | | 634 | | | $ | 75,624 | | | $ | 252 | | | | 1,142 | | | $ | 128,911 | |
| Atlanta | | | 510 | | | | 5 | | | $ | 67 | | | | 1 | | | $ | 87 | |
| Central PA | | | \- | | | | \- | | | | \- | | | | \- | | | | \- | |
| Central Valley | | | 805 | | | | 14 | | | | 196 | | | | 1 | | | | 63 | |
| Dallas/Ft. Worth | | | 386 | | | | 6 | | | | 130 | | | | 2 | | | | 320 | |
| Houston | | | 443 | | | | 6 | | | | 149 | | | | \- | | | | \- | |
| Lehigh Valley | | | 105 | | | | 1 | | | | 38 | | | | 1 | | | | 176 | |
| Southern California | | | 505 | | | | 9 | | | | 577 | | | | 5 | | | | 1,106 | |
| Remaining Markets – U.S. (18 markets) | | | 2,178 | | | | 31 | | | | 653 | | | | 7 | | | | 2,026 | |
| Subtotal U.S. | | | 5,562 | | | | 80 | | | | 2,489 | | | | 23 | | | | 5,283 | |
| Brazil | | | 419 | | | | 9 | | | | 72 | | | | \- | | | | \- | |
| Canada | | | 239 | | | | 4 | | | | 408 | | | | 2 | | | | 460 | |
| Mexico | | | 748 | | | | 13 | | | | 238 | | | | 3 | | | | 231 | |
| Subtotal Other Americas | | | 1,406 | | | | 26 | | | | 718 | | | | 5 | | | | 691 | |
| France | | | 168 | | | | 3 | | | | 136 | | | | \- | | | | \- | |
| U.K. | | | 284 | | | | 5 | | | | 228 | | | | 2 | | | | 495 | |
An excerpt. Shown here: 40 of 44 rewritten, 40 of 63 added and 40 of 65 removed. The counts are complete. For every sentence, read Item 2. Properties in the FY2024 filing and the FY2023 filing.
Item 5. Market for Registrant’s Common Equity, Related Stockholder Matters and Issuer Purchases of Equity Securities
8 rewritten, 2 added, 0 removed, 17 unchanged
The following line graph compares the change in Prologis, Inc. cumulative total stockholder’s return on shares of its common stock from December 31, [removed: 2018,] [added: 2019,] to the cumulative total return of the S&P 500 Stock Index and the Financial Times and Stock Exchange NAREIT Equity REITs Index from December 31, [removed: 2018,] [added: 2019,] to December 31, [removed: 2023.][added: 2024.]
The graph assumes an initial investment of $100 in our common stock and each of the indices on December 31, [removed: 2018,] [added: 2019,] and, as required by the SEC, the reinvestment of all dividends.
[removed: 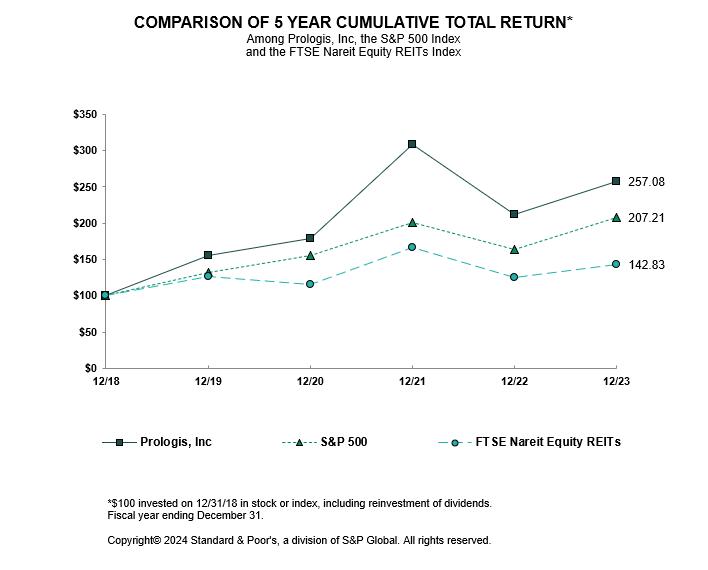][added: | |  | |]
At December 31, [removed: 2023,] [added: 2024,] we had 1.3 million shares of Series Q preferred stock outstanding with a liquidation preference of $50 per share that will be redeemable at our option on or after November 13, 2026.
Dividends payable per share were $4.27 for the year ended December 31, [removed: 2023.][added: 2024.]
During [removed: 2023,] [added: 2024,] we issued [removed: 0.8] [added: 1.4] million shares of common stock of Prologis, Inc. in connection with the redemption of common units of Prologis, L.P. in reliance on the exemption from registration requirements of the Securities Act of 1933, as amended, afforded by Section 4(a)(2) thereof.
During [removed: 2023,] [added: 2024,] we did not purchase any common stock of Prologis, Inc. in connection with our share purchase program.
Further information relative to our equity compensation plans will be provided in our [removed: 2023] [added: 2025] Proxy Statement or in an amendment filed on Form 10-K/A.
| | | |
| --- | --- | --- |
Item 8. Financial Statements and Supplementary Data
1 rewritten, 0 added, 0 removed, 1 unchanged
The Consolidated Balance Sheets of Prologis, Inc. and Prologis, L.P. at December 31, [removed: 2023] [added: 2024] and [removed: 2022,] [added: 2023,] the Consolidated Statements of Income of Prologis, Inc. and Prologis, L.P., the Consolidated Statements of Comprehensive Income of Prologis, Inc. and Prologis, L.P., the Consolidated Statements of Equity of Prologis, Inc., the Consolidated Statements of Capital of Prologis, L.P. and the Consolidated Statements of Cash Flows of Prologis, Inc. and Prologis, L.P. for each of the years in the three-year period ended December 31, [removed: 2023,] [added: 2024,] Notes to Consolidated Financial Statements and Schedule III — Real Estate and Accumulated Depreciation, together with the reports of KPMG LLP, independent registered public accounting firm, are included under Item 15 of this report and are incorporated herein by reference.
Item 9A. Controls and Procedures
9 rewritten, 3 added, 1 removed, 21 unchanged
Prologis, Inc. carried out an evaluation under the supervision and with the participation of management, including the Chief Executive Officer and Chief Financial Officer, of the effectiveness of the disclosure controls and procedures (as defined in Rule 13a-15(e) under the Securities and Exchange Act of 1934 (the “Exchange Act”)) at December 31, [removed: 2023.][added: 2024.]
Subsequent to December 31, [removed: 2023,] [added: 2024,] there were no significant changes in the internal controls or in other factors that could significantly affect these controls, including any corrective actions with regard to significant deficiencies and material weaknesses.
There have not been any changes in Prologis, Inc.’s internal control over financial reporting (as defined in Rules 13a-15(f) and 15(d)-15(f) under the Exchange Act) that occurred during the quarter ended December 31, [removed: 2023,] [added: 2024,] that have materially affected, or are reasonably likely to materially affect, Prologis, Inc.’s internal control over financial reporting.
Under the supervision and with the participation of management, including the Chief Executive Officer and Chief Financial Officer, an evaluation of the effectiveness of the internal control over financial reporting was conducted at December 31, [removed: 2023,] [added: 2024,] based on the criteria described in “Internal Control — Integrated Framework” (2013) issued by the Committee of Sponsoring Organizations of the Treadway Commission.
Based on this assessment, management determined that, at December 31, [removed: 2023,] [added: 2024,] the internal control over financial reporting was effective.
Our internal control over financial reporting at December 31, [removed: 2023,] [added: 2024,] has been audited by KPMG LLP, an independent registered public accounting firm, as stated in their attestation report, which is included herein.
Prologis, L.P. carried out an evaluation under the supervision and with the participation of management, including the Chief Executive Officer and Chief Financial Officer, of the effectiveness of the disclosure controls and procedures (as defined in Rule 13a-15(e) under the Exchange Act) at December 31, [removed: 2023.][added: 2024.]
There have not been any changes in Prologis, L.P.’s internal control over financial reporting (as defined in Rules 13a-15(f) and 15(d)-15(f) under the Exchange Act) that occurred during the quarter ended December 31, [removed: 2023,] [added: 2024,] that have materially affected, or are reasonably likely to materially affect, Prologis, L.P.’s internal control over financial reporting.
Also, projections of any evaluation of effectiveness to future periods are subject to the risk that controls may [added: become inadequate because of changes in conditions, or that the degree of compliance with the policies or procedures may deteriorate.]
Subsequent to December 31, 2024, there were no significant changes in the internal controls or in other factors that could significantly affect these controls, including any corrective actions with regard to significant deficiencies and material weaknesses.
Under the supervision and with the participation of management, including the Chief Executive Officer and Chief Financial Officer, an evaluation of the effectiveness of the internal control over financial reporting was conducted at December 31, 2024, based on the criteria described in “Internal Control — Integrated Framework” (2013) issued by the Committee of Sponsoring Organizations of the Treadway Commission.
Based on this assessment, management determined that, at December 31, 2024, the internal control over financial reporting was effective.
become inadequate because of changes in conditions, or that the degree of compliance with the policies or procedures may deteriorate.
Item 9B. Other Information
1 rewritten, 0 added, 0 removed, 0 unchanged
During the period ended December 31, [removed: 2023,] [added: 2024,] none of our directors or officers (as defined in Rule 16a-1(f) under the Exchange Act) adopted or terminated any Rule 10b5-1 trading arrangement or non-Rule 10b5-1 trading arrangement (as such terms are defined in Item 408 of Regulation S-K under the Act).
Item 10. Directors, Executive Officers and Corporate Governance
1 rewritten, 0 added, 0 removed, 0 unchanged
The information required by this item is incorporated herein by reference to, including relevant sections in our [removed: 2023] [added: 2025] Proxy Statement, under the captions entitled Board of Directors and Corporate Governance; Executive Officers; Executive Compensation; Director Compensation; Security Ownership; Equity Compensation Plans and Additional Information or will be provided in an amendment filed on Form 10-K/A.
Item 11. Executive Compensation
1 rewritten, 0 added, 0 removed, 0 unchanged
The information required by this item is incorporated herein by reference to the relevant sections in our [removed: 2023] [added: 2025] Proxy Statement, under the captions entitled Board of Directors and Corporate Governance; Executive Officers; Executive Compensation and Director Compensation or will be provided in an amendment filed on Form 10-K/A.
Item 12. Security Ownership of Certain Beneficial Owners and Management and Related Stockholder Matters
1 rewritten, 0 added, 0 removed, 0 unchanged
The information required by this item is incorporated herein by reference to the relevant sections in our [removed: 2023] [added: 2025] Proxy Statement, under the captions entitled Security Ownership and Equity Compensation Plans or will be provided in an amendment filed on Form 10-K/A.
Item 13. Certain Relationships and Related Transactions, and Director Independence
1 rewritten, 0 added, 0 removed, 0 unchanged
The information required by this item is incorporated herein by reference to the relevant sections in our [removed: 2023] [added: 2025] Proxy Statement, under the caption entitled Board of Directors and Corporate Governance or will be provided in an amendment filed on Form 10-K/A.
Item 14. Principal Accounting Fees and Services
1 rewritten, 0 added, 0 removed, 1 unchanged
The information required by this item is incorporated herein by reference to the relevant sections in our [removed: 2023] [added: 2025] Proxy Statement, under the caption entitled Audit Matters or will be provided in an amendment filed on Form 10-K/A.
Item 15. Exhibits, Financial Statements and Schedules
1 rewritten, 0 added, 0 removed, 11 unchanged
(b) Exhibits: The Exhibits required by Item 601 of Regulation S-K are listed in the Index to the Exhibits on pages [removed: 102] [added: 103] to [removed: 113] [added: 115] of this report, which is incorporated herein by reference.
Item 16. Form 10-K Summary
807 rewritten, 503 added, 249 removed, 1,304 unchanged
| [Note 6. Assets Held for Sale or Contribution](#notesix) | [removed: 77] [added: 78] |
| [Note 9. Stockholders' Equity of Prologis, Inc.](#noteten) | [removed: 82] [added: 83] |
| [Note 11. Noncontrolling Interests](#notetwelve) | [removed: 84] [added: 85] |
| [Note 13. Income Taxes](#notefourteen) | [removed: 87] [added: 88] |
| [Note 14. Earnings Per Common Share or Unit](#eps) | [removed: 89] [added: 90] |
| [Note 15. Financial Instruments and Fair Value Measurements](#notesixteen) | [removed: 90] [added: 91] |
| [Note 16. Commitments and Contingencies](#noteseventeen) | [removed: 93] [added: 94] |
| [Note 17. [removed: Business] [added: Reportable] Segments](#noteeighteen) | 94 |
| [Note 18. Supplemental Cash Flow Information](#notenineteen) | [removed: 96] [added: 97] |
| [Note 19. Selected Quarterly Financial Data (Unaudited)](#notetwenty) | [removed: 97] [added: 98] |
| [Schedule III — Real Estate and Accumulated Depreciation](#schedule_iii_real_estate_accumulated_dep) | [removed: 99] [added: 100] |
[Table of [removed: Contents](#toc)][added: Contents](#toc_page)]
We have audited the accompanying consolidated balance sheets of Prologis, Inc. and subsidiaries (the Company) as of December 31, [removed: 2023,] [added: 2024] and [removed: 2022,] [added: 2023,] the related consolidated statements of income, comprehensive income, equity, and cash flows for each of the years in the three-year period ended December 31, [removed: 2023,] [added: 2024,] and the related notes and financial statement schedule III (collectively, the consolidated financial statements).
In our opinion, the consolidated financial statements present fairly, in all material respects, the financial position of the Company as of December 31, [removed: 2023,] [added: 2024] and [removed: 2022,] [added: 2023,] and the results of its operations and its cash flows for each of the years in the three-year period ended December 31, [removed: 2023,] [added: 2024,] in conformity with U.S. generally accepted accounting principles.
We also have audited, in accordance with the standards of the Public Company Accounting Oversight Board (United States) (PCAOB), the Company’s internal control over financial reporting as of December 31, [removed: 2023,] [added: 2024,] based on criteria established in *Internal Control – Integrated Framework (2013)* issued by the Committee of Sponsoring Organizations of the Treadway Commission, and our report dated February [removed: 13, 2024] [added: 14, 2025] expressed an unqualified opinion on the effectiveness of the Company’s internal control over financial reporting.
As discussed in Notes 2 and 4 to the consolidated financial statements, the Company had [removed: $75,435] [added: $78,279] million of operating properties as of December 31, [removed: 2023.][added: 2024.]
We identified the assessment of the Company’s evaluation of the expected holding period for [added: certain] operating properties as a critical audit matter.
We have audited the accompanying consolidated balance sheets of Prologis, L.P. and subsidiaries (the Operating Partnership) as of December 31, [removed: 2023,] [added: 2024] and [removed: 2022,] [added: 2023,] the related consolidated statements of income, comprehensive income, capital, and cash flows for each of the years in the three-year period ended December 31, [removed: 2023,] [added: 2024,] and the related notes and financial statement schedule III (collectively, the consolidated financial statements).
In our opinion, the consolidated financial statements present fairly, in all material respects, the financial position of the Operating Partnership as of December 31, [removed: 2023,] [added: 2024] and [removed: 2022,] [added: 2023,] and the results of its operations and its cash flows for each of the years in the three-year period ended December 31, [removed: 2023,] [added: 2024,] in conformity with U.S. generally accepted accounting principles.
As discussed in Notes 2 and 4 to the consolidated financial statements, the Operating Partnership had [removed: $75,435] [added: $78,279] million of operating properties as of December 31, [removed: 2023.][added: 2024.]
We identified the assessment of the Operating Partnership’s evaluation of the expected holding period for [added: certain] operating properties as a critical audit matter.
We have audited Prologis, Inc. and subsidiaries' (the Company) internal control over financial reporting as of December 31, [removed: 2023,] [added: 2024,] based on criteria established in *Internal Control – Integrated Framework (2013)* issued by the Committee of Sponsoring Organizations of the Treadway Commission.
In our opinion, the Company maintained, in all material respects, effective internal control over financial reporting as of December 31, [removed: 2023,] [added: 2024,] based on criteria established in *Internal Control – Integrated Framework (2013)* issued by the Committee of Sponsoring Organizations of the Treadway Commission.
We also have audited, in accordance with the standards of the Public Company Accounting Oversight Board (United States) (PCAOB), the consolidated balance sheets of the Company as of December 31, [removed: 2023,] [added: 2024] and [removed: 2022,] [added: 2023,] the related consolidated statements of income, comprehensive income, equity, and cash flows for each of the years in the three-year period ended December 31, [removed: 2023,] [added: 2024,] and the related notes and financial statement schedule III (collectively, the consolidated financial statements), and our report dated February [removed: 13, 2024] [added: 14, 2025] expressed an unqualified opinion on those consolidated financial statements.
| | [added: | 2024 | | | |] 2023 | | | | 2022 | | |
| Investments in real estate properties | $ | [removed: 88,666,575] [added: 91,246,176] | | | $ | [removed: 81,623,396] [added: 88,666,575] | |
| Less accumulated depreciation | | [removed: 10,931,485] [added: 12,758,159] | | | | [removed: 9,036,085] [added: 10,931,485] | |
| Net investments in real estate properties | | [removed: 77,735,090] [added: 78,488,017] | | | | [removed: 72,587,311] [added: 77,735,090] | |
| Investments in and advances to unconsolidated entities | | [removed: 9,543,970] [added: 10,079,448] | | | | [removed: 9,698,898] [added: 9,543,970] | |
| Assets held for sale or contribution | | [removed: 461,657] [added: 248,511] | | | | [removed: 531,257] [added: 461,657] | |
| Net investments in real estate | | [removed: 87,740,717] [added: 88,815,976] | | | | [removed: 82,817,466] [added: 87,740,717] | |
| Cash and cash [removed: equivalents] [added: equivalents, beginning of year] | | [added: |] 530,388 | | | | 278,483 | | [added: | | 556,117 | |]
| Other assets | | [removed: 4,749,735] [added: 5,194,342] | | | | [removed: 4,801,499] [added: 4,749,735] | |
| Total assets | $ | [removed: 93,020,840] [added: 95,328,909] | | | $ | [removed: 87,897,448] [added: 93,020,840] | |
| Debt | $ | [removed: 29,000,501] [added: 30,879,263] | | | $ | [removed: 23,875,961] [added: 29,000,501] | |
| Accounts payable and accrued expenses | | [removed: 1,766,018] [added: 1,769,327] | | | | [removed: 1,711,885] [added: 1,766,018] | |
| Other liabilities | | [removed: 4,430,601] [added: 4,063,549] | | | | [removed: 4,446,509] [added: 4,430,601] | |
| Total liabilities | | [removed: 35,197,120] [added: 36,712,139] | | | | [removed: 30,034,355] [added: 35,197,120] | |
| Series Q preferred stock at stated liquidation preference of $50 per share; $0.01 par [removed: value; 1,279] [added: value;1,279] shares issued and outstanding and 100,000 preferred shares authorized at December 31, [removed: 2023] [added: 2024] and [removed: 2022] [added: 2023] | | 63,948 | | | | 63,948 | |
| Common stock; $0.01 par value; [removed: 924,391] [added: 926,283] and [removed: 923,142] [added: 924,391] shares issued and outstanding at December 31, [removed: 2023] [added: 2024] and [removed: 2022,] [added: 2023,] respectively | | [removed: 9,244] [added: 9,263] | | | | [removed: 9,231] [added: 9,244] | |
February 14, 2025
[Table of Contents](#toc_page)
February 14, 2025
[Table of Contents](#toc_page)
February 14, 2025
[Table of Contents](#toc_page)
| | 2024 | | | | 2023 | | |
| Cash and cash equivalents | | 1,318,591 | | | | 530,388 | |
[Table of Contents](#toc_page)
[Table of Contents](#toc_page)
[Table of Contents](#toc_page)
| Consolidated net earnings | | \- | | | | \- | | | | \- | | | | \- | | | | \- | | | | 3,731,635 | | | | 216,300 | | | | 3,947,935 | |
| Effect of equity compensation plans | | \- | | | | 487 | | | | 5 | | | | 69,239 | | | | \- | | | | \- | | | | 170,187 | | | | 239,431 | |
| Redemption of noncontrolling interests | | \- | | | | 1,405 | | | | 14 | | | | 80,677 | | | | \- | | | | \- | | | | (82,341 | ) | | | (1,650 | ) |
| Foreign currency translation gains (losses), net | | \- | | | | \- | | | | \- | | | | \- | | | | 355,663 | | | | \- | | | | 5,211 | | | | 360,874 | |
| Unrealized gains (losses) on derivative contracts, net | | \- | | | | \- | | | | \- | | | | \- | | | | 38,323 | | | | \- | | | | 956 | | | | 39,279 | |
| Dividends ($3.84 per common share) and other distributions | | \- | | | | \- | | | | \- | | | | 268 | | | | \- | | | | (3,570,480 | ) | | | (295,701 | ) | | | (3,865,913 | ) |
| Balance at December 31, 2024 | $ | 63,948 | | | | 926,283 | | | $ | 9,263 | | | $ | 54,464,055 | | | $ | (120,215 | ) | | $ | (465,913 | ) | | $ | 4,665,632 | | | $ | 58,616,770 | |
[Table of Contents](#toc_page)
| Consolidated net earnings | | $ | 3,947,935 | | | $ | 3,253,145 | | | $ | 3,555,398 | |
| Depreciation and amortization | | | 2,580,519 | | | | 2,484,891 | | | | 1,812,777 | |
[Table of Contents](#toc_page)
| | 2024 | | | | 2023 | | |
| Investments in real estate properties | $ | 91,246,176 | | | $ | 88,666,575 | |
| Net investments in real estate | | 88,815,976 | | | | 87,740,717 | |
| Cash and cash equivalents | | 1,318,591 | | | | 530,388 | |
| Other assets | | 5,194,342 | | | | 4,749,735 | |
| Debt | $ | 30,879,263 | | | $ | 29,000,501 | |
| Accounts payable and accrued expenses | | 1,769,327 | | | | 1,766,018 | |
| Other liabilities | | 4,063,549 | | | | 4,430,601 | |
| Total liabilities | | 36,712,139 | | | | 35,197,120 | |
[Table of Contents](#toc_page)
| Rental | | $ | 7,514,705 | | | $ | 6,818,542 | | | $ | 4,913,171 | |
| Strategic capital | | | 671,907 | | | | 1,200,232 | | | | 1,039,585 | |
| Development management and other | | | 14,998 | | | | 4,695 | | | | 20,936 | |
| Rental | | | 1,765,385 | | | | 1,624,793 | | | | 1,205,738 | |
| Strategic capital | | | 291,856 | | | | 385,542 | | | | 303,356 | |
| General and administrative | | | 418,765 | | | | 390,406 | | | | 331,083 | |
| Depreciation and amortization | | | 2,580,519 | | | | 2,484,891 | | | | 1,812,777 | |
| Other | | | 47,044 | | | | 53,354 | | | | 40,336 | |
[Index to Item 15](#index)
February 13, 2024
| Balance at January 1, 2021 | $ | 63,948 | | | | 739,381 | | | $ | 7,394 | | | $ | 35,488,634 | | | $ | (1,193,739 | ) | | $ | (2,394,690 | ) | | $ | 4,353,033 | | | $ | 36,324,580 | |
| Consolidated net earnings | | \- | | | | \- | | | | \- | | | | \- | | | | \- | | | | 2,939,723 | | | | 208,867 | | | | 3,148,590 | |
| Effect of equity compensation plans | | \- | | | | (389 | ) | | | (4 | ) | | | 38,114 | | | | \- | | | | \- | | | | 78,062 | | | | 116,172 | |
| Redemption of noncontrolling interests | | \- | | | | 835 | | | | 8 | | | | 37,238 | | | | \- | | | | \- | | | | (190,482 | ) | | | (153,236 | ) |
| Consolidation of other venture | | \- | | | | \- | | | | \- | | | | \- | | | | \- | | | | \- | | | | 25,759 | | | | 25,759 | |
| Acquisitions by noncontrolling interests | | \- | | | | \- | | | | \- | | | | \- | | | | \- | | | | \- | | | | 130,416 | | | | 130,416 | |
| Foreign currency translation gains, net | | \- | | | | \- | | | | \- | | | | \- | | | | 298,413 | | | | \- | | | | 7,516 | | | | 305,929 | |
| Dividends ($2.52 per common share) and other distributions | | \- | | | | \- | | | | \- | | | | (31 | ) | | | \- | | | | (1,872,861 | ) | | | (375,054 | ) | | | (2,247,946 | ) |
| Proceeds from issuance of common stock | | | \- | | | | \- | | | | 743 | |
| Balance at January 1, 2021 | | 1,279 | | $ | 63,948 | | | 739,381 | | $ | 31,907,599 | | | 12,142 | | $ | 523,954 | | | 8,595 | | $ | 345,553 | | $ | 3,483,526 | | $ | 36,324,580 | |
| Consolidated net earnings | | \- | | | \- | | | \- | | | 2,939,723 | | | \- | | | 50,034 | | | \- | | | 31,758 | | | 127,075 | | | 3,148,590 | |
| Effect of equity compensation plans | | \- | | | \- | | | (389 | ) | | 38,110 | | | 1,286 | | | 78,062 | | | \- | | | \- | | | \- | | | 116,172 | |
| Redemption of limited partnership units | | \- | | | \- | | | 835 | | | 37,246 | | | (2,105 | ) | | (190,482 | ) | | \- | | | \- | | | \- | | | (153,236 | ) |
| Consolidation of other venture | | \- | | | \- | | | \- | | | \- | | | \- | | | \- | | | \- | | | \- | | | 25,759 | | | 25,759 | |
| Issuance of units related to acquisitions | | \- | | | \- | | | \- | | | \- | | | 1,031 | | | 130,416 | | | \- | | | \- | | | \- | | | 130,416 | |
| Foreign currency translation gains (losses), net | | \- | | | \- | | | \- | | | 298,413 | | | \- | | | 4,982 | | | \- | | | 3,226 | | | (692 | ) | | 305,929 | |
| Unrealized gains on derivative contracts, net | | \- | | | \- | | | \- | | | 17,073 | | | \- | | | 285 | | | \- | | | 184 | | | \- | | | 17,542 | |
| Reallocation of capital | | \- | | | \- | | | \- | | | (2,347 | ) | | \- | | | 133 | | | \- | | | 2,214 | | | \- | | | \- | |
| Distributions ($2.52 per common unit) and other | | \- | | | \- | | | \- | | | (1,872,892 | ) | | \- | | | (40,287 | ) | | \- | | | (22,233 | ) | | (312,534 | ) | | (2,247,946 | ) |
| Proceeds from issuance of common partnership units in exchange for contributions from Prologis, Inc. | | | \- | | | | \- | | | | 743 | |
between in-place and market rents.
contribution are generally newly developed assets we intend to contribute to an unconsolidated co-investment venture within twelve months.
We adjusted our proportionate share of net earnings or losses recognized in future periods to reflect the entities’ recorded depreciation expense as if it were computed on our lower basis in the contributed properties rather than on the entity’s basis.
For deferred gains from partial sales recorded prior to the adoption of the revenue recognition standard, we continue to recognize these gains over the lives of the underlying real estate properties or at the time of disposition to a third party.
If our ownership interest in an unconsolidated entity decreases and the decrease is expected to be permanent, we recognize the amounts relating to previously deferred gains to coincide with our new ownership interest.
The standard is effective for us on January 1, 2024.
Energy assets include solar panels, battery storage and mobility solutions.
Included in 2021 is our acquisition of additional ownership interest in certain unconsolidated other ventures that we acquired from our partners and subsequently resulted in the consolidation of the real estate assets.
In 2023 and 2021, we sold our ownership interest in unconsolidated joint ventures.
The net proceeds and gains from these transactions are included in the table.
| | | | | |
| 2024 | | $ | 4,985,561 | |
| 2025 | | | 4,793,495 | |
| 2026 | | | 4,250,129 | |
| 2027 | | | 3,514,299 | |
| 2028 | | | 2,753,907 | |
| Thereafter | | | 10,201,357 | |
| Total | | $ | 30,498,748 | |
An excerpt. Shown here: 40 of 807 rewritten, 40 of 503 added and 40 of 249 removed. The counts are complete. For every sentence, read Item 16. Form 10-K Summary in the FY2024 filing and the FY2023 filing.