 filings.tools
Prologis (PLD) 10-K risk factor changes: FY2023 vs FY2022
The 2023-12-31 10-K against the 2022-12-31 one, compared heading by heading and sentence by sentence.
Item 1A101 rewritten16 added7 removed174 unchanged
All filing items1,909 rewritten1,120 added570 removed1,366 unchanged
Summary
counted, not written
- Item 1A headings could not be compared: only 1 carried over between the two years, which usually means one filing was read wrongly, so none is reported as new or removed.
- Sentence by sentence, 1,120 added, 570 removed, 1,909 rewritten and 1,366 unchanged across 16 items that differ.
- New this year: Item 1C. Cybersecurity.
Sentences by item
24 items, with every count and a link to each item that changed
Underlined words on a shaded ground are new in FY2023; struck-through words were in FY2022. Sentences that are wholly new or wholly gone are labelled rather than marked.
Item 1A. Risk Factors
101 rewritten, 16 added, 7 removed, 174 unchanged
These risks relate to Prologis as well as our investments in consolidated and unconsolidated entities and include among others, (i) risks related to our global operations (ii) risks related to our business; (iii) risks related to financing and capital; [added: and] (iv) risks related to income [removed: taxes; and (v) general risks.][added: taxes.]
[removed: Risks] [added: Risks] Related to our Global [removed: Operations][added: Operations]
[removed: As] [added: As] a global company, we are subject to social, [removed: political] [added: geopolitical] and economic risks of doing business in many [removed: countries.][added: countries and our results of operations and financial condition may be materially and adversely affected.]
We conduct a significant portion of our business and employ a substantial number of people outside of the U.S. During [removed: 2022,] [added: 2023,] we generated approximately [removed: $1.0 billion] [added: $632 million] or [removed: 17.3%] [added: 7.9%] of our consolidated revenues from operations outside the U.S. Circumstances and developments related to international operations that could negatively affect us include, but are not limited to, the following factors:
[removed: | • |] difficulties and costs of staffing and managing international operations in certain geographies, including differing employment practices and labor issues; [removed: |]
[removed: | • |] local businesses and cultural factors that differ from our domestic standards and practices; [removed: |]
[removed: | • |] volatility in currencies and currency restrictions, which may prevent the availability of capital or the transfer of profits to the U.S.; [removed: |]
[removed: | • |] challenges in establishing effective controls and procedures to regulate operations in different geographies and to monitor compliance with applicable regulations, such as the Foreign Corrupt Practices Act, the United Kingdom (“U.K.”) Bribery Act and other similar laws; [removed: |]
[removed: | • | unexpected] changes in regulatory and environmental requirements, taxes, tariffs, trade wars and laws within the countries in which we operate; [removed: |]
[removed: | • |] the responsibility of complying with multiple and potentially conflicting laws, e.g., with respect to corrupt practices, [added: human rights,] employment and licensing; [removed: |]
[removed: | • | the impact of] [added: changes in general economic conditions from inflation, elevated interest rates,] regional or country-specific business cycles, [removed: military conflicts] [added: supply chain disruptions, economic downturns or recessions] and economic instability, including government shutdowns and withdrawals from the European Union or other international trade alliances or agreements; [removed: |]
[removed: | • |] political instability, uncertainty over property rights, [added: territorial disputes, military conflict, war or expansion of hostilities,] civil unrest, drug trafficking, political activism or the continuation or escalation of terrorist or gang activities; [removed: |]
[removed: | • |] foreign ownership restrictions in operations with the respective countries; and [removed: |]
[removed: | • |] access to capital may be more restricted, or unavailable on favorable terms or at all in certain locations. [removed: |]
[removed: Compliance] [added: Compliance] or failure to comply with regulatory requirements could result in substantial [removed: costs.][added: costs.]
[removed: Disruptions] [added: Disruptions] in the global capital and credit markets may adversely affect our operating results and financial [removed: condition.][added: condition.]
To the extent there is turmoil in the global financial markets, this turmoil has the potential to adversely affect (i) the value of our properties; (ii) the availability or the terms of financing that we have or may anticipate utilizing; (iii) our ability to make principal and [removed: interest payments on, or refinance any outstanding debt when due; and (iv) the ability of our customers to enter into new leasing transactions or satisfy rental payments under existing leases.]
[removed: The] [added: The] depreciation in the value of the foreign currency in countries where we have a significant investment may adversely affect our results of operations and financial [removed: position.][added: position.]
At December 31, [removed: 2022,] [added: 2023,] approximately [removed: $10.2] [added: $10.6] billion or [removed: 11.6%] [added: 11.4%] of our total consolidated assets were invested in a currency other than the U.S. dollar, principally the British pound sterling, Canadian dollar, [removed: euro] [added: euro,] and Japanese yen.
For the year ended December 31, [removed: 2022, $762.4] [added: 2023, $303.7] million or [removed: 17.2%] [added: 5.1%] of our total consolidated segment NOI was denominated in a currency other than the U.S. dollar.
[removed: A] [added: While we endeavor to manage this risk through our hedging and financing activities, a] significant change in the value of the foreign currency of one or more countries where we have a significant investment may have a material adverse effect on our business and, specifically, our U.S. dollar reported financial position and results of operations.
[removed: Our] [added: Our] hedging of foreign currency and interest rate risk may not effectively limit our exposure to these [removed: risks.][added: risks.]
In addition, we occasionally use interest rate [removed: swap] contracts to manage interest rate risk and limit the impact of future interest rate changes on earnings and cash flows.
[removed: Risks] [added: Risks] Related to our [removed: Business][added: Business]
[removed: General] [added: General] economic conditions and other events or occurrences that affect areas in which our properties are geographically concentrated, may impact financial [removed: results.][added: results.]
At December 31, [removed: 2022, 30.3%] [added: 2023, 30.0%] of our consolidated operating properties or [removed: $21.0] [added: $22.7] billion (based on consolidated gross book value, or investment before depreciation) were located in California (Central Valley, San Francisco Bay Area and Southern California markets), which represented [removed: 23.6%] [added: 23.2%] of the aggregate square footage of our operating properties and [removed: 33.0%] [added: 31.7%] of our consolidated operating property NOI.
Of these markets, no single market contributed more than 10% of our total [added: consolidated investment before depreciation in operating properties, with the exception of New Jersey/New York City at 10.6%.]
[removed: Real] [added: Real] estate investments are not as liquid as certain other types of assets, which may reduce economic returns to [removed: investors.][added: investors.]
[removed: Our] [added: Our] investments are concentrated in the logistics sector and our business would be adversely affected by an economic downturn in that [removed: sector.][added: sector.]
[removed: Investments] [added: Investments] in real estate properties are subject to risks that could adversely affect our [removed: business.][added: business.]
[removed: | • |] local conditions, such as oversupply or a reduction in demand; [removed: |]
[removed: | • |] technological changes, such as reconfiguration of supply chains, autonomous vehicles, robotics, 3D printing or other technologies; [removed: |]
[removed: | • |] the attractiveness of our properties to potential customers and competition from other available properties; [removed: |]
[removed: | • |] increasing costs of maintaining, insuring, renovating and making improvements to our properties; [removed: |]
[removed: | • |] our ability to reposition our properties due to changes in the business and logistics needs of our customers; [removed: |]
[removed: | • |] our ability to lease the properties at favorable rates and control variable operating costs; and [removed: |]
[removed: | • |] governmental and environmental regulations and the associated potential liability under, and changes in, environmental, zoning, usage, tax, tariffs and other laws. [removed: |]
Our customers may be [removed: unable to] [added: unable to] meet their lease [removed: obligations or] [added: obligations,] we may be unable to lease vacant space or renew leases or re-lease space on favorable terms as leases expire.
At December 31, [removed: 2022,] [added: 2023,] our top 10 customers accounted for [removed: 16.4%] [added: 15.8%] of our consolidated NER and [removed: 14.4%] [added: 14.5%] of our O&M NER.
[removed: A customer may experience a downturn in its business,] which may cause the loss of the customer or may weaken its financial condition, resulting in the customer’s failure to make rental payments when due or requiring a restructuring that might reduce cash flow from the lease.
[Table of Contents](#toc_page)
public health crises, such as outbreaks of global pandemics or contagious diseases;
[Table of Contents](#toc_page)
interest payments on, or refinance any outstanding debt when due; and (iv) the ability of our customers to enter into new leasing transactions or satisfy rental payments under existing leases.
[Table of Contents](#toc_page)
A customer may experience a downturn in its business,
[Table of Contents](#toc_page)
Additionally, rising inflation or costs could negatively impact our net operating income on existing leases with contractual guaranteed base rent and fixed charges, inclusive of certain rental expenses.
[Table of Contents](#toc_page)
This may also require us to acquire the properties in order to maintain an investment in the portfolio; and
[Table of Contents](#toc_page)
[Table of Contents](#toc_page)
is recourse debt, then we would remain obligated for any mortgage debt or other financial obligations related to the properties.
[Table of Contents](#toc_page)
[Table of Contents](#toc_page)
REIT will generally be treated as income that qualifies for purposes of the REIT 95% and 75% gross income tests.
| --- | --- |
consolidated investment before depreciation in operating properties, with the exception of New Jersey/New York City.
In addition, third parties may sue the owner or
These short-term
other property, including, in limited circumstances, our own stock.
General Risks
Our business may be materially and adversely affected by the impact of global pandemics.
An excerpt. Shown here: 40 of 101 rewritten, all 16 added and all 7 removed. The counts are complete. For every sentence, read Item 1A. Risk Factors in the FY2023 filing and the FY2022 filing.
Item 7. Management’s Discussion and Analysis of Financial Condition and Results of Operations
309 rewritten, 188 added, 66 removed, 169 unchanged
A discussion regarding our financial condition and results of operations for [removed: 2022] [added: 2023] compared to [removed: 2021] [added: 2022] is presented below.
Information on [removed: 2020] [added: 2021] is included in graphs only to show year over year trends in our results of operations and operating metrics.
Our financial condition for [removed: 2020,] [added: 2021,] results of operations for [removed: 2020] [added: 2021,] and [removed: 2021] [added: 2022] compared to [removed: 2020] [added: 2021] and details on the [removed: acquisitions] [added: acquisition] of [removed: Industrial Property Trust Inc. (“IPT” or the “IPT Transaction”) and Liberty Property Trust] [added: Duke Realty Corporation] and [removed: Liberty Property] [added: Duke Realty] Limited Partnership [removed: (“Liberty”] [added: (collectively "Duke"] or the [removed: “Liberty Transaction”)] [added: "Duke Transaction") is] referenced throughout this document [added: and] can be found under Item 7.
Management’s Discussion and Analysis of Financial Condition and Results of Operations, which is incorporated by reference herein to our Annual Report on [Form [removed: 10-K](https://www.sec.gov/ix?doc=/Archives/edgar/data/1045609/000156459022004436/pld-10k_20211231.htm)] [added: 10-K](https://www.sec.gov/ix?doc=/Archives/edgar/data/1045609/000156459023001902/pld-10k_20221231.htm)] for the fiscal year ended December 31, [removed: 2021,] [added: 2022,] filed with the SEC on February [removed: 9, 2022,] [added: 14, 2023,] and is available on the SEC’s website at www.sec.gov and our Investor Relations website at www.ir.prologis.com.
[removed: MANAGEMENT’S OVERVIEW][added: MANAGEMENT’S OVERVIEW]
[removed: Summary of 2022][added: | 2022 | | | | | | | | | | | | | | | | | | | | |]
[removed: Strong demand and low vacancy] [added: Market rents continued to grow] in [added: most of] the global logistics [removed: markets drove increases in market rents throughout the year,] [added: markets,] which [removed: translated into] [added: along with our existing lease mark-to-market, drove] significant rent change on rollover and same-store growth in our O&M portfolio.
Our O&M operating portfolio occupancy was [removed: 98.2%] [added: 97.6%] at December 31, [removed: 2022] [added: 2023] and rent change on leases [added: that] commenced during [removed: 2022] [added: the year] was [removed: 48.0%,] [added: 76.4%,] on a net effective [removed: basis,] [added: basis] based on our ownership share.
We believe we are [removed: well-positioned] [added: well positioned] to organically grow revenues [added: over the long-term] given the [removed: increase] [added: cumulative growth] in market rents over the last several years and our [added: existing] high lease mark-to-market.
We completed the following significant activities in [removed: 2022,] [added: 2023,] as described in the Notes to the Consolidated Financial Statements:
[removed: | • |] We generated net proceeds of [removed: $2.7] [added: $2.1] billion and realized net gains of [removed: $1.2 billion,] [added: $623 million,] principally from the contribution of properties to our unconsolidated co-investment ventures in [removed: Europe and] [added: Europe,] Japan and [removed: dispositions] [added: Mexico and the sale] of [removed: non-strategic] [added: a U.S. portfolio of] assets to [removed: third parties, primarily in the U.S. |][added: a third-party.]
[removed: | • |] We earned promotes aggregating [removed: $505] [added: $675] million [removed: ($386] [added: ($495] million net of related strategic capital expenses), primarily during the [removed: third] [added: second] quarter of [removed: 2022] [added: 2023] from the third-party investors in [removed: PELF] [added: USLF] in [removed: Europe. |][added: the U.S.]
[removed: | • |] At December 31, [removed: 2022,] [added: 2023,] we had total available liquidity of [removed: $4.1] [added: $6.0] billion, [removed: with aggregate availability under] [added: including borrowing capacity on] our credit facilities of [removed: $3.9] [added: $5.5] billion and unrestricted cash balances of [removed: $278] [added: $530] million. [removed: |]
| | | | [removed: Aggregate Principal] | [added: Aggregate Principal] | | | | | | | [removed: Issuance] [added: | Issuance] Date Weighted [removed: Average | |] [added: Average] | | | | | | |
| | [removed: Issuance Date] | [removed: | Borrowing Currency] [added: Issuance Date] | | [added: Borrowing Currency] | | [removed: USD (1)] | | [added: USD (1)] | | [removed: Interest Rate] | | [added: Interest Rate] | | [removed: Years] [added: Years] | | | | [removed: Maturity Dates] [added: Maturity Dates] |
[removed: | | (1) |] The exchange rate used to calculate into U.S. dollars was the spot rate at the settlement date. [removed: |]
Below is our NOI by segment per [removed: our] [added: the] Consolidated Financial Statements and a reconciliation of NOI by segment to *Operating Income* per the Consolidated Financial Statements (in millions):
| Rental revenues | | $ | [removed: 4,913] [added: 6,819] | | | $ | [removed: 4,148] [added: 4,913] | |
| Development management and other revenues | | | [removed: 21] [added: 5] | | | | [removed: 20] [added: 21] | |
| Rental expenses | | | [removed: (1,206] [added: (1,625] | ) | | | [removed: (1,041] [added: (1,206] | ) |
| Other expenses | | | [removed: (40] [added: (54] | ) | | | [removed: (22] [added: (40] | ) |
| Real Estate Segment – NOI | | | [removed: 3,688] [added: 5,145] | | | | [removed: 3,105] [added: 3,688] | |
| Strategic capital revenues | | | [removed: 1,040] [added: 1,200] | | | | [removed: 591] [added: 1,040] | |
| Strategic capital expenses | | | [removed: (304] [added: (385] | ) | | | [removed: (207] [added: (304] | ) |
| Strategic Capital [removed: Segment–] [added: Segment –] NOI | | | [removed: 736] [added: 815] | | | | [removed: 384] [added: 736] | |
| General and administrative expenses | | | [removed: (331] [added: (390] | ) | | | [removed: (294] [added: (331] | ) |
| Depreciation and amortization expenses | | | [removed: (1,813] [added: (2,485] | ) | | | [removed: (1,578] [added: (1,813] | ) |
| [removed: Operating] [added: Operating] income before gains on real estate transactions, [removed: net] [added: net] | | | [removed: 2,280] [added: 3,085] | | | | [removed: 1,617] [added: 2,280] | |
| Gains on dispositions of development properties and land, net | | | [removed: 598] [added: 462] | | | | [removed: 817] [added: 598] | |
| Gains on other dispositions of investments in real estate, net | | | [removed: 589] [added: 161] | | | | [removed: 773] [added: 589] | |
| [removed: Operating income] [added: Operating income] | | [removed: $] [added: $] | [removed: 3,467] [added: 3,708] | | | [removed: $] [added: $] | [removed: 3,207] [added: 3,467] | |
[removed: Real] [added: Real] Estate [removed: Segment][added: Segment]
We allocate the costs of our property management and leasing functions to the Real Estate Segment through *Rental Expenses* and the Strategic Capital Segment through *Strategic Capital [removed: Expenses*] [added: Expenses,* both in the Consolidated Financial Statements,] based on the square footage of the relative portfolios.
| [removed: Real] [added: Real] Estate Segment – [removed: NOI] [added: NOI] | | [removed: $] [added: $] | [removed: 3,688] [added: 5,145] | | | [removed: $] [added: $] | [removed: 3,105] [added: 3,688] | |
The change in Real Estate Segment (“RES”) NOI in [removed: 2022] [added: 2023] compared to [removed: 2021] [added: 2022] of approximately [removed: $583 million] [added: $1.5 billion] was impacted by the following activities (in millions):
[removed: 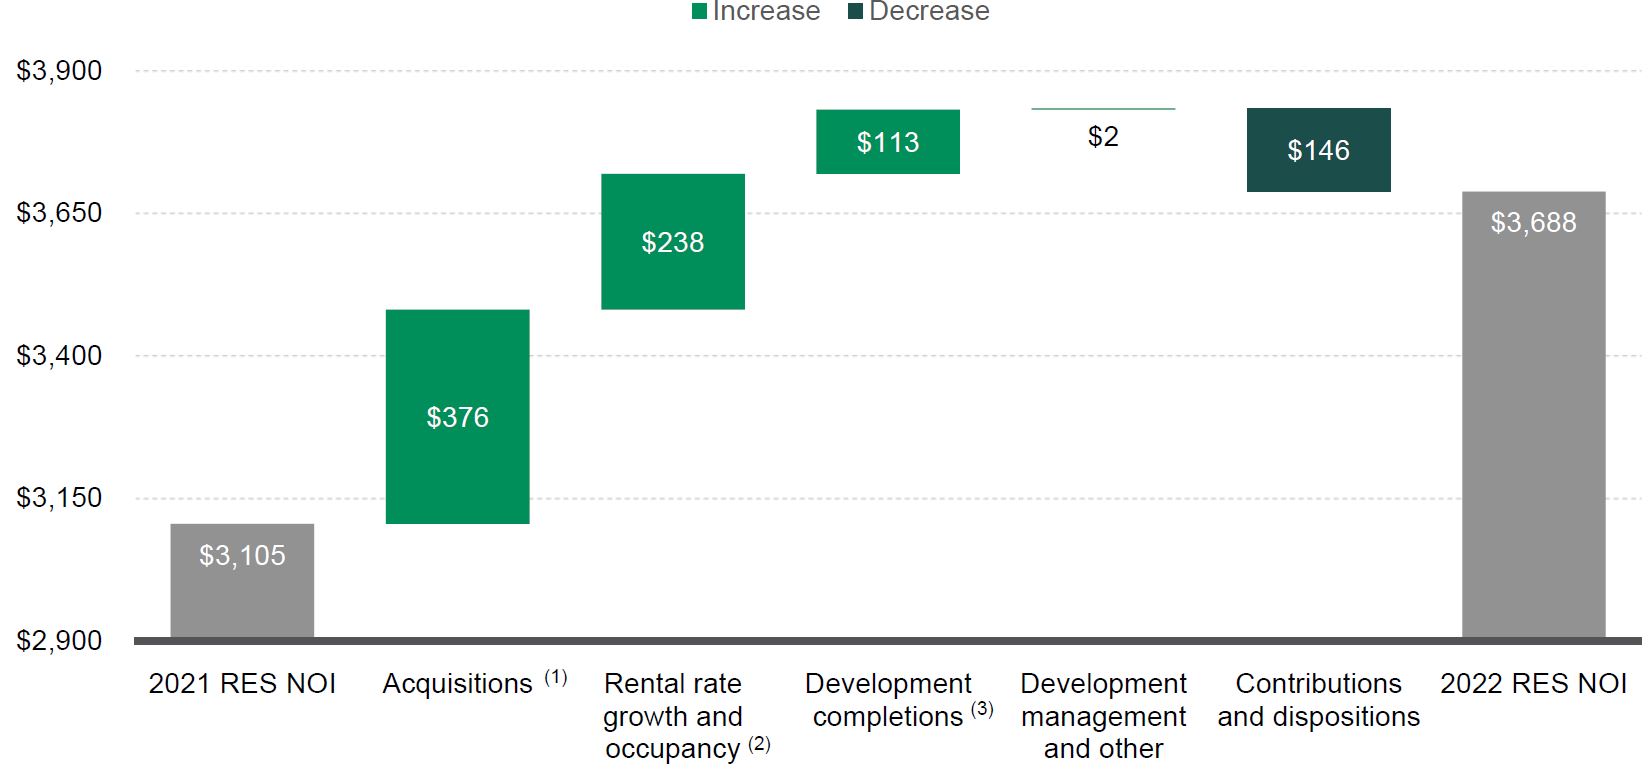][added: ]
[removed: | (2) | During both periods, we experienced positive rental rate growth. Rental rate growth is a combination of higher rental rates on rollover of leases (or rent change) and contractual rent increases on existing leases.] If a lease has a contractual rent increase driven by a metric that is not known at the time the lease commences, such as the consumer price index or a similar metric, the rent increase is not included in rent leveling and therefore impacts the rental revenue we recognize. [removed: Significant rent change during both periods continues to be a key driver in increasing rental income. See below for key metrics on rent change on rollover and occupancy. |]
[removed: | (3) |] We calculate changes in NOI from development completions period over period by comparing the change in NOI generated on the pool of developments that completed on or after January 1, [removed: 2021] [added: 2022] through December 31, [removed: 2022. |][added: 2023.]
Below are key operating metrics of our consolidated operating [removed: portfolio, which excludes non-strategic industrial properties.][added: portfolio:]
[removed: 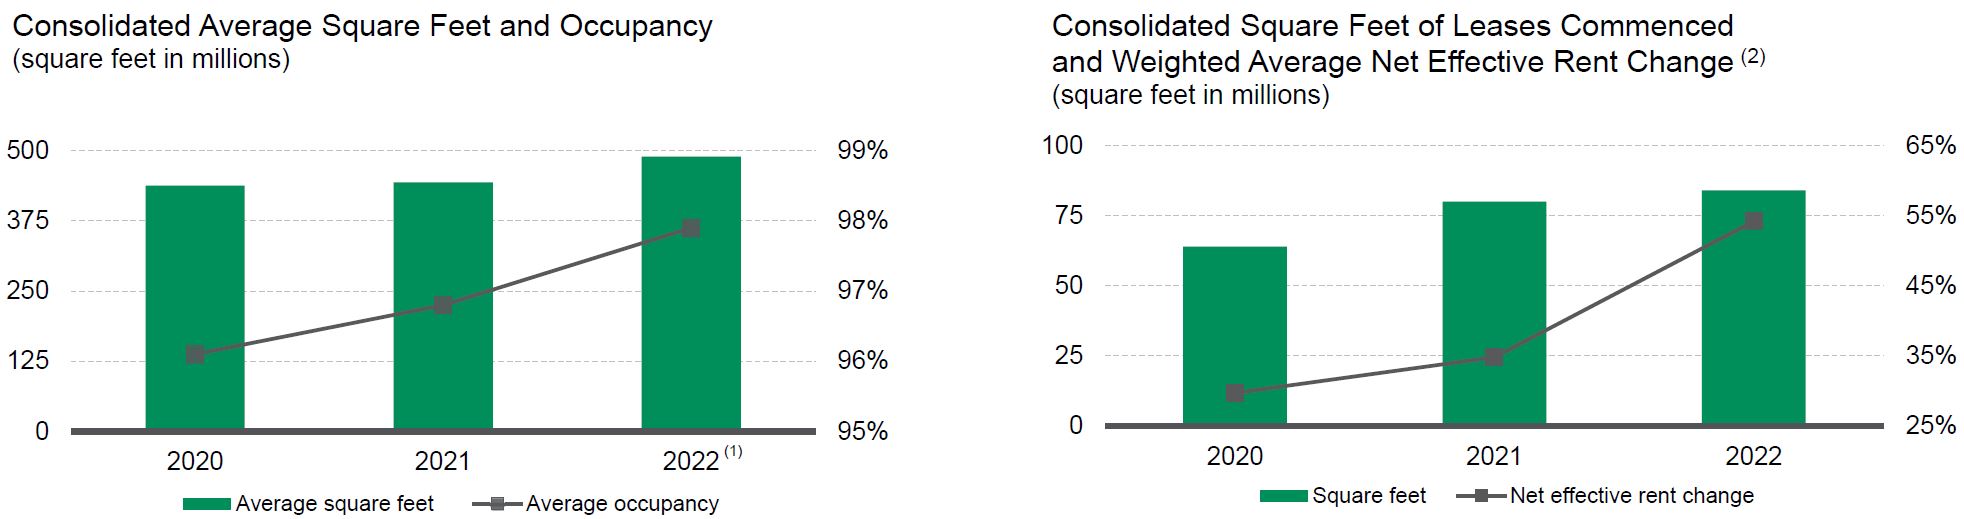][added: 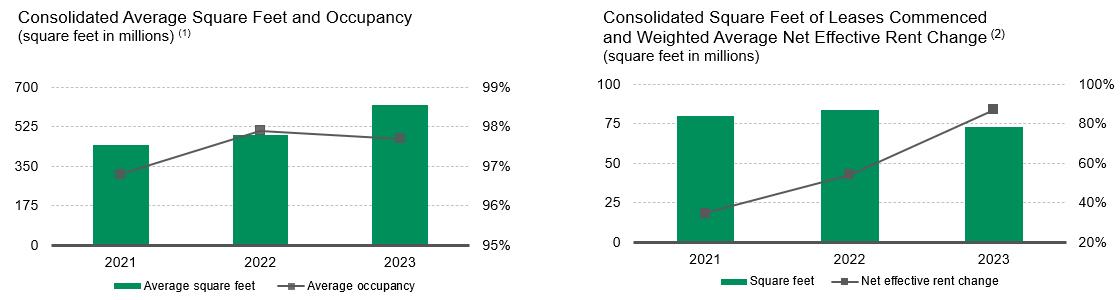]
Summary of 2023
Our operating results were strong in 2023.
While uncertainties remain in the economic and geopolitical environment, our 2023 results are representative of the prospects we see for our business.
On June 29, 2023, we acquired a real estate portfolio comprised of 70 operating properties in the U.S., aggregating 14 million square feet, for cash consideration of $3.1 billion.
This activity also includes the sale of our investment in an unconsolidated office joint venture.
In April 2023, we formed PJLF, an unconsolidated co-investment venture in Japan, with two investors through the initial contribution of assets for which we received cash and equity ownership.
We made additional contributions to PJLF during 2023.
At December 31, 2023, our ownership interest was 16.3%.
At December 31, 2023, our total debt portfolio of $29.0 billion had a weighted average maturity of 9 years and an effective interest rate of 3.0%.
Our financing activities during the year included the following:
On April 5, 2023, we amended and restated our 2021 global senior credit facility (the "2021 Global Facility") as the 2023 Global Facility, increasing its borrowing capacity to $3.0 billion and extended the initial maturity date to June 2027.
On August 25, 2023, we amended and restated the Japanese yen revolver, increasing its borrowing capacity for total commitments of ¥58.5 billion ($414 million at December 31, 2023) and extended the initial maturity date to August 2027.
[Table of Contents](#toc_page)
In the third quarter of 2023, we entered into Chinese renminbi term loans totaling CN¥1.7 billion ($239 million) with an issuance date weighted average interest rate of 3.5% maturing between September 2024 to 2026.
We issued senior notes of $5.4 billion (principal in millions):
| | | | | | | | | | | | | | | | | | | |
| --- | --- | --- | --- | --- | --- | --- | --- | --- | --- | --- | --- | --- | --- | --- | --- | --- | --- | --- |
| | | January | | € | 1,250 | | | $ | 1,354 | | | 4.1% | | | 13.8 | | | January 2030 – 2043 |
| | | March | | $ | 1,200 | | | $ | 1,200 | | | 4.9% | | | 17.7 | | | June 2033 – 2053 |
| | | May | | € | 750 | | | $ | 809 | | | 4.6% | | | 10.0 | | | May 2033 |
| | | June | | $ | 2,000 | | | $ | 2,000 | | | 5.1% | | | 13.2 | | | June 2028 – 2053 |
| | | Total | | | | | | $ | 5,363 | | | 4.7% | | | 13.9 | | | |
| | | | | | | | | | | | | | | | | | | |
(1)
In January 2024, we issued senior notes of $1.3 billion with weighted average effective interest rates of 5.2% and a weighted average maturity of 17 years.
In February 2024, we issued senior notes of CN¥ 1.5 billion ($211 million) with an effective interest rate of 3.6% and a maturity of 3 years.
RESULTS OF OPERATIONS
[Table of Contents](#toc_page)
| | | 2023 | | | | 2022 | | |
| Rental revenues | | $ | 6,819 | | | $ | 4,913 | |
| Development management and other revenues | | | 5 | | | | 21 | |
| Rental expenses | | | (1,625 | ) | | | (1,206 | ) |
| Other expenses | | | (54 | ) | | | (40 | ) |
(1)
Acquisition activity is principally due to the Duke Transaction on October 3, 2022 and a $3.1 billion real estate portfolio acquired in the U.S. on June 29, 2023.
Acquisition activity also includes the amortization of fair value lease adjustments to rental revenues due to in-place leases that were primarily below market at the time of the acquisition.
(2)
During both periods, we experienced positive rental rate growth.
Rental rate growth is a combination of higher rental rates on rollover of leases (or rent change) and contractual rent increases on existing leases.
Significant rent change during both periods continues to be a key driver in increasing rental income.
In 2022, our operating results were robust and we ended the year in a solid financial position.
Our 2022 results are representative of the prospects we see for our business despite challenging headwinds from the capital markets, ongoing inflation, steeply rising interest rates and the war and energy crisis in Europe that are all pressuring the global economy.
Due to current market conditions, we expect some decline in asset valuations in 2023 and therefore will continue to be disciplined as we evaluate capital deployment activities, including a focus on build-to-suit developments and a pause on contributions into our open-ended funds in the near term.
However, we will be cautious as we manage our business in this uncertain environment.
| • | On October 3, 2022, we completed the Duke Transaction for $23.2 billion through the issuance of equity and assumption of debt. We assumed $4.2 billion of debt with a weighted average stated interest rate of 2.3% and 4.9% at fair value. We paid down the balance of $745 million on Duke’s line of credit subsequent to closing the acquisition. The Duke portfolio was primarily comprised of logistics real estate assets, including 494 industrial operating properties, aggregating 144 million square feet. |
| --- | --- |
| • | With the overall strengthening of the U.S. dollar against the foreign currencies in which we operate, in 2022 we realized net gains upon settlement of undesignated derivative instruments that offset the negative impact of the translation of our earnings to U.S. dollars. |
| • | In June, we terminated our global senior credit facility (the “2019 Global Facility”) and entered into the 2022 Global Facility with a borrowing capacity of up to $3.0 billion and an extended initial maturity date of June 2026. We also upsized our second global senior credit facility (the “2021 Global Facility”), increasing its borrowing capacity up to $2.0 billion. This resulted in increasing our total borrowing capacity under both facilities to $5.0 billion and modifying the base rate of the aggregate lender commitments in U.S. dollars from the U.S. dollar London Inter-bank Offered Rate to the Secured Overnight Financing Rate. |
| • | At December 31, 2022, we had total senior notes of $19.8 billion, with a weighted average remaining maturity of 10 years and an effective interest rate of 2.3%. In addition to the senior notes assumed in the Duke Transaction, we issued $3.3 billion of senior notes in 2022 (principal in millions): |
| --- | --- | --- | --- | --- | --- | --- | --- | --- | --- | --- | --- | --- | --- | --- | --- | --- | --- | --- | --- |
| | January | | £ | 60 | | | $ | 81 | | | 2.1% | | | | | 20.0 | | | December 2041 |
| | February (2) | | € | 1,550 | | | $ | 1,768 | | | 1.0% | | | | | 8.5 | | | February 2024 – 2034 |
| | July | | ¥ | 30,965 | | | $ | 227 | | | 1.4% | | | | | 15.5 | | | July 2027 – 2042 |
| | September (2) | | $ | 650 | | | $ | 650 | | | 4.6% | | | | | 10.3 | | | January 2033 |
| | November | | C$ | 500 | | | $ | 362 | | | 5.3% | | | | | 8.2 | | | January 2031 |
| | December | | ¥ | 24,200 | | | $ | 178 | | | 1.8% | | | | | 13.4 | | | December 2027 – 2037 |
| | Total | | | | | | $ | 3,266 | | | 2.3% | | | | | 9.8 | | | |
| | | | | | | | | | | | | | | | | | | | |
| --- | --- | --- |
| | (2) | A portion of the net proceeds from the issuance of these notes were used to finance green projects eligible under our green bond framework. |
On October 6, 2022, we completed an exchange offer and consent solicitation for nine series of Duke’s senior notes for an aggregate amount of $3.4 billion, with $3.2 billion, or 96%, of the aggregate principal amount being validly tendered for exchange.
The validly tendered senior notes were exchanged for notes issued by the OP.
As a result of the consent solicitation, we have no separate remaining financial reporting obligations or financial covenants associated with the senior notes assumed in the Duke Transaction.
All other terms of the assumed Duke senior notes remained substantially the same.
RESULTS OF OPERATIONS
| | | 2022 | | | | 2021 | | |
| (1) | Acquisition activity is principally due to the Duke Transaction on October 3, 2022. We primarily recognized intangible liabilities for the lower in-place rents, as compared to current market rents, under the acquired leases from Duke. These intangible liabilities are amortized to rental revenues over the remaining lease term, which on average is 64 months. |
| (1) | In 2022, we completed the Duke Transaction. |
The development portfolio included 15 buildings that were properties under development by Duke and acquired at the time of the acquisition.
| | | 2022 | | | | 2021 | | | | 2022 | | | | 2021 | | | | 2022 | | | | 2021 | | | | 2022 | | | | 2021 | | | | 2022 | | | | 2021 | | | |
| (2) | Recurring fees include asset management and property management fees. The increase in fees is primarily due to higher asset management fees driven by the increases in the fair value of the properties based on third party valuations. We saw some decline in asset values in the last half of 2022, and we expect to see additional decline in 2023. |
We expect that 2023 will include additional investments we are making in our Prologis Essentials business, primarily in the energy teams.
Additionally, 2021 included the sale of our ownership interest in one of our
We believe reviewing the fundamentals this way allows management to understand the entire impact to the financial statements, as it will affect both the Real Estate Segment and the Strategic Capital Segment, as well as the net earnings we recognize from our unconsolidated co-investment ventures based on our ownership.
| | 2022 | | | | | | | | | | | | 2021 | | | | | | | | | | |
| 2021 | | | | | | | | | | | | | | | | | | | | |
| Rental revenues | | $ | 1,022 | | | $ | 1,015 | | | $ | 1,037 | | | $ | 1,074 | | | $ | 4,148 | |
| Rental expenses | | | (278 | ) | | | (245 | ) | | | (256 | ) | | | (262 | ) | | | (1,041 | ) |
| Property NOI | | $ | 744 | | | $ | 770 | | | $ | 781 | | | $ | 812 | | | $ | 3,107 | |
| (1) | We exclude properties held for sale to third parties, along with development properties that were not stabilized at the beginning of the period and properties acquired or disposed of to third parties during the period. We also exclude net termination and renegotiation fees to allow us to evaluate the growth or decline in each property’s rental revenues without regard to one-time items that are not indicative of the property’s recurring operating performance. Net termination and renegotiation fees represent the gross fee negotiated to allow a customer to terminate or renegotiate their lease, offset by the write-off of the asset recorded due to the adjustment to straight-line rents over the lease term. Same Store Property NOI is adjusted to include an allocation of property management expenses for our consolidated properties based on the property management services provided to each property (generally, based on a percentage of revenues). On consolidation, these amounts are eliminated and the actual costs of providing property management and leasing services are recognized as part of our consolidated rental expense. |
An excerpt. Shown here: 40 of 309 rewritten, 40 of 188 added and 40 of 66 removed. The counts are complete. For every sentence, read Item 7. Management’s Discussion and Analysis of Financial Condition and Results of Operations in the FY2023 filing and the FY2022 filing.
Item 7A. Quantitative and Qualitative Disclosures About Market Risk
20 rewritten, 9 added, 6 removed, 18 unchanged
Our sensitivity analysis estimates the exposure to market risk sensitive instruments assuming a hypothetical 10% adverse change in foreign currency exchange rates or interest rates at December 31, [removed: 2022.][added: 2023.]
[removed: Foreign] [added: Foreign] Currency [removed: Risk][added: Risk]
Additionally, we hedge our foreign currency risk by entering into derivative financial [removed: instruments] [added: instruments, such as foreign currency contracts,] that we designate as net investment hedges, as these amounts offset the translation adjustments on the underlying net assets of our foreign investments.
At December 31, [removed: 2022,] [added: 2023,] after consideration of our ability to borrow in the foreign currencies in which we invest and also derivative and nonderivative financial instruments as discussed in Note 15 to the Consolidated Financial Statements, we had minimal net equity denominated in a currency other than the U.S. dollar.
For the year ended December 31, [removed: 2022, $975] [added: 2023, $546] million or [removed: 16%] [added: 6.8%] of our total consolidated revenue was denominated in foreign currencies.
We enter into [removed: other] foreign currency [removed: contracts,] [added: contracts that we do not designate,] such as forwards, to reduce [added: the impact from] fluctuations in foreign currency associated with the translation of the future earnings of our international subsidiaries.
[removed: We have forward] [added: At December 31, 2023, we had foreign currency] contracts [removed: that were not designated as hedges,] denominated principally in British pound sterling, Canadian dollar, euro and Japanese yen, [removed: and have] [added: with] an aggregate notional amount of $1.6 [removed: billion to mitigate risk associated with the translation of the future earnings of our subsidiaries denominated in these currencies.][added: billion.]
[removed: The] [added: As we do not designate these foreign currency contracts as hedges, the] gain or loss on settlement [removed: of these contracts] is included in our earnings and offsets the lower or higher translation of earnings from our investments denominated in currencies other than the U.S. dollar.
Although the impact to net earnings is mitigated through higher translated U.S. dollar earnings from these currencies, a weakening of the U.S. dollar against these currencies by 10% could result in a [removed: $164] [added: $162] million cash payment on settlement of these contracts.
[removed: Interest] [added: Interest] Rate [removed: Risk][added: Risk]
At December 31, [removed: 2022, $21.1] [added: 2023, $26.9] billion of our debt bore interest at fixed rates and therefore the fair value of these instruments was affected by changes in market interest rates.
At December 31, [removed: 2022, $3.3] [added: 2023, $2.7] billion of our debt bore interest at variable rates.
The following table summarizes the future repayment of debt and scheduled principal payments at December 31, [removed: 2022] [added: 2023] (dollars in millions):
| | [removed: 2023] [added: 2024] | | | | [removed: 2024] [added: 2025] | | | | [removed: 2025] [added: 2026] | | | | [removed: 2026] [added: 2027] | | | | [removed: Thereafter] [added: Thereafter] | | | | [removed: Total] [added: Total] | | | | [removed: Fair Value] [added: Fair Value] | | |
| Secured mortgage debt | | [removed: 4] [added: \-] | | | | [removed: \-] [added: 38] | | | | [removed: 10] [added: \-] | | | | [removed: 64] [added: \-] | | | | \- | | | | [removed: 78] [added: 38] | | | | [removed: 79] [added: 38] | |
| Senior notes | | [removed: \-] [added: 166] | | | | [removed: 160] [added: \-] | | | | \- | | | | \- | | | | \- | | | | [removed: 160] [added: 166] | | | | [removed: 160] [added: 166] | |
[removed: | (1) |] At December 31, [removed: 2022,] [added: 2023,] we had one interest rate swap agreement to fix €150 million ($156 million) of our floating rate euro senior notes which is included in fixed rate debt. [removed: |]
[removed: | (2) |] The weighted average interest rates represent the effective interest rates (including amortization of debt issuance costs and noncash premiums and discounts) at December 31, [removed: 2022] [added: 2023] for the debt outstanding and include the impact of designated interest rate swaps, which effectively fix the interest rate on certain variable rate debt. [removed: |]
At December 31, [removed: 2022,] [added: 2023,] the weighted average effective interest rate on our variable rate debt was [removed: 2.5%,] [added: 3.6%,] which was calculated using an average balance on our credit facilities throughout the year and our other variable rate debt balances at December 31, [removed: 2022.][added: 2023.]
On the basis of our sensitivity analysis, a 10% increase in interest rates on our average outstanding variable rate debt balances would result in additional annual interest expense of [removed: $6] [added: $8] million for the year ended December 31, [removed: 2022,] [added: 2023,] which equates to a change in interest rates of [removed: 25] [added: 36] basis points on our average outstanding variable rate debt balances and [removed: 2] [added: 3] basis [removed: point] [added: points] on our average total debt portfolio balances.
[Table of Contents](#toc_page)
| Fixed rate debt (1) | $ | 365 | | | $ | 176 | | | $ | 1,463 | | | $ | 1,796 | | | $ | 23,090 | | | $ | 26,890 | | | $ | 24,096 | |
| Weighted average interest rate (2) | | 2.0 | % | | | 3.2 | % | | | 3.3 | % | | | 2.0 | % | | | 2.9 | % | | | 2.8 | % | | | | |
| | | | | | | | | | | | | | | | | | | | | | | | | | | | |
| Credit facilities | $ | \- | | | $ | \- | | | $ | 355 | | | $ | 624 | | | $ | \- | | | $ | 979 | | | $ | 979 | |
| Term loans | | \- | | | | 726 | | | | 601 | | | | \- | | | | 177 | | | | 1,504 | | | | 1,503 | |
| Total variable rate debt | $ | 166 | | | $ | 764 | | | $ | 956 | | | $ | 624 | | | $ | 177 | | | $ | 2,687 | | | $ | 2,686 | |
(1)
(2)
| Fixed rate debt (1) | $ | 29 | | | $ | 255 | | | $ | 176 | | | $ | 1,313 | | | $ | 19,343 | | | $ | 21,116 | | | $ | 17,324 | |
| Weighted average interest rate (2) | | 3.4 | % | | | 1.4 | % | | | 3.1 | % | | | 3.3 | % | | | 2.3 | % | | | 2.3 | % | | | | |
| Credit facilities | $ | \- | | | $ | 487 | | | $ | \- | | | $ | 1,051 | | | $ | \- | | | $ | 1,538 | | | $ | 1,538 | |
| Term loans | | \- | | | | \- | | | | 721 | | | | 645 | | | | 190 | | | | 1,556 | | | | 1,555 | |
| Total variable rate debt | $ | 4 | | | $ | 647 | | | $ | 731 | | | $ | 1,760 | | | $ | 190 | | | $ | 3,332 | | | $ | 3,332 | |
| --- | --- |
Item 1. Business
123 rewritten, 91 added, 56 removed, 84 unchanged
We operate Prologis, Inc. and Prologis, L.P. as one enterprise and, therefore, our discussion and analysis refers to Prologis, Inc. and its consolidated subsidiaries, including Prologis, L.P. We invest in real estate through wholly owned subsidiaries and other entities through which we co-invest with partners and [removed: investors.][added: investors ("co-investment ventures").]
Our O&M portfolio includes our consolidated properties as well as properties owned by our unconsolidated co-investment [removed: ventures.][added: ventures, which we manage.]
We also evaluate our results based on our proportionate economic ownership of each property included in the O&M portfolio (“our [removed: share”) to reflect our share of the financial results of the O&M portfolio.][added: share”).]
Management’s Discussion and Analysis of Financial Condition and Results of Operations for a reconciliation of *Net Earnings Attributable to Common Stockholders/Unitholders* in the Consolidated Statements of Income to our FFO measures and a reconciliation of NOI to *Operating [removed: Income,*] [added: Income* in] the [added: Consolidated Statements of Income, the] most directly comparable GAAP measures.
Our corporate headquarters is located at Pier 1, Bay 1, San Francisco, California 94111, and our other principal office locations are in Amsterdam, Denver, Mexico City, [added: Sao Paulo,] Shanghai, Singapore and Tokyo.
[removed: THE COMPANY][added: THE COMPANY]
Our teams actively manage our portfolio [removed: and provide] [added: by providing] comprehensive real estate services, including leasing, property management, development, acquisitions and dispositions.
We [added: also] invest significant capital into new logistics properties [removed: principally] through our [added: development activity and third-party acquisitions.]
[removed: The] [added: Proceeds from the disposition of properties, generally through the] contribution of newly developed properties to our co-investment ventures and the [removed: sale] [added: sales] of non-strategic properties to third [removed: parties allows] [added: parties, allow] us to recycle capital [added: back] into our [removed: development and acquisition] [added: investment] activities.
While the majority of our properties in the U.S. are wholly owned, we hold a significant ownership interest in properties [removed: internationally and] [added: both] in the U.S. [added: and internationally] through our [removed: investments] [added: investment] in the co-investment ventures.
Partnering with the world’s largest institutional investors through co-investment ventures allows us to [added: expand our investment capacity,] enhance and diversify our real estate returns [removed: as well as] [added: and] mitigate our exposure to foreign currency movements.
[removed: Logistics] [added: The importance of logistics] supply chains [removed: have] [added: has] increased dramatically [removed: in importance] to our customers and the global economy.
We believe these forces will keep demand strong [removed: for] [added: over] the long-term.
[removed: The scale of our] [added: Our] 1.2 billion square foot portfolio [removed: allows us to provide] [added: has provided the foundation upon which we have built] a platform of solutions to address challenges that [removed: companies] [added: our customers] face in global fulfillment today.
Through Prologis Essentials, we focus on innovative ways to meet our customers’ [removed: operations, energy] [added: operations] and [removed: sustainability, mobility] [added: energy] and [removed: workforce] [added: sustainability] needs.
Our customer experience teams, proprietary technology and strategic partnerships are foundational to [added: all aspects of our] Prologis Essentials [removed: and allow us to provide our customers with unique and actionable insights to drive greater efficiency in their operations.][added: offerings.]
[removed: Our] [added: Finally, our] long-standing dedication to Environmental, Social and Governance (“ESG”) practices [removed: strengthens our relationships with] [added: creates value for] our customers, investors, employees and the communities in which we do business.
The principles of ESG are an important aspect of our business strategy that we believe delivers a strategic business [removed: advantage while positively impacting the environment.][added: advantage.]
At December 31, [removed: 2022,] [added: 2023,] we owned or had investments in, on a wholly-owned basis or through co-investment ventures, properties and development projects expected to total approximately 1.2 billion square feet across the following geographies:
[removed: 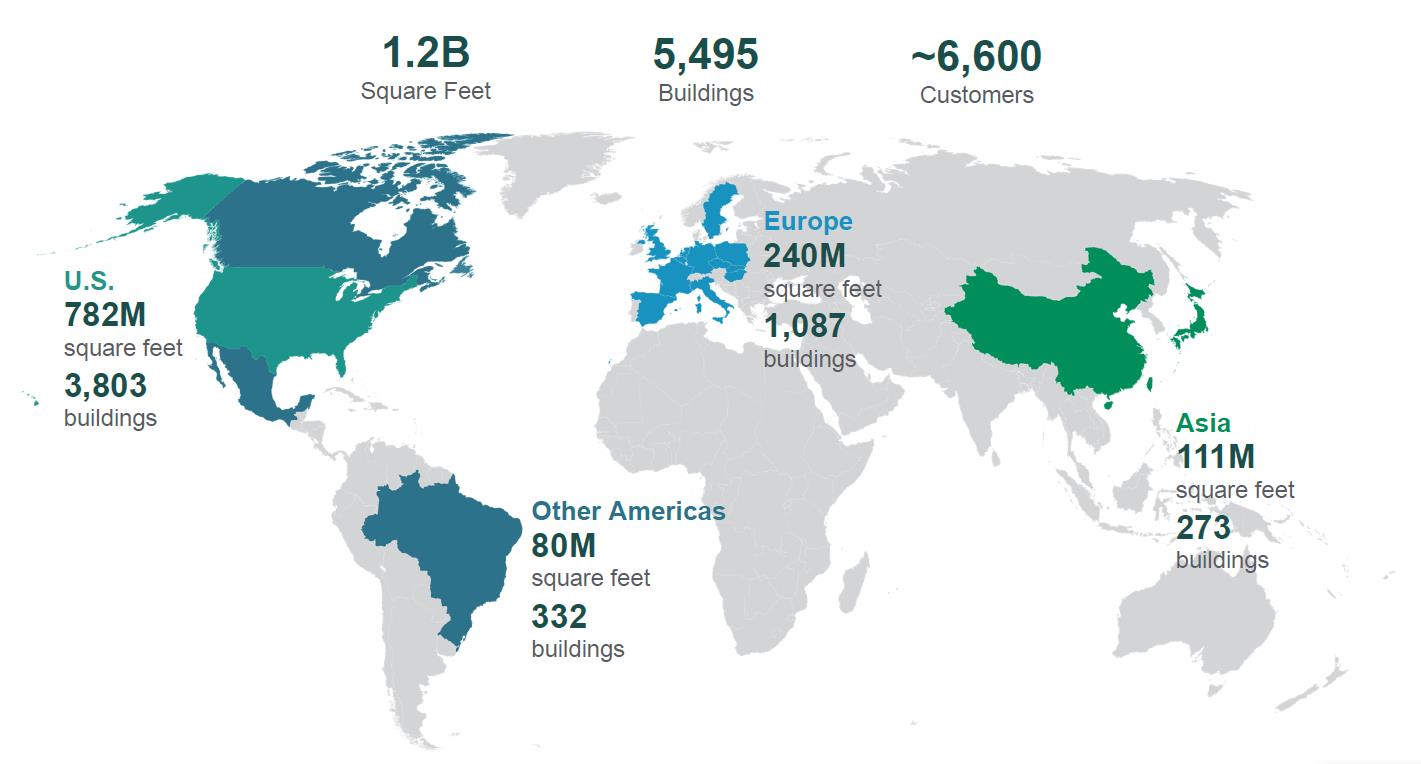][added: ]
[removed: OPERATING SEGMENTS][added: OPERATING SEGMENTS]
[removed: 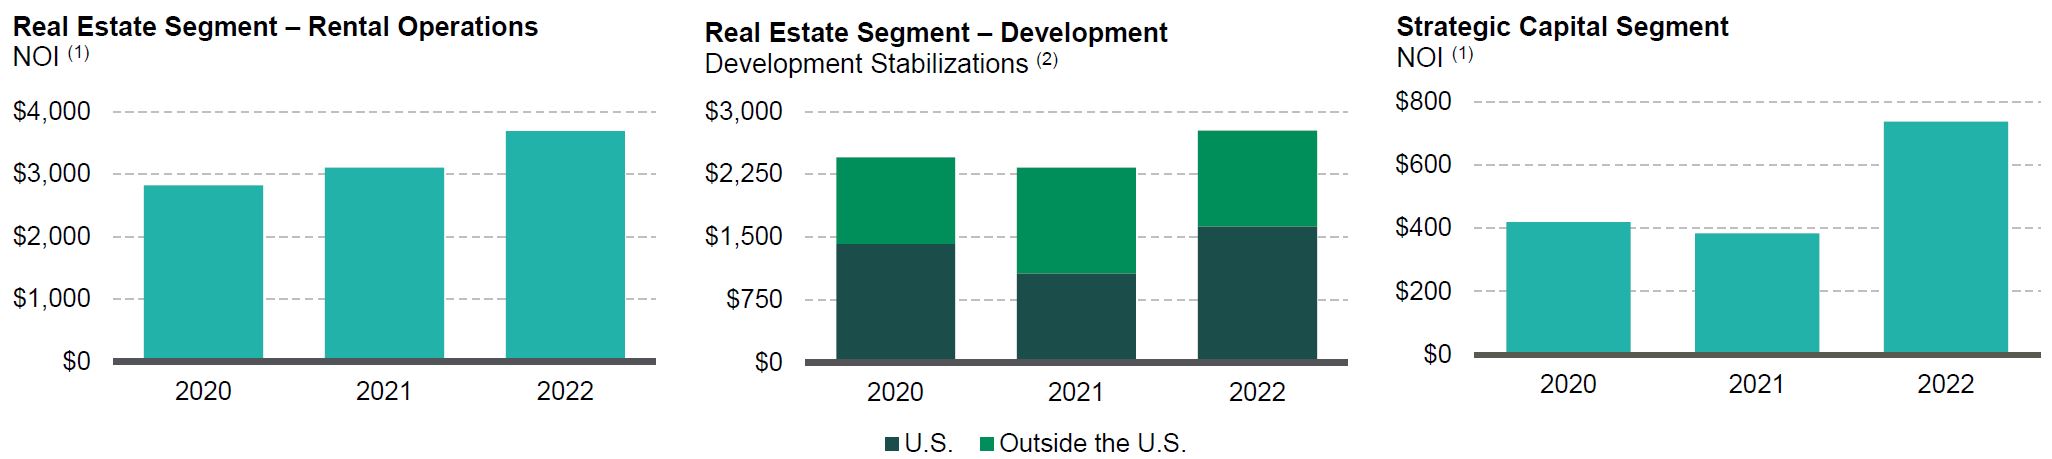][added: ]
[removed: | (1) |] NOI from the Real Estate Segment is calculated directly from [removed: our] [added: the] Consolidated Financial Statements as *Rental Revenues* and *Development Management and Other Revenues* less *Rental Expenses* and *Other Expenses.* NOI from the Strategic Capital Segment is calculated directly from [removed: our] [added: the] Consolidated Financial Statements as *Strategic Capital* *Revenues* less *Strategic Capital* *Expenses.* [removed: |]
[removed: | (2) |] A developed property moves into the operating portfolio when it meets our definition of stabilization, which is the earlier of when a property that was developed has been completed for one year, is contributed to a co-investment venture following completion or is 90% occupied. [removed: Amounts represent our total expected investment (“TEI”) upon stabilization, which includes the estimated cost of development or expansion, including land, construction and leasing costs. |]
[removed: Real] [added: Real] Estate [removed: Segment][added: Segment]
[added: Rental Operations.] Rental operations comprise the largest component of our operating segments and generally [removed: contribute] [added: contributes] 85% to 90% of our consolidated revenues, earnings and FFO.
For leases that commenced during [removed: 2022] [added: 2023] within the consolidated operating portfolio, the weighted average lease term was [removed: 69] [added: 66] months.
We expect to generate [removed: internal] [added: earnings] growth by increasing rents, maintaining high occupancy rates and controlling expenses.
The primary driver of our revenue [removed: growth, outside of the Duke Transaction,] [added: growth] will be [added: the] rolling [added: of] in-place leases to current market rents when leases expire, as discussed further below.
We believe our active portfolio management, combined with the skills of our property, leasing, maintenance, [removed: capital,] energy, sustainability and risk management teams allow us to maximize NOI across our portfolio.
[added: Development.] Given the scarcity of modern logistics facilities in our target markets, our development business provides the opportunity to build to the [added: evolving] requirements of our [removed: current and future] customers while deepening our market presence.
We believe we have a competitive advantage due to (i) the strategic locations of our global land bank and redevelopment sites; (ii) the development expertise of our local teams; (iii) the depth of our customer relationships; (iv) our ability to integrate sustainable design features that [removed: result in cost-savings and] [added: provide] operational efficiencies for our customers; and (v) our procurement capabilities that allow us to secure high-demand construction materials at lower cost.
Generally, we develop properties in the U.S. [added: to hold] for [added: the] long-term [removed: hold] and outside the U.S. for contribution to our unconsolidated co-investment ventures.
[removed: Strategic] [added: Strategic] Capital [removed: Segment][added: Segment]
[removed: Our] [added: Through the] Strategic Capital Segment [removed: allows us to] [added: we] partner with many of the world’s largest institutional [removed: investors.][added: investors through unconsolidated co-investment ventures.]
The business is capitalized principally through private and public equity of which [removed: 95%] [added: 93%] is either in perpetual open-ended or long-term [removed: ventures,] [added: ventures] and two publicly traded vehicles (Nippon Prologis REIT, Inc. in Japan and FIBRA Prologis in Mexico).
We align our interests with our partners by holding significant ownership interests in [removed: all of] our [removed: eight] [added: nine] unconsolidated co-investment ventures (ranging from 15% to 50%).
This segment produces durable, long-term cash flows and generally contributes 10% to 15% of our [removed: recurring] consolidated revenues, earnings and FFO, [added: excluding promotes,] all while requiring minimal capital other than our investment in the venture.
We generate strategic capital revenues [added: or fees] from our unconsolidated co-investment ventures, principally through asset management and property management services.
The majority of [added: the] strategic capital revenues are generated outside the U.S.
[Table of Contents](#toc_page)
Our scale and customer-focused strategy have compelled us to expand the services we provide.
These resources allow us to provide our customers with unique and actionable insights and tools to help them make progress on sustainability goals and drive greater efficiency in their operations.
Our Global Presence
[Table of Contents](#toc_page)
(1)
(2)
Amounts represent our total expected investment (“TEI”) upon stabilization, which includes the estimated cost of development or expansion, including land, construction and leasing costs.
[Table of Contents](#toc_page)
Promote revenues are recognized when earned at the end of the promote period for the specific co-investment ventures.
(1)
Net effective rent ("NER") is calculated at the beginning of the lease using estimated total cash base rent to be received over the term and annualized and excludes amortization of fair value lease adjustments from acquisitions.
Rent change represents the percentage change in net effective rental rates (average rate over the lease term), on new and renewed leases, commenced during the period compared with previous net effective rental rates in that same space.
(2) Included in 2022 and 2023 were significant promotes earned in Europe and the U.S, respectively.
We do not have any significant promote opportunities in 2024.
Rent Growth. We expect rents in our markets to continue to increase due to demand and low vacancy.
Due to strong market rent growth over the last several years, our in-place leases have considerable upside potential to drive future organic NOI growth.
This is evident in the positive rent change we have experienced in every quarter since 2013 and was significant to our operating results over the last several years.
We estimate that our lease mark-to-market is approximately 57% (on an NER basis), which represents the growth rate from in-place rents to current market rents based on our share of the O&M portfolio at December 31, 2023.
Therefore, even if there was no additional market rent growth in the future, we expect our lease renewals to translate into significant increases in future rental income.
Value Creation from Development. The global nature of our development program provides a wide landscape of opportunities to pursue based on our judgment of market conditions, opportunities and risks.
One of the ways in which we create value is through our focus on sourcing well-located land and redevelopment sites through acquisition opportunities, including our innovative approach with Covered Land Plays ("CLP"), which are income producing assets acquired with the intention to redevelop for higher and better use as industrial properties.
Based on our current estimates, our consolidated land, including options and CLP, has the potential to support the development of $35.7 billion ($40.0 billion on an O&M basis) of TEI of new logistics space.
Strategic Capital Advantages. The co-investment ventures provide additional capital from third parties that we can use to grow our company, contribute to self-funding our development activities through the sale of newly developed assets to these vehicles and produce substantial fees for our management of the assets.
At December 31, 2023, the gross book value of the operating portfolio held by our nine unconsolidated co-investment ventures was $53.1 billion across 507 million square feet.
[Table of Contents](#toc_page)
(1)
*G&A Expenses* is a line item in the Consolidated Financial Statements.
Balance Sheet Strength. At December 31, 2023, the weighted average remaining maturity of our consolidated debt was 9 years and the weighted average interest rate was 3.0%.
Prior to the current rising interest rate environment, we were able to take advantage of lower interest rates through our refinancing activities and substantially addressed our debt maturities until 2026.
At December 31, 2023, we had total available liquidity of $6.0 billion.
We continue to maintain low leverage as a percentage of our real estate investments and our market capitalization.
As a result of our low leverage, available liquidity and investment capacity in the co-investment ventures, we have significant ability to capitalize on opportunistic value-added investments as they arise.
Our Scale Drives Efficiency. We have scalable systems and infrastructure in place to grow both our consolidated and O&M portfolios with limited incremental G&A expense.
We use adjusted G&A expenses as a percentage of the O&M portfolio (based on gross book value) to measure and evaluate the overhead costs associated with the O&M portfolio.
We believe we can continue to grow NOI and strategic capital revenues organically and through accretive development and acquisition activity while further reducing G&A as a percentage of our investments in real estate.
As shown in the graph above, the acquisition of Duke Realty Corporation and Duke Realty Limited Partnership (collectively "Duke" or the "Duke Transaction") on October 3, 2022 is an example of this.
We increased our O&M portfolio significantly in the fourth quarter of 2022 as a result of the acquisition and had minimal increases to G&A expenses.
This includes investments in early and growth-stage companies that are focused on emerging technologies for the logistics sector.
Through Prologis Essentials, we support our customers through service and product offerings, including innovative solutions to operations and energy and sustainability needs that can make our customers’ decision process easier while progressing on their environmental goals.
development activity and third-party acquisitions.
The nature of the services we are providing to our customers is expanding.
2022 Significant Acquisition
On October 3, 2022, we acquired Duke Realty Corporation and Duke Realty Limited Partnership (collectively “Duke”) through a merger transaction that we refer to as the “Duke Transaction” and is detailed in Note 3 to the Consolidated Financial Statements in Item 8.
Financial Statements and Supplementary Data.
Our financial condition and operating results include the Duke properties subsequent to the acquisition date.
The Duke portfolio was primarily comprised of logistics real estate assets, including 494 industrial operating properties, aggregating 144 million square feet and was highly complementary to our U.S. portfolio in terms of product quality, location and growth potential.
There was approximately 15 million square feet of non-strategic industrial operating properties that we do not intend to hold long-term and are classified as other real estate investments.
The portfolio also included properties under development, land for future development and investments in other ventures.
The acquisition expanded our presence in target markets such as Chicago, Dallas, Atlanta, South Florida and Southern California.
The total acquisition price, including transaction costs, was $23.2 billion and was funded through the issuance of equity based on the value of the Prologis, Inc. common stock issued using the closing price on September 30, 2022 and the assumption of debt.
As a result of the closely aligned portfolios and similar business strategy and our ability to scale, we integrated the Duke portfolio while adding minimal property management and general and administrative expenses (“G&A”).
Overview
| --- | --- |
Rental Operations.
Development.
| • | Rent Growth. We expect rents in our markets to continue to increase due to healthy demand combined with low vacancy. Due to strong market rent growth over the last several years, our in-place leases have considerable upside potential to drive future organic NOI growth. We estimate that our lease mark-to-market is approximately 67% (on a net effective basis), which represents the growth rate from in-place rents to current market rents based on our share of the O&M portfolio at December 31, 2022. Therefore, even if there was no additional market rent growth in the future, we expect our lease renewals to translate into significant increases in future income. We have experienced positive rent change on rollover (comparing the net effective rent (“NER”) of the new lease to the prior lease for the same space) in every quarter since 2013. |
| • | Value Creation from Development. A successful development and redevelopment program requires sourcing well-located land and redevelopment sites through acquisition opportunities, including our innovative approach with Covered Land Plays, which are income producing assets acquired with the intention to redevelop for higher and better use as industrial properties. Our investment in the development portfolio was $4.2 billion at December 31, 2022. We believe that the carrying value of our land bank is below its current fair value. Based on our current estimates, our consolidated land, including options and Covered Land Plays, has the potential to support the development of $34.2 billion ($39.0 billion on an O&M basis) of TEI of new logistics space. The global nature of our development program provides a wide landscape of opportunities to pursue based on our judgement of market conditions, opportunities and risks. |
We expect to create value as we build new properties.
| • | Balance Sheet Strength. The Duke Transaction increased the strength and size of our balance sheet while allowing us to maintain our low leverage. At December 31, 2022, the weighted average remaining maturity of our consolidated debt was 9 years and the weighted average interest rate was 2.5%, primarily as a result of our refinancing activities over the last several years. Through our refinancing activities we have substantially addressed all our debt maturities until 2026 and have taken advantage of previously low interest rates. At December 31, 2022, we had total available liquidity of $4.1 billion. We continue to maintain low leverage as a percentage of our real estate investments and our market capitalization. As a result of our low leverage, available liquidity and investment capacity in the co-investment ventures, we have significant capacity to capitalize on opportunistic value-added investments as they arise. |
| • | Economies of Scale from Growth. We have scalable systems and infrastructure in place to grow both our consolidated and O&M portfolios with limited incremental G&A expense. We use adjusted G&A expenses as a percentage of the O&M portfolio (based on gross book value) to measure and evaluate our overhead costs. We believe we can continue to grow NOI and strategic capital revenues organically and through accretive development and acquisition activity while further reducing G&A as a percentage of our investments in real estate. The acquisition of the Duke portfolio in 2022 is a key example of this, where we increased our O&M portfolio by over 20% in the fourth quarter of 2022 and had minimal increases to G&A expenses, resulting in lower G&A expenses as a percentage of investments in real estate. While we plan to make future investments in our new lines of business through Prologis Essentials, we expect to maintain our operational efficiency. |
| --- | --- | --- | --- | --- | --- | --- | --- | --- | --- | --- | --- | --- | --- | --- | --- | --- |
| 1. Amazon | | 7.0 | | | | 34 | | | 1. Amazon | | 5.3 | | | | 43 | |
| 2. Home Depot | | 2.6 | | | | 15 | | | 2. Home Depot | | 1.7 | | | | 17 | |
| 8. U.S. Government | | 0.6 | | | | 2 | | | 8. GXO | | 0.7 | | | | 9 | |
| 10. Pepsi | | 0.5 | | | | 3 | | | 10. Maersk | | 0.6 | | | | 6 | |
| Top 10 Customers | | 16.4 | | | | 86 | | | Top 10 Customers | | 14.4 | | | | 141 | |
| 14. DSV Panalpina | | 0.4 | | | | 2 | | | 14. Cainiao (Alibaba) | | 0.5 | | | | 5 | |
| 15. Ryder System | | 0.4 | | | | 2 | | | 15. DB Schenker | | 0.4 | | | | 5 | |
| 16. CEVA Logistics | | 0.4 | | | | 3 | | | 16. NFI Industries | | 0.4 | | | | 3 | |
| 17. Uline | | 0.4 | | | | 1 | | | 17. Hitachi | | 0.4 | | | | 4 | |
| 18. Berkshire Hathaway | | 0.4 | | | | 3 | | | 18. XPO Logistics | | 0.4 | | | | 4 | |
| 20. Office Depot | | 0.4 | | | | 3 | | | 20. ZOZO | | 0.4 | | | | 4 | |
| 21. Kellogg | | 0.4 | | | | 3 | | | 21. Mercado Libre | | 0.4 | | | | 4 | |
| 22. Toyo Tires | | 0.4 | | | | 1 | | | 22. Pepsi | | 0.3 | | | | 3 | |
| 23. Kuehne + Nagel | | 0.3 | | | | 2 | | | 23. Wayfair | | 0.3 | | | | 5 | |
| 24. Iron Mountain | | 0.3 | | | | 2 | | | 24. Nippon Kabushika Kaisha (Yusen Logistics) | | 0.3 | | | | 2 | |
| 25. Best Buy | | 0.3 | | | | 2 | | | 25. Uline | | 0.3 | | | | 2 | |
| Top 25 Customers | | 22.3 | | | | 122 | | | Top 25 Customers | | 20.5 | | | | 202 | |
| --- | --- | --- |
An excerpt. Shown here: 40 of 123 rewritten, 40 of 91 added and 40 of 56 removed. The counts are complete. For every sentence, read Item 1. Business in the FY2023 filing and the FY2022 filing.
Cover and table of contents
87 rewritten, 14 added, 5 removed, 66 unchanged
[removed: UNITED] [added: UNITED] STATES SECURITIES AND EXCHANGE [removed: COMMISSION][added: COMMISSION]
[removed: Washington,] [added: Washington,] D.C. [removed: 20549][added: 20549]
[removed: FORM 10-K][added: FORM 10-K]
[removed: (Mark One)][added: | (Mark One) | | |]
| [removed: ☑] [added: ☐] | [removed: ANNUAL] [added: | TRANSITION] REPORT PURSUANT [removed: TO SECTION] [added: TO SECTION] 13 OR [removed: 15(d) OF] [added: 15(d) OF] THE SECURITIES EXCHANGE ACT OF [removed: 1934] [added: 1934 For the transition period from ______________ to ______________] |
| [removed: ☐] [added: ☑] | [removed: TRANSITION] [added: | ANNUAL] REPORT PURSUANT TO SECTION [removed: 13 OR 15(d) OF] [added: 13 OR 15(d) OF] THE SECURITIES EXCHANGE ACT OF [removed: 1934] [added: 1934 For the fiscal year ended December 31, 2023] |
[removed: Commission] [added: Commission] File [removed: Number:] [added: Number:] 001-13545 (Prologis, Inc.) 001-14245 (Prologis, L.P.)
[removed: ][added: ]
[removed: Prologis, Inc.][added: Prologis, Inc.]
[removed: Prologis, L.P.][added: Prologis, L.P.]
| [removed: Maryland (Prologis, Inc.) Delaware (Prologis, L.P.) | 94-3281941 (Prologis, Inc.) 94-3285362 (Prologis, L.P.)] [added: Maryland (Prologis, Inc.) Delaware (Prologis, L.P.)] | [added: 94-3281941 (Prologis, Inc.) 94-3285362 (Prologis, L.P.)] |
| [removed: (State] [added: *(State] or other jurisdiction [removed: of incorporation] [added: of* *incorporation] or [removed: organization) | (I.R.S. Employer Identification No.)] [added: organization)*] | [added: *(I.R.S. Employer* *Identification No.)*] |
| [removed: Pier] [added: Pier] 1, Bay [removed: 1, San Francisco, California | 94111] [added: 1, San Francisco, California] | [added: 94111] |
| [removed: (Address] [added: *(Address] or principal executive [removed: offices) | (Zip Code)] [added: offices)*] | [added: *(Zip Code)*] |
[removed: (415) 394-9000][added: (415) 394-9000]
[removed: (Registrants’] [added: (Registrants’] telephone number, including area [removed: code)][added: code)]
[removed: (Former] [added: (Former] name, former address and former fiscal year, if changed since last [removed: report)][added: report)]
[removed: Securities] [added: Securities] registered pursuant to Section 12(b) of the [removed: Act:][added: Act:]
[removed: |] Prologis, Inc.: Yes [removed: ☐ No] ☑ [removed: |] [added: No ☐] Prologis, L.P.: Yes [removed: ☐ No] ☑ [removed: | |][added: No ☐]
[removed: |] Indicate by check mark whether the registrant: (1) has filed all reports required to be filed by Section 13 or 15(d) of the Securities Exchange Act of 1934 during the preceding 12 months (or for such shorter period that the registrant was required to file such reports), and (2) has been subject to such filing requirements for the past 90 days. [removed: Prologis, Inc.: Yes ☑ No ☐ Prologis, L.P.: Yes ☑ No ☐ | | |]
[removed: |] Indicate by check mark whether the registrant has submitted electronically every Interactive Data File required to be submitted pursuant to Rule 405 of Regulation S-T during the preceding 12 months (or for such shorter periods that the registrant was required to submit such files). [removed: Prologis, Inc.: Yes ☑ No ☐ Prologis, L.P.: Yes ☑ No ☐ | | |]
Based on the closing price of Prologis, Inc.’s common stock on June 30, [removed: 2022,] [added: 2023] the aggregate market value of the voting common equity held by nonaffiliates of Prologis, Inc. was [removed: $86,814,282,420.][added: $112,988,239,238.]
The number of shares of Prologis, Inc.’s common stock outstanding at February [removed: 13, 2023,] [added: 9, 2024,] was approximately [removed: 923,429,000.][added: 924,881,000.]
[removed: DOCUMENTS] [added: DOCUMENTS] INCORPORATED BY [removed: REFERENCE][added: REFERENCE]
Portions of Part III of this report are incorporated by reference to the registrant’s definitive proxy statement for the [removed: 2022] [added: 2023] annual meeting of its stockholders or will be provided in an amendment filed on Form 10-K/A.
[removed: EXPLANATORY NOTE][added: EXPLANATORY NOTE]
This report combines the annual reports on Form 10-K for the year ended December 31, [removed: 2022,] [added: 2023,] of Prologis, Inc. and Prologis, L.P. Unless stated otherwise or the context otherwise requires, references to “Prologis, Inc.” or the “Parent” mean Prologis, Inc. and its consolidated subsidiaries; and references to “Prologis, L.P.” or the “Operating Partnership” or the “OP” mean Prologis, L.P., and its consolidated subsidiaries.
At December 31, [removed: 2022,] [added: 2023,] the Parent owned a [removed: 97.60%] [added: 97.58%] common general partnership interest in the OP and substantially all of the preferred units in the OP.
The remaining [removed: 2.40%] [added: 2.42%] common limited partnership interests are owned by unaffiliated investors and certain current and former directors and officers of the Parent.
[removed: | • |] enhances investors’ understanding of the Parent and the OP by enabling investors to view the business as a whole in the same manner as management views and operates the business; [removed: |]
[removed: | • |] eliminates duplicative disclosure and provides a more streamlined and readable presentation as a substantial portion of the Company’s disclosure applies to both the Parent and the OP; and [removed: |]
[removed: | • |] creates time and cost efficiencies through the preparation of one combined report instead of two separate reports. [removed: |]
[removed: TABLE] [added: | | | TABLE] OF [removed: CONTENTS][added: CONTENTS | | |]
| [removed: Item] [added: Item] | | [removed: Description] [added: Description] | | [removed: Page] [added: Page] |
| | | [removed: [PART I](#PART_I)] [added: [PART I](#part_i)] | | |
| [removed: 1.] [added: 1.] | | [removed: [Business](#ITEM_1_BUSINESS)] [added: [Business](#item_1_business)] | | [removed: 3] [added: 3] |
| | | [The [removed: Company](#Company)] [added: Company](#company)] | | [removed: 3] [added: 3] |
| | | [Operating [removed: Segments](#OperatingSegments)] [added: Segments](#operatingsegments)] | | [removed: 5] [added: 5] |
| | | [Future [removed: Growth](#FUTUREGROWTH)] [added: Growth](#futuregrowth)] | | [removed: 6] [added: 6] |
| | | [Code of Ethics and Business [removed: Conduct](#CODE_ETHICS)] [added: Conduct](#code_ethics)] | | [removed: 11] [added: 11] |
or
| | | | | | | |
| | |
| | |
Prologis, Inc.: Yes ☑ No ☐ Prologis, L.P.: Yes ☑ No ☐
| | | | | | | |
| | | | | | | |
| | |
| Prologis, Inc.: Yes ☐ No ☑ | Prologis, L.P.: Yes ☐ No ☑ |
[Table of Contents](#toc_page)
| | | | | |
| | | | | |
| 1C. | | [Cybersecurity](#cybersecurity) | | 22 |
[Table of Contents](#toc_page)
| --- | --- |
For the fiscal year ended December 31, 2022
or
For the transition period from ______________ to ______________
| | | |
An excerpt. Shown here: 40 of 87 rewritten, all 14 added and all 5 removed. The counts are complete. For every sentence, read Cover and table of contents in the FY2023 filing and the FY2022 filing.
Item 1C. Cybersecurity
0 rewritten, 21 added, 0 removed, 0 unchanged
New section this year
Due to our reliance on digital technology and electronic communications to run our business, cybersecurity threats and incidents pose an ongoing and escalating risk to our internal and third-party provided information systems and data, reputation and shareholder value, results of operations and financial condition.
Our Chief Technology Officer, who reports directly to our Chief Executive Officer, holds over 25 years of experience in information technology, specifically infrastructure, information security and fraud, and identity solutions at large global companies, and our Vice President of Information Technology (“IT”) Governance, who reports to our Chief Technology Officer, holds 20 years of experience in various information security roles.
Together, our Chief Technology Officer and Vice President of IT Governance ("IT leadership") oversee and lead our information security program and our business strategy, financial planning and capital allocation around our cybersecurity risk management and governance practices.
We also have an established Incident Response Team (“IRT”) to respond to and manage cybersecurity events.
This team includes our IT leadership as well as senior leadership from our accounting, legal, corporate communications and risk management departments with subject-matter expertise and established tenure at Prologis in their respective areas.
The IRT is tasked with taking appropriate action to safeguard the integrity of our information systems, data and network resources, investigate whether a breach occurred, define disclosures, communicate effectively with key audiences, including the Board as necessary, mitigate cybersecurity incident risks and provide a resolution through our
[Table of Contents](#toc_page)
cybersecurity incident communication protocols.
Additionally, on an annual basis the IRT is involved and engaged in security initiatives, including tabletop exercises facilitated both internally and externally, to stay relevant on current practices in the areas of cybersecurity.
The processes implemented by our IT leadership and IRT to oversee and identify cybersecurity risks are based on the Prologis Information Security Policy governed by the NIST Cybersecurity Framework.
The framework focuses on five key categories of cybersecurity risk management and governance: (i) identify: develop an organizational understanding to manage cybersecurity risk to systems, people, assets, data and capabilities; (ii) protect: develop and implement appropriate safeguards to ensure delivery of critical services; (iii) detect: develop and implement appropriate activities to identify the occurrence of a cybersecurity event; (iv) respond: develop and implement appropriate activities to take actions regarding a detected cybersecurity incident; and (v) recover: develop and implement appropriate activities to maintain plans for resilience and to restore any capabilities or service that were impaired due to a cybersecurity incident.
This framework is utilized within our organization as part of an integrated risk management program that involves participation from employees, to our Board and third-party service providers, with whom we have protocols in place to mitigate cybersecurity incident risks within our supply chain through the products and services we provide and use.
Additionally, all employees and contractors are required to attend mandatory cybersecurity training on an annual basis.
Our IT leadership reports to the Board on an annual basis on cybersecurity matters and, as necessary, when incidents arise in accordance with our cybersecurity incident communication protocols.
Our Board, specifically our Audit Committee, oversees cybersecurity risks and we believe contains the necessary expertise to perform those duties, including specific industry experience within information technology.
Additionally, Prologis’ cybersecurity risk management practices are reviewed and benchmarked against its peers through regular participation in a third-party security benchmarking survey.
Our IT infrastructure is externally audited as part of our Sarbanes-Oxley audit process and our controls include information security standards.
We also maintain standalone cybersecurity insurance and strive to adhere to local cybersecurity regulations in all the countries we do business.
We believe that risks from cybersecurity threats, including as a result of any previous cybersecurity incidents, have not materially affected, and are not reasonably likely to materially affect Prologis, including its business strategy, results of operations or financial condition.
Please refer to “*Our business and operations could suffer in the event of system failures or cybersecurity attacks*” under Item 1A.
Risk Factors.
Item 2. Properties
60 rewritten, 96 added, 67 removed, 30 unchanged
[removed: GEOGRAPHIC DISTRIBUTION][added: GEOGRAPHIC DISTRIBUTION]
Included in the operating property information below for our consolidated operating properties are [removed: 498] [added: 542] buildings owned primarily by one co-investment venture that we consolidate but of which we own less than 100% of the equity.
No individual property or market amounted to 10% or more of our consolidated total assets at December 31, [removed: 2022,] [added: 2023,] or generated revenue equal to 10% or more of our consolidated total revenues for the year ended December 31, [removed: 2022,] [added: 2023,] with the exception of the Southern California market.
| | | [removed: Consolidated] [added: Consolidated] Operating [removed: Properties] [added: Properties] | | | | | | | | | | | | [removed: O&M] [added: O&M] | | | | | | |
| [removed: Geographies] [added: Geographies] | | [removed: Rentable] [added: Rentable] Square [removed: Footage] [added: Footage] | | | | [removed: Gross] [added: Gross] Book [removed: Value] [added: Value] | | | | [removed: Encumbrances (1)] [added: Encumbrances (1)] | | | | [removed: Rentable] [added: Rentable] Square [removed: Footage] [added: Footage] | | | | [removed: Gross] [added: Gross] Book [removed: Value] [added: Value] | | |
| Baltimore/Washington D.C. | | | [removed: 13] [added: 96] | | | | [removed: 1,700] [added: 1] | | | | [removed: \-] [added: 57] | | | [added: *] | [removed: 17] | | | | [removed: 2,104] [added: 124] | |
| Dallas/Ft. Worth | | | [removed: 43] [added: 46] | | | | [removed: 3,486] [added: 3,817] | | | | \- | | | | [removed: 50] [added: 53] | | | | [removed: 4,080] [added: 4,420] | |
| New Jersey/New York City | | | [removed: 42] [added: 45] | | | | [removed: 7,119] [added: 7,982] | | | | [removed: 28] [added: 5] | | | | [removed: 51] [added: 54] | | | | [removed: 8,492] [added: 9,408] | |
| San Francisco Bay Area | | | [removed: 21] [added: 22] | | | | [removed: 3,185] [added: 3,503] | | | | [removed: \-] [added: 20] | | | | [removed: 26] [added: 27] | | | | [removed: 3,855] [added: 4,185] | |
| Canada | | | 10 | | | | [removed: 845] [added: 907] | | | | 138 | | | | 10 | | | | [removed: 845] [added: 907] | |
| [removed: Subtotal] [added: Subtotal] Other [removed: Americas] [added: Americas] | | | [removed: 11] [added: 11] | | | | [removed: 919] [added: 1,012] | | | | [removed: 138] [added: 138] | | | | [removed: 71] [added: 76] | | | | [removed: 4,638] [added: 5,229] | |
| Netherlands | | | [removed: \-] [added: 23] | | | | [removed: \-] [added: 1] | | | [removed: \-] | [added: 15] | | | [added: *] | [removed: 29] | | | | [removed: 2,999] [added: 62] | |
| [removed: Subtotal Asia] [added: Subtotal Asia] | | | [removed: 2] [added: 42] | | | | [removed: 182] [added: 3] | | | | [removed: \-] [added: 36] | | | | [removed: 91] [added: 5] | | | | [removed: 9,939] [added: 712] | |
| Value-added properties (4) | | | [removed: 6] [added: 3] | | | | [removed: 1,061] [added: 418] | | | | \- | | | | [removed: 9] [added: 4] | | | | [removed: 1,631] [added: 640] | |
| | | [removed: Consolidated] [added: Consolidated] – Investment in [removed: Land] [added: Land] | | | | | | | | | | | | [removed: Consolidated] [added: Consolidated] – Development [removed: Portfolio] [added: Portfolio] | | | | | | |
| [removed: Geographies] [added: Geographies] | | [removed: Acres] [added: Acres] | | | | [removed: Estimated] [added: Estimated] Build Out Potential (square [removed: feet) (5)] [added: feet) (5)] | | | | [removed: Current Investment] [added: Current Investment] | | | | [removed: Rentable] [added: Rentable] Square Footage Upon [removed: Completion] [added: Completion] | | | | [removed: TEI (6)] [added: TEI (6)] | | |
| Baltimore/Washington D.C. | | | [removed: 36] [added: 14] | | | [removed: *] | [added: 2,143] | | | | [removed: 15] [added: \-] | | | [removed: *] | [added: 18] | | | | [removed: 80] [added: 2,549] | |
| Central PA | | | \- | | | | \- | | | | \- | | | [removed: *] | [added: \-] | | | | [removed: 44] [added: \-] | |
| Lehigh Valley | | | 105 | | | | 1 | | | | [removed: 34] [added: 38] | | | | 1 | | | | [removed: 177] [added: 176] | |
| New Jersey/New York City | | | [removed: 194] [added: 183] | | | | 3 | | | | [removed: 287] [added: 337] | | | [removed: *] | [added: 1] | | | | [removed: 127] [added: 295] | |
| San Francisco Bay Area | | | [removed: \-] [added: 70] | | | | [removed: \-] [added: 1] | | | | [removed: \-] [added: 111] | | | | 2 | | | | [removed: 314] [added: 500] | |
| Netherlands | | [added: *] | [removed: 15] | | | [removed: *] | [added: 15] | | | [added: \-] | [removed: 9] | | | | [removed: 1] [added: 30] | | | | [removed: 82] [added: 3,405] | |
| [removed: Subtotal Asia] [added: Subtotal Asia] | | | [removed: 51] [added: 3] | | | | [removed: 4] [added: 309] | | | | [removed: 51] [added: \-] | | | | [removed: 7] [added: 98] | | | | [removed: 988] [added: 10,558] | |
[removed: | (2) |] No remaining market within the U.S. or country within Europe represented more than 2% of the total gross book value of the consolidated and O&M operating properties. [removed: |]
[removed: | (4) |] Value-added properties are properties we have either acquired at a discount and believe we could provide greater returns post-stabilization or properties we expect to repurpose to a higher and better use. [removed: |]
[removed: | (5) |] Represents the estimated finished square feet available for lease upon completion of a building on existing parcels of land. [removed: |]
The following table summarizes our investment in consolidated real estate properties at December 31, [removed: 2022] [added: 2023] (in millions):
| | | [removed: Investment] [added: Investment] Before [removed: Depreciation] [added: Depreciation] | | |
| Operating properties, excluding assets held for sale or contribution | | $ | [removed: 69,039] [added: 75,436] | |
| Development portfolio, including cost of land | | | [removed: 4,212] [added: 4,367] | |
| Other real estate investments (1) | | | [removed: 5,034] [added: 5,088] | |
| [removed: Total] [added: Total] consolidated real estate [removed: properties] [added: properties] | | [removed: $] [added: $] | [removed: 81,623] [added: 88,667] | |
[removed: | (1) |] Included in other real estate investments were: (i) [added: land parcels we own and lease to third parties; (ii)] non-strategic real estate assets, primarily acquired [removed: in] [added: from] the Duke Transaction, that we do not intend to operate [removed: long-term; (ii) land parcels we own and lease to third parties;] [added: long term;] (iii) non-industrial real estate assets that we [removed: generally] intend to redevelop [removed: into] [added: as] industrial [removed: properties;] [added: properties or other higher use assets;] and (iv) [removed: costs associated with potential acquisitions and future development projects, including purchase options on land. |][added: energy assets.]
[removed: LEASE EXPIRATIONS][added: LEASE EXPIRATIONS]
We generally lease our properties on a long-term basis (the average term for leases commenced, including new leases and renewals, in [removed: 2022] [added: 2023] was [removed: 69] [added: 66] months).
The following table summarizes the lease expirations of our consolidated operating portfolio for leases in place at December 31, [removed: 2022] [added: 2023] (dollars and square feet in millions):
| | | | | | | [removed: | | | | NER] [added: NER] | | | | | | | | | | |
| | | [removed: Number of Leases | | | | Occupied] [added: Occupied] Square [removed: Feet] [added: Feet] | | | | [removed: Dollars] [added: Dollars] | | | | [removed: %] [added: %] of [removed: Total] [added: Total] | | | | [removed: Dollars] [added: Dollars] Per Square [removed: Foot] [added: Foot] | | |
| Month to month | | | [removed: 128 | | | | 3] [added: 4] | | | | | | | | | | | | | |
| [removed: Total consolidated | | | 6,351 |] [added: Total consolidated] | | | [removed: 585] [added: 616] | | | | | | | | | | | | | |
[Table of Contents](#toc_page)
| Atlanta | | | 46 | | | $ | 3,876 | | | $ | \- | | | | 52 | | | $ | 4,358 | |
| Central PA | | | 18 | | | | 1,545 | | | | \- | | | | 20 | | | | 1,783 | |
| Central Valley | | | 21 | | | | 1,824 | | | | \- | | | | 23 | | | | 1,969 | |
| Chicago | | | 56 | | | | 5,193 | | | | \- | | | | 72 | | | | 6,747 | |
| Houston | | | 32 | | | | 3,277 | | | | \- | | | | 38 | | | | 3,810 | |
| Lehigh Valley | | | 31 | | | | 4,065 | | | | \- | | | | 35 | | | | 4,431 | |
| Seattle | | | 17 | | | | 2,748 | | | | \- | | | | 25 | | | | 3,634 | |
| South Florida | | | 22 | | | | 3,983 | | | | 14 | | | | 29 | | | | 5,008 | |
| Southern California | | | 103 | | | | 17,260 | | | | 9 | | | | 122 | | | | 19,613 | |
| Remaining Markets – U.S. (18 markets) (2) | | | 136 | | | | 11,795 | | | | 66 | | | | 166 | | | | 14,132 | |
| Subtotal U.S. | | | 609 | | | | 73,011 | | | | 114 | | | | 734 | | | | 86,047 | |
| Brazil | | * | | | | | 57 | | | \- | | | | | 18 | | | | 994 | |
| Mexico | | | 1 | | | | 48 | | | \- | | | | | 48 | | | | 3,328 | |
| France | | | 1 | | | | 58 | | | \- | | | | | 35 | | | | 3,460 | |
| Germany | | | 1 | | | | 150 | | | \- | | | | | 32 | | | | 3,395 | |
| U.K. | | | 2 | | | | 293 | | | \- | | | | | 32 | | | | 7,770 | |
| Remaining Countries – Europe (8 countries) (2) | | | 4 | | | | 358 | | | \- | | | | | 101 | | | | 8,407 | |
| Subtotal Europe | | | 8 | | | | 874 | | | | \- | | | | 230 | | | | 26,437 | |
| China | | \- | | | | \- | | | | \- | | | | | 49 | | | | 3,158 | |
| Japan | | | 2 | | | | 164 | | | \- | | | | | 48 | | | | 7,255 | |
| Singapore | | | 1 | | | | 145 | | | \- | | | | | 1 | | | | 145 | |
| Total operating portfolio (3) | | | 631 | | | | 75,206 | | | | 252 | | | | 1,138 | | | | 128,271 | |
| Total operating properties | | | 634 | | | $ | 75,624 | | | $ | 252 | | | | 1,142 | | | $ | 128,911 | |
[Table of Contents](#toc_page)
| Atlanta | | | 510 | | | | 5 | | | $ | 67 | | | | 1 | | | $ | 87 | |
| Central Valley | | | 805 | | | | 14 | | | | 196 | | | | 1 | | | | 63 | |
| Chicago | | | 84 | | | | 1 | | | | 24 | | | | 1 | | | | 184 | |
| Dallas/Ft. Worth | | | 386 | | | | 6 | | | | 130 | | | | 2 | | | | 320 | |
| Houston | | | 443 | | | | 6 | | | | 149 | | | | \- | | | | \- | |
| Seattle | | | 97 | | | | 1 | | | | 54 | | | | 1 | | | | 171 | |
| South Florida | | | 100 | | | | 1 | | | | 96 | | | | 1 | | | | 231 | |
| Southern California | | | 505 | | | | 9 | | | | 577 | | | | 5 | | | | 1,106 | |
| Remaining Markets – U.S. (18 markets) | | | 2,178 | | | | 31 | | | | 653 | | | | 7 | | | | 2,026 | |
| Subtotal U.S. | | | 5,562 | | | | 80 | | | | 2,489 | | | | 23 | | | | 5,283 | |
| Brazil | | | 419 | | | | 9 | | | | 72 | | | | \- | | | | \- | |
| Canada | | | 239 | | | | 4 | | | | 408 | | | | 2 | | | | 460 | |
| Mexico | | | 748 | | | | 13 | | | | 238 | | | | 3 | | | | 231 | |
| Subtotal Other Americas | | | 1,406 | | | | 26 | | | | 718 | | | | 5 | | | | 691 | |
| France | | | 168 | | | | 3 | | | | 136 | | | | \- | | | | \- | |
| --- | --- | --- | --- | --- | --- | --- | --- | --- | --- | --- | --- | --- | --- | --- | --- | --- | --- | --- | --- | --- |
| Atlanta | | | 41 | | | $ | 3,289 | | | $ | \- | | | | 47 | | | $ | 3,764 | |
| Central PA | | | 18 | | | | 1,489 | | | | \- | | | | 19 | | | | 1,609 | |
| Central Valley | | | 21 | | | | 1,716 | | | | \- | | | | 22 | | | | 1,856 | |
| Chicago | | | 53 | | | | 4,843 | | | | \- | | | | 70 | | | | 6,354 | |
| Houston | | | 30 | | | | 3,125 | | | | \- | | | | 36 | | | | 3,648 | |
| Lehigh Valley | | | 30 | | | | 3,884 | | | | \- | | | | 34 | | | | 4,174 | |
| Seattle | | | 16 | | | | 2,653 | | | | \- | | | | 24 | | | | 3,529 | |
| South Florida | | | 22 | | | | 3,792 | | | | 14 | | | | 28 | | | | 4,661 | |
| Southern California | | | 98 | | | | 15,639 | | | | 9 | | | | 118 | | | | 18,009 | |
| Remaining Markets – U.S. (18 markets) (2) | | | 129 | | | | 10,659 | | | | 69 | | | | 158 | | | | 12,862 | |
| Subtotal U.S. | | | 577 | | | | 66,579 | | | | 120 | | | | 700 | | | | 78,997 | |
| Brazil | | | 1 | | | | 53 | | | \- | | | | | 17 | | | | 870 | |
| Mexico | | * | | | | | 21 | | | \- | | | | | 44 | | | | 2,923 | |
| France | | | \- | | | | \- | | | \- | | | | | 34 | | | | 3,157 | |
| Germany | | | 1 | | | | 84 | | | \- | | | | | 31 | | | | 3,155 | |
| U.K. | | | 2 | | | | 422 | | | \- | | | | | 31 | | | | 7,107 | |
| Remaining Countries – Europe (8 countries) (2) | | | 2 | | | | 177 | | | \- | | | | | 97 | | | | 7,678 | |
| Subtotal Europe | | | 5 | | | | 683 | | | | \- | | | | 222 | | | | 24,096 | |
| China | | \- | | | | \- | | | | \- | | | | | 46 | | | | 3,088 | |
| Japan | | | 1 | | | | 40 | | | \- | | | | | 44 | | | | 6,709 | |
| Singapore | | | 1 | | | | 142 | | | \- | | | | | 1 | | | | 142 | |
| Total operating portfolio (3) | | | 595 | | | | 68,363 | | | | 258 | | | | 1,084 | | | | 117,670 | |
| Total operating properties | | | 601 | | | $ | 69,424 | | | $ | 258 | | | | 1,093 | | | $ | 119,301 | |
| Atlanta | | | 546 | | | | 6 | | | $ | 46 | | | | 1 | | | $ | 117 | |
| Central Valley | | | 803 | | | | 14 | | | | 262 | | | | 1 | | | | 111 | |
| Chicago | | | 103 | | | | 2 | | | | 35 | | | | 3 | | | | 381 | |
| Dallas/Ft. Worth | | | 359 | | | | 5 | | | | 121 | | | | 3 | | | | 341 | |
| Houston | | | 335 | | | | 4 | | | | 114 | | | | 1 | | | | 123 | |
| Seattle | | | 149 | | | | 2 | | | | 103 | | | | 1 | | | | 158 | |
| South Florida | | | 113 | | | | 2 | | | | 109 | | | | 1 | | | | 203 | |
| Southern California | | | 494 | | | | 9 | | | | 464 | | | | 5 | | | | 1,427 | |
| Remaining Markets – U.S. (18 markets) | | | 1,444 | | | | 23 | | | | 543 | | | | 8 | | | | 1,025 | |
| Subtotal U.S. | | | 4,681 | | | | 71 | | | | 2,133 | | | | 27 | | | | 4,628 | |
| Brazil | | | 263 | | | | 5 | | | | 56 | | | | \- | | | | \- | |
| Canada | | | 292 | | | | 5 | | | | 435 | | | | 2 | | | | 310 | |
| Mexico | | | 751 | | | | 14 | | | | 150 | | | | 5 | | | | 388 | |
| Subtotal Other Americas | | | 1,306 | | | | 24 | | | | 641 | | | | 7 | | | | 698 | |
| France | | | 176 | | | | 4 | | | | 139 | | | | 1 | | | | 65 | |
| Germany | | | 39 | | | | 1 | | | | 28 | | | | 1 | | | | 106 | |
An excerpt. Shown here: 40 of 60 rewritten, 40 of 96 added and 40 of 67 removed. The counts are complete. For every sentence, read Item 2. Properties in the FY2023 filing and the FY2022 filing.
Item 4. Mine Safety Disclosures
1 rewritten, 0 added, 0 removed, 1 unchanged
[removed: PART II][added: PART II]
Item 5. Market for Registrant’s Common Equity, Related Stockholder Matters and Issuer Purchases of Equity Securities
15 rewritten, 2 added, 1 removed, 8 unchanged
[removed: MARKET] [added: MARKET] INFORMATION AND [removed: HOLDERS][added: HOLDERS]
[removed: Stock] [added: Stock] Performance [removed: Graph][added: Graph]
The following line graph compares the change in Prologis, Inc. cumulative total stockholder’s return on shares of its common stock from December 31, [removed: 2017,] [added: 2018,] to the cumulative total return of the S&P 500 Stock Index and the Financial Times and Stock Exchange NAREIT [added: Equity REITs Index from December 31, 2018, to December 31, 2023.]
The graph assumes an initial investment of $100 in our common stock and each of the indices on December 31, [removed: 2017,] [added: 2018,] and, as required by the SEC, the reinvestment of all dividends.
[removed: 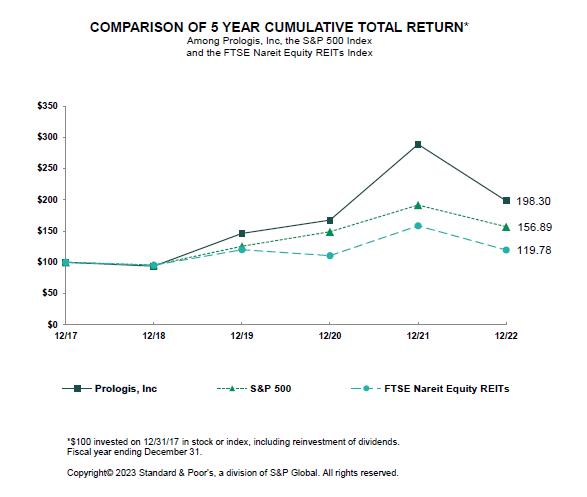][added: 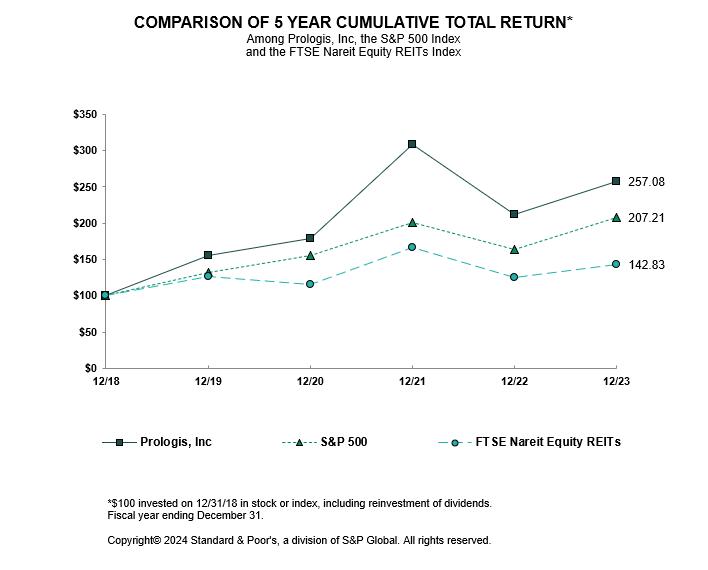]
[removed: PREFERRED] [added: PREFERRED] STOCK [removed: DIVIDENDS][added: DIVIDENDS]
At December 31, [removed: 2022,] [added: 2023,] we had 1.3 million shares of Series Q preferred stock outstanding with a liquidation preference of $50 per share that will be redeemable at our option on or after November 13, 2026.
Dividends payable per share were $4.27 for the year ended December 31, [removed: 2022.][added: 2023.]
[removed: SALES] [added: SALES] OF UNREGISTERED [removed: SECURITIES][added: SECURITIES]
During [removed: 2022,] [added: 2023,] we issued [removed: 2.1 million common limited partnership units in Prologis, L.P. in the Duke Transaction and 0.3] [added: 0.8] million shares of common stock of Prologis, Inc. in connection with the redemption of common units of Prologis, L.P. in reliance on the exemption from registration requirements of the Securities Act of 1933, as amended, afforded by Section 4(a)(2) thereof.
[removed: PURCHASES] [added: PURCHASES] OF EQUITY [removed: SECURITIES][added: SECURITIES]
During [removed: 2022,] [added: 2023,] we did not purchase any common stock of Prologis, Inc. in connection with our share purchase program.
[removed: SECURITIES] [added: SECURITIES] AUTHORIZED FOR ISSUANCE UNDER EQUITY COMPENSATION [removed: PLANS][added: PLANS]
[removed: Common] [added: Common] Stock [removed: Plans][added: Plans]
Further information relative to our equity compensation plans will be provided in our [removed: 2022] [added: 2023] Proxy Statement or in an amendment filed on Form 10-K/A.
[Table of Contents](#toc_page)
[Table of Contents](#toc_page)
Equity REITs Index from December 31, 2017, to December 31, 2022.
Item 8. Financial Statements and Supplementary Data
1 rewritten, 0 added, 0 removed, 1 unchanged
The Consolidated Balance Sheets of Prologis, Inc. and Prologis, L.P. at December 31, [removed: 2022] [added: 2023] and [removed: 2021,] [added: 2022,] the Consolidated Statements of Income of Prologis, Inc. and Prologis, L.P., the Consolidated Statements of Comprehensive Income of Prologis, Inc. and Prologis, L.P., the Consolidated Statements of Equity of Prologis, Inc., the Consolidated Statements of Capital of Prologis, L.P. and the Consolidated Statements of Cash Flows of Prologis, Inc. and Prologis, L.P. for each of the years in the three-year period ended December 31, [removed: 2022,] [added: 2023,] Notes to Consolidated Financial Statements and Schedule III — Real Estate and Accumulated Depreciation, together with the reports of KPMG LLP, independent registered public accounting firm, are included under Item 15 of this report and are incorporated herein by reference.
Item 9A. Controls and Procedures
13 rewritten, 8 added, 0 removed, 13 unchanged
[removed: Controls] [added: Controls] and Procedures (Prologis, [removed: Inc.)][added: Inc.)]
Prologis, Inc. carried out an evaluation under the supervision and with the participation of management, including the Chief Executive Officer and Chief Financial Officer, of the effectiveness of the disclosure controls and procedures (as defined in Rule 13a-15(e) under the Securities and Exchange Act of 1934 (the “Exchange Act”)) at December 31, [removed: 2022.][added: 2023.]
Subsequent to December 31, [removed: 2022,] [added: 2023,] there were no significant changes in the internal controls or in other factors that could significantly affect these controls, including any corrective actions with regard to significant deficiencies and material weaknesses.
[removed: Changes] [added: Changes] in Internal Control over Financial [removed: Reporting][added: Reporting]
There have not been any changes in Prologis, Inc.’s internal control over financial reporting (as defined in Rules 13a-15(f) and 15(d)-15(f) under the Exchange Act) that occurred during the quarter ended December 31, [removed: 2022,] [added: 2023,] that have materially affected, or are reasonably likely to materially affect, Prologis, Inc.’s internal control over financial reporting.
[removed: Management’s] [added: Management’s] Annual Report on Internal Control over Financial [removed: Reporting][added: Reporting]
Under the supervision and with the participation of management, including the Chief Executive Officer and Chief Financial Officer, an evaluation of the effectiveness of the internal control over financial reporting was conducted at December 31, [removed: 2022,] [added: 2023,] based on the criteria described in “Internal Control — Integrated Framework” (2013) issued by the Committee of Sponsoring Organizations of the Treadway Commission.
Based on this assessment, management determined that, at December 31, [removed: 2022,] [added: 2023,] the internal control over financial reporting was effective.
Our internal control over financial reporting at December 31, [removed: 2022,] [added: 2023,] has been audited by KPMG LLP, an independent registered public accounting firm, as stated in their attestation report, which is included herein.
[removed: Limitations] [added: Limitations] of the Effectiveness of [removed: Controls][added: Controls]
[removed: Controls] [added: Controls] and Procedures (Prologis, [removed: L.P.)][added: L.P.)]
Prologis, L.P. carried out an evaluation under the supervision and with the participation of management, including the Chief Executive Officer and Chief Financial Officer, of the effectiveness of the disclosure controls and procedures (as defined in Rule 13a-15(e) under the Exchange Act) at December 31, [removed: 2022.][added: 2023.]
There have not been any changes in Prologis, L.P.’s internal control over financial reporting (as defined in Rules 13a-15(f) and 15(d)-15(f) under the Exchange Act) that occurred during the quarter ended December 31, [removed: 2022,] [added: 2023,] that have materially affected, or are reasonably likely to materially affect, Prologis, L.P.’s internal control over financial reporting.
[Table of Contents](#toc_page)
Subsequent to December 31, 2023, there were no significant changes in the internal controls or in other factors that could significantly affect these controls, including any corrective actions with regard to significant deficiencies and material weaknesses.
Changes in Internal Control over Financial Reporting
Management’s Annual Report on Internal Control over Financial Reporting
Under the supervision and with the participation of management, including the Chief Executive Officer and Chief Financial Officer, an evaluation of the effectiveness of the internal control over financial reporting was conducted at December 31, 2023, based on the criteria described in “Internal Control — Integrated Framework” (2013) issued by the Committee of Sponsoring Organizations of the Treadway Commission.
Based on this assessment, management determined that, at December 31, 2023, the internal control over financial reporting was effective.
Limitations of the Effectiveness of Controls
[Table of Contents](#toc_page)
Item 9B. Other Information
0 rewritten, 1 added, 1 removed, 0 unchanged
During the period ended December 31, 2023, none of our directors or officers (as defined in Rule 16a-1(f) under the Exchange Act) adopted or terminated any Rule 10b5-1 trading arrangement or non-Rule 10b5-1 trading arrangement (as such terms are defined in Item 408 of Regulation S-K under the Act).
None.
Item 9C. Disclosure Regarding Foreign Jurisdictions that Prevent Inspections
1 rewritten, 0 added, 0 removed, 1 unchanged
[removed: PART III][added: PART III]
Item 14. Principal Accounting Fees and Services
1 rewritten, 0 added, 0 removed, 1 unchanged
[removed: PART IV][added: PART IV]
Item 15. Exhibits, Financial Statements and Schedules
3 rewritten, 1 added, 0 removed, 8 unchanged
See Index to the Consolidated Financial Statements and Schedule III on page [removed: 49] [added: 51] of this report, which is incorporated herein by reference.
(b) Exhibits: The Exhibits required by Item 601 of Regulation S-K are listed in the Index to the Exhibits on pages [removed: 104] [added: 102] to [removed: 116] [added: 113] of this report, which is incorporated herein by reference.
(c) Financial Statements: See Index to the Consolidated Financial Statements and Schedule III on page [removed: 49] [added: 51] of this report, which is incorporated by reference.
[Table of Contents](#toc_page)
Item 16. Form 10-K Summary
1,174 rewritten, 673 added, 361 removed, 784 unchanged
[removed: INDEX TO] [added: INDEX TO] THE CONSOLIDATED FINANCIAL STATEMENTS AND SCHEDULE [removed: III][added: III]
| | [removed: Page Number] [added: Page Number] |
| [Reports of Independent Registered Public Accounting [removed: Firm](#Report_1)] [added: Firm](#report_1)] | [removed: 50] [added: 52] |
| [Consolidated Balance [removed: Sheets](#B_S_1)] [added: Sheets](#b_s_1)] | [removed: 55] [added: 55] |
| [Consolidated Statements of [removed: Income](#S_O_1)] [added: Income](#s_o_1)] | [removed: 56] [added: 56] |
| [Consolidated Statements of Comprehensive [removed: Income](#S_C_I_1)] [added: Income](#s_c_i_1)] | [removed: 57] [added: 57] |
| [Consolidated Statements of [removed: Equity](#S_E_1)] [added: Equity](#s_e_1)] | [removed: 58] [added: 58] |
| [Consolidated Statements of Cash [removed: Flows](#S_C_F_1)] [added: Flows](#s_c_f_1)] | [removed: 59] [added: 59] |
| [Consolidated Balance [removed: Sheets](#B_S_2)] [added: Sheets](#b_s_2)] | [removed: 60] [added: 60] |
| [Consolidated Statements of [removed: Income](#S_O_2)] [added: Income](#s_o_2)] | [removed: 61] [added: 61] |
| [Consolidated Statements of Comprehensive [removed: Income](#S_C_I_2)] [added: Income](#s_c_i_2)] | [removed: 62] [added: 62] |
| [Consolidated Statements of [removed: Capital](#S_C_2)] [added: Capital](#s_c_2)] | [removed: 63] [added: 63] |
| [Consolidated Statements of Cash [removed: Flows](#S_C_F_2)] [added: Flows](#s_c_f_2)] | [removed: 64] [added: 64] |
| [Notes to the Consolidated Financial [removed: Statements](#NOTES_TO_CONSOLIDATED_FINANCIAL_STATEMEN)] [added: Statements](#notes_to_consolidated_financial_statemen)] | [removed: 65] [added: 65] |
| [Note 1. Description of the [removed: Business](#NoteOne)] [added: Business](#noteone)] | [removed: 65] [added: 65] |
| [Note 2. Summary of Significant Accounting [removed: Policies](#NoteTwo)] [added: Policies](#notetwo)] | [removed: 65] [added: 65] |
| [Note 3. [removed: Acquisitions](#NoteThree)] [added: Duke Transaction](#notethree)] | [removed: 72] [added: 72] |
| [Note 4. Real [removed: Estate](#NoteFour)] [added: Estate](#notefour)] | [removed: 73] [added: 73] |
| [Note 5. Unconsolidated [removed: Entities](#NoteFive)] [added: Entities](#notefive)] | [removed: 75] [added: 75] |
| [Note 6. Assets Held for Sale or [removed: Contribution](#NoteSix)] [added: Contribution](#notesix)] | [removed: 78] [added: 77] |
| [Note 7. Other Assets and Other [removed: Liabilities](#NoteEight)] [added: Liabilities](#noteeight)] | [removed: 78] [added: 78] |
| [Note 8. [removed: Debt](#NoteNine)] [added: Debt](#notenine)] | [removed: 79] [added: 79] |
| [Note 9. Stockholders' Equity of Prologis, [removed: Inc.](#NoteTen)] [added: Inc.](#noteten)] | [removed: 83] [added: 82] |
| [Note 10. Partners' Capital of Prologis, [removed: L.P.](#NoteEleven)] [added: L.P.](#noteeleven)] | [removed: 84] [added: 84] |
| [Note 11. Noncontrolling [removed: Interests](#NoteTwelve)] [added: Interests](#notetwelve)] | [removed: 85] [added: 84] |
| [Note 12. Long-Term [removed: Compensation](#NoteThirteen)] [added: Compensation](#notethirteen)] | [removed: 85] [added: 85] |
| [Note 13. Income [removed: Taxes](#NoteFourteen)] [added: Taxes](#notefourteen)] | [removed: 88] [added: 87] |
| [Note 14. Earnings Per Common Share or [removed: Unit](#EPS)] [added: Unit](#eps)] | [removed: 90] [added: 89] |
| [Note 15. Financial Instruments and Fair Value [removed: Measurements](#NoteSixteen)] [added: Measurements](#notesixteen)] | [removed: 91] [added: 90] |
| [Note 16. Commitments and [removed: Contingencies](#NoteSeventeen)] [added: Contingencies](#noteseventeen)] | [removed: 94] [added: 93] |
| [Note 17. Business [removed: Segments](#NoteEighteen)] [added: Segments](#noteeighteen)] | [removed: 95] [added: 94] |
| [Note 18. Supplemental Cash Flow [removed: Information](#NoteNineteen)] [added: Information](#notenineteen)] | [removed: 97] [added: 96] |
| [Note 19. Selected Quarterly Financial Data [removed: (Unaudited)](#NoteTwenty)] [added: (Unaudited)](#notetwenty)] | [removed: 99] [added: 97] |
| [Schedule III — Real Estate and Accumulated [removed: Depreciation](#SCHEDULE_III_REAL_ESTATE_ACCUMULATED_DEP)] [added: Depreciation](#schedule_iii_real_estate_accumulated_dep)] | [removed: 101] [added: 99] |
[removed: REPORT] [added: REPORT] OF INDEPENDENT REGISTERED PUBLIC ACCOUNTING [removed: FIRM][added: FIRM]
[removed: Opinion] [added: *Opinion] on the Consolidated Financial [removed: Statements][added: Statements*]
We have audited the accompanying consolidated balance sheets of Prologis, Inc. and subsidiaries (the Company) as of December 31, [removed: 2022] [added: 2023,] and [removed: 2021,] [added: 2022,] the related consolidated statements of income, comprehensive income, equity, and cash flows for each of the years in the three-year period ended December 31, [removed: 2022,] [added: 2023,] and the related notes and financial statement schedule III (collectively, the consolidated financial statements).
In our opinion, the consolidated financial statements present fairly, in all material respects, the financial position of the Company as of December 31, [removed: 2022] [added: 2023,] and [removed: 2021,] [added: 2022,] and the results of its operations and its cash flows for each of the years in the three-year period ended December 31, [removed: 2022,] [added: 2023,] in conformity with U.S. generally accepted accounting principles.
We also have audited, in accordance with the standards of the Public Company Accounting Oversight Board (United States) (PCAOB), the Company’s internal control over financial reporting as of December 31, [removed: 2022,] [added: 2023,] based on criteria established in *Internal Control – Integrated Framework (2013)* issued by the Committee of Sponsoring Organizations of the Treadway Commission, and our report dated February [removed: 14, 2023] [added: 13, 2024] expressed an unqualified opinion on the effectiveness of the Company’s internal control over financial reporting.
[removed: Basis] [added: *Basis] for [removed: Opinion][added: Opinion*]
[Table of Contents](#toc_page)
| | |
[Table of Contents](#toc)
February 13, 2024
[Table of Contents](#toc)
*Opinion on the Consolidated Financial Statements*
*Basis for Opinion*
*Critical Audit Matter*
The critical audit matter communicated below is a matter arising from the current period audit of the consolidated financial statements that was communicated or required to be communicated to the audit committee and that: (1) relates to accounts or disclosures that are material to the consolidated financial statements and (2) involved our especially challenging, subjective, or complex judgments.
The communication of a critical audit matter does not alter in any way our opinion on the consolidated financial statements, taken as a whole, and we are not, by communicating the critical audit matter below, providing a separate opinion on the critical audit matter or on the accounts or disclosures to which it relates.
February 13, 2024
[Table of Contents](#toc)
*Basis for Opinion*
February 13, 2024
[Table of Contents](#toc)
CONSOLIDATED BALANCE SHEETS
| Cash and cash equivalents | | 530,388 | | | | 278,483 | |
[Table of Contents](#toc)
| Gains (losses) on early extinguishment of debt | | | 3,275 | | | | (20,184 | ) | | | (187,453 | ) |
[Table of Contents](#toc)
PROLOGIS, INC.
| | | Years Ended December 31, | | | | | | | | | | |
[Table of Contents](#toc)
PROLOGIS, INC.
(In thousands)
| | | | | | | | | | | | | | | | | | | | | | | | | | | | | | | | |
| Consolidated net earnings | | \- | | | | \- | | | | \- | | | | \- | | | | \- | | | | 3,059,214 | | | | 193,931 | | | | 3,253,145 | |
| Effect of equity compensation plans | | \- | | | | 410 | | | | 5 | | | | 84,719 | | | | \- | | | | \- | | | | 195,987 | | | | 280,711 | |
| Redemption of noncontrolling interests | | \- | | | | 839 | | | | 8 | | | | 48,349 | | | | \- | | | | \- | | | | (118,164 | ) | | | (69,807 | ) |
| Foreign currency translation gains, net | | \- | | | | \- | | | | \- | | | | \- | | | | 19,867 | | | | \- | | | | 896 | | | | 20,763 | |
| Dividends ($3.48 per common share) and other distributions | | \- | | | | \- | | | | \- | | | | (2 | ) | | | \- | | | | (3,228,587 | ) | | | (235,050 | ) | | | (3,463,639 | ) |
| Balance at December 31, 2023 | $ | 63,948 | | | | 924,391 | | | $ | 9,244 | | | $ | 54,249,801 | | | $ | (514,201 | ) | | $ | (627,068 | ) | | $ | 4,641,996 | | | $ | 57,823,720 | |
[Table of Contents](#toc)
PROLOGIS, INC.
CONSOLIDATED STATEMENTS OF CASH FLOWS
(In thousands)
| | | Years Ended December 31, | | | | | | | | | | |
| Consolidated net earnings | | $ | 3,253,145 | | | $ | 3,555,398 | | | $ | 3,148,590 | |
| Depreciation and amortization | | | 2,484,891 | | | | 1,812,777 | | | | 1,577,942 | |
[Table of Contents](#toc)
| --- | --- |
[Index to Item 15](#Index)
The following are the primary procedures we performed to address this critical audit matter.
Duke Realty transaction
As discussed in Note 3 to the consolidated financial statements, on October 3, 2022 Prologis, Inc. and Prologis, L.P. acquired Duke Realty Corporation and Duke Realty Limited Partnership (collectively the “Duke Realty transaction”) for $23.2 billion and the transaction was accounted for as an asset acquisition.
In asset acquisitions, the Company measures the real estate assets acquired based on their cost or total consideration exchanged and any excess or bargain consideration is allocated to the real estate properties and related lease intangibles on a relative fair value basis.
The components of the acquisition include an initial allocation to investments in real estate properties acquired based on fair value and an initial allocation of that fair value to buildings and land.
The Company determines fair value of the real estate properties based on the expected future cash flows of the property and various characteristics of the markets where the property is located utilizing an income approach methodology, which may be a discounted cash flow analysis or applying a capitalization rate to the estimated net operating income of a property.
We identified the evaluation of the fair value allocated to investments in real estate properties acquired, including the allocation of the property fair value to land and building, in the Duke Realty transaction as a critical audit matter.
Evaluating the fair value amounts estimated by the Company in the allocation involved complex auditor judgment as a result of measurement uncertainty.
Specifically, testing significant assumptions of market rents and capitalization rates related to investments in real estate and testing the allocation of property fair value to land and building required specialized skills and knowledge.
We evaluated the design and tested the operating effectiveness of certain internal controls over the Company’s fair value estimation process for investments in real estate properties, including land and building.
This included controls related to the determination of amounts allocated to land and building and determination of market rents and capitalization rates used to estimate the fair value of investments in real estate properties.
For a selection of investments in real estate properties we involved valuation professionals with specialized skills and knowledge, who assisted in:
| | • | Comparing the Company’s determination of the fair value of investments in real estate properties to sales prices from available property sales |
| --- | --- | --- |
| | • | Comparing the Company’s market rent and capitalization rate assumptions used in the determination of the fair value of investments in real estate properties to available leasing information, industry research publications and inquiries of market participants |
| | • | Comparing the Company’s determination of the fair value of land to sales prices from available land sales |
| | • | Comparing the Company’s determination of the fair value of building to developed ranges of estimates based on market data, such as industry guides used for developing replacement building values. |
February 14, 2023
The Company determines fair value of the real estate properties based on the expected future cash flows of the property and various characteristics of the markets where the property is located utilizing an income approach methodology, which may be a discounted cash flow analysis or applying a capitalization
rate to the estimated net operating income of a property.
| | • | Comparing the Company’s determination of the fair value of building to developed ranges of estimates based on market data, such as industry guides used for developing replacement building values |
| --- | --- | --- | --- | --- | --- | --- | --- | --- | --- | --- | --- | --- |
| Balance at January 1, 2020 | $ | 68,948 | | | | 631,797 | | | $ | 6,318 | | | $ | 25,719,427 | | | $ | (990,398 | ) | | $ | (2,151,168 | ) | | $ | 3,418,657 | | | $ | 26,071,784 | |
| Consolidated net earnings | | \- | | | | \- | | | | \- | | | | \- | | | | \- | | | | 1,481,814 | | | | 134,816 | | | | 1,616,630 | |
| Effect of equity compensation plans | | \- | | | | 690 | | | | 7 | | | | 27,745 | | | | \- | | | | \- | | | | 82,233 | | | | 109,985 | |
| Liberty Transaction, net of issuance costs | | \- | | | | 106,723 | | | | 1,067 | | | | 9,801,373 | | | | \- | | | | \- | | | | 211,086 | | | | 10,013,526 | |
| Repurchase of common stock | | \- | | | | (539 | ) | | | (5 | ) | | | (34,824 | ) | | | \- | | | | \- | | | | \- | | | | (34,829 | ) |
| Repurchase of preferred stock | | (5,000 | ) | | | \- | | | | \- | | | | 147 | | | | \- | | | | (2,347 | ) | | | \- | | | | (7,200 | ) |
| Redemption of noncontrolling interests | | \- | | | | 710 | | | | 7 | | | | 30,727 | | | | \- | | | | \- | | | | (147,712 | ) | | | (116,978 | ) |
| Foreign currency translation losses, net | | \- | | | | \- | | | | \- | | | | \- | | | | (189,599 | ) | | | \- | | | | (5,074 | ) | | | (194,673 | ) |
| Dividends ($2.32 per common share) and other distributions | | \- | | | | \- | | | | \- | | | | (548 | ) | | | \- | | | | (1,722,989 | ) | | | (361,636 | ) | | | (2,085,173 | ) |
| IPT Transaction, net of cash acquired | | | \- | | | | \- | | | | (1,665,359 | ) |
| Repurchase and retirement of common stock | | | \- | | | | \- | | | | (34,829 | ) |
| Repurchase of preferred stock | | | \- | | | | \- | | | | (7,200 | ) |
| Loss on preferred unit repurchase | | | \- | | | | \- | | | | 2,347 | |
| --- | --- | --- | --- | --- | --- | --- | --- | --- | --- | --- | --- | --- | --- | --- | --- | --- | --- | --- | --- | --- | --- | --- | --- | --- | --- | --- | --- | --- | --- | --- | --- | --- | --- | --- | --- | --- | --- | --- | --- |
| Balance at January 1, 2020 | | 1,379 | | | $ | 68,948 | | | | 631,797 | | | $ | 22,584,179 | | | | 9,933 | | | $ | 355,076 | | | | 8,613 | | | $ | 288,187 | | | $ | 2,775,394 | | | $ | 26,071,784 | |
| Consolidated net earnings | | \- | | | | \- | | | | \- | | | | 1,481,814 | | | | \- | | | | 25,359 | | | | \- | | | | 16,262 | | | | 93,195 | | | | 1,616,630 | |
An excerpt. Shown here: 40 of 1,174 rewritten, 40 of 673 added and 40 of 361 removed. The counts are complete. For every sentence, read Item 16. Form 10-K Summary in the FY2023 filing and the FY2022 filing.