 filings.tools
Item 5. MARKET FOR REGISTRANT’S COMMON EQUITY, RELATED STOCKHOLDER MATTERS AND ISSUER PURCHASES OF EQUITY SECURITIES
9K characters. Original on sec.gov · Markdown
Item 5. MARKET FOR REGISTRANT’S COMMON EQUITY, RELATED STOCKHOLDER MATTERS AND ISSUER PURCHASES OF EQUITY SECURITIES
Our common stock is listed on the New York Stock Exchange and is traded under the symbol “PNC.” At the close of business on February 9, 2024, there were 43,059 common shareholders of record.
Holders of PNC common stock are entitled to receive dividends when declared by our Board of Directors out of funds legally available for this purpose. Our Board of Directors may not pay or set apart dividends on the common stock until dividends for all past dividend periods on any series of outstanding preferred stock and certain outstanding capital securities issued by the parent company have been paid or declared and set apart for payment. The Board of Directors presently intends to continue the policy of paying quarterly cash dividends. The amount of any future dividends will depend on economic and market conditions, our financial condition and operating results, and other factors, including contractual restrictions and applicable government regulations and policies (such as those relating to the ability of bank and non-bank subsidiaries to pay dividends to the parent company and regulatory capital limitations). PNC’s ability to pay or increase dividends or otherwise return capital to shareholders is subject to PNC’s compliance with its SCB, which is determined at least annually through the Federal Reserve’s CCAR process as described in the Supervision and Regulation section in Item 1 of this Report. Consistent with the SCB framework, which allows for capital return in amounts in excess of the SCB minimum levels, our Board of Directors has authorized a repurchase framework under the previously approved repurchase program of up to 100 million common shares, of which approximately 45% were still available for repurchase at December 31, 2023. In light of the Federal banking agencies proposed rules to adjust the Basel III capital framework, share repurchase activity is expected to remain modest during the first quarter of 2024. PNC continues to evaluate the potential impact of the proposed rules and may adjust share repurchase activity depending on market and economic conditions, as well as other factors. PNC’s SCB for the four-quarter period beginning October 1, 2023 is the regulatory minimum of 2.5%.
For further information concerning dividend restrictions and other factors that could limit our ability to pay dividends, as well as restrictions on loans, dividends or advances from bank subsidiaries to the parent company, see the Supervision and Regulation section in Item 1, Item 1A Risk Factors and the Liquidity and Capital Management portion of the Risk Management section in Item 7, and Note 9 Borrowed Funds, Note 11 Equity and Note 19 Regulatory Matters, which we include here by reference.
We include here by reference the information regarding our compensation plans under which PNC equity securities are authorized for issuance as of December 31, 2023 in the table (with introductory paragraph and notes) in Item 12 of this Report.
Our stock transfer agent and registrar is:
Computershare
150 Royall Street, Suite 101
Canton, MA 02021
800-982-7652
Hearing impaired: 800-952-9245
Registered shareholders may contact Computershare regarding dividends and other shareholder services.
We include here by reference the information that appears under the Common Stock Performance Graph caption at the end of this Item 5.
Unregistered Sales of Equity Securities
None.
The PNC Financial Services Group, Inc. – 2023 Form 10-K 35
Equity Security Repurchases
Details of our repurchases of PNC common stock during the fourth quarter of 2023 are included in the following table.
| 2023 period In thousands, except per share data | Total shares purchased (a) | Average price paid per share | Total shares purchased as part of publicly announced programs (b) | Maximum number of shares that may yet be purchased under the programs (b) | ||||||||||
| October 1 – 31 | 10 | $ | 118.13 | 45,500 | ||||||||||
| November 1 – 30 | 78 | $ | 128.58 | 78 | 45,422 | |||||||||
| December 1 – 31 | 437 | $ | 154.36 | 437 | 44,985 | |||||||||
| Total | 525 | $ | 149.83 | 515 |
(a)Includes PNC common stock purchased in connection with our various employee benefit plans generally related to forfeitures of unvested restricted stock awards and shares used to cover employee payroll tax withholding requirements. Note 16 Employee Benefit Plans and Note 17 Stock Based Compensation Plans include additional information regarding our employee benefit and equity compensation plans that use PNC common stock.
(b)Consistent with the SCB framework, which allows for capital return in amounts in excess of the SCB minimum levels, our Board of Directors has authorized a repurchase framework under the previously approved repurchase program of up to 100 million common shares, of which approximately 45 million shares, or 45% were still available for repurchase at December 31, 2023. In light of the Federal banking agencies proposed rules to adjust the Basel III capital framework, share repurchase activity is expected to remain modest during the first quarter of 2024. PNC continues to evaluate the potential impact of the proposed rules and may adjust share repurchase activity depending on market and economic conditions, as well as other factors. PNC’s SCB for the four-quarter period beginning October 1, 2023 is the regulatory minimum of 2.5%. Under the SCB framework we repurchased 4.0 million shares in 2023 and 21.1 million shares in 2022.
Common Stock Performance Graph
This graph shows the cumulative total shareholder return (i.e., price change plus reinvestment of dividends) on our common stock during the five-year period ended December 31, 2023, as compared with: (i) a selected peer group as set forth below and referred to as the “Peer Group”; (ii) an overall stock market index, the S&P 500 Index; and (iii) a published industry index, the S&P 500 Banks. The yearly points marked on the horizontal axis of the graph correspond to December 31 of each year. The stock performance graph assumes that $100 was invested at market close on December 31, 2018 for the five-year period and that dividends were reinvested. The table below the graph shows the resultant compound annual growth rate for the performance period.
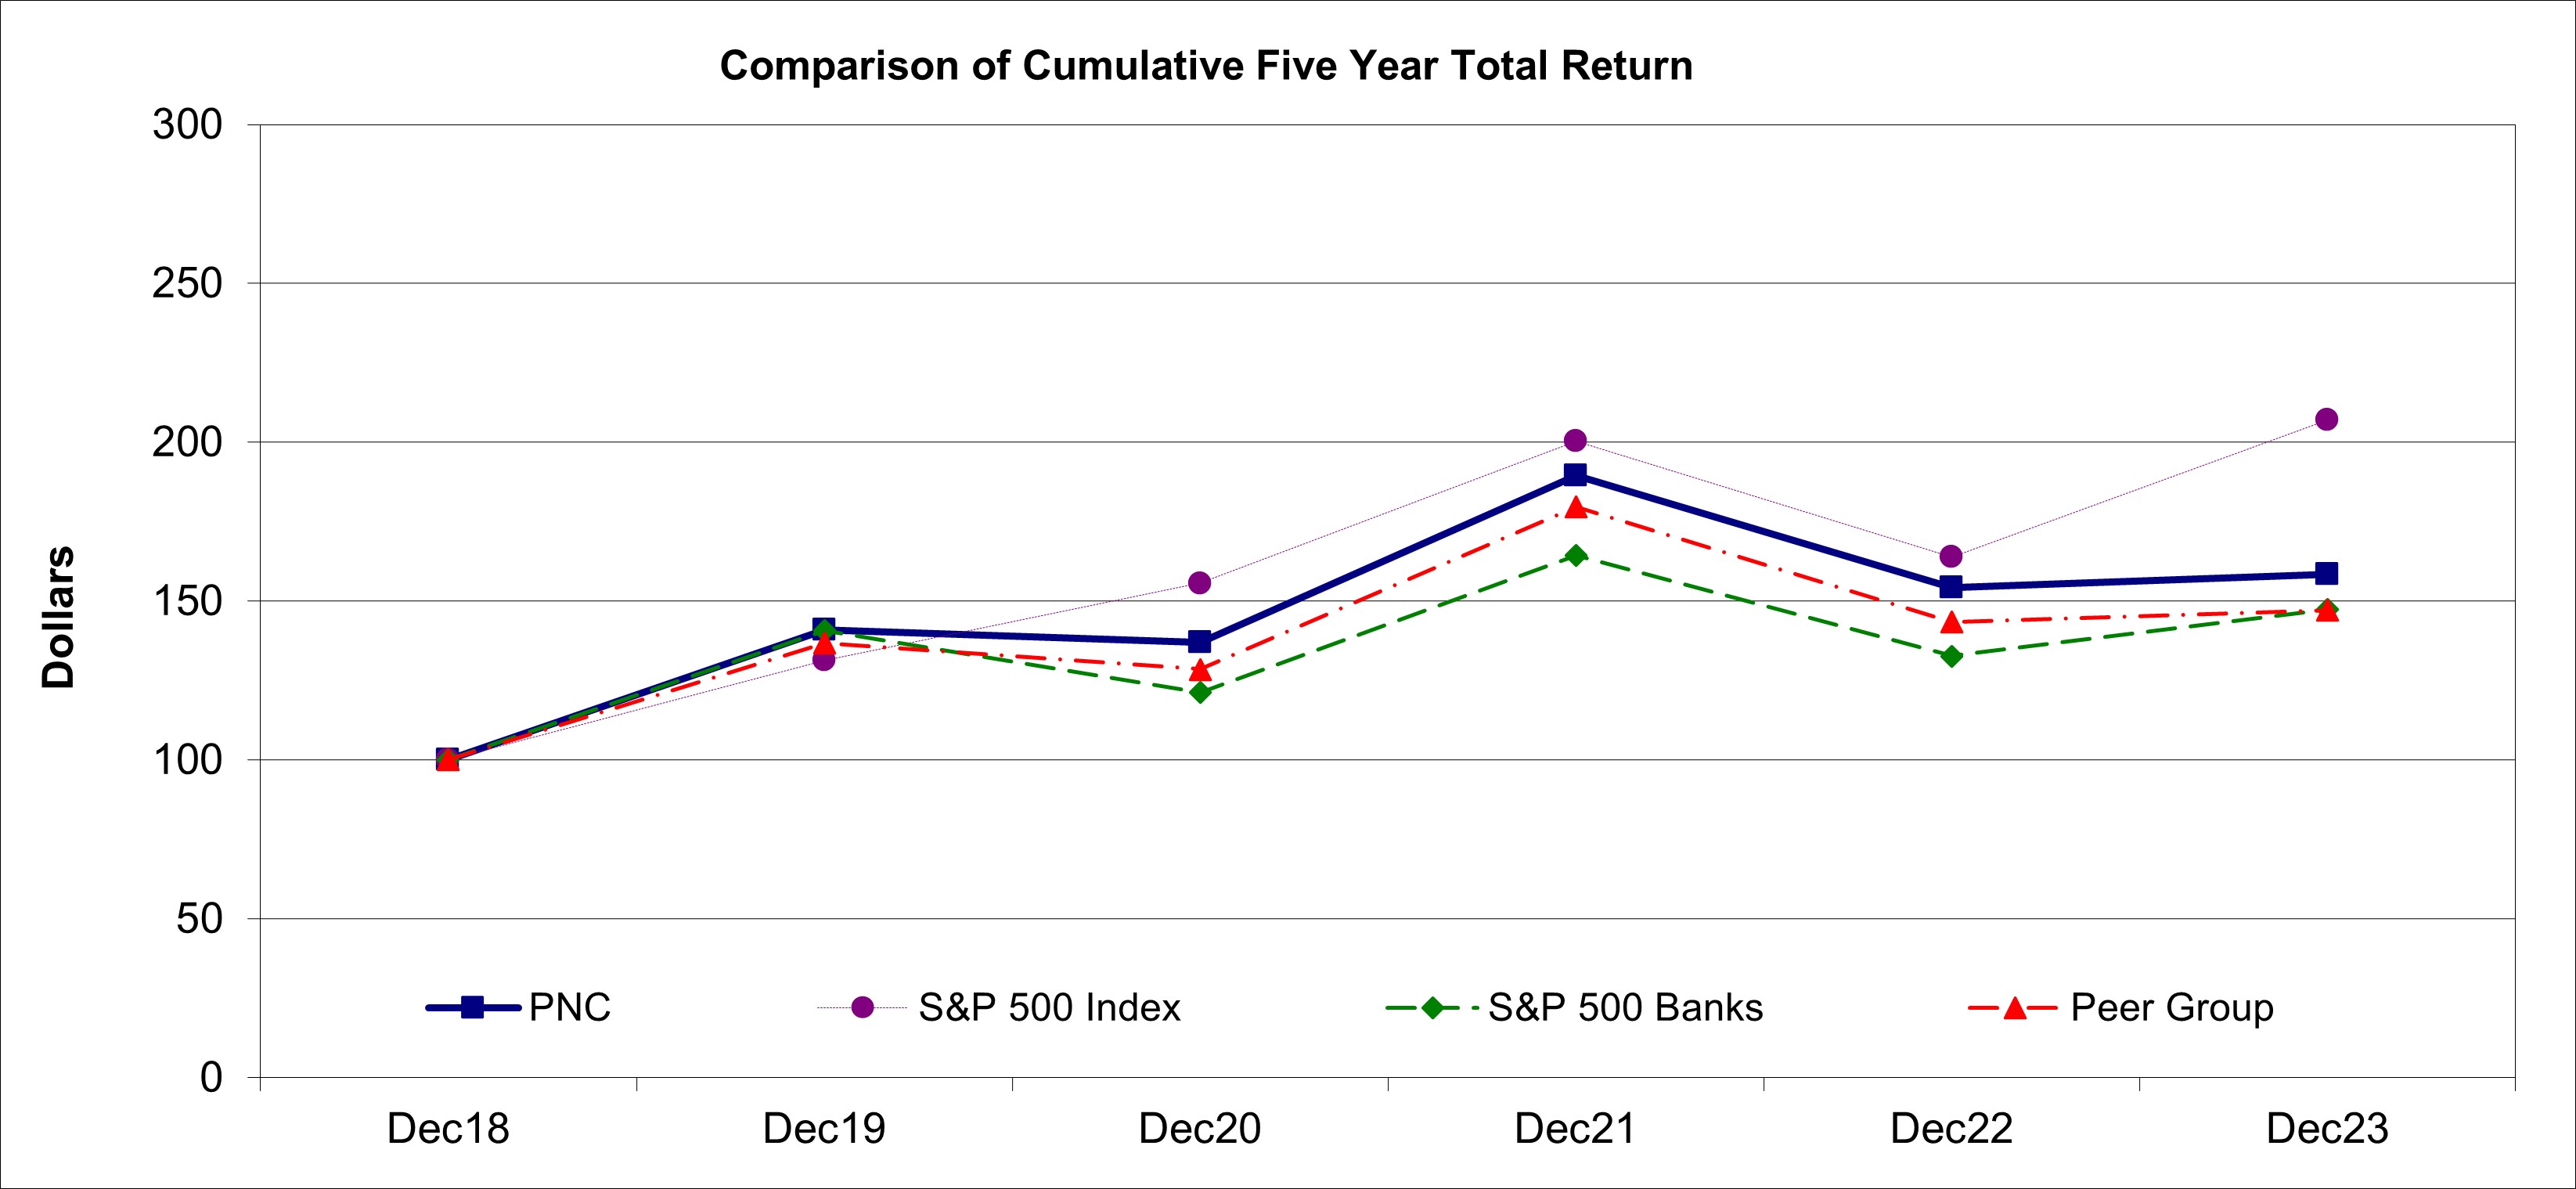
| Base Period | Assumes $100 investment at Close of Market on December 31, 2018 Total Return = Price change plus reinvestment of dividends | 5-Year Compound Growth Rate | |||||||||||||||||||||
| Dec. 2018 | Dec. 2019 | Dec. 2020 | Dec. 2021 | Dec. 2022 | Dec. 2023 | ||||||||||||||||||
| PNC | $ | 100 | $ | 140.89 | $ | 137.04 | $ | 189.42 | $ | 154.26 | $ | 158.41 | 9.64 | % | |||||||||
| S&P 500 Index | $ | 100 | $ | 131.47 | $ | 155.65 | $ | 200.29 | $ | 163.98 | $ | 207.04 | 15.67 | % | |||||||||
| S&P 500 Banks | $ | 100 | $ | 140.64 | $ | 121.29 | $ | 164.28 | $ | 132.73 | $ | 147.28 | 8.05 | % | |||||||||
| Peer Group | $ | 100 | $ | 136.89 | $ | 128.54 | $ | 179.63 | $ | 143.33 | $ | 147.08 | 8.02 | % |
The Peer Group for the preceding chart and table above consists of the following companies: Bank of America Corporation; Capital One Financial Corporation; Citizens Financial Group, Inc.; Fifth Third Bancorp; JPMorgan Chase & Co.; KeyCorp; M&T Bank Corporation; Regions Financial Corporation; The PNC Financial Services Group, Inc.; Truist Financial Corporation; U.S. Bancorp; and Wells Fargo & Company. For Truist Financial Corporation, the preceding chart and table reflects historical BB&T Corporation
36 The PNC Financial Services Group, Inc. – 2023 Form 10-K
data up until December 6, 2019, without inclusion of historical data from SunTrust Banks, Inc. This Peer Group was approved for 2023 by the Board’s Personnel and Compensation Committee, and the Committee has approved the same peer group for 2024.
Each yearly point for the Peer Group is determined by calculating the cumulative total shareholder return for each company in the Peer Group from December 31, 2018 to December 31 of that year, or the last business day of that year (End of Month Dividend Reinvestment Assumed) and then using the median of these returns as the yearly plot point.
In accordance with the rules of the SEC, this section, captioned “Common Stock Performance Graph,” is not incorporated by reference into any of our future filings made under the Securities Exchange Act of 1934 or the Securities Act of 1933. The Common Stock Performance Graph, including its accompanying table and footnotes, is not deemed to be soliciting material or to be filed under the Exchange Act or the Securities Act.
Previous: Item 4. MINE SAFETY DISCLOSURES · Next: Item 6. RESERVED