 filings.tools
Insulet 10-K 2018-12-31
Filed 2019-02-26. 22 sections, 392K characters. Original on sec.gov · Markdown · JSON
Cover and table of contents
10-K 1 podd-2018x12x31_10xk.htm 10-K_PODD-2018-12-31
UNITED STATES SECURITIES AND EXCHANGE COMMISSION
Washington, D.C. 20549
Form 10-K
| x | ANNUAL REPORT PURSUANT TO SECTION 13 OR 15(d) OF THE SECURITIES EXCHANGE ACT OF 1934 |
| For the fiscal year ended December 31, 2018 |
| ¨ | TRANSITION REPORT PURSUANT TO SECTION 13 OR 15(d) OF THE SECURITIES EXCHANGE ACT OF 1934 |
| For the transition period from to |
Commission File Number 001-33462
INSULET CORPORATION
(Exact name of Registrant as specified in its charter)
| Delaware | 04-3523891 | |
| (State or Other Jurisdiction of Incorporation or Organization) | (I.R.S. Employer Identification No.) | |
| 100 Nagog Park Acton, Massachusetts | 01720 | |
| (Address of Principal Executive Offices) | (Zip Code) |
Registrant’s telephone number, including area code:
(978) 600-7000
Securities registered pursuant to Section 12(b) of the Act:
| Title of Each Class | Name of Each Exchange on Which Registered | |
| Common Stock, $0.001 Par Value Per Share | The NASDAQ Stock Market, LLC |
Securities registered pursuant to Section 12(g) of the Act:
None
Indicate by check mark if the registrant is a well-known seasoned issuer, as defined in Rule 405 of the Securities Act. Yes x No ¨
Indicate by check mark if the registrant is not required to file reports pursuant to Section 13 or Section 15(d) of the Act. Yes ¨ No x
Indicate by check mark whether the registrant (1) has filed all reports required to be filed by Section 13 or 15(d) of the Securities Exchange Act of 1934 during the preceding 12 months (or for such shorter period that the Registrant was required to file such reports) and (2) has been subject to such filing requirements for the past 90 days. Yes x No ¨
Indicate by check mark whether the registrant has submitted electronically and posted on its corporate Web site, if any, every Interactive Data File required to be submitted and posted pursuant to Rule 405 of Regulation S-T (§ 232.405 of this chapter) during the preceding 12 months (or for such shorter period that the registrant was required to submit and post such files). Yes x No ¨
Indicate by check mark if disclosure of delinquent filers pursuant to Item 405 of Regulation S-K (§ 229.405) is not contained herein, and will not be contained, to the best of registrant’s knowledge, in definitive proxy or information statements incorporated by reference in Part III of this Form 10-K or any amendment to this Form 10-K. x
Indicate by check mark whether the registrant is a large accelerated filer, an accelerated filer, a non-accelerated filer, or a smaller reporting company. See the definitions of “large accelerated filer,” “accelerated filer” and “smaller reporting company” in Rule 12b-2 of the Exchange Act. (Check one):
| Large accelerated filer x | Accelerated filer o | Non-accelerated filer o | Smaller reporting company o | |||
| (Do not check if a smaller reporting company) |
Indicate by check mark whether the Registrant is a shell company (as defined in Rule 12b-2 of the Exchange Act). Yes ¨ No x
The aggregate market value of the common stock held by non-affiliates of the registrant computed by reference to the last reported sale price of the Common Stock as reported on The NASDAQ Global Market on June 30, 2018 was approximately $5.0 billion.
The number of shares outstanding of each of the registrant’s classes of common stock as of February 20, 2019:
| Title of Class | Shares Outstanding | |
| Common Stock, $0.001 Par Value Per Share | 59,278,993 |
DOCUMENTS INCORPORATED BY REFERENCE
The registrant intends to file a proxy statement pursuant to Regulation 14A within 120 days of the end of the fiscal year ended December 31, 2018. Portions of such proxy statement are incorporated by reference into Part III of this Annual Report on Form 10-K.
TABLE OF CONTENTS
PART I
Item 1. Business
Overview
We are primarily engaged in the development, manufacturing and sale of our proprietary Omnipod® System, an innovative, discreet and easy-to-use continuous insulin delivery system for people with insulin-dependent diabetes. The Omnipod System consists of two product lines: the Omnipod Insulin Management System (“Omnipod”), which we have been selling since 2005, and our next generation Omnipod DASHTM Insulin Management System ("Omnipod DASH" or "DASH"), which began a U.S. limited market release in 2018. Collectively, we refer to these products as the "Omnipod System".
There are two primary types of insulin therapy practiced today: multiple daily injection (“MDI”) therapy using syringes or insulin pens; and pump therapy using insulin pumps. Insulin pumps are used to perform continuous subcutaneous insulin infusion and typically use a programmable device and an infusion set to administer insulin into the person’s body. Insulin pump therapy has been shown to provide people with insulin-dependent diabetes with numerous advantages relative to MDI therapy. We estimate that approximately one-third of the Type 1 diabetes population in the United States and less than one fifth of the Type 1 diabetes population outside the United States use insulin pump therapy. An even smaller portion of the insulin-dependent Type 2 diabetes population in the United States use insulin pump therapy. We believe these factors present a significant available market for the Omnipod System globally.
The Omnipod System features two discreet, easy-to-use devices: a small, lightweight, self-adhesive disposable tubeless Pod ("Pod"), which is worn on the body and provides up to three days of non-stop insulin delivery without the need to see or handle a needle; and a handheld Personal Diabetes Manager ("PDM"). The Pod can be worn in multiple locations, including the abdomen, hip, back of upper arm, upper thigh or lower back and, because it is waterproof, there is no need to remove it when showering, swimming or performing other activities. The Omnipod System communicates wirelessly, provides for virtually pain-free automated cannula insertion and eliminates the need for traditional MDI therapy or the use of traditional pump and tubing. We believe that the Omnipod System’s unique proprietary design and features allow people with insulin-dependent diabetes to manage their diabetes with unprecedented freedom, comfort, convenience, and ease.
We began commercial sales of the Omnipod in the United States in 2005 and we sell the Omnipod directly to end-users or through intermediaries. The Omnipod is also available in multiple countries in Europe, as well as in Canada and Israel. On July 1, 2018, we commenced direct commercial operations for the Omnipod in Europe immediately following the expiration of our distribution agreement with our former European distributor. In June 2018, the U.S. Food and Drug Administration ("FDA") cleared for commercial sale our Omnipod DASH, which is our next-generation digital mobile Omnipod platform within the Omnipod System family, featuring secured Bluetooth wireless technology for connectivity between the Pod and the color touchscreen smartphone PDM. The DASH PDM is optimized for use with the CONTOUR® NEXT ONE Blood Glucose (BG) Meter for the direct transfer of blood glucose readings to the PDM's bolus calculator. Bluetooth functionality will also provide connectivity to our smartphone apps. We commenced a limited commercial release of Omnipod DASH in 2018 prior to a planned full market launch in the U.S. in the first half of 2019.
For the year ended December 31, 2018, approximately 69% of our consolidated revenue was from sales in the United States and approximately 31% from international sales.
In January 2018, the Centers for Medicare & Medicaid Services (“CMS”) issued guidance clarifying that Medicare Part D Plan Sponsors may provide coverage for products such as the Omnipod System under the Medicare Part D (prescription drug) program. During 2018, we began securing coverage with Medicare Part D carriers to ensure beneficiaries living with diabetes have access to the Omnipod System. Securing Medicare Part D coverage also provides a direct pathway to increased Medicaid coverage at the state level, as many state-run Medicaid programs follow CMS prescription drug guidance to determine coverage. This increased Medicaid access allows access for lower-income individuals and families for whom Omnipod had previously not been a covered option. In April 2018, we also significantly increased our market access when we secured in-network coverage of Omnipod with UnitedHealthcare, the largest commercial payer in the United States.
In addition to the diabetes market space, we have partnered with pharmaceutical and biotechnology companies to tailor the Omnipod System technology platform for the delivery of subcutaneous drugs across other therapeutic areas. The majority of our drug delivery revenue currently consists of sales of Pods used in Amgen's Neulasta Onpro kit, an innovative delivery system for Amgen’s white blood cell booster to help reduce the risk of infection during intense chemotherapy.
We have substantially completed the construction of a highly-automated manufacturing facility in Acton, Massachusetts, with planned production out of the facility beginning in the first half of 2019. The facility also serves as our global headquarters. We expect that, following start-up related activities, the new facility will allow us to lower our manufacturing costs, increase supply redundancy, add capacity closer to our largest customer base and support our growth trajectory.
Market Opportunity: Management of Diabetes
Diabetes is a chronic, life-threatening disease for which there is no known cure. It is caused by the body’s inability to produce or effectively utilize the hormone insulin, which prevents the body from adequately regulating blood glucose levels. Glucose, the primary source of energy for cells, must be maintained at certain concentrations in the blood in order to permit optimal cell function and health. In people with diabetes, blood glucose levels fluctuate between very high levels, a condition known as hyperglycemia, and very low levels, a condition called hypoglycemia. Hyperglycemia can lead to serious short-term complications, such as confusion, vomiting, dehydration and loss of consciousness and long-term complications, such as blindness, kidney disease, nervous system disease, occlusive vascular diseases, stroke and cardiovascular disease, or death. Hypoglycemia can lead to confusion, loss of consciousness or death.
Diabetes is typically classified as either Type 1 or Type 2:
| • | Type 1 diabetes is characterized by the body’s nearly complete inability to produce insulin. It is frequently diagnosed during childhood or adolescence. Individuals with Type 1 diabetes require daily insulin therapy to survive. It is estimated that approximately one million to two million people in the United States have Type 1 diabetes. |
| • | Type 2 diabetes, the more common form, is characterized by the body’s inability to either properly utilize insulin or produce enough insulin. Historically, Type 2 diabetes has occurred in later adulthood, but its incidence is increasing among the younger population, due primarily to increasing obesity. Initially, many people with Type 2 diabetes attempt to manage their diabetes with improvements in diet, exercise and/or oral medications. As their diabetes advances, some patients progress to multiple drug therapies, which often include insulin therapy. It is estimated that approximately two million to three million people in the United States have Type 2 diabetes that requires daily insulin administration. |
Throughout this Annual Report on Form 10-K, we refer to both Type 1 diabetes and insulin-requiring Type 2 diabetes as insulin-dependent diabetes.
Diabetes Management
Showing the first 8K of 61K characters. Open the full section
Item 1A. Risk Factors
This Annual Report on Form 10-K contains forward-looking statements. Forward-looking statements relate to future events or our future financial performance.
We generally identify forward looking statements by terminology such as “may,” “will,” “should,” “expects,” “plans,” “anticipates,” “could,” “intends,” “targets,” “projects,” “contemplates,” “believes,” “estimates,” “predicts,” “potential” or “continue” or the negative of these terms or other similar words. These statements are only predictions. We have based these forward-looking statements largely on our current expectations and projections about future events and financial trends that we believe may affect our business, results of operations and financial condition.
The outcomes of the events described in these forward-looking statements are subject to risks, uncertainties and other factors described in this Item 1A Risk Factors and elsewhere in this Annual Report on Form 10-K. Accordingly, you should not rely upon forward-looking statements as predictions of future events. We cannot assure you that the events and circumstances reflected in the forward-looking statements will be achieved or occur, and actual results could differ materially from those projected in the forward-looking statements. The forward-looking statements made in this Annual Report on Form 10-K relate only to events as of the date of this report. We undertake no obligation to update any forward-looking statement to reflect events or circumstances after the date on which the statement is made or to reflect the occurrence of unanticipated events.
Risks Relating to Our Business
Although we achieved operating income and net income in 2018, we previously incurred significant operating and net losses since inception and cannot assure you that we will sustain profitability.
Prior to 2018 and since our inception in 2000, we incurred significant operating losses. For the year ended December 31, 2018, we generated operating income of $27.4 million and net income of $3.3 million. Our net losses for the years ended December 31, 2017, 2016 and 2015 were $26.8 million, $28.9 million and $73.52 million, respectively. The extent of any future net losses and the timing of profitability are uncertain, and we may not sustain profitability. As of December 31, 2018, we had an accumulated deficit of $683.6 million.
We may experience significant fluctuations in our quarterly results of operations.
The fluctuations in our quarterly results of operations have resulted, and may continue to result, from numerous factors, including:
| • | delays in shipping due to capacity constraints; |
| • | practices of health insurance companies and other third-party payors with respect to reimbursement for our current or future products; |
| • | market acceptance of our products; |
| • | our ability to manufacture our products efficiently, or at all; |
| • | transitions in our distribution channel; |
| • | timing of regulatory approvals and clearances; |
| • | new product introductions; |
| • | competition; and |
| • | timing of research and development expenditures. |
These factors, some of which are not within our control, may cause the price of our stock to fluctuate substantially. In particular, if our quarterly results of operations fail to meet or exceed the expectations of securities analysts or investors, our stock price could drop suddenly and significantly. We believe the quarterly comparisons of our financial results should not be the only indication of our future performance.
We currently rely on sales of the Omnipod System, and tailored versions of the Omnipod System in our drug delivery product line, to generate nearly all of our revenue. The failure of the Omnipod System to achieve and maintain significant market acceptance or any factors that negatively impact sales of this product will adversely affect our business, financial condition and results of operations.
Our main product is the Omnipod System, which we introduced to the market in 2005. We expect to continue to derive nearly all of our revenue from the sale of this product. Accordingly, our ability to continue to generate revenue is highly reliant on our ability to market and sell the Omnipod System and to retain customers who currently use the product. Our sales of the Omnipod System may be negatively impacted by many factors, including:
| • | the failure of the Omnipod System to achieve and maintain wide acceptance among opinion leaders in the diabetes treatment community, insulin-prescribing physicians, third-party payors and people with insulin-dependent diabetes; |
| • | manufacturing problems or capacity constraints; |
| • | actual or perceived quality problems; |
| • | reductions in reimbursement rates or coverage policies relating to the Omnipod System by third-party payors; |
| • | claims that any portion of the Omnipod System infringes on patent rights or other intellectual property rights owned by other parties; |
| • | adverse regulatory or legal actions relating to the Omnipod System; |
| • | damage, destruction or loss of any of the facilities where our products are manufactured or stored or of the equipment therein or failure to successfully open or expand new facilities; |
| • | conversion rate of patient referrals to actual sales of the Omnipod System; |
| • | the inability of our customers to continue paying for our products; |
| • | attrition rates of customers who cease using the Omnipod System; |
| • | competitive pricing and related factors; and |
| • | results of clinical studies relating to the Omnipod System or our competitors’ products. |
If any of these events occurs, our ability to generate revenue could be significantly reduced.
Our ability to sustain profitability may depend on our ability to sustain or further reduce the per unit cost of producing the Omnipod System by increasing customer orders, increasing manufacturing volume and productivity and reducing raw material and overhead costs per unit.
To sustain profitability, we may need to, among other things, sustain or further reduce the per unit cost of the Omnipod System. If we are unable to sustain or further reduce raw material and manufacturing overhead costs through volume purchase discounts, negotiation of improved pricing and increased productivity and production capacity, our ability to sustain profitability could be negatively affected. The occurrence of one or more factors that negatively impact the manufacturing or sales of the Omnipod System or increase our raw material costs could prevent us from sustaining our desired increase in manufacturing volume, which would prevent us from sustaining and further increasing profitability.
Adverse changes in general economic conditions in the United States and outside of the United States, predominantly in Europe, could adversely affect us.
We are subject to the risks arising from adverse changes in general economic market conditions. A U.S. or global recession, could negatively impact our current and prospective customers, adversely affect the financial ability of health insurers to pay claims, adversely impact our ability to pay our expenses and ability to obtain financing of our operations, cause delays or other problems with key suppliers and increase the risk of counterparty failures.
Healthcare spending in the United States, Canada and Europe could be negatively affected in the event of a downturn in economic conditions. For example, U.S. patients who have lo
Showing the first 8K of 101K characters. Open the full section
Item 1B. Unresolved Staff Comments
None.
Item 2. Properties
In December 2018, we substantially completed the construction of our 195,000 square foot U.S. manufacturing and office facility in Acton, Massachusetts. The property serves as our global headquarters. We also lease a total of approximately 149,000 square feet of office, research and development and warehousing space and other related facilities primarily in the U.S., Europe and Canada.
Item 3. Legal Proceedings
The information required by this Item is provided under "Legal Proceedings" in Note 14 to the consolidated financial statements included under Item 8 of this Form 10-K, and is incorporated herein by reference.
Item 4. Mine Safety Disclosures
Not applicable.
PART II
Item 5. Market for Registrant's Common Equity, Related Stockholder Matters and Issuer Purchases of Equity Securities
MARKET FOR REGISTRANT'S COMMON EQUITY
Our common stock has been listed on The NASDAQ Global Market under the trading symbol “PODD” since our initial public offering on May 15, 2007. The following table sets forth the high and low closing sales prices of our common stock, as reported by The NASDAQ Global Market, for each of the periods listed.
| High | Low | ||||||
| Fiscal Year 2017 | |||||||
| First Quarter | $ | 47.22 | $ | 36.98 | |||
| Second Quarter | $ | 51.31 | $ | 39.10 | |||
| Third Quarter | $ | 59.46 | $ | 49.49 | |||
| Fourth Quarter | $ | 71.80 | $ | 55.67 | |||
| Fiscal Year 2018 | |||||||
| First Quarter | $ | 87.20 | $ | 68.49 | |||
| Second Quarter | $ | 101.93 | $ | 83.27 | |||
| Third Quarter | $ | 108.13 | $ | 81.43 | |||
| Fourth Quarter | $ | 105.19 | $ | 73.27 |
As of February 20, 2019, there were approximately 8 registered holders of record of our common stock. The number of beneficial stockholders of our shares is greater than the number of stockholders of record.
Performance Graph
The chart set forth below shows the value of an investment of $100 on December 31, 2013 in each of Insulet Corporation common stock, the NASDAQ Composite Index, and the NASDAQ Health Care Index. All values assume reinvestment of the pre-tax value of dividends paid by companies included in these indices and are calculated as of December 31, 2018. The historical stock price performance of our common stock shown in the performance graph below is not necessarily indicative of future stock price performance.
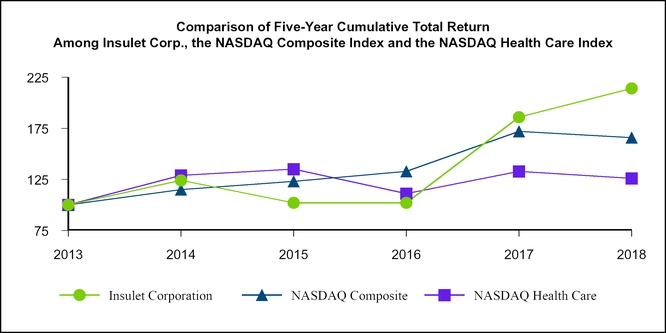
| 2013 | 2014 | 2015 | 2016 | 2017 | 2018 | |||||||||||||
| Insulet Corporation | $ | 100 | $ | 124 | $ | 102 | $ | 102 | $ | 186 | $ | 214 | ||||||
| NASDAQ Composite | 100 | 115 | 123 | 133 | 172 | 166 | ||||||||||||
| NASDAQ Health Care | 100 | 129 | 135 | 111 | 133 | 126 |
The material in this performance graph is not soliciting material, is not deemed filed with the Securities and Exchange Commission (“SEC”) and is not incorporated by reference in any filing of Insulet Corporation under the Securities Act of 1933, as amended (the “Securities Act”) or the Exchange Act of 1934, as amended, whether made on, before or after the date of this filing and irrespective of any general incorporation language in such filing.
Dividend Policy
We currently intend to retain future earnings for the development, operation and expansion of our business and do not anticipate paying any cash dividends in the foreseeable future.
Securities Authorized For Issuance Under Equity Compensation Plans
The following table sets forth information regarding securities authorized for issuance under our equity compensation plans as of December 31, 2018.
| Plan Category | Number of securities to be issued upon exercise of outstanding options, warrants and rights (a) | Weighted average exercise price of outstanding options, warrants and rights (b) | Number of securities remaining available for future issuance under equity compensation plans (excluding securities reflected in column (a)) (c) | |||||||
| Equity compensation plans approved by security holders(1) | 2,398,286 | $ | 40.38 | 4,439,383 | ||||||
| Equity compensation plans not approved by security holders(2) | 679,338 | $ | 34.87 | — | ||||||
| Total | 3,077,624 | $ | 39.16 | 4,439,383 |
(1) Includes our Amended and Restated 2017 and 2007 Stock Option and Incentive Plans. Outstanding restricted stock units convert to common stock without the payment of consideration. As of December 31, 2018, 752,207 restricted stock units were outstanding. The weighted-average exercise price of outstanding options as of such date issued under these Plans (excluding restricted stock units) was $40.38. For more information relating to our equity compensation plans, see Note 15 to our consolidated financial statements.
(2) Consists of the following inducement grants made to certain executive officers upon their initial hire by us:
| • | one inducement grant of 499,468 shares of non-qualified stock option awards made to Patrick J. Sullivan upon being hired by us in September 2014; |
| • | one inducement grant of 79,936 non-qualified stock options made to Shacey Petrovic upon being hired by us in February 2015; |
| • | one inducement grant of 58,852 non-qualified stock options made to Michael Levitz upon being hired by us in May 2015; |
| • | one inducement grant of 29,581 non-qualified stock options made to David Colleran (1,849 of which have been exercised as of December 31, 2018) upon being hired by us in June 2015; and |
| • | one inducement grant of 30,511 non-qualified stock options made to Michael Spears (17,161 of which have been exercised as of December 31, 2018) upon being hired by us in July 2015. |
These non-qualified stock option awards were granted outside of our Amended and Restated 2007 Stock Option and Incentive Plan in compliance with Nasdaq Listing Rule 5635.
Issuer Repurchases of Equity Securities
We did not repurchase any of our equity securities during the quarter ended December 31, 2018, nor issue any securities that were not registered under Securities Act.
Purchases of Equity Securities by the Issuer and Affiliated Purchasers
None.
Item 6. Selected Financial Data
| Years Ended December 31, | |||||||||||||||||||
| (In thousands, except share and per share data) | 2018 | 2017 | 2016 | 2015 | 2014 | ||||||||||||||
| Consolidated Statements of Operations Data: | |||||||||||||||||||
| Revenue | $ | 563,823 | $ | 463,768 | $ | 366,989 | $ | 263,893 | $ | 231,321 | |||||||||
| Cost of revenue | 193,655 | 186,599 | 155,903 | 130,622 | 104,195 | ||||||||||||||
| Gross profit | 370,168 | 277,169 | 211,086 | 133,271 | 127,126 | ||||||||||||||
| Total operating expenses | 342,745 | 284,556 | 221,790 | 182,007 | 136,000 | ||||||||||||||
| Operating income (loss) | 27,423 | (7,387 | ) | (10,704 | ) | (48,736 | ) | (8,874 | ) | ||||||||||
| Interest expense and other, net | (22,197 | ) | (19,187 | ) | (16,114 | ) | (12,654 | ) | (39,006 | ) | |||||||||
| Net income (loss) from continuing operations | 3,292 | (26,831 | ) | (27,210 | ) | (61,602 | ) | (47,940 | ) | ||||||||||
| Loss from discontinued operations, net of tax | — | — | (1,669 | ) | (11,918 | ) | (3,560 | ) | |||||||||||
| Net income (loss) | $ | 3,292 | $ | (26,831 | ) | $ | (28,879 | ) | $ | (73,520 | ) | $ | (51,500 | ) | |||||
| Net income (loss) from continuing operations per share: | |||||||||||||||||||
| Basic | $ | 0.06 | $ | (0.46 | ) | $ | (0.48 | ) | $ | (1.08 | ) | $ | (0.86 | ) | |||||
| Diluted | $ | 0.05 | $ | (0.46 | ) | $ | (0.48 | ) | $ | (1.08 | ) | $ | (0.86 | ) | |||||
| Net loss from discontinued operations per share | — | — | (0.03 | ) | (0.21 | ) | (0.06 | ) | |||||||||||
| Weighted-average number of shares used in calculating net income (loss) per share | |||||||||||||||||||
| Basic | 58,859,574 | 58,003,434 | 57,251,377 | 56,785,646 | 55,628,542 | ||||||||||||||
| Diluted | 61,008,024 | 58,003,434 | 57,251,377 | 56,785,646 | 55,628,542 | ||||||||||||||
| As of December 31, | |||||||||||||||||||
| (In thousands) | 2018 | 2017 | 2016 | 2015 | 2014 | ||||||||||||||
| Consolidated Balance Sheets Data: | |||||||||||||||||||
| Cash and cash equivalents | $ | 113,906 | $ | 272,577 | $ | 137,174 | $ | 122,672 | $ | 151,193 | |||||||||
| Short-term investments | $ | 175,040 | $ | 167,479 | $ | 161,396 | $ | — | $ | — | |||||||||
| Working capital | $ | 345,629 | $ | 451,146 | $ | 314,263 | $ | 125,605 | $ | 163,900 | |||||||||
| Long-term investments | $ | 140,784 | $ | 125,549 | $ | — | $ | — | $ | — | |||||||||
| Total assets | $ | 928,744 | $ | 816,744 | $ | 456,647 | $ | 275,126 | $ | 297,182 | |||||||||
| Current portion of long-term debt and capital lease obligations | $ | — | $ | — | $ | 269 | $ | 5,519 | $ | 3,380 | |||||||||
| Long-term debt and capital lease obligations | $ | 591,978 | $ | 566,173 | $ | 332,768 | $ | 171,967 | $ | 166,283 | |||||||||
| Other long-term liabilities | $ | 9,010 | $ | 6,030 | $ | 5,032 | $ | 3,952 | $ | 2,774 | |||||||||
| Total stockholders’ equity | $ | 212,099 | $ | 158,516 | $ | 63,150 | $ | 34,051 | $ | 83,829 |
Item 7. Management's Discussion and Analysis of Financial Condition and Results of Operations
Executive Level Overview
We are primarily engaged in the development, manufacturing and sale of our proprietary Omnipod System, an innovative, discreet and easy-to-use continuous insulin delivery system for people with insulin-dependent diabetes. There are two primary types of insulin therapy practiced today: MDI therapy using syringes or insulin pens; and pump therapy using insulin pumps. Insulin pumps are used to perform continuous subcutaneous insulin infusion, or insulin pump therapy, and typically use a programmable device and an infusion set to administer insulin into the person’s body. Insulin pump therapy has been shown to provide people with insulin-dependent diabetes with numerous advantages relative to MDI therapy. We estimate that approximately one-third of the Type 1 diabetes population in the United States and less than one fifth of the Type 1 diabetes population outside of the United States use insulin pump therapy. An even smaller portion of the Type 2 diabetes population in the United States who are insulin-dependent use insulin pump therapy. The Omnipod System features a small, lightweight, self-adhesive disposable tubeless Omnipod device which is worn on the body for approximately three days at a time and its wireless companion, the handheld PDM. The Omnipod System, which features two discreet, easy-to-use devices, communicates wirelessly, provides for virtually pain-free automated cannula insertion and eliminates the need for traditional MDI therapy or the use of traditional pump and tubing. We believe that the Omnipod System’s unique proprietary design and features allow people with insulin-dependent diabetes to manage their diabetes with unprecedented freedom, comfort, convenience, and ease.
We began commercial sale of the Omnipod in the United States in 2005. We sell the Omnipod through direct sales to customers or through our distribution partners. The Omnipod is currently available in multiple countries in Europe, as well as Canada and Israel. On July 1, 2018 we assumed all commercial activities (including, among other things, distribution, sales, marketing, training and support) for our Omnipod System across Europe following the expiration of our prior distribution agreement with our former European Distributor on June 30, 2018.
In addition to the diabetes market space, we have partnered with pharmaceutical and biotechnology companies to tailor the Omnipod System technology platform for the delivery of subcutaneous drugs across other therapeutic areas. The majority of our drug delivery revenue currently consists of sales of pods used in Amgen's Neulasta Onpro kit, an innovative delivery system for Amgen’s white blood cell booster to help reduce the risk of infection during intense chemotherapy.
We have substantially completed the construction of a highly-automated manufacturing facility in Acton, Massachusetts, with planned production out of the facility beginning in the first half of 2019. The facility also serves as our global headquarters. We expect that, following start up related activities, the new facility will allow us to lower our manufacturing costs, increase supply redundancy, add capacity closer to our largest customer base and support growth. From the purchase of this facility in late 2016 through December 31, 2018, capital expenditures for the construction of the Acton facility and related equipment purchases have been approximately $193 million. In 2019, we expect to invest additional capital in this facility to support our growth funded by our existing cash and investments.
In January 2018, we announced that the Centers for Medicare & Medicaid Services ("CMS") has issued guidance clarifying that Medicare Part D Plan Sponsors may provide coverage for products such as the Omnipod System under the Medicare Part D (prescription drug) program. We have been securing coverage with Medicare Part D carriers to ensure beneficiaries living with diabetes have access to the Omnipod System. Securing Medicare Part D coverage also provides us with a direct pathway to increased Medicaid coverage at the state level, as many state-run Medicaid programs follow CMS prescription drug guidance to determine coverage. This allows access for lower-income individuals and families on Medicaid for whom Omnipod currently is not a covered option. In April 2018, we also significantly increased our market access when we secured in-network coverage of Omnipod with United Healthcare, the largest commercial payer in the United States.
In June 2018, the FDA provided clearance for the commercial distribution of our DASH TM System, which is our next-generation digital mobile Omnipod platform, featuring a secured Bluetooth enabled Pod and PDM with a touch screen color user interface supported by smartphone connectivity. We commenced a U.S. limited commercial release of Omnipod DASH TM in the third quarter of 2018 prior to a U.S. full market launch in the first half of 2019.
2018 Revenue Results:
| • | Total revenue of $563.8 million |
| ◦ | U.S. Omnipod revenue of $323.5 million, a 19% increase year over year |
| ◦ | International Omnipod revenue of $172.0 million, a 43% increase year over year |
| ◦ | Drug Delivery revenue of $68.3 million, a 5% decrease year over year |
Our long-term financial objective is to sustain profitable growth. We expect our efforts in 2019 to focus primarily on commissioning our U.S. manufacturing facility, commencing a U.S. full market release of Omnipod DASH, continuing our
product development efforts, and continuing to work with Medicare, Medicaid and commercial payors and intermediaries to expand access. Achieving these objectives is expected to require additional investments in certain initiatives and personnel, as well as enhancements to our supply chain operation capacity, efficiency and effectiveness.
Components of Financial Operations
Revenue. We derive the majority of our revenue from global sales of the Omnipod System. We also sell devices based on the Omnipod System technology to global pharmaceutical and biotechnology companies for the delivery of their drugs across therapeutic areas.
Cost of revenue. Cost of revenue consists primarily of raw material, labor, warranty, inventory scrap and excess and obsolescence adjustments, and overhead costs such as freight-in and depreciation and the cost of products we acquire from third party suppliers.
Research and development. Research and development expenses consist primarily of personnel costs, license fees and outside service expenses within our product development, regulatory and clinical functions and well as innovations related to our global supply chain and manufacturing process. Research and development expenses also include engineering and operational costs, such as training and start up activities, associated with our newly constructed U.S. manufacturing facility. We generally expense research and development costs as incurred.
Sales and marketing. Sales and marketing expenses consist primarily of personnel costs within our sales, marketing, reimbursement support and customer care functions, as well as sales commissions paid to our sales representatives, costs associated with promotional activities and participation in industry trade shows. Commission costs that are direct and incremental to obtaining a new customer are capitalized and amortized to sales and marketing expense over the expected period of benefit.
General and administrative. General and administrative expenses consist primarily of salaries and other related costs for personnel serving the executive, finance, legal, information technology and human resource functions, as well as legal fees, accounting fees, insurance costs, bad debt expenses, shipping, handling and facilities-related costs including depreciation of office facility-related property and equipment.
Results of Operations
This section discusses our consolidated results of operations for 2018 compared to 2017, as well as 2017 compared to 2016, and should be read in conjunction with the consolidated financial statements and accompanying notes included under Item 8 of this Form 10-K.
| TABLE 1: RESULTS OF OPERATIONS | |||||||||||||||||||||||||||||
|---|---|---|---|---|---|---|---|---|---|---|---|---|---|---|---|---|---|---|---|---|---|---|---|---|---|---|---|---|---|
| Years Ended December 31, | Years Ended December 31, | ||||||||||||||||||||||||||||
| Change | Change | ||||||||||||||||||||||||||||
| (In Thousands) | 2018 | 2017 | $ | % | 2017 | 2016 | $ | % | |||||||||||||||||||||
| Revenue | |||||||||||||||||||||||||||||
| U.S. Omnipod | $ | 323,528 | $ | 271,597 | $ | 51,931 | 19 | % | $ | 271,597 | $ | 229,785 | $ | 41,812 | 18 | % | |||||||||||||
| International Omnipod | 172,020 | 119,953 | 52,067 | 43 | % | 119,953 | 71,889 | 48,064 | 67 | % | |||||||||||||||||||
| Drug Delivery | 68,275 | 72,218 | (3,943 | ) | (5 | )% | 72,218 | 65,315 | 6,903 | 11 | % | ||||||||||||||||||
| Total Revenue | 563,823 | 463,768 | 100,055 | 22 | % | 463,768 | 366,989 | 96,779 | 26 | % | |||||||||||||||||||
| Cost of revenue | 193,655 | 186,599 | 7,056 | 4 | % | 186,599 | 155,903 | 30,696 | 20 | % | |||||||||||||||||||
| Gross profit | 370,168 | 277,169 | 92,999 | 34 | % | 277,169 | 211,086 | 66,083 | 31 | % | |||||||||||||||||||
| Gross margin | 65.7 | % | 59.8 | % | 59.8 | % | 57.5 | % | |||||||||||||||||||||
| Operating expenses: | |||||||||||||||||||||||||||||
| Research and development | 88,606 | 74,452 | 14,154 | 19 | % | 74,452 | 55,710 | 18,742 | 34 | % | |||||||||||||||||||
| Sales and marketing | 142,321 | 121,617 | 20,704 | 17 | % | 121,617 | 94,483 | 27,134 | 29 | % | |||||||||||||||||||
| General and administrative | 111,818 | 88,487 | 23,331 | 26 | % | 88,487 | 71,597 | 16,890 | 24 | % | |||||||||||||||||||
| Total operating expenses | 342,745 | 284,556 | 58,189 | 20 | % | 284,556 | 221,790 | 62,766 | 28 | % | |||||||||||||||||||
| Operating income (loss) | 27,423 | (7,387 | ) | 34,810 | 471 | % | (7,387 | ) | (10,704 | ) | 3,317 | 31 | % | ||||||||||||||||
| Interest expense and other, net | (22,197 | ) | (19,187 | ) | (3,010 | ) | 16 | % | (19,187 | ) | (16,114 | ) | (3,073 | ) | 19 | % | |||||||||||||
| Income (loss) from continuing operations before income taxes | 5,226 | (26,574 | ) | 31,800 | 120 | % | (26,574 | ) | (26,818 | ) | (244 | ) | (1 | )% | |||||||||||||||
| Income tax expense | 1,934 | 257 | 1,677 | 653 | % | 257 | 392 | (135 | ) | (34 | )% | ||||||||||||||||||
| Net income (loss) from continuing operations | 3,292 | (26,831 | ) | 33,477 | 125 | % | (26,831 | ) | (27,210 | ) | (379 | ) | (1 | )% | |||||||||||||||
| Loss from discontinued operations, net of tax | — | — | — | — | (1,669 | ) | 1,669 | ||||||||||||||||||||||
| Net income (loss) | $ | 3,292 | $ | (26,831 | ) | $ | 30,123 | 112 | % | $ | (26,831 | ) | $ | (28,879 | ) | $ | 2,048 | 7 | % |
Comparison of the Years Ended December 31, 2018 and December 31, 2017
Revenue
Our total revenue increased to $563.8 million, up $100.1 million, or 22%, in 2018 compared to 2017, primarily due to continued growth in our International and U.S. Omnipod revenue. Our International Omnipod revenue increased to $172.0 million, up $52.1 million, or 43%, primarily due to both higher volumes and pricing as a result of our commencement of direct sales of our Omnipod System across Europe following the expiration of our prior distribution agreement with our former European Distributor on June 30, 2018. Our U.S. Omnipod revenue increased to $323.5 million, up $51.9 million, or 19%, as we continue to expand access to and awareness of the Omnipod System. Our drug delivery revenue declined to $68.3 million, down $3.9 million, or 5%, primarily reflecting a lower number of shipments during the year, partially offset by the favorable impact of adoption of new accounting rules that require a portion of our drug delivery revenue to be recognized as the product is produced rather than at time of shipment (as further described in Note 2 to the consolidated financial statements).
For 2019, we expect strong revenue growth driven by continued Omnipod expansion globally, partially offset by lower drug delivery revenue. Internationally, we expect higher revenues primarily due to increasing sales and the full year effect of more favorable pricing as a result of our mid-2018 transition to direct commercial operations in Europe. In the U.S., we expect higher revenues primarily due to increasing sales as a result of expanded payor coverage and greater awareness and availability for the Omnipod.
Cost of Revenue
Cost of revenue increased to $193.7 million, up $7.1 million, or 4%, in 2018 compared to 2017, primarily due to an increase in sales volumes, partially offset by improvements in supply chain operations in 2018.
Gross Margin
Gross margin increased to 65.7%, up approximately 590 basis points, in 2018 compared to 2017. The increase in gross margin was due primarily to (i) favorable pricing following expiration of our former distributor agreement in Europe and (ii) lower product cost as a result of continued improvements in manufacturing and supply chain operations. For 2019, we expect full-year gross margins to be relatively consistent with 2018, as the benefits of continued improvements in manufacturing and supply chain operations and the full year effect of our mid-2018 assumption of direct commercial operations in Europe is expected to be offset by start-up costs and inefficiencies as we ramp up our new U.S. manufacturing operations.
Research and Development
Research and development expenses increased to $88.6 million, up $14.2 million, or 19%, in 2018 as compared to 2017. The increase in research and development expenses was primarily due to an increase in expenses related to our development projects, including Omnipod DASH, and our Omnipod Horizon automated insulin delivery system. Research and development expenses also increased due to engineering and operational costs, such as training and start up activities, associated with our newly constructed U.S. manufacturing facility, with planned production beginning in the first half of 2019. For 2019, we expect overall research and development spending to increase as compared to 2018 primarily due to the development efforts on our ongoing projects.
Sales and Marketing
Sales and marketing expenses increased to $142.3 million, up $20.7 million, or 17%, in 2018 as compared to 2017. The increase in sales and marketing expenses was primarily due to investments to support our assumption in mid-2018 of direct commercial operations in Europe as well as the expansion of our U.S. sales force and customer support personnel. These increases were partially offset by the capitalization of commission costs related to new customer contracts (as further described in Note 8 to the consolidated financial statements). We expect sales and marketing expenses in 2019 to increase as compared to 2018 due to additional expansion of our U.S. sales force and customer support personnel to support our continued growth and the full year effect of our mid-2018 assumption of direct commercial operations in Europe.
General and Administrative
General and administrative expenses increased to $111.8 million, up $23.3 million, or 26% in 2018 as compared to 2017. General and administrative expenses in the current year include $12.6 million of severance-related charges associated with the retirement of our former CEO, of which $8.2 million related to stock-based compensation for the acceleration of share-based awards and the remainder represented cash severance benefits. General and administrative expenses also increased due to our commencement of direct commercial operations in Europe. For 2019, we expect overall general and administrative expenses to increase as compared to 2018 as we continue to grow the business and make investments in our operating structure to support continued growth as well as the full-year effect of our establishment of direct commercial operations in Europe in 2018.
Interest Expense and Other, Net
Interest expense and other, net, increased to $22.2 million, up $3.0 million, or 16%, for 2018, compared to 2017. Interest expense and other, net, includes $9.8 million of cash interest expense and $29.3 million of non-cash interest expense associated with our convertible debt, partially offset by $10.2 million of interest capitalized as part of the cost of our U.S. manufacturing facility and by $6.7 million of interest income on our investment portfolio. The increase in interest expense and other, net, in the current period as compared to 2017 was primarily due to the full year effect of interest expense associated with our 1.375% Notes, which were issued in November 2017, partially offset by an increase in capitalized interest expense and higher interest income on our investment portfolio in the current period. We expect that our interest expense and other, net, will be relatively consistent in 2019 compared to the prior year.
Income Tax Expense
Income tax expense increased to $1.9 million, up $1.7 million for 2018 compared to 2017. The increase in income tax expense was primarily due to growth in our international operations where we do not have net operating loss carryforwards. For more information on our income tax expense, please refer to Note 17 to the consolidated financial statements.
Comparison of the Years Ended December 31, 2017 and December 31, 2016
Revenue
Our total revenue increased to $463.8 million, up $96.8 million, or 26% in 2017 as compared to 2016, due to strong growth in our International Omnipod revenue and our U.S. Omnipod revenue. Our International Omnipod revenue increased to $120.0 million, up $48.1 million, or 67%, primarily due to growth in distributor sales from continued adoption in existing and newer markets within Europe. Our U.S. Omnipod revenue increased to $271.6 million, up $41.8 million, or 18%, as we continue to expand awareness of the Omnipod System. Our drug delivery revenue increased to $72.2 million, up $6.9 million, or 11%, due to growth in demand for our primary drug delivery device on greater market adoption of Amgen's Neulasta Onpro kit.
Cost of Revenue
Cost of revenue increased to $186.6 million, up $30.7 million, or 20%, in 2017 as compared to 2016, primarily due to an increase in sales volumes, partially offset by improvements in supply chain operations in 2017.
Gross Margin
Gross margin increased to 59.8%, up approximately 230 basis points, in 2017 as compared to 2016. The increase in gross margin was primarily due to improvements in supply chain operations, partially offset by the unfavorable mix impact of higher distributor sales in Europe.
Research and Development
Research and development expenses increased to $74.5 million, up $18.7 million, or 34%, in 2017 as compared to 2016. The increase was primarily due to an increase in expenses related to our development projects.
Sales and Marketing
Sales and marketing expenses increased to $121.6 million, up $27.1 million, or 29% in 2017 as compared to 2016. The increase was primarily due increased personnel-related expenses associated with the expansion of our customer support, market access and sales force personnel, investments to support our assumption of direct commercial support for Omnipod in Europe in mid-2018, and increased advertising expenses associated with direct to patient marketing activities.
General and Administrative
General and administrative expenses increased to $88.5 million, up $16.9 million, or 24% in 2017 as compared to 2016. The increase was primarily attributable to increased personnel-related costs and fees related to external consultants and professional service providers to support the growth in our business.
Interest Expense and Other, Net
Interest expense and other, net, increased to $19.2 million, up $3.1 million, or 19%, in 2017 as compared to 2016. The increase in interest expense and other, net, was primarily due to a net increase in our outstanding long-term debt, partially offset by lower losses on the extinguishment of debt in 2017. Non-cash interest expense increased $7.9 million and cash interest expense increased $1.8 million in 2017 as compared to 2016. These increases were partially offset by a $1.9 million reduction in losses on the extinguishment of debt in 2017, higher capitalization of interest, and higher interest income.
Income Tax Expense
Income tax expense was not material to our results of operations in the years 2017 or 2016 as we had generated net operating losses and have fully reserved our net operating loss carryforwards. For more information on our income tax expense, refer to Note 17 to the consolidated financial statements.
Liquidity and Capital Resources
As of December 31, 2018, we had $113.9 million in cash and cash equivalents and $315.8 million of investments in marketable securities. We believe that our current liquidity will be sufficient to meet our projected operating, investing and debt service requirements for at least the next twelve months.
To lower our manufacturing costs, increase supply redundancy, add capacity closer to our largest customer base and support growth, we have been constructing a highly-automated manufacturing facility in Acton, Massachusetts, which serves as our corporate headquarters. The facility was substantially complete in December 2018, with planned production out of the facility beginning in the first half of 2019. Our capital expenditures have increased above historic levels to fund the construction of this facility and related equipment purchases. As of December 31, 2018, cumulative investments related to the Acton facility were approximately $193 million. While we expect to continue to invest in this facility in 2019 to support our growth, we expect capital expenditures to be substantially lower in 2019 than in 2018.
In connection with our assumption on July 1, 2018 of all commercial activities of our Omnipod System across Europe following the expiration of our distribution agreement with our European Distributor on June 30, 2018, we are required to pay to the former European Distributor a per-unit fee for Omnipod sales by us between July 1, 2018 and June 30, 2019 to certain customers of the former European Distributor. We are recognizing a liability and an associated intangible asset for this fee as qualifying sales occur. The actual total fee could vary significantly depending on the number of customers who count for purposes of calculating the fee under the terms of the distribution agreement, and the methodology applicable for determining this number under the agreement is subject to an active arbitration proceeding between the parties in Switzerland. We estimate that the final aggregate fee for the applicable twelve-month period could be in the range of approximately $10 million to $55 million.
Convertible Senior Notes
To finance our operations and global expansion, we have periodically issued and sold Convertible Senior Notes, which are convertible into our common stock. As of December 31, 2018, the following Notes were outstanding:
| Issuance Date | Coupon | Principal Outstanding (in thousands) | Due Date | Initial Conversion Rate per Share of Common Stock | Conversion Price per Share of Common Stock | ||
| September 2016 | 1.250% | 344,992 | September 15, 2021 | 17.1332 | $58.37 | ||
| November 2017 | 1.375% | 402,500 | November 15, 2024 | 10.7315 | $93.18 | ||
| Total | $ | 747,492 |
We called our 2% Notes in March 2018 and settled the outstanding notes in May 2018. Additional information regarding our debt issuances is provided in Note 13 to the consolidated financial statements included under Item 8 of this Form 10-K.
| Summary of Cash Flows | Years Ended December 31, | |||||||||||
| (In thousands) | 2018 | 2017 | 2016 | |||||||||
| Cash provided by (used in): | ||||||||||||
| Operating activities | $ | 35,899 | $ | 41,207 | $ | 15,911 | ||||||
| Investing activities | (184,504 | ) | (210,797 | ) | (178,010 | ) | ||||||
| Financing activities | (8,665 | ) | 304,547 | 176,567 | ||||||||
| Effect of exchange rate changes on cash | (1,401 | ) | 446 | 34 | ||||||||
| Net (decrease) increase in cash and cash equivalents | $ | (158,671 | ) | $ | 135,403 | $ | 14,502 |
Included in our summary of cash flows for the years ended December 31, 2016 are the results of our discontinued operations. Additional information regarding our discontinued operations is provided in Note 19 to the consolidated financial statements included under Item 8 of this Form 10-K.
Operating Activities
Our net cash provided by operating activities for the year ended December 31, 2018 was $35.9 million compared to net cash provided by operating activities of $41.2 million in 2017, a decrease of $5.3 million year over year. The decrease in cash provided by operating activities in the current year is primarily due to investments in working capital, including increases in inventory levels to ensure we can meet the growing global demand for our products and in anticipation of the start-up of our U.S. manufacturing facility in the first half of 2019. These increases in working capital were partially offset by increases in our operating income due to growth in our business.
Our net cash provided by operating activities was $41.2 million for the year ended December 31, 2017 compared to net cash provided by operating activities of $15.9 million in the same period in 2016. The increase was primarily due to a decline in working capital in 2017 as compared to increases in working capital in 2016 primarily associated with inventory.
Investing Activities
Net cash used in investing activities for the year ended December 31, 2018 was $184.5 million compared to $210.8 million in 2017, a decrease of $26.3 million. The decrease in investing activities in the current year is primarily due to lower net purchases of marketable securities, partially offset by an increase in capital expenditures in the current period, which were $162.4 million in 2018 compared to $77.2 million in 2017, primarily associated with the construction of our manufacturing and corporate headquarters facility in Acton, Massachusetts.
Net cash used in investing activities in 2017 increased $32.8 million as compared to 2016 due to higher capital expenditures, partially offset by fewer net investments in marketable securities.
Financing Activities
Net cash used in financing activities for the year ended December 31, 2018 was $8.7 million compared to cash provided by financing activities of $304.5 million in 2017, a decrease of $313.2 million. The decrease was primarily attributable to net proceeds in 2017 from the issuance of our 1.375% Notes, offset by repayments to retire previously outstanding debt. No such financing took place in 2018.
Net cash provided by financing activities in the year ended December 31, 2017 was $304.5 million compared to $176.6 million in net cash provided by financing activities in 2016, an increase of $127.9 million. The increase was primarily attributable to
net proceeds of $391.6 million from the issuance of our 1.375% Notes in 2017 as compared to net proceeds of $333.7 million from the issuance in 2016 of our 1.25% Notes, and lower repayments to retire outstanding debt in the 2017 as compared to 2016.
Commitments and Contingencies
Our lease commitments related to facility operating leases are shown in the table below.
The following table summarizes our principal obligations as of December 31, 2018:
| (In millions) | ||||||||||||||||||||||||||||
| Contractual Obligations (3) | Total | 2019 | 2020 | 2021 | 2022 | 2023 | Later | |||||||||||||||||||||
| Operating lease obligations | $ | 12.5 | $ | 3.3 | $ | 2.9 | $ | 2.9 | $ | 2.6 | $ | 0.3 | $ | 0.5 | ||||||||||||||
| Debt obligations: principal (1) | 747.5 | — | — | 345.0 | — | — | 402.5 | |||||||||||||||||||||
| Debt obligations: cash interest (1) | 44.0 | 9.8 | 9.8 | 8.6 | 5.5 | 5.5 | 4.8 | |||||||||||||||||||||
| Purchase obligations(2) | 185.2 | 162.8 | 22.4 | — | — | — | — | |||||||||||||||||||||
| Total contractual obligations | $ | 989.2 | $ | 175.9 | $ | 35.1 | $ | 356.5 | $ | 8.1 | $ | 5.8 | $ | 407.8 |
| (1) | Debt obligations include principal and cash interest. |
| (2) | Our purchase obligations include commitments with certain of our suppliers, primarily for the purchase of Omnipod System components along with other commitments to purchase goods or services in the normal course of business. We make such commitments through a combination of purchase orders, supplier contracts, and open orders based on projected demand information. Purchase obligations also include approximately $80 million of commitments related to our Acton, Massachusetts manufacturing facility. |
| (3) | The contractual obligations table excludes fees that we are required to pay to our former European distributor following the expiration of our global distribution agreement on June 30, 2018. The actual amount of the fee is uncertain and is dependent on a number of factors. |
Legal Proceedings
The significant estimates and judgments related with establishing litigation reserves are discussed under "Legal Proceedings" in Note 14 of the consolidated financial statements included under Item 8 of this Form 10-K.
Off-Balance Sheet Arrangements
As of December 31, 2018, we did not have any off-balance sheet financing arrangements.
Critical Accounting Policies and Estimates
Our financial statements are based on the selection and application of generally accepted accounting principles, which require us to make estimates and assumptions about future events that affect the amounts reported in our financial statements and the accompanying notes. Future events and their effects cannot be determined with certainty. Therefore, the determination of estimates requires the exercise of judgment. Actual results could differ from those estimates, and any such differences may be material to our financial statements.
Based on the sensitivity of reported financial statement amounts to the underlying estimates and assumptions, the relatively more significant accounting policies applied by us have been identified by management as those associated with the following:
-
Revenue recognition
-
Fair value measurements
-
Accounts receivable and allowance for doubtful accounts
-
Inventories
-
Product warranty costs
-
Convertible debt
-
Commitments and contingencies
-
Stock-based compensation
Additional information on our critical accounting estimates and significant accounting policies, including references to applicable footnotes, is provided in Note 2 to the consolidated financial statements included under Item 8 of this Form 10-K.
Recent Accounting Pronouncements
Information with respect to recent accounting developments is provided in Note 2 to the consolidated financial statements included under Item 8 of this Form 10-K.
Item 7A. Quantitative and Qualitative Disclosures about Market Risk
We currently do not use derivative financial instruments in our investment portfolio and have no foreign exchange contracts. Our financial instruments consist of cash, cash equivalents, short-term and long-term investments, accounts receivable, accounts payable, accrued expenses, debt and long-term obligations. The primary objectives of our investment strategy are to preserve principal, maintain proper liquidity to meet operating needs and maximize yields. To minimize our exposure to an adverse shift in interest rates, we invest mainly in short-term investments and cash equivalents. We do not believe that a 10% change in interest rates would have a material impact on the fair value of our investment portfolio or our interest income.
As of December 31, 2018, we had outstanding debt related to our convertible senior notes recorded on our consolidated balance sheet of $592.0 million, net of unamortized discount and issuance costs totaling $155.5 million. Changes in the fair value of our outstanding debt, which could be impacted by changes in interest rates, are not recorded in these consolidated financial statements as the debt is accounted for at cost less unamortized discount and issuance costs. The fair value of the debt, which is disclosed in Note 4 to the consolidated financial statements, is also impacted by changes on our stock price.
Our business is subject to risks, including, but not limited to: unique economic conditions, changes in political climate, differing tax structures, other regulations and restrictions, and foreign exchange rate volatility. A substantial portion of our operations are located in the United States, and the majority of our sales since inception have been made in United States dollars. During 2018, following the assumption of direct operations in Europe, our business became more exposed to foreign currency exchange rate fluctuations. Fluctuations in the rate of exchange between the United States dollar and foreign currencies, primarily the Euro and the British Pound, could adversely affect our financial results, including our revenues, revenue growth rates, gross margins, income and losses as well as assets and liabilities. We will continue to monitor and evaluate our internal processes relating to foreign currency exchange, including the potential use of hedging strategies.
Item 8. Financial Statements and Supplementary Data
Our financial statements as of December 31, 2018 and 2017 and for each of the three years in the period ended December 31, 2018, and the Report of the Registered Independent Public Accounting Firm are included in this report as listed in the index.
| INDEX TO CONSOLIDATED FINANCIAL STATEMENTS | |
| Report of Independent Registered Public Accounting Firm | 45 |
| Consolidated Balance Sheets as of December 31, 2018 and 2017 | 46 |
| Consolidated Statements of Operations for the Years ended December 31, 2018, 2017 and 2016 | 47 |
| Consolidated Statements of Comprehensive Income (Loss) for the Years Ended December 31, 2018, 2017 and 2016 | 48 |
| Consolidated Statements of Stockholders' Equity for the Years ended December 31, 2018, 2017 and 2016 | 49 |
| Consolidated Statements of Cash Flows for the Years ended December 31, 2018, 2017 and 2016 | 50 |
| Notes to Consolidated Financial Statements | 51 |
Report of Independent Registered Public Accounting Firm
Board of Directors and Shareholders
Insulet Corporation
Opinion on the financial statements
We have audited the accompanying consolidated balance sheets of Insulet Corporation (a Delaware corporation) and subsidiaries (the “Company”) as of December 31, 2018 and 2017, the related consolidated statements of operations, comprehensive income (loss), stockholders’ equity, and cash flows for each of the three years in the period ended December 31, 2018, and the related notes and schedule (collectively referred to as the "financial statements"). In our opinion, the financial statements present fairly, in all material respects, the financial position of the Company as of December 31, 2018 and 2017, and the results of its operations and its cash flows for each of the three years in the period ended December 31, 2018, in conformity with accounting principles generally accepted in the United States of America.
We also have audited, in accordance with the standards of the Public Company Accounting Oversight Board (United States) ("PCAOB"), the Company’s internal control over financial reporting as of December 31, 2018, based on criteria established in the 2013 Internal Control-Integrated Framework issued by the Committee of Sponsoring Organizations of the Treadway Commission ("COSO"), and our report dated February 25, 2019 expressed an unqualified opinion.
Basis for opinion
These financial statements are the responsibility of the Company's management. Our responsibility is to express an opinion on the Company's financial statements based on our audits. We are a public accounting firm registered with the PCAOB and are required to be independent with respect to the Company in accordance with the U.S federal securities laws and the applicable rules and regulations of the Securities and Exchange Commission and the PCAOB.
We conducted our audits in accordance with the standards of the PCAOB. Those standards require that we plan and perform the audit to obtain reasonable assurance about whether the financial statements are free of material misstatement, whether due to error or fraud. Our audits included performing procedures to assess the risks of material misstatement of the financial statements, whether due to error or fraud, and performing procedures that respond to those risks. Such procedures included examining, on a test basis, evidence supporting the amounts and disclosures in the financial statements. Our audits also included evaluating the accounting principles used and significant estimates made by management, as well as evaluating the overall presentation of the financial statements. We believe that our audits provide a reasonable basis for our opinion.
/s/ GRANT THORNTON LLP
We have served as the Company's auditor since 2016.
Boston, Massachusetts
February 25, 2019
INSULET CORPORATION
CONSOLIDATED BALANCE SHEETS
| December 31, 2018 | December 31, 2017 | ||||||
| (In thousands, except share and per share data) | |||||||
| ASSETS | |||||||
| Current Assets | |||||||
| Cash and cash equivalents | $ | 113,906 | $ | 272,577 | |||
| Short-term investments | 175,040 | 167,479 | |||||
| Accounts receivable, net | 63,294 | 53,373 | |||||
| Unbilled receivable | 13,378 | — | |||||
| Inventories | 71,414 | 33,793 | |||||
| Prepaid expenses and other current assets | 24,254 | 9,949 | |||||
| Total current assets | 461,286 | 537,171 | |||||
| Long-term investments | 140,784 | 125,549 | |||||
| Property and equipment, net | 258,379 | 107,864 | |||||
| Other intangible assets, net | 10,383 | 4,351 | |||||
| Goodwill | 39,646 | 39,840 | |||||
| Other assets | 18,266 | 1,969 | |||||
| Total assets | $ | 928,744 | $ | 816,744 | |||
| LIABILITIES AND STOCKHOLDERS’ EQUITY | |||||||
| Current Liabilities | |||||||
| Accounts payable | $ | 25,500 | $ | 24,413 | |||
| Accrued expenses and other current liabilities | 88,973 | 59,256 | |||||
| Deferred revenue | 1,184 | 2,356 | |||||
| Total current liabilities | 115,657 | 86,025 | |||||
| Long-term debt, net | 591,978 | 566,173 | |||||
| Other long-term liabilities | 9,010 | 6,030 | |||||
| Total liabilities | 716,645 | 658,228 | |||||
| Commitments and contingencies (Note 14) | |||||||
| Stockholders’ Equity | |||||||
| Preferred stock, $.001 par value: | |||||||
| Authorized: 5,000,000 shares at December 31, 2018 and 2017. Issued and outstanding: zero shares at December 31, 2018 and 2017 | — | — | |||||
| Common stock, $.001 par value: | |||||||
| Authorized: 100,000,000 shares at December 31, 2018 and 2017. Issued and outstanding: 59,188,758 and 58,319,348 shares at December 31, 2018 and 2017, respectively | 59 | 58 | |||||
| Additional paid-in capital | 898,559 | 866,206 | |||||
| Accumulated other comprehensive loss | (2,905 | ) | (493 | ) | |||
| Accumulated deficit | (683,614 | ) | (707,255 | ) | |||
| Total stockholders’ equity | 212,099 | 158,516 | |||||
| Total liabilities and stockholders’ equity | $ | 928,744 | $ | 816,744 |
The accompanying notes are an integral part of these consolidated financial statements.
INSULET CORPORATION
CONSOLIDATED STATEMENTS OF OPERATIONS
| Years Ended December 31, | |||||||||||
| (In thousands, except share and per share data) | 2018 | 2017 | 2016 | ||||||||
| Revenue | $ | 563,823 | $ | 463,768 | $ | 366,989 | |||||
| Cost of revenue | 193,655 | 186,599 | 155,903 | ||||||||
| Gross profit | 370,168 | 277,169 | 211,086 | ||||||||
| Operating expenses: | |||||||||||
| Research and development | 88,606 | 74,452 | 55,710 | ||||||||
| Sales and marketing | 142,321 | 121,617 | 94,483 | ||||||||
| General and administrative | 111,818 | 88,487 | 71,597 | ||||||||
| Total operating expen |
Showing the first 8K of 138K characters. Open the full section
Item 9. CHANGES IN AND DISAGREEMENTS WITH ACCOUNTANTS ON ACCOUNTING AND FINANCIAL DISCLOSURE
None.
Item 9A. Controls and Procedures
Disclosure Controls and Procedures
Our management, with the participation of our chief executive officer and chief financial officer, evaluated the effectiveness of our disclosure controls and procedures as of December 31, 2018. The term “disclosure controls and procedures,” as defined in Rules 13a-15(e) and 15d-15(e) under the Securities Exchange Act of 1934, as amended (the “Exchange Act”) means controls and other procedures of a company that are designed to ensure that information required to be disclosed by a company in the reports that it files or submits under the Exchange Act is recorded, processed, summarized and reported, within the time periods specified in the Securities and Exchange Commission’s rules and forms. Disclosure controls and procedures include, without limitation, controls and procedures designed to ensure that information required to be disclosed by a company in the reports that it files or submits under the Exchange Act is accumulated and communicated to the company’s management, including its principal executive and principal financial officers, as appropriate to allow timely decisions regarding required disclosure. Management recognizes that any controls and procedures, no matter how well designed and operated, can provide only reasonable assurance of achieving their objectives and management necessarily applies its judgment in evaluating the cost-benefit relationship of possible controls and procedures. Based on the evaluation of our disclosure controls and procedures as of December 31, 2018, our chief executive officer and chief financial officer concluded that, as of such date, our disclosure controls and procedures were effective at a reasonable assurance level.
Changes in Internal Control Over Financial Reporting
There were no changes in our internal control over financial reporting during the three months ended December 31, 2018 that have materially affected, or are reasonably likely to materially affect, our internal control over financial reporting.
Management's Annual Report on Internal Control Over Financial Reporting
Our management is responsible for establishing and maintaining adequate internal control over financial reporting as such term is defined in Exchange Act Rule 13a — 15(f). Our internal control system was designed to provide reasonable assurance to our management and the Board of Directors regarding the preparation and fair presentation of published financial statements. All internal control systems, no matter how well designed have inherent limitations. Therefore, even those systems determined to be effective can provide only reasonable assurance with respect to financial statement preparation and presentation. Our management assessed the effectiveness of our internal control over financial reporting as of December 31, 2018. In making this assessment, our management used the criteria set forth by the Committee of Sponsoring Organizations of the Treadway Commission 2013 (“COSO”) in Internal Control — Integrated Framework (the COSO criteria).
Based on our assessment we believe that, as of December 31, 2018, our internal control over financial reporting is effective based on those criteria. The effectiveness of our internal control over financial reporting as of December 31, 2018 has been audited by Grant Thornton LLP, an independent registered public accounting firm, as stated in their report which appears below.
Report of Independent Registered Public Accounting Firm
Board of Directors and Shareholders
Insulet Corporation
Opinion on internal control over financial reporting
We have audited the internal control over financial reporting of Insulet Corporation (a Delaware corporation) and subsidiaries (the “Company”) as of December 31, 2018, based on criteria established in the 2013 Internal Control-Integrated Framework issued by the Committee of Sponsoring Organizations of the Treadway Commission (COSO). In our opinion, the Company maintained, in all material respects, effective internal control over financial reporting as of December 31, 2018, based on criteria established in the 2013 Internal Control-Integrated Framework issued by COSO.
We also have audited, in accordance with the standards of the Public Company Accounting Oversight Board (United States) (“PCAOB”), the consolidated financial statements of the Company as of and for the year ended December 31, 2018, and our report dated February 25, 2019 expressed an unqualified opinion on those financial statements.
Basis for opinion
The Company’s management is responsible for maintaining effective internal control over financial reporting and for its assessment of the effectiveness of internal control over financial reporting, included in the accompanying Management’s Annual Report on Internal Control Over Financial Reporting. Our responsibility is to express an opinion on the Company’s internal control over financial reporting based on our audit. We are a public accounting firm registered with the PCAOB and are required to be independent with respect to the Company in accordance with the U.S. federal securities laws and the applicable rules and regulations of the Securities and Exchange Commission and the PCAOB.
We conducted our audit in accordance with the standards of the PCAOB. Those standards require that we plan and perform the audit to obtain reasonable assurance about whether effective internal control over financial reporting was maintained in all material respects. Our audit included obtaining an understanding of internal control over financial reporting, assessing the risk that a material weakness exists, testing and evaluating the design and operating effectiveness of internal control based on the assessed risk, and performing such other procedures as we considered necessary in the circumstances. We believe that our audit provides a reasonable basis for our opinion.
Definition and limitations of internal control over financial reporting
A company’s internal control over financial reporting is a process designed to provide reasonable assurance regarding the reliability of financial reporting and the preparation of financial statements for external purposes in accordance with generally accepted accounting principles. A company’s internal control over financial reporting includes those policies and procedures that (1) pertain to the maintenance of records that, in reasonable detail, accurately and fairly reflect the transactions and dispositions of the assets of the company; (2) provide reasonable assurance that transactions are recorded as necessary to permit preparation of financial statements in accordance with generally accepted accounting principles, and that receipts and expenditures of the company are being made only in accordance with authorizations of management and directors of the company; and (3) provide reasonable assurance regarding prevention or timely detection of unauthorized acquisition, use, or disposition of the company’s assets that could have a material effect on the financial statements.
Because of its inherent limitations, internal control over financial reporting may not prevent or detect misstatements. Also, projections of any evaluation of effectiveness to future periods are subject to the risk that controls may become inadequate because of changes in conditions, or that the degree of compliance with the policies or procedures may deteriorate.
/s/ GRANT THORNTON LLP
Boston, Massachusetts
February 25, 2019
Item 9B. OTHER INFORMATION
None.
PART III
Item 10. Directors, Executive Officers and Corporate Governance
Certain information required by this Item 10 relating to our directors, executive officers and corporate governance is incorporated by reference herein from our Proxy Statement in connection with our 2019 Annual Meeting of Stockholders, which Proxy Statement will be filed with the SEC not later than 120 days after the close of our year ended December 31, 2018.
Item 11. Executive Compensation
Certain information required by this Item 11 relating to remuneration of directors and executive officers and other transactions involving management is incorporated by reference herein from our Proxy Statement in connection with our 2019 Annual Meeting of Stockholders, which Proxy Statement will be filed with the SEC not later than 120 days after the close of our year ended December 31, 2018.
Item 12. Security Ownership of Certain Beneficial Owners and Management and Related Stockholder Matters
Certain information required by this Item 12 relating to security ownership of certain beneficial owners and management is incorporated by reference herein from our Proxy Statement in connection with our 2019 Annual Meeting of Stockholders, which Proxy Statement will be filed with the SEC not later than 120 days after the close of our fiscal year ended December 31, 2018. For information on securities authorized for issuance under equity compensation plans, see the section entitled “Market for Registrant’s Common Equity, Related Stockholders Matters, and Issuer Purchases of Equity Securities “ in Part II, Item 5, in this Annual Report on Form 10-K.
Item 13. Certain Relationships and Related Transactions, and Director Independence
Certain information required by this Item 13 relating to certain relationships and related transactions, and director independence is incorporated by reference herein from our Proxy Statement in connection with our 2019 Annual Meeting of Stockholders, which Proxy Statement will be filed with the SEC not later than 120 days after the close of our year ended December 31, 2018.
Item 14. Principal Accounting Fees and Services
Certain information required by this Item 14 regarding principal accounting fees and services is set forth under “Principal Accounting Fees and Services” in our Proxy Statement in connection with our 2019 Annual Meeting of Stockholders, which Proxy Statement will be filed with the SEC not later than 120 days after the close of our year ended December 31, 2018.
Item 15. Exhibits, Financial Statement Schedules
| (A)(1) FINANCIAL STATEMENTS | ||
| The following consolidated financial statements of Insulet Corporation are included in Item 8 hereof: | ||
| Report of Independent Registered Public Accounting Firm | ||
| Consolidated Balance Sheets - Years ended December 31, 2018 and 2017 | ||
| Consolidated Statements of Operations - Years ended December 31, 2018, 2017 and 2016 | ||
| Consolidated Statements of Comprehensive Income (Loss) - Years ended December 31, 2018, 2017 and 2016 | ||
| Consolidated Statements of Stockholders' Equity - Years ended December 31, 2018, 2017 and 2016 | ||
| Consolidated Statements of Cash Flows - Years ended December 31, 2018, 2017 and 2016 | ||
| Notes to Consolidated Financial Statements | ||
| (A)(2) FINANCIAL STATEMENT SCHEDULES | ||
| For the years ended December 31, 2018, 2017 and 2016, Schedule II – Valuation and Qualifying Accounts | ||
| Certain schedules to the consolidated financial statements have been omitted if they were not required by Article 9 of Regulation S-X or if, under the related instructions, they were inapplicable, or the information was contained elsewhere herein. | ||
| (A)(3) EXHIBITS | ||
| The exhibits listed in the Exhibit Index following the signature page of this Form 10-K are filed herewith or are incorporated herein by reference to other SEC filings. |
Item 16. Form 10-K Summary
None.
SIGNATURES
Pursuant to the requirements of Section 13 or 15(d) of the Securities Exchange Act of 1934, the Registrant has caused this report to be signed on its behalf by the undersigned thereunto duly authorized.
| INSULET CORPORATION (Registrant) | |
| February 25, 2019 | /s/ Shacey Petrovic |
| Shacey Petrovic | |
| Chief Executive Officer (Principal Executive Officer) |
| February 25, 2019 | /s/ Michael L. Levitz |
| Michael L. Levitz | |
| Chief Financial Officer (Principal Financial and Accounting Officer) |
POWER OF ATTORNEY AND SIGNATURES
We, the undersigned officers and directors of Insulet Corporation, hereby severally constitute and appoint Shacey Petrovic and Michael L. Levitz, and each of them singly, our true and lawful attorneys, with full power to them and each of them singly, to sign for us in our names in the capacities indicated below, on all amendments to this Report, and generally to do all things in our names and on our behalf in such capacities to enable Insulet Corporation to comply with the provisions of the Securities Exchange Act of 1934, as amended, and all requirements of the Securities and Exchange Commission.
Pursuant to the requirements of the Securities Exchange Act of 1934, this Report has been signed below by the following persons on behalf of the Registrant and in the capacities on February 25, 2019.
| Signature | Title | |
| /s/ Shacey Petrovic | Chief Executive Officer | |
| Shacey Petrovic | (Principal Executive Officer) | |
| /s/ Michael L. Levitz | Chief Financial Officer | |
| Michael L. Levitz | (Principal Financial and Accounting Officer) | |
| /s/ Sally Crawford | ||
| Sally Crawford | Director | |
| /s/ John Fallon, M.D. | ||
| John Fallon, M.D. | Director | |
| /s/ Dr. Jessica Hopfield | ||
| Dr. Jessica Hopfield | Director | |
| /s/ David A. Lemoine | ||
| David Lemoine | Director | |
| /s/ Timothy J. Scannell | ||
| Timothy J. Scannell | Director | |
| /s/ Michael R. Minogue | ||
| Michael R. Minogue | Director | |
| /s/ Corinne H. Nevinny | ||
| Corinne H. Nevinny | Director |
EXHIBIT INDEX
Listed and indexed below are all Exhibits filed as part of this report.
| * | This certification shall not be deemed “filed” for purposes of Section 18 of the Securities Exchange Act of 1934, or otherwise subject to the liability of that Section, nor shall it be deemed to be incorporated by reference into any filing under the Securities Act of 1933 or the Securities Exchange Act of 1934. |
| + | Confidential treatment granted as to certain portions of this exhibit. |