 filings.tools
Item 5. Market for Registrant's Common Equity, Related Stockholder Matters and Issuer Purchases of Equity Securities
6K characters. Original on sec.gov · Markdown
Item 5. Market for Registrant's Common Equity, Related Stockholder Matters and Issuer Purchases of Equity Securities
Market Information
Our common stock is listed on the New York Stock Exchange ("NYSE") under the symbol "RCL." The table below sets forth the high and low sales prices of our common stock as reported by the NYSE for the two most recent years by quarter:
| NYSE Common Stock | |||
| High | Low | ||
| 2017 | |||
| Fourth Quarter | $133.75 | $117.55 | |
| Third Quarter | $125.00 | $107.79 | |
| Second Quarter | $115.63 | $93.86 | |
| First Quarter | $101.11 | $82.72 | |
| 2016 | |||
| Fourth Quarter | $86.84 | $67.53 | |
| Third Quarter | $75.72 | $65.10 | |
| Second Quarter | $84.56 | $64.95 | |
| First Quarter | $99.81 | $64.21 |
Holders
As of February 12, 2018, there were 1,529 record holders of our common stock. Since certain of our shares are held by brokers and other institutions on behalf of shareholders, the foregoing number is not representative of the number of beneficial owners.
Dividends
In 2016, we declared cash dividends on our common stock of $0.375 per share during the first and second quarters of 2016. We increased the dividend amount to $0.48 per share for the dividends declared in the third and fourth quarters of 2016 and the first and second quarters of 2017. The dividend amount was increased to $0.60 per share for the dividends declared in the third and fourth quarters of 2017.
Holders of our common stock have an equal right to share in our profits in the form of dividends when and if declared by our Board of Directors out of funds legally available. Holders of our common stock have no rights to any sinking fund.
There are no exchange control restrictions on remittances of dividends on our common stock since (1) we are and intend to maintain our status as a nonresident Liberian entity under the Liberia Revenue Code of 2000 as Amended and the regulations thereunder, and (2) our ship-owning subsidiaries are not now engaged, and are not in the future expected to engage, in any business in Liberia, including voyages exclusively within the territorial waters of the Republic of Liberia. Under current Liberian law, no Liberian taxes or withholding will be imposed on payments to holders of our securities other than to a holder that is a resident Liberian entity or a resident individual or an individual or entity subject to taxation in Liberia as a result of having a permanent establishment within the meaning of the Liberia Revenue Code of 2000 as Amended in Liberia.
The declaration of dividends shall at all times be subject to the final determination of our Board of Directors that a dividend is prudent at that time in consideration of the needs of the business.
Share Repurchases
The following table presents the total number of shares of our common stock that we repurchased during the quarter ended December 31, 2017:
| Period | Total number of shares purchased | Average price paid per share | Total number of shares purchased as part of publicly announced plans or programs(1) | Approximate dollar value of shares that may yet be purchased under the plans or programs | |||
| October 1, 2017 - October 31, 2017 | — | — | — | $375,000,000 | |||
| November 1, 2017 - November 30, 2017 | 275,647 | $124.05 | 275,647 | $341,000,000 | |||
| December 1, 2017 - December 31, 2017 | 526,470 | $124.96 | 526,470 | $275,000,000 | |||
| Total | 802,117 | 802,117 |
| (1) | On April 28, 2017, we announced that our board of directors authorized a 12-month common stock repurchase program for up to $500 million. The timing and number of shares to be repurchased will depend on a variety of factors including price and market conditions. During the fourth quarter of 2017, we repurchased 0.8 million shares of our common stock for a total of $100 million in open market transactions that were recorded within Treasury stock in our consolidated balance sheet. Repurchases under the program may be made at management's discretion from time to time on the open market or through privately negotiated transactions. |
Performance Graph
The following graph compares the total return, assuming reinvestment of dividends, on an investment in the Company, based on performance of the Company's common stock, with the total return of the Standard & Poor's 500 Composite Stock Index and the Dow Jones United States Travel and Leisure Index for a five year period by measuring the changes in common stock prices from December 31, 2012 to December 31, 2017.
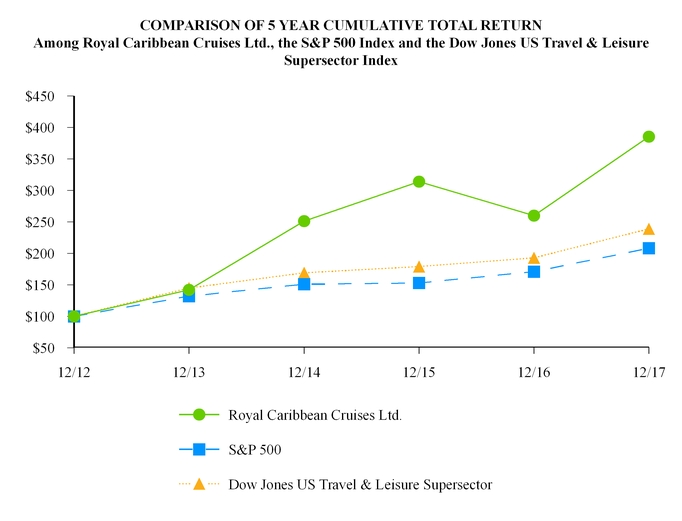
| 12/12 | 12/13 | 12/14 | 12/15 | 12/16 | 12/17 | ||||||
| Royal Caribbean Cruises Ltd. | 100.00 | 142.11 | 251.44 | 313.65 | 260.04 | 385.47 | |||||
| S&P 500 | 100.00 | 132.39 | 150.51 | 152.59 | 170.84 | 208.14 | |||||
| Dow Jones US Travel & Leisure | 100.00 | 145.48 | 169.28 | 179.27 | 192.85 | 238.77 |
The stock performance graph assumes for comparison that the value of the Company's common stock and of each index was $100 on December 31, 2012 and that all dividends were reinvested. Past performance is not necessarily an indicator of future results.
Previous: Item 4. Mine Safety Disclosures · Next: Item 6. Selected Financial Data