 filings.tools
Revvity 10-K 2017-01-01
Filed 2017-02-28. 21 sections, 567K characters. Original on sec.gov · Markdown · JSON
Cover and table of contents
10-K 1 pki0101201710k.htm 10-K
UNITED STATES SECURITIES AND EXCHANGE COMMISSION
Washington, DC 20549
Form 10-K
(Mark One)
| þ | ANNUAL REPORT PURSUANT TO SECTION 13 OR 15(d) OF THE SECURITIES EXCHANGE ACT OF 1934 |
| For the fiscal year ended January 1, 2017 |
or
| o | TRANSITION REPORT PURSUANT TO SECTION 13 OR 15(d) OF THE SECURITIES EXCHANGE ACT OF 1934 |
| For the transition period from to |
Commission file number 001-5075
PerkinElmer, Inc.
(Exact name of registrant as specified in its charter)
| Massachusetts | 04-2052042 | |
| (State or other jurisdiction of incorporation or organization) | (I.R.S. Employer Identification No.) | |
| 940 Winter Street, Waltham, Massachusetts | 02451 | |
| (Address of Principal Executive Offices) | (Zip Code) |
(Registrant’s telephone number, including area code): (781) 663-6900
Securities registered pursuant to Section 12(b) of the Act:
| Title of Each Class | Name of Each Exchange on Which Registered | |
| Common Stock, $1 Par Value | New York Stock Exchange |
Securities registered pursuant to Section 12(g) of the Act: None
Indicate by check mark if the registrant is a well-known seasoned issuer, as defined in Rule 405 of the Securities Act. Yes þ No o
Indicate by check mark if the registrant is not required to file reports pursuant to Section 13 or Section 15(d) of the Act. Yes o No þ
Indicate by check mark whether the registrant: (1) has filed all reports required to be filed by Section 13 or Section 15(d) of the Securities Exchange Act of 1934 during the preceding 12 months (or for such shorter period that the registrant was required to file such reports), and (2) has been subject to such filing requirements for the past 90 days. Yes þ No o
Indicate by check mark whether the registrant has submitted electronically and posted on its corporate Web site, if any, every Interactive Data File required to be submitted and posted pursuant to Rule 405 of Regulation S-T (§232.405 of this chapter) during the preceding 12 months (or for such shorter period that the registrant was required to submit and post such files). Yes þ No o
Indicate by check mark if disclosure of delinquent filers pursuant to Item 405 of Regulation S-K (§229.405 of this chapter) is not contained herein, and will not be contained, to the best of registrant’s knowledge, in definitive proxy or information statements incorporated by reference in Part III of this Form 10-K or any amendment to this Form 10-K. þ
Indicate by check mark whether the registrant is a large accelerated filer, an accelerated filer, a non-accelerated filer, or a smaller reporting company. See the definitions of “large accelerated filer,” “accelerated filer” and “smaller reporting company” in Rule 12b-2 of the Exchange Act.
| Large accelerated filer þ | Accelerated filer o | Non-accelerated filer o | Smaller reporting company o | |||
| (Do not check if a smaller reporting company) |
Indicate by check mark whether the registrant is a shell company (as defined in Rule 12b-2 of the Exchange Act). Yes o No þ
The aggregate market value of the common stock, $1 par value per share, held by non-affiliates of the registrant on July 1, 2016, was $5,650,129,129 based upon the last reported sale of $52.66 per share of common stock on July 1, 2016.
As of February 24, 2017, there were outstanding 109,787,006 shares of common stock, $1 par value per share.
DOCUMENTS INCORPORATED BY REFERENCE
Portions of PerkinElmer, Inc.’s Definitive Proxy Statement for its Annual Meeting of Shareholders to be held on April 25, 2017 are incorporated by reference into Part III of this Form 10-K.
TABLE OF CONTENTS
PART I
Item 1. Business
Overview
We are a leading provider of products, services and solutions for the diagnostics, food, environmental, industrial, life sciences research and laboratory services markets. Through our advanced technologies and differentiated solutions, we address critical issues that help to improve lives and the world around us.
We realigned our businesses at the beginning of the fourth quarter of fiscal year 2016 to better organize around customer requirements, positioning us to grow in attractive end markets and expand share with our core product offerings. We created two new reporting segments, Discovery & Analytical Solutions and Diagnostics, which will enable us to deliver improved customer focus, more value-add collaboration and breakthrough innovations. Our Diagnostics business became a standalone reporting segment targeted towards better meeting the needs of clinically-oriented customers, especially within the growing areas of reproductive health, emerging market diagnostics and applied genomics. Microfluidics and automation products within our former research business were moved to a new applied genomics group within the Diagnostics segment. Our former environmental health business and the remaining products within the legacy research business were combined to form our new Discovery & Analytical Solutions reporting segment, focused on better serving and innovating for applications-oriented customers. Discovery & Analytical Solutions customers span the environmental, food, industrial, life sciences research and laboratory services markets.
We are a Massachusetts corporation, founded in 1947. Our headquarters are in Waltham, Massachusetts, and we market our products and services in more than 150 countries. As of January 1, 2017, we employed approximately 8,000 employees in our continuing operations. Our common stock is listed on the New York Stock Exchange under the symbol “PKI” and we are a component of the S&P 500 Index.
We maintain a website with the address http://www.perkinelmer.com. We are not including the information contained in our website as part of, or incorporating it by reference into, this annual report on Form 10-K. We make available free of charge through our website our annual reports on Form 10-K, quarterly reports on Form 10-Q, current reports on Form 8-K and amendments to these reports, as soon as reasonably practicable after we electronically file these materials with, or otherwise furnish them to, the Securities and Exchange Commission.
Our Strategy
Our strategy is to develop and deliver innovative products, services and solutions in high-growth markets that utilize our knowledge and expertise to address customers’ critical needs and drive scientific breakthroughs. To execute on our strategy and accelerate revenue growth, we focus on broadening our offerings through both the acquisition of innovative technology and investment in research and development. Our strategy includes:
| • | Achieving significant growth in both of our new core business segments, Discovery & Analytical Solutions and Diagnostics, through strategic acquisitions and licensing; |
| • | Accelerating innovation through both internal research and development and third-party collaborations and alliances; |
| • | Strengthening our position within key markets, by expanding our product and service offerings and maintaining superior product quality; |
| • | Utilizing our share repurchase programs to help drive shareholder value; and |
| • | Attracting, retaining and developing talented and engaged employees. |
Recent Developments
As part of our strategy to grow our core businesses, we have recently taken the following actions:
Strategic Business Realignment:
We realigned our businesses at the beginning of the fourth quarter of fiscal year 2016 to better organize around customer requirements, positioning us to grow in attractive end markets and expand share with our core product offerings. We created two new operating segments, Discovery & Analytical Solutions and Diagnostics, which will enable us to deliver improved customer focus, more value-add collaboration and breakthrough innovations. The results reported for fiscal year 2016 reflect this new alignment of our operating segments. Financial information in this report relating to fiscal years 2015 and 2014 has been retrospectively adjusted to reflect this change to our operating segments.
Acquisitions in Fiscal Year 2016:
We completed the acquisition of two businesses in fiscal year 2016 for a total consideration of $72.2 million in cash. The acquired businesses were Bioo Scientific Corporation, which was acquired for total consideration of $63.5 million in cash and one other business acquired for a total consideration of $8.8 million in cash. We reported the operations for these acquisitions within the results of our Diagnostics and Discovery & Analytical Solutions segments from the acquisition dates.
Restructuring:
During fiscal year 2016, we recorded pre-tax restructuring charges of $0.6 million in our Diagnostics segment and $5.9 million in our Discovery & Analytical Solutions segment related to a workforce reduction from restructuring activities. Our management approved these plans principally to focus resources on higher growth product lines and end markets. We also recorded pre-tax restructuring reversals of $0.3 million in our Diagnostics segment and $1.2 million in our Discovery & Analytical Solutions segment related to lower than expected costs associated with workforce reductions. This pre-tax restructuring activity has been reported as restructuring and contract termination charges and is included as a component of income from continuing operations. We expect no significant impact on future operating results or cash flows from the restructuring activities executed in fiscal year 2016.
As part of our ongoing business strategy, we also took the following actions:
Share Repurchase Program:
On October 23, 2014, our Board of Directors (our "Board") authorized us to repurchase up to 8.0 million shares of common stock under a stock repurchase program (the "Repurchase Program"). On July 27, 2016, our Board authorized us to immediately terminate the Repurchase Program and further authorized us to repurchase up to 8.0 million shares of common stock under a new stock repurchase program (the "New Repurchase Program"). The New Repurchase Program will expire on July 26, 2018 unless terminated earlier by our Board, and may be suspended or discontinued at any time. During the fiscal year 2016, we repurchased 3.2 million shares of common stock in the open market at an aggregate cost of $148.2 million, including commissions, under the Repurchase Program. No shares remain available for repurchase under the Repurchase Program due to its cancellation. As of January 1, 2017, 8.0 million shares remained available for repurchase under the New Repurchase Program. From January 2, 2017 through February 24, 2017, there were no stock repurchases under the New Repurchase Program.
Business Segments and Products
We report our business in two segments: Discovery & Analytical Solutions and Diagnostics. We realigned our businesses at the beginning of the fourth quarter of the fiscal year 2016 to better position us to grow in attractive end markets and expand share with our core product offerings through an improved customer focus, more value-add collaboration and breakthrough innovations. The results reported for fiscal year 2016 reflect this new alignment of our operating segments. Financial information in this report relating to fiscal years 2015 and 2014 has been retrospectively adjusted to reflect the changes in our operating segments.
Discovery & Analytical Solutions Segment
Our comprehensive portfolio of technologies helps life sciences researchers better understand diseases and develop treatments. In addition, we help accelerate scientists' ability to detect, monitor and manage contaminants and toxic chemicals impacting our environment and food supply. Our new Discovery & Analytical Solutions segment serves the environmental, food, industrial, life sciences research and laboratory services markets, and generated revenue of $1,513.0 million in fiscal year 2016.
Environmental Market:
For the environmental market, we develop and provide analytical technologies, solutions and services that enable our customers to understand the characterization and health of many aspects of our environment, including air, water and soil.
Our technologies are used to detect and help reduce the impact products and industrial processes may have on our environment. For example, we have solutions to help ensure compliance with regulatory standards that protect the purity of the world's water supply by detecting harmful substances, including trace metals such as lead, and organic pollutants such as pesticides and benzene. We provide the tools needed to test functionality, meet quality specifications and safety standards, and innovate for next generation products.
Food Market:
We provide a variety of solutions that help farmers and food producers provide a growing population with food that is safe, nutritious and appealing. Our instruments confirm food quality, including the level of moisture in grain or the level of fat
in butter. Our instruments are also used to detect the presence of potentially dangerous contaminants, such as lead and mercury in milk. Our solutions can also be used to identify the origin of food products such as olive oil, which helps prevent counterfeiting. Our methods and analyses are transferable throughout the supply chain so our customers are able to keep pace with industry standards as well as governmental regulations and certifications.
Industrial Market:
We provide analytical instrumentation for the industrial market which includes the chemical, electronics, energy, lubricant, petrochemical and polymer industries. Our industrial instrumentation is primarily used by customers focusing on quality assurance standards.
Life Sciences Research Market:
In the life science research market, we provide a broad suite of solutions including reagents, informatics, and detection and imaging technologies that enable scientists to improve life science research and facilitate the drug discovery processes. These products, solutions and services support pharmaceutical and biotech companies, and academic institutions globally in creating better therapeutics by helping to bring products to market faster and more efficiently. Our research portfolio includes a wide range of systems consisting of imaging, detection and extraction instrumentation for use on in vitro, ex vivo, and in vivo models, analysis hardware and software, plus a wide range of consumable products including drug discovery and research reagents.
Laboratory Services Market:
We provide services designed to enable our customers in the laboratory services market throughout the world to increase efficiencies and production time while reducing maintenance costs of their labs. Our OneSource laboratory service business is aligned with customers' needs to accelerate science by enabling efficiency gains within their labs.
Principal Products:
Our principal products and services for Discovery & Analytical Solutions applications include the following:
Environmental, Food & Industrial:
| • | The Clarus® series of gas chromatographs, gas chromatographs/mass spectrometers and the TurboMatrix™ family of sample-handling equipment are used to identify and quantify compounds in the environmental, forensics, food and beverage, hydrocarbon processing/biofuels, materials testing, pharmaceutical and semiconductor industries. |
| • | The Altus® UPLC® and HPLC advanced liquid chromatography systems providing high throughput and resolution chromatographic separations. |
| • | AxION® 2 TOF MS is designed to simplify and streamline virtually any analytical workflow and provides mass accuracy, full spectrum capability, speed, sensitivity, and dynamic range. |
| • | AxION® Direct Sample Analysis (DSA®) is a sample introduction system that enables direct sample analysis with minimal sample preparation and no chromatography. |
| • | The Torion® T-9 portable GC/MS, a fast person-portable GC/MS system, enabling rapid detection and actionable results to potentially hazardous and emergency environmental conditions. |
| • | Our atomic spectroscopy family of instruments, including the AAnalyst™/PinAAcle® series of atomic absorption spectrometers, the Avio™/Optima® family of inductively coupled plasma (“ICP”) optical emission spectrometers and the NexION® family of ICP mass spectrometers are used in the environmental and chemical industries, among others, to determine the elemental content of a sample. |
| • | Our infrared spectroscopy family, including the Spectrum Two™ spectrometer, a compact and portable instrument, used for high-speed infrared analysis for unknown substance identification, material qualification or concentration determination in fuel and lubricant analysis, polymer analysis and pharmaceutical and environmental applications. This includes the Frontier™ IR and NIR spectrometers designed to provide high sensitivity and flexibility to address a range of sample types. Spotlight™ IR systems, designed for scientists whose samples demand higher sensitivity and simpler analysis and workflows. |
| • | The LAMBDA™ UV/Vis, a series of spectrophotometers that provide sampling flexibility to enable measuring of a wide range of sample types, including liquids, powders and solid materials, both in regulated industries as well as QC/QA and research applications. |
| • | The 2400 Series II CHNS/O Elemental Analyzer is one of the leading organic elemental analyzers. It is ideal for the rapid determination of carbon, hydrogen, nitrogen, sulfur, and oxygen content in organic and other types of materials. |
| • | Our thermal analysis family includes DSC series that offers exclusive HyperDSC capability for unparalleled sensitivity and new insights into material processes. |
| • | Our Thermogravimetric (TG) and Simultaneous Thermal Analysis (STA) instruments, which can be coupled to Fourier Transform Infrared (FT-IR), Mass Spectrometry (MS), or Gas Chromatography/Mass Spectrometry (GC/MS) to provide greater analysis power and knowledge. |
| • | Perten's Falling Number and Glutomatic instruments determine the bread baking quality of wheat and flour. |
Life Sciences Research and Laboratory Services:
| • | Phenoptics™ quantitative pathology research solutions provide oncologists and cancer immunologists a new way to visualize and measure tumor cells and multiple immune-cell phenotypes simultaneously in FFPE tissue by combining the power of Opal®™ multiplexed immunohistochemistry reagents with the Mantra™ or Vectra® 3 Multispectral Imaging System, enabling visualization and analysis of complex cell interactions in ways that are difficult to achieve with other methods. |
| • | Radiometric detection solutions, including over 1,100 radiochemicals NEN and the Tri-carb®, Quantulus™ GCT families of liquid scintillation analyzers, Wizard2® Gamma counters and MicroBeta2® plate based LSA, are used for beta, gamma and luminescence counting in microplate and vial formats utilized in research, environmental and drug discovery applications. |
| • | The Opera® Phenix™ high content screening system is used for sensitive and high speed phenotypic drug screening of complex cellular models. |
| • | The Operetta® CLS™ high content analysis system enables scientists to reveal fine sub-cellular details from everyday assays as well as more complex studies, for example using live cells, 3D and stem cells. |
| • | The Columbus™ image data storage and analysis system provides a single solution to the storage and analysis of high content data from any major high content screening system, helping to visualize and analyze high content images via the Internet. |
| • | The EnSight™ multimode plate reader benchtop system offers well plate imaging alongside label-free and labeled detection technologies for target-based and phenotypic assays. |
| • | The EnVision® multilabel plate reader is targeted towards a wide range of high-throughput screening applications, including those using AlphaScreen®, AlphaLISA® and/or AlphaPlex® technologies. |
| • | A wide range of homogeneous biochemical and cell based assay reagents, including LANCE® Ultra™ and Alpha™ Technology assay platforms used for the detection of drug discovery targets such as G-protein coupled receptors (“GPCR”), kinases, biomarkers and the modification of epigenetic enzymes. |
| • | A broad portfolio of recombinant GPCR and Ion Channel cell lines, including over 300 products and 120 ready-to-use frozen cell lines for a wide range of disease areas. |
| • | AlphaScreen®, AlphaLISA® and AlphaPlex® research assays, including over 500 no-wash biomarker detection kits for both biotherapeutics and small molecule drug discovery and development in a variety of therapeutic areas including cancer, inflammation, metabolic disorders, neurodegeneration and virology. |
| • | TSA® Plus biotin kits can increase sensitivity of histochemistry and cytochemistry as much as 10 to 20 times. |
| • | In vivo imaging technologies and reagents for preclinical research, including the IVIS® Spectrum™ series and the FMT® series for 3D imaging, including the Spectrum™ BL for 2D and 3D optical imaging, and the IVIS® Lumina™ series for 2D imaging, along with a suite of bioluminescent and fluorescent imaging agents, cell lines and dyes. These technologies are designed to provide for non-invasive longitudinal monitoring of disease progression, cell trafficking and gene expression patterns in living animals and are complemented by a broad portfolio of fluorescent and bioluminescent in vivo imaging reagents that can be useful for identifying, characterizing and quantifying a range of disease biomarkers and therapeutic efficacy in living animal models. |
| • | The G4 PET/X-ray and G8 PET/CT preclinical imaging systems deliver PET imaging with an intuitive user interface and efficient workflows, ensuring subject monitoring throughout preparation and imaging. |
| • | Quantum GX™ microCT platform is an in vivo microCT scanner that offers industry leading microCT resolution for pre-clinical imaging applications or eight second scan times for higher throughput with lower doses of radiation. With Quantum GX™, 3D data from the IVIS® and FMT® imaging platforms can be coregistered with microCT. |
| • | Opal® 4, 5, 6, and 7 color multiplexed staining kits for amplified detection of immunohistochemistry utilized for multiple biomarker assessment in a single FFPE tumor cross section. |
| • | Vectra® 3 and inForm® software providing the power of multiplexed biomarker imaging in tissue and quantitative analysis, all within a familiar digital workflow to accelerate cancer immunology research. |
| • | AlphaPlex™ reagent technology, a homogeneous, all-in-one-well multiplexing reagent system for performing ultra-sensitive immunoassay analyses. |
| • | High Content Profiler™ powered by TIBCO® Spotfire® technology provides automated workflows for quality control and hit classification for truly multi-parametric cellular drug screens. |
| • | Lead Discovery™ powered by TIBCO® Spotfire® adds chemical intelligence to the TIBCO® Spotfire® business intelligence platform, enabling scientific professionals to derive new information from chemical structures relevant to experimental data. |
| • | Informatics platforms including E-Notebook for Chemistry and Biology, Elements®, iLab™, ChemDraw® and ChemOffice® , integrated suites that focus on the complex and varied needs of understanding and managing data for productivity and collaboration. |
| • | ChemDraw® and Chem3D® mobile apps for the iPad® device, chemical structure drawing and visualization apps, available in multiple languages and feature our Flick-to-Share® technology. |
| • | Licensing for the exclusive, worldwide rights to the TIBCO® Spotfire® software platform in certain scientific research and development markets, and certain clinical markets through an exclusive strategic relationship with TIBCO Software, Inc. |
| • | OneSource® Laboratory Services, a comprehensive portfolio of multivendor instrument management, QA/QC, lab relocation and regulatory compliance services. OneSource® programs are tailored to the specific needs and goals of individual customers and offer a series of informatics-based consulting, planning and management offerings to assist in laboratory productivity and the optimization of complex Information Technology platforms. |
| • | OneSource® Mobile Application provides instant mobile access to service activity and equipment data including the ability to open a service call, check service history and view future scheduled events. |
| • | OneSource® Dashboard, a TIBCO® Spotfire® technology driven interactive graphical platform provides visibility to a customer’s global asset population, service event and downtime distribution, as well as key performance indicators to assist in asset operation. |
New Products:
New products introduced or acquired for Discovery & Analytical Solutions applications in fiscal year 2016 include the following:
Environmental, Food & Industrial:
| • | The Avio™ 200 is the smallest ICP-OES on the market, offering the lowest argon consumption of any ICP, the fastest ICP startup and the widest linear range with dual viewing technology for use in a variety of labs. |
| • | QSight Triple Quad LC/MS/MS is a flow-based mass spectrometry system that provides high sensitivity and enables high levels of efficiency and productivity to meet both standard and regulatory requirements. |
| • | The Delta range of milk quality analyzers help ensure the quality of dairy products and are used at Central Milk Testing labs as well as dairy processing facilities around the world. |
| • | The Bioo Scientific test kits for detection of toxins, veterinary drug residues and contaminants enable rapid and easy testing at different steps in the food value chain. |
Life Sciences Research:
| • | The Operetta® CLS™ high content analysis system enables scientists to reveal fine sub-cellular details from everyday assays as well as more complex studies, for example using live cells, 3D and stem cells. |
| • | Alpha™ SureFire® Ultra Multiplex Assays are used for the rapid, sensitive and quantitative detection of phosphoproteins in cells, combined with the measurement of the total amount of the same protein in a single well. |
| • | CellCarrier® Ultra 384-well microplates used in high content imaging applications such as phenotypic screening and three-dimensional disease model studies. |
| • | PerkinElmer Signals™ for Translational, a cloud-based data management, aggregation and analysis platform, integrates experimental and clinical research data from many sources and relates the data to scientifically meaningful concepts. The platform also enables support for the complete precision medicine workflow, from data acquisition to biomarker discovery and validation. |
| • | Clinical Data Review analytical solution provides medical monitors, safety review teams, biostatisticians, data managers, pharmacologists, and others who analyze clinical data, a powerful advanced analytics solution for overcoming data review challenges. The solution enhances clinical data management and medical review workflows, allowing organizations to make informed decisions on the safety and efficacy of therapeutics earlier in their development. |
Brand Names:
Our Discovery & Analytical Solutions segment offers additional products under various brand names, including:
Environmental and Food:
AAnalyst™, Altus®, Aquamatic™, Avio™, AxION®, Clarus®, DairyGuard™, Falling Number®, Frontier™, Glutomatic™, Honigs Regression™, HyperDSC®, Inframatic™, LAMBDA™, NexION®, OilExpress™, OilPrep™, Optima™, Perten®, Perten
Instruments®, PinAAcle®, QSight™, Spectrum™, Spectrum Two™, Spotlight™, Supra-clean®, Supra-d™, Supra-poly®, Syngistix™, Torion®, TurboMatrix™ and Ultraspray®.
Life Sciences Research:
AlphaLISA®, AlphaPlex™, AlphaScreen®, Alpha™ SureFire®, Cell carrier™, cell::explorer®™, Chem3D®, ChemDraw®, ChemOffice®, Columbus™ Elements®, EnLite™, EnSight™, EnSpire®, EnVision®, EZ-Reader™, FMT®, Geospiza®, High Content Profiler™, inForm®, IVIS®, LANCE®, Living Image®, Mantra™, MicroBeta2®, NEN®, Nuance®, OneSource®, Opal®, Opera Phenix™, Operetta CLS™, PerkinElmer Signals™ for Translational, Phenoptics™, Quantulus™ GCT, Quantum™, Tri-Carb®, Vectra®, VICTOR®™, ViewLux™, VivoTag® and Wizard2®.
Diagnostics Segment
We offer instruments, reagents, assay platforms, and software to hospitals, medical labs, clinicians, and medical research professionals to help improve the health of families. Our new Diagnostics segment is especially focused on reproductive health, emerging market diagnostics, and applied genomics. Our Diagnostics business generated revenue of $602.5 million in fiscal year 2016.
Diagnostics Market:
We provide early detection for genetic disorders from pregnancy to early childhood, as well as flat panel X-ray detectors and infectious disease testing for the diagnostics market. Our screening products are designed to provide early and accurate insights into the health of expectant mothers during pregnancy and into the health of their babies. Our instruments, reagents and software test and screen for genetic abnormalities, disorders and diseases, including Down syndrome, hypothyroidism, infertility and various metabolic conditions. We also develop the technologies that enable and support sample-to-sequencer workflow using next-generation DNA sequencing for applications in oncology, genetic testing and drug discovery.
Our flat panel X-ray detectors are used within X-ray imaging systems to allow physicians to make fast and accurate diagnoses of conditions ranging from broken bones to breast cancer. In addition, our flat panel X-ray detectors are used within oncology radiation therapy systems to support more accurate tumor treatment.
Principal Products:
Our principal products and services for Diagnostics applications include the following:
Diagnostics:
| • | The DELFIA® Xpress screening platform, a complete solution for prenatal and maternal health screening, which includes a fast continuous loading system. It is supported by kits for both first and second trimester analyses for prenatal screening and clinically validated LifeCycle™ software. |
| • | The NeoGram™ MS/MS AAAC in vitro diagnostic kit is used to support detection of metabolic disorders in newborns through tandem mass spectrometry. |
| • | The NeoBase™ Non-derivatized MS/MS kit analyzes newborn blood samples for measurement of amino acids and other metabolic analytes for specific diseases. |
| • | The GSP® Neonatal hTSH, T4 17α-OHP, GALT IRT, BTD, PKU, Total Galactose and G6PD kits are used for screening congenital neonatal conditions from a drop of blood. |
| • | The Specimen Gate® informatics data management solution is designed specifically for newborn screening laboratories. |
| • | The XRpad® family of amorphous silicon (a-Si) flat panel cassette X-ray detectors enables X-ray system manufacturers to upgrade their systems from film to digital and to produce exceptional image resolution and diagnostic capability for radiography especially when imaging small anatomical features such as bone fractures and lung nodules. |
| • | ViaCord® umbilical cord blood banking services for the banking of stem cells harvested from umbilical cord blood and cord tissue, for potential therapeutic application in transplant and regenerative medicine. |
| • | The XRD™ family of a-Si flat panel X-ray detectors provides imaging for medical applications such as radiation therapy and veterinary imaging as well as industrial imaging applications including pipeline inspection, manufacturing inspection and 3D Cone Beam CT. |
| • | The Dexela® family of CMOS flat panel X-ray detectors provides imaging for orthopedic surgery, mammography, dental, and industrial imaging applications such as PCB inspection and 3D Cone Beam CT. |
| • | An expanded portfolio of molecular-based infectious disease screening technologies for blood bank and clinical laboratory settings in China. The tools include a qualitative 3-in-1 assay for the detection of hepatitis B, hepatitis C and HIV, as well as assays for other communicable diseases. |
| • | The EnLite™ Neonatal TREC™ System, a screening test for Severe Combined Immunodeficiency, consisting of EnLite™ Neonatal TREC™ reagent kits, the Victor EnLite™ instrument and EnLite™ Workstation software. |
Applied Genomics
| • | Automated liquid handling platforms (JANUS®, Sciclone® and Zephyr®) that offer a choice of robotic solutions in genomics, biotherapeutics, high throughput screening and high content analysis to assist life science research from bench to clinic. |
| • | Next-generation sequencing automation and nucleic acid quantitation, including LabChip® GX Touch electrophoresis, as well as Sciclone®, Zephyr® and JANUS® automated liquid handling workstations for library preparation. |
| • | JANUS® BioTx™ Workstation for automated small scale purification offers column, tip and plate based chromatography on a single platform. |
| • | The LabChip GXII® Touch provides a means of characterizing multiple protein product attributes for research labs through QC. |
| • | The cell::explorer®™ automated workstation allows integration of multiple laboratory instrumentation using a centralized robotic interface, allowing high throughput and turnkey-application focused solutions. |
New Products:
Significant new products introduced or acquired for Diagnostics applications in fiscal year 2016 include the following:
Diagnostics:
| • | A comprehensive portfolio of Next-Generation Sequencing ("NGS") Library Prep and multiplexing kits designed to increase sensitivity, flexibility and speed for speed for sequencing platforms, offered through our acquisition of Bioo Scientific. |
| • | Automated, precise, cost-effective Non-Invasive Prenatal Testing ("NIPT") utilizing molecular technology not requiring sequencing technology, offered through our acquisition of Vanadis Diagnostics. |
| • | The XRD 4343RF, which supports a full 43 × 43 cm2 (17 × 17 in2) field of view providing superior imaging for fluoroscopy, radiography and cone beam CT applications. The detector offers frame rates up to 85 fps and has a direct deposited Cesium Iodide scintillator for superior image quality. |
| • | The Dexela 2315NDT, a fast, high resolution X-ray detector for use in realtime, 2D and 3D industrial imaging. |
Brand Names:
Our Diagnostics segment offers additional products under various brand names, including AutoDELFIA®, BACS-on-Beads®, Bioo Scientific, BoBs®, Datalytix™, Dexela®, Dexela® CMOS FPDs™, Evolution™, FragilEase™, Genoglyphix®, GSP®, iLab™, JANUS®, LabChip®, LifeCycle™, LimsLink™, MultiPROBE®, Pannoramic™, Sciclone®, Specimen Gate®, TRIO™, Twister®, Vanadis, VariSpec™, ViaCord®, XRD™, XRpad® and Zephyr®.
Marketing
All of our businesses market their products and services primarily through their own specialized sales forces. As of January 1, 2017, we employed approximately 3,700 sales and service representatives operating in approximately 35 countries and marketing products and services in more than 150 countries. In geographic regions where we do not have a sales and service presence, we utilize distributors to sell our products.
Raw Materials, Key Components and Supplies
Each of our businesses uses a wide variety of raw materials, key components and supplies that are generally available from alternate sources of supply and in adequate quantities from domestic and foreign sources. We generally have multi-year contracts, with no minimum purchase requirements, with our suppliers. For certain critical raw materials, key components and supplies required for the production of some of our principal products, we have qualified only a limited or a single source of supply. We periodically purchase quantities of some of these critical raw materials in excess of current requirements, in anticipation of future manufacturing needs. With sufficient lead times, we believe we would be able to qualify alternative suppliers for each of these raw materials and key components. See the applicable risk factor in “Item 1A. Risk Factors” for an additional description of this risk.
Intellectual Property
We own numerous United States and foreign patents and have patent applications pending in the United States and abroad. We also license intellectual property rights to and from third parties, some of which bear royalties and are terminable in specified circumstances. In addition to our patent portfolio, we possess a wide array of unpatented proprietary technology and know-how. We also own numerous United States and foreign trademarks and trade names for a variety of our product names,
and have applications for the registration of trademarks and trade names pending in the United States and abroad. We believe that patents and other proprietary rights are important to the development of both of our reporting segments, but we also rely upon trade secrets, know-how, continuing technological innovations and licensing opportunities to develop and maintain the competitive position of both of our reporting segments. We do not believe that the loss of any one patent or other proprietary right would have a material adverse effect on our overall business or on any of our reporting segments.
In some cases, we may participate in litigation or other proceedings to defend against or assert claims of infringement, to enforce our patents or our licensors’ patents, to protect our trade secrets, know-how or other intellectual property rights, or to determine the scope and validity of our or third parties’ intellectual property rights. Litigation of this type could result in substantial cost to us and diversion of our resources. An adverse outcome in any litigation or proceeding could subject us to significant liabilities or expenses, require us to cease using disputed intellectual property or cease the sale of a product, or require us to license the disputed intellectual property from third parties.
Backlog
We believe that backlog is not a meaningful indicator of future business prospects for either of our business segments due to the short lead time required for a majority of our sales. Therefore, we believe that backlog information is not material to an understanding of our business.
Competition
Due to the range and diversity of our products and services, we face many different types of competition and competitors. Our competitors range from foreign and domestic organizations, which produce a comprehensive array of goods and services and that may have greater financial and other resources than we do, to more narrowly focused firms producing a limited number of goods or services for specialized market segments.
We compete on the basis of service level, price, technological innovation, operational efficiency, product differentiation, product availability, quality and reliability. Competitors range from multinational organizations with a wide range of products to specialized firms that in some cases have well-established market positions. We expect the proportion of large competitors to increase through the continued consolidation of competitors.
Research and Development
Research and development expenditures were $124.3 million during fiscal year 2016, $112.5 million during fiscal year 2015, and $108.1 million during fiscal year 2014.
We have a broad product base, and we do not expect any single research and development project to have significant costs. To accelerate our growth initiatives, we directed our research and development efforts in fiscal years 2016, 2015 and 2014 primarily toward our Diagnostics segment, and the environmental, food, life sciences research and laboratory services markets within our Discovery & Analytical Solutions segment. We expect to continue our strong investments in research and development to drive growth during fiscal year 2017, and to continue to emphasize the Diagnostics segment, and the environmental, food, life sciences research and laboratory services markets within our Discovery & Analytical Solutions segment.
Environmental Matters
Our operations are subject to various foreign, federal, state and local environmental and safety laws and regulations. These requirements include those governing uses, emissions and discharges of hazardous substances, the remediation of contaminated soil and groundwater, the regulation of radioactive materials, and the health and safety of our employees.
We may have liability under the Comprehensive Environmental Response Compensation and Liability Act and comparable state statutes that impose liability for investigation and remediation of contamination without regard to fault, in connection with materials that we or our former businesses sent to various third-party sites. We have incurred, and expect to incur, costs pursuant to these statutes.
We are conducting a number of environmental investigations and remedial actions at our current and former locations and, along with other companies, have been named a potentially responsible party (“PRP”) for certain waste disposal sites. We accrue for environmental issues in the accounting period that our responsibility is established and when the cost can be reasonably estimated. We have accrued $9.9 million and $11.8 million as of January 1, 2017 and January 3, 2016, respectively, which represents our management’s estimate of the cost of the remediation of known environmental matters, and does not
include any potential liability for related personal injury or property damage claims. During fiscal year 2014, we recorded a benefit of $2.3 million for cost reimbursements related to a particular site, of which $1.2 million was for future monitoring and mitigation activities. Our environmental accrual is not discounted and does not reflect the recovery of any material amounts through insurance or indemnification arrangements. The cost estimates are subject to a number of variables, including the stage of the environmental investigations, the magnitude of the possible contamination, the nature of the potential remedies, possible joint and several liability, the time period over which remediation may occur, and the possible effects of changing laws and regulations. For sites where we have been named a PRP, our management does not currently anticipate any additional liability to result from the inability of other significant named parties to contribute. We expect that the majority of such accrued amounts could be paid out over a period of up to ten years. As assessment and remediation activities progress at each individual site, these liabilities are reviewed and adjusted to reflect additional information as it becomes available. There have been no environmental problems to date that have had, or are expected to have, a material adverse effect on our consolidated financial statements. While it is possible that a loss exceeding the amounts recorded in the consolidated financial statements may be incurred, the potential exposure is not expected to be materially different from those amounts recorded.
We may become subject to new or unforeseen environmental costs or liabilities. Compliance with new or more stringent laws or regulations, stricter interpretations of existing laws, or the discovery of new contamination could cause us to incur additional costs.
Employees
As of January 1, 2017, we employed approximately 8,000 employees in our continuing operations. Several of our subsidiaries are parties to contracts with labor unions and workers’ councils. As of January 1, 2017, we estimate that we employed an aggregate of approximately 1,700 union and workers’ council employees. We consider our relations with our employees to be satisfactory.
Financial Information About Business Segments
The results reported for fiscal year 2016 reflect the new alignment of our operating segments and the placement of our Medical Imaging business into discontinued operations due to its pending sale. Financial information in the table below relating to fiscal years 2015 and 2014 has been retrospectively adjusted to reflect both our new segment structure and the exclusion of our Medical Imaging business from continuing operations.
We have included the expenses for our corporate headquarters, such as legal, tax, audit, human resources, information technology, and other management and compliance costs, as well as the activity related to the mark-to-market adjustment on postretirement benefit plans, as “Corporate” below. We have a process to allocate and recharge expenses to the reportable segments when these costs are administered or paid by the corporate headquarters based on the extent to which the segment benefited from the expenses. These amounts have been calculated in a consistent manner and are included in our calculations of segment results to internally plan and assess the performance of each segment for all purposes, including determining the compensation of the business leaders for each of our operating segments.
The table below sets forth revenue and operating income (loss) from continuing operations by operating segment for the fiscal years ended:
| January 1, 2017 | January 3, 2016 | December 28, 2014 | |||||||||
| (In thousands) | |||||||||||
| Discovery & Analytical Solutions | |||||||||||
| Product revenue | $ | 934,098 | $ | 968,034 | $ | 944,446 | |||||
| Service revenue | 578,886 | 560,385 | 539,694 | ||||||||
| Total revenue | 1,512,984 | 1,528,419 | 1,484,140 | ||||||||
| Operating income from continuing operations(1) | 207,487 | 173,668 | 162,074 | ||||||||
| Diagnostics | |||||||||||
| Product revenue | 462,798 | 427,068 | 428,290 | ||||||||
| Service revenue | 139,735 | 149,336 | 157,450 | ||||||||
| Total revenue | 602,533 | 576,404 | 585,740 | ||||||||
| Operating income from continuing operations | 138,909 | 135,572 | 124,610 | ||||||||
| Corporate | |||||||||||
| Operating loss from continuing operations(2)(3) | (63,330 | ) | (58,314 | ) | (121,677 | ) | |||||
| Continuing Operations | |||||||||||
| Product revenue | $ | 1,396,896 | $ | 1,395,102 | $ | 1,372,736 | |||||
| Service revenue | 718,621 | 709,721 | 697,144 | ||||||||
| Total revenue | 2,115,517 | 2,104,823 | 2,069,880 | ||||||||
| Operating income from continuing operations | 283,066 | 250,926 | 165,007 | ||||||||
| Interest and other expense, net | 38,998 | 42,119 | 41,139 | ||||||||
| Income from continuing operations before income taxes | $ | 244,068 | $ | 208,807 | $ | 123,868 |
| (1) | Legal costs for a particular case in our Discovery & Analytical Solutions segment were $0.8 million for fiscal year 2015. |
| (2) | Activity related to the mark-to-market adjustment on postretirement benefit plans has been included in the Corporate operating loss from continuing operations, and in the aggregate constituted a pre-tax loss of $15.3 million in fiscal year 2016, a pre-tax loss of $12.4 million in fiscal year 2015, and pre-tax loss of $75.4 million in fiscal year 2014. |
| (3) | Includes expenses related to litigation with Enzo Biochem, Inc. and Enzo Life Sciences, Inc. (collectively, “Enzo”). Enzo filed a complaint in 2002 that alleged that we separately and together with other defendants breached distributorship and settlement agreements with Enzo, infringed Enzo's patents, engaged in unfair competition and fraud, and committed torts against Enzo by, among other things, engaging in commercial development and exploitation of Enzo's patented products and technology. We entered into a settlement agreement with Enzo dated June 20, 2014 and during fiscal year 2014 paid $7.0 million into a designated escrow account to resolve this matter, of which $3.7 million had been accrued in previous years and $3.3 million was recorded during fiscal year 2014. In addition, $3.4 million of expenses were incurred and recorded in preparation for the trial during fiscal year 2014. |
Discontinued operations have not been included in the preceding table.
Additional information relating to our reporting segments is as follows for the fiscal years ended:
| Depreciation and Amortization Expense | Capital Expenditures | ||||||||||||||||||||||
| January 1, 2017 | January 3, 2016 | December 28, 2014 | January 1, 2017 | January 3, 2016 | December 28, 2014 | ||||||||||||||||||
| (In thousands) | (In thousands) | ||||||||||||||||||||||
| Discovery & Analytical Solutions | $ | 72,484 | $ | 74,177 | $ | 72,288 | $ | 21,486 | $ | 18,175 | $ | 18,234 | |||||||||||
| Diagnostics | 25,339 | 29,728 | 36,146 | 8,556 | 6,854 | 7,196 | |||||||||||||||||
| Corporate | 2,149 | 1,459 | 2,031 | 1,660 | 3,189 | 1,722 | |||||||||||||||||
| Continuing operations | $ | 99,972 | $ | 105,364 | $ | 110,465 | $ | 31,702 | $ | 28,218 | $ | 27,152 | |||||||||||
| Discontinued operations | $ | 6,266 | $ | 6,643 | $ | 6,610 | $ | 1,302 | $ | 1,414 | $ | 2,133 |
| Total Assets | |||||||||||
| January 1, 2017 | January 3, 2016 | December 28, 2014 | |||||||||
| (In thousands) | |||||||||||
| Discovery & Analytical Solutions | $ | 2,612,757 | $ | 2,546,583 | $ | 2,614,911 | |||||
| Diagnostics | 1,505,381 | 1,459,854 | 1,343,110 | ||||||||
| Corporate | 31,171 | 28,497 | 28,482 | ||||||||
| Current and long-term assets of discontinued operations | 127,374 | 131,361 | 141,073 | ||||||||
| Total assets | $ | 4,276,683 | $ | 4,166,295 | $ | 4,127,576 |
Financial Information About Geographic Areas
Both of our reporting segments conduct business in, and derive substantial revenue from, various countries outside the United States. During fiscal year 2016, we had $1,273.2 million in sales from our international operations, representing approximately 60% of our total sales. During fiscal year 2016, we derived approximately 75% of our international sales from our Discovery & Analytical Solutions segment and approximately 25% of our international sales from our Diagnostics segment. We anticipate that sales from international operations will continue to represent a substantial portion of our total sales in the future.
We are exposed to the risks associated with international operations, including exchange rate fluctuations, regional and country-specific political and economic conditions, foreign receivables collection concerns, trade protection measures and import or export licensing requirements, tax risks, staffing and labor law concerns, intellectual property protection risks, and differing regulatory requirements. Additional geographic information is discussed in Note 23 to our consolidated financial statements included in this annual report on Form 10-K.
Item 1A. Risk Factors
The following important factors affect our business and operations generally or affect multiple segments of our business and operations:
If the markets into which we sell our products decline or do not grow as anticipated due to a decline in general economic conditions, or there are uncertainties surrounding the approval of government or industrial funding proposals, or there are unfavorable changes in government regulations, we may see an adverse effect on the results of our business operations.
Our customers include pharmaceutical and biotechnology companies, laboratories, academic and research institutions, public health authorities, private healthcare organizations, doctors and government agencies. Our quarterly revenue and results of operations are highly dependent on the volume and timing of orders received during the quarter. In addition, our revenues and earnings forecasts for future quarters are often based on the expected trends in our markets. However, the markets we serve do not always experience the trends that we may expect. Negative fluctuations in our customers’ markets, the inability of our customers to secure credit or funding, restrictions in capital expenditures, general economic conditions, cuts in government funding or unfavorable changes in government regulations would likely result in a reduction in demand for our products and services. In addition, government funding is subject to economic conditions and the political process, which is inherently fluid and unpredictable. Our revenues may be adversely affected if our customers delay or reduce purchases as a result of uncertainties surrounding the approval of government or industrial funding proposals. Such declines could harm our consolidated financial position, results of operations, cash flows and trading price of our common stock, and could limit our ability to sustain profitability.
Our growth is subject to global economic and political conditions, and operational disruptions at our facilities.
Our business is affected by global economic and political conditions as well as the state of the financial markets, particularly as the United States and other countries balance concerns around debt, inflation, growth and budget allocations in their policy initiatives. There can be no assurance that global economic conditions and financial markets will not worsen and that we will not experience any adverse effects that may be material to our consolidated cash flows, results of operations, financial position or our ability to access capital, such as the adverse effects resulting from a prolonged shutdown in government operations both in the United States and internationally. Our business is also affected by local economic environments, including inflation, recession, financial liquidity and currency volatility or devaluation. Political changes, some of which may be disruptive, could interfere with our supply chain, our customers and all of our activities in a particular location.
While we take precautions to prevent production or service interruptions at our global facilities, a major earthquake, fire, flood, power loss or other catastrophic event that results in the destruction or delay of any of our critical business operations could result in our incurring significant liability to customers or other third parties, cause significant reputational damage or have a material adverse effect on our business, operating results or financial condition.
Certain of these risks can be hedged to a limited degree using financial instruments, or other measures, and some of these risks are insurable, but any such mitigation efforts are costly and may not always be fully successful. Our ability to engage in such mitigation efforts has decreased or become even more costly as a result of recent market developments.
If we do not introduce new products in a timely manner, we may lose market share and be unable to achieve revenue growth targets.
We sell many of our products in industries characterized by rapid technological change, frequent new product and service introductions, and evolving customer needs and industry standards. Many of the businesses competing with us in these industries have significant financial and other resources to invest in new technologies, substantial intellectual property portfolios, substantial experience in new product development, regulatory expertise, manufacturing capabilities, and established distribution channels to deliver products to customers. Our products could become technologically obsolete over time, or we may invest in technology that does not lead to revenue growth or continue to sell products for which the demand from our customers is declining, in which case we may lose market share or not achieve our revenue growth targets. The success of our new product offerings will depend upon several factors, including our ability to:
| • | accurately anticipate customer needs, |
| • | innovate and develop new reliable technologies and applications, |
| • | successfully commercialize new technologies in a timely manner, |
| • | price our products competitively, and manufacture and deliver our products in sufficient volumes and on time, and |
| • | differentiate our offerings from our competitors’ offerings. |
Many of our products are used by our customers to develop, test and manufacture their products. We must anticipate industry trends and consistently develop new products to meet our customers’ expectations. In developing new products, we may be required to make significant investments before we can determine the commercial viability of the new product. If we fail to accurately foresee our customers’ needs and future activities, we may invest heavily in research and development of products that do not lead to significant revenue. We may also suffer a loss in market share and potential revenue if we are unable to commercialize our technology in a timely and efficient manner.
In addition, some of our licensed technology is subject to contractual restrictions, which may limit our ability to develop or commercialize products for some applications.
We may not be able to successfully execute acquisitions or divestitures, license technologies, integrate acquired businesses or licensed technologies into our existing businesses, or make acquired businesses or licensed technologies profitable.
We have in the past supplemented, and may in the future supplement, our internal growth by acquiring businesses and licensing technologies that complement or augment our existing product lines, such as our acquisition of Bioo Scientific in the third quarter of fiscal year 2016. However, we may be unable to identify or complete promising acquisitions or license transactions for many reasons, such as:
| • | competition among buyers and licensees, |
| • | the high valuations of businesses and technologies, |
| • | the need for regulatory and other approval, and |
| • | our inability to raise capital to fund these acquisitions. |
Some of the businesses we acquire may be unprofitable or marginally profitable, or may increase the variability of our revenue recognition. If, for example, we are unable to successfully commercialize products and services related to significant in-process research and development that we have capitalized, we may have to impair the value of such assets. Accordingly, the earnings or losses of acquired businesses may dilute our earnings. For these acquired businesses to achieve acceptable levels of profitability, we would have to improve their management, operations, products and market penetration. We may not be successful in this regard and may encounter other difficulties in integrating acquired businesses into our existing operations, such as incompatible management, information or other systems, cultural differences, loss of key personnel, unforeseen
regulatory requirements, previously undisclosed liabilities or difficulties in predicting financial results. Additionally, if we are not successful in selling businesses we seek to divest, the activity of such businesses may dilute our earnings and we may not be able to achieve the expected benefits of such divestitures. As a result, our financial results may differ from our forecasts or the expectations of the investment community in a given quarter or over the long term.
To finance our acquisitions, we may have to raise additional funds, either through public or private financings. We may be unable to obtain such funds or may be able to do so only on terms unacceptable to us. We may also incur expenses related to completing acquisitions or licensing technologies, or in evaluating potential acquisitions or technologies, which may adversely impact our profitability.
We may not be successful in adequately protecting our intellectual property.
Patent and trade secret protection is important to us because developing new products, processes and technologies gives us a competitive advantage, although it is time-consuming and expensive. We own many United States and foreign patents and intend to apply for additional patents. Patent applications we file, however, may not result in issued patents or, if they do, the claims allowed in the patents may be narrower than what is needed to protect fully our products, processes and technologies. The expiration of our previously issued patents may cause us to lose a competitive advantage in certain of the products and services we provide. Similarly, applications to register our trademarks may not be granted in all countries in which they are filed. For our intellectual property that is protected by keeping it secret, such as trade secrets and know-how, we may not use adequate measures to protect this intellectual property.
Third parties may also challenge the validity of our issued patents, may circumvent or “design around” our patents and patent applications, or may claim that our products, processes or technologies infringe their patents. In addition, third parties may assert that our product names infringe their trademarks. We may incur significant expense in legal proceedings to protect our intellectual property against infringement by third parties or to defend against claims of infringement by third parties. Claims by third parties in pending or future lawsuits could result in awards of substantial damages against us or court orders that could effectively prevent us from manufacturing, using, importing or selling our products in the United States or other countries.
If we are unable to renew our licenses or otherwise lose our licensed rights, we may have to stop selling products or we may lose competitive advantage.
We may not be able to renew our existing licenses, or licenses we may obtain in the future, on terms acceptable to us, or at all. If we lose the rights to a patented or other proprietary technology, we may need to stop selling products incorporating that technology and possibly other products, redesign our products or lose a competitive advantage. Potential competitors could in-license technologies that we fail to license and potentially erode our market share.
Our licenses typically subject us to various economic and commercialization obligations. If we fail to comply with these obligations, we could lose important rights under a license, such as the right to exclusivity in a market. In some cases, we could lose all rights under the license. In addition, rights granted under the license could be lost for reasons out of our control. For example, the licensor could lose patent protection for a number of reasons, including invalidity of the licensed patent, or a third-party could obtain a patent that curtails our freedom to operate under one or more licenses.
If we do not compete effectively, our business will be harmed.
We encounter aggressive competition from numerous competitors in many areas of our business. We may not be able to compete effectively with all of these competitors. To remain competitive, we must develop new products and periodically enhance our existing products. We anticipate that we may also have to adjust the prices of many of our products to stay competitive. In addition, new competitors, technologies or market trends may emerge to threaten or reduce the value of entire product lines.
Our quarterly operating results could be subject to significant fluctuation, and we may not be able to adjust our operations to effectively address changes we do not anticipate, which could increase the volatility of our stock price and potentially cause losses to our shareholders.
Given the nature of the markets in which we participate, we cannot reliably predict future revenue and profitability. Changes in competitive, market and economic conditions may require us to adjust our operations, and we may not be able to make those adjustments or make them quickly enough to adapt to changing conditions. A high proportion of our costs are fixed, due in part to our research and development and manufacturing costs. As a result, small declines in sales could disproportionately affect our operating results in a quarter. Factors that may affect our quarterly operating results include:
| • | demand for and market acceptance of our products, |
| • | competitive pressures resulting in lower selling prices, |
| • | changes in the level of economic activity in regions in which we do business, |
| • | changes in general economic conditions or government funding, |
| • | settlements of income tax audits, |
| • | expenses incurred in connection with claims related to environmental conditions at locations where we conduct or formerly conducted operations, |
| • | differing tax laws and changes in those laws, or changes in the countries in which we are subject to taxation, |
| • | changes in our effective tax rate, |
| • | changes in industries, such as pharmaceutical and biomedical, |
| • | changes in the portions of our revenue represented by our various products and customers, |
| • | our ability to introduce new products, |
| • | our competitors’ announcement or introduction of new products, services or technological innovations, |
| • | costs of raw materials, energy or supplies, |
| • | changes in healthcare or other reimbursement rates paid by government agencies and other third parties for certain of our products and services, |
| • | our ability to realize the benefit of ongoing productivity initiatives, |
| • | changes in the volume or timing of product orders, |
| • | fluctuation in the expense related to the mark-to-market adjustment on postretirement benefit plans, |
| • | changes in our assumptions underlying future funding of pension obligations, |
| • | changes in assumptions used to determine contingent consideration in acquisitions, and |
| • | changes in foreign currency exchange rates. |
A significant disruption in third-party package delivery and import/export services, or significant increases in prices for those services, could interfere with our ability to ship products, increase our costs and lower our profitability.
We ship a significant portion of our products to our customers through independent package delivery and import/export companies, including UPS and Federal Express in the United States; TNT, UPS and DHL in Europe; and UPS in Asia. We also ship our products through other carriers, including national trucking firms, overnight carrier services and the United States Postal Service. If one or more of the package delivery or import/export providers experiences a significant disruption in services or institutes a significant price increase, we may have to seek alternative providers and the delivery of our products could be prevented or delayed. Such events could cause us to incur increased shipping costs that could not be passed on to our customers, negatively impacting our profitability and our relationships with certain of our customers.
Disruptions in the supply of raw materials, certain key components and other goods from our limited or single source suppliers could have an adverse effect on the results of our business operations, and could damage our relationships with customers.
The production of our products requires a wide variety of raw materials, key components and other goods that are generally available from alternate sources of supply. However, certain critical raw materials, key components and other goods required for the production and sale of some of our principal products are available from limited or single sources of supply. We generally have multi-year contracts with no minimum purchase requirements with these suppliers, but those contracts may not fully protect us from a failure by certain suppliers to supply critical materials or from the delays inherent in being required to change suppliers and, in some cases, validate new raw materials. Such raw materials, key components and other goods can usually be obtained from alternative sources with the potential for an increase in price, decline in quality or delay in delivery. A prolonged inability to obtain certain raw materials, key components or other goods is possible and could have an adverse effect on our business operations, and could damage our relationships with customers.
We are subject to the rules of the Securities and Exchange Commission requiring disclosure as to whether certain materials known as conflict minerals (tantalum, tin, gold, tungsten and their derivatives), which may be contained in our products are mined from the Democratic Republic of the Congo and adjoining countries. As a result of these rules, we may incur additional costs in complying with the disclosure requirements and in satisfying those customers who require that the
components used in our products be certified as conflict-free, and the potential lack of availability of these materials at competitive prices could increase our production costs.
The manufacture and sale of products and services may expose us to product liability claims for which we could have substantial liability.
We face an inherent business risk of exposure to product liability claims if our products, services or product candidates are alleged or found to have caused injury, damage or loss. We may in the future be unable to obtain insurance with adequate levels of coverage for potential liability on acceptable terms or claims of this nature may be excluded from coverage under the terms of any insurance policy that we can obtain. If we are unable to obtain such insurance or the amounts of any claims successfully brought against us substantially exceed our coverage, then our business could be adversely impacted.
If we fail to maintain satisfactory compliance with the regulations of the United States Food and Drug Administration and other governmental agencies in the United States and abroad, we may be forced to recall products and cease their manufacture and distribution, and we could be subject to civil, criminal or monetary penalties.
Our operations are subject to regulation by different state and federal government agencies in the United States and other countries, as well as to the standards established by international standards bodies. If we fail to comply with those regulations or standards, we could be subject to fines, penalties, criminal prosecution or other sanctions. Some of our products are subject to regulation by the United States Food and Drug Administration and similar foreign and domestic agencies. These regulations govern a wide variety of product activities, from design and development to labeling, manufacturing, promotion, sales and distribution. If we fail to comply with those regulations or standards, we may have to recall products, cease their manufacture and distribution, and may be subject to fines or criminal prosecution.
We are also subject to a variety of laws, regulations and standards that govern, among other things, the importation and exportation of products, the handling, transportation and manufacture of toxic or hazardous substances, and our business practices in the United States and abroad such as anti-bribery, anti-corruption and competition laws. This requires that we devote substantial resources to maintaining our compliance with those laws, regulations and standards. A failure to do so could result in the imposition of civil, criminal or monetary penalties having a material adverse effect on our operations.
Changes in governmental regulations may reduce demand for our products or increase our expenses.
We compete in markets in which we or our customers must comply with federal, state, local and foreign regulations, such as environmental, health and safety, and food and drug regulations. We develop, configure and market our products to meet customer needs created by these regulations. Any significant change in these regulations could reduce demand for our products or increase our costs of producing these products.
The healthcare industry is highly regulated and if we fail to comply with its extensive system of laws and regulations, we could suffer fines and penalties or be required to make significant changes to our operations which could have a significant adverse effect on the results of our business operations.
The healthcare industry, including the genetic screening market, is subject to extensive and frequently changing international and United States federal, state and local laws and regulations. In addition, legislative provisions relating to healthcare fraud and abuse, patient privacy violations and misconduct involving government insurance programs provide federal enforcement personnel with substantial powers and remedies to pursue suspected violations. We believe that our business will continue to be subject to increasing regulation as the federal government continues to strengthen its position on healthcare matters, the scope and effect of which we cannot predict. If we fail to comply with applicable laws and regulations, we could suffer civil and criminal damages, fines and penalties, exclusion from participation in governmental healthcare programs, and the loss of various licenses, certificates and authorizations necessary to operate our business, as well as incur liabilities from third-party claims, all of which could have a significant adverse effect on our business.
Economic, political and other risks associated with foreign operations could adversely affect our international sales and profitability.
Because we sell our products worldwide, our businesses are subject to risks associated with doing business internationally. Our sales originating outside the United States represented the majority of our total revenue in fiscal year 2016. We anticipate that sales from international operations will continue to represent a substantial portion of our total revenue. In addition, many of our manufacturing facilities, employees and suppliers are located outside the United States. Accordingly, our future results of operations could be harmed by a variety of factors, including:
| • | changes in actual, or from projected, foreign currency exchange rates, |
| • | changes in a country’s or region’s political or economic conditions, particularly in developing or emerging markets, |
| • | longer payment cycles of foreign customers and timing of collections in foreign jurisdictions, |
| • | embargoes, trade protection measures and import or export licensing requirements, |
| • | policies in foreign countries benefiting domestic manufacturers or other policies detrimental to companies headquartered in the United States, |
| • | differing tax laws and changes in those laws, or changes in the countries in which we are subject to tax, |
| • | adverse income tax audit settlements or loss of previously negotiated tax incentives, |
| • | differing business practices associated with foreign operations, |
| • | difficulty in transferring cash between international operations and the United States, |
| • | difficulty in staffing and managing widespread operations, |
| • | differing labor laws and changes in those laws, |
| • | differing protection of intellectual property and changes in that protection, |
| • | increasing global enforcement of anti-bribery and anti-corruption laws, and |
| • | differing regulatory requirements and changes in those requirements. |
If we do not retain our key personnel, our ability to execute our business strategy will be limited.
Our success depends to a significant extent upon the continued service of our executive officers and key management and technical personnel, particularly our experienced engineers and scientists, and on our ability to continue to attract, retain, and motivate qualified personnel. The competition for these employees is intense. The loss of the services of key personnel could have a material adverse effect on our operating results. In addition, there could be a material adverse effect on us should the turnover rates for key personnel increase significantly or if we are unable to continue to attract qualified personnel. We do not maintain any key person life insurance policies on any of our officers or employees.
Our success also depends on our ability to execute leadership succession plans. The inability to successfully transition key management roles could have a material adverse effect on our operating results.
If we experience a significant disruption in, or breach in security of, our information technology systems, or inadvertent transfer of information, or if we fail to implement new systems, software and technologies successfully, our business could be adversely affected.
We rely on several centralized information technology systems throughout our company to develop, manufacture and provide products and services, keep financial records, process orders, manage inventory, process shipments to customers and operate other critical functions. Our information technology systems may be susceptible to damage, disruptions or shutdowns due to power outages, hardware failures, computer viruses, attacks by computer hackers, telecommunication failures, user errors, catastrophes or other unforeseen events. If we were to experience a prolonged system disruption in the information technology systems that involve our interactions with customers or suppliers, it could result in the loss of sales and customers and significant incremental costs, which could adversely affect our business. In addition, security breaches of our information technology systems or inadvertent transfer of information could result in the misappropriation or unauthorized disclosure of confidential information belonging to us or to our employees, partners, customers or suppliers, which could result in our suffering significant financial or reputational damage.
We have a substantial amount of outstanding debt, which could impact our ability to obtain future financing and limit our ability to make other expenditures in the conduct of our business.
We have a substantial amount of debt and other financial obligations. Our debt level and related debt service obligations could have negative consequences, including:
| • | requiring us to dedicate significant cash flow from operations to the payment of principal and interest on our debt, which reduces the funds we have available for other purposes, such as acquisitions and stock repurchases; |
| • | reducing our flexibility in planning for or reacting to changes in our business and market conditions; and |
| • | exposing us to interest rate risk since a portion of our debt obligations are at variable rates. |
In addition, we may incur additional indebtedness in the future to meet future financing needs. If we add new debt, the risks described above could increase.
Restrictions in our senior unsecured revolving credit facility and other debt instruments may limit our activities.
Our senior unsecured revolving credit facility, senior unsecured notes due in 2021 ("2021 Notes") and senior unsecured notes due in 2026 ("2026 Notes") include restrictive covenants that limit our ability to engage in activities that could otherwise benefit our company. These include restrictions on our ability and the ability of our subsidiaries to:
| • | pay dividends on, redeem or repurchase our capital stock, |
| • | sell assets, |
| • | incur obligations that restrict our subsidiaries’ ability to make dividend or other payments to us, |
| • | guarantee or secure indebtedness, |
| • | enter into transactions with affiliates, and |
| • | consolidate, merge or transfer all, or substantially all, of our assets and the assets of our subsidiaries on a consolidated basis. |
We are also required to meet specified financial ratios under the terms of certain of our existing debt instruments. Our ability to comply with these financial restrictions and covenants is dependent on our future performance, which is subject to prevailing economic conditions and other factors, including factors that are beyond our control, such as foreign exchange rates, interest rates, changes in technology and changes in the level of competition. In addition, if we are unable to maintain our investment grade credit rating, our borrowing costs would increase and we would be subject to different and potentially more restrictive financial covenants under some of our existing debt instruments.
Any future indebtedness that we incur may include similar or more restrictive covenants. Our failure to comply with any of the restrictions in our senior unsecured revolving credit facility, the 2021 Notes, the 2026 Notes or any future indebtedness may result in an event of default under those debt instruments, which could permit acceleration of the debt under those debt instruments, and require us to prepay that debt before its scheduled due date under certain circumstances.
The approval of the Brexit Referendum in the U.K. may have an adverse impact on our results of operations.
In a referendum vote held on June 23, 2016, the United Kingdom voted to leave the European Union. Nearly 3% of our net sales from continuing operations in 2016 came from the U.K. At this time, we are not able to predict the impact that this vote will have on the economy in Europe, including in the U.K., or on the Great Britain Pound (the “GBP”) or other European exchange rates. Weakening of economic conditions or economic uncertainties tend to harm our business, and if such conditions emerge in the U.K. or in the rest of Europe, it may have a material adverse effect on our sales. In addition, any significant weakening of the GBP to the U.S. dollar will have an adverse impact on our European revenues due to the importance of U.K. sales.
Our results of operations will be adversely affected if we fail to realize the full value of our intangible assets.
As of January 1, 2017, our total assets included $2.7 billion of net intangible assets. Net intangible assets consist principally of goodwill associated with acquisitions and costs associated with securing patent rights, trademark rights, customer relationships, core technology and technology licenses and in-process research and development, net of accumulated amortization. We test certain of these items—specifically all of those that are considered “non-amortizing”—at least annually for potential impairment by comparing the carrying value to the fair market value of the reporting unit to which they are assigned. All of our amortizing intangible assets are also evaluated for impairment should events occur that call into question the value of the intangible assets.
Adverse changes in our business, adverse changes in the assumptions used to determine the fair value of our reporting units, or the failure to grow our Discovery & Analytical Solutions and Diagnostics segments may result in impairment of our intangible assets, which could adversely affect our results of operations.
Our share price will fluctuate.
Over the last several years, stock markets in general and our common stock in particular have experienced significant price and volume volatility. Both the market price and the daily trading volume of our common stock may continue to be subject to significant fluctuations due not only to general stock market conditions but also to a change in sentiment in the market regarding our operations and business prospects. In addition to the risk factors discussed above, the price and volume volatility of our common stock may be affected by:
| • | operating results that vary from our financial guidance or the expectations of securities analysts and investors, |
| • | the financial performance of the major end markets that we target, |
| • | the operating and securities price performance of companies that investors consider to be comparable to us, |
| • | announcements of strategic developments, acquisitions and other material events by us or our competitors, and |
| • | changes in global financial markets and global economies and general market conditions, such as interest or foreign exchange rates, commodity and equity prices and the value of financial assets. |
Dividends on our common stock could be reduced or eliminated in the future.
On October 26, 2016, we announced that our Board had declared a quarterly dividend of $0.07 per share for the fourth quarter of fiscal year 2016 that was paid in February 2017. On January 27, 2017, we announced that our Board had declared a quarterly dividend of $0.07 per share for the first quarter of fiscal year 2017 that will be payable in May 2017. In the future, our Board may determine to reduce or eliminate our common stock dividend in order to fund investments for growth, repurchase shares or conserve capital resources.
Item 1B. Unresolved Staff Comments
Not applicable.
Item 2. Properties
As of January 1, 2017, our continuing operations occupied 2,566,797 square feet in over 121 locations. We own 317,809 square feet of this space, and lease the balance. We conduct our operations in manufacturing and assembly plants, research laboratories, administrative offices and other facilities located in 16 states and 31 foreign countries.
Facilities outside of the United States account for approximately 1,438,823 square feet of our owned and leased property, or approximately 56% of our total occupied space.
Our real property leases are both short-term and long-term. We believe that our properties are well-maintained and are adequate for our present requirements.
The following table indicates, as of January 1, 2017, the approximate square footage of real property owned and leased attributable to the continuing operations of our reporting segments:
| Owned | Leased | Total | ||||||
| (In square feet) | ||||||||
| Discovery & Analytical Solutions | 105,020 | 1,561,535 | 1,666,555 | |||||
| Diagnostics | 212,789 | 632,111 | 844,900 | |||||
| Corporate offices | — | 55,342 | 55,342 | |||||
| Continuing operations | 317,809 | 2,248,988 | 2,566,797 |
Item 3. Legal Proceedings
We are subject to various claims, legal proceedings and investigations covering a wide range of matters that arise in the ordinary course of our business activities. Although we have established accruals for potential losses that we believe are probable and reasonably estimable, in the opinion of our management, based on its review of the information available at this time, the total cost of resolving these contingencies at January 1, 2017 should not have a material adverse effect on our consolidated financial statements included in this annual report on Form 10-K. However, each of these matters is subject to uncertainties, and it is possible that some of these matters may be resolved unfavorably to us.
Item 4. Mine Safety Disclosures
Not applicable.
EXECUTIVE OFFICERS OF THE REGISTRANT
Listed below are our executive officers as of February 28, 2017. No family relationship exists between any one of these executive officers and any of the other executive officers or directors.
| Name | Position | Age | ||
| Robert F. Friel | Chairman, Chief Executive Officer and President | 61 | ||
| Frank A. Wilson | Senior Vice President and Chief Financial Officer | 58 | ||
| Joel S. Goldberg | Senior Vice President, Administration, General Counsel and Secretary | 48 | ||
| James Corbett | Executive Vice President and President, Discovery & Analytical Solutions | 54 | ||
| Prahlad Singh | Senior Vice President and President, Diagnostics | 52 | ||
| Daniel R. Tereau | Senior Vice President, Strategy and Business Development | 50 | ||
| Deborah Butters | Senior Vice President, Chief Human Resources Officer | 47 | ||
| Andrew Okun | Vice President and Chief Accounting Officer | 47 |
Robert F. Friel, 61. Mr. Friel currently serves as our Chairman, Chief Executive Officer and President. Prior to being appointed President and Chief Executive Officer in February 2008 and Chairman in April 2009, Mr. Friel had served as President and Chief Operating Officer since August 2007, and as Vice Chairman and President of our Life and Analytical Sciences unit since January 2006. Mr. Friel was our Executive Vice President and Chief Financial Officer, with responsibility for business development and information technology in addition to his oversight of the finance functions, from October 2004 until January 2006. Mr. Friel joined PerkinElmer in February 1999 as our Senior Vice President and Chief Financial Officer. Prior to joining PerkinElmer, he held several senior management positions with AlliedSignal, Inc., now Honeywell International. He received a Bachelor of Arts degree in economics from Lafayette College and a Master of Science degree in taxation from Fairleigh Dickinson University. Mr. Friel is currently a director of NuVasive, Inc. and Xylem Inc., and previously served as a director of CareFusion Corporation until its acquisition by Becton, Dickinson and Company in March 2015. He also previously served on the national board of trustees for the March of Dimes Foundation.
Frank A. Wilson, 58. Mr. Wilson joined us in May 2009 as our Senior Vice President and Chief Financial Officer. Prior to joining us, Mr. Wilson held key financial and business management roles over 12 years at the Danaher Corporation, including Corporate Vice President of Investor Relations; Group Vice President of Business Development; Group Vice President of Finance for Danaher Motion Group; President of Gems Sensors; and Group Vice President of Finance for the Industrial Controls Group. Mr. Wilson is currently a director of Sparton Corporation. Previously, Mr. Wilson worked for several years at AlliedSignal Inc., now Honeywell International, where he last served as Vice President of Finance and Chief Financial Officer for Commercial Aviation Systems. His earlier experience includes PepsiCo Inc. in financial and controllership positions of increasing responsibility, E.F. Hutton and Company, and KPMG Peat Marwick. Mr. Wilson received a Bachelor’s degree in business administration from Baylor University and is also a Certified Public Accountant.
Joel S. Goldberg, 48. Mr. Goldberg joined us as our Senior Vice President, General Counsel and Secretary in July 2008. Prior to joining us, Mr. Goldberg spent seven years at Millennium Pharmaceuticals, Inc., where he most recently served as Vice President, Chief Compliance Officer and Secretary. During his seven years with Millennium, he focused in the areas of mergers and acquisitions, strategic alliances, investment and financing transactions, securities and healthcare related compliance, and employment law. Previously, he was an associate of the law firm Edwards & Angell, LLP. Mr. Goldberg graduated from the Northeastern University School of Law and also holds a Master of Business Administration from Northeastern University. He completed his undergraduate degree at the University of Wisconsin-Madison.
James Corbett, 54. Mr. Corbett was appointed President of our Discovery & Analytical Solutions business and Executive Vice President of PerkinElmer in October 2016. Mr. Corbett was appointed President of our Human Health business in March 2014 and has been a Senior Vice President and officer of PerkinElmer since February 2012. Mr. Corbett was appointed President of the Diagnostics business in May 2010 and was appointed President of the Life Sciences and Technology business in May 2013. Mr. Corbett joined the Company in October of 2007 through our acquisition of ViaCord, where he served as President. Prior to joining ViaCord, he co-founded CADx Systems, a company focused on the oncology market, where he held the position of Executive Vice President and Director with responsibility for worldwide sales and marketing, technical support and business development. Following the 2004 acquisition of CADx by iCAD, Inc., he was named Chief Commercial Officer. In addition, Mr. Corbett worked for Abbott Laboratories for 14 years in a variety of sales and marketing positions including Worldwide Marketing Manager for Abbott Diagnostics Immunoassay Systems and Region Manager for Abbott Diagnostics. Mr. Corbett holds a Bachelor of Science degree in business from the University of Massachusetts. Mr. Corbett also serves on the national board of trustees for the March of Dimes Foundation and on the board of directors for the Analytical, Life Science & Diagnostics Association.
Prahlad Singh, 52. Mr. Singh joined PerkinElmer as the President of our Diagnostics business in May 2014. He has been a Senior Vice President and officer of PerkinElmer since September 2016. Prior to joining PerkinElmer, Mr. Singh was General Manager of GE Healthcare’s Women’s Health Business from 2012 to 2014. In this role, he had worldwide responsibility for GE Healthcare’s Mammography and Bone Densitometry businesses. Before that, Mr. Singh held senior executive level roles in Strategy, Business Development and Mergers & Acquisitions at both GE Healthcare from 2011 to 2012 and Philips Healthcare from 2007 to 2011. From 1995 to 2007, he held leadership roles of increasing responsibility at DuPont Pharmaceuticals and subsequently Bristol Myers Squibb Medical Imaging which included managing the Asia Pacific and Middle East region. Mr. Singh holds a doctoral degree in chemistry from the University of Missouri-Columbia and a Master of Business Administration from Northeastern University. His research work has resulted in several issued patents and publications in peer reviewed journals.
Daniel R. Tereau, 50. Mr. Tereau was appointed Senior Vice President, Strategy and Business Development in January 2016 and had joined the Company in April 2014 as a Vice President, Strategy and Business Development. He is responsible for leading PerkinElmer’s overall strategic planning, business development, and corporate marketing activities. Prior to joining PerkinElmer, Mr. Tereau served on Novartis’ leadership team as Senior Vice President and Global Head of Strategy, Business Development and Licensing from 2011 to 2014, where he was responsible for global strategy and business development for the Consumer Health division. Prior to 2011, Mr. Tereau held similar roles at Thermo Fisher Scientific and GE Healthcare. Mr. Tereau holds a Bachelor of Science degree in finance from Ferris State University, a Juris Doctorate from Wayne State University, and earned his Master of Business Administration from Yale University. He also serves on the board of directors for SeraCare Life Sciences, Inc.
Deborah Butters, 47. Ms. Butters joined PerkinElmer in July 2016 as Senior Vice President, Chief Human Resources Officer. Prior to joining us, she served as Head of North America Human Resources at IBM, where she led all aspects of the Human Resource function for IBM’s largest geography, which included 35,000 employees and was responsible for over $30B of IBM’s revenue. During her 17 year career there, she significantly helped shape IBM’s HR programs and practices, including leading its enterprise-wide, people transformation strategy to optimize employee engagement and business performance. Ms. Butters was with Lotus Development for eight years prior to its acquisition by IBM. Ms. Butters’ experiences working in the United Kingdom and Germany for Lotus Development, and in Switzerland and the United States for IBM, ranged from leading functional roles across workforce planning and talent management, to serving in five HR business partner roles in both software and consulting within IBM and Lotus Development, with the largest being IBM’s North America Consulting business. Ms. Butters holds a Bachelor of Science degree from the University of Bath and a diploma in Human Resources from London University.
Andrew Okun, 47. Mr. Okun serves as our Vice President and Chief Accounting Officer, a position in which he has served since April 2011. Mr. Okun joined us in 2001 and has served in financial and controllership positions of increasing responsibility, including Director of Finance for the Optoelectronics business from 2001 through 2005, Vice President of Finance from 2005 through 2009 and Vice President and Corporate Controller from 2009 through 2011. Prior to joining us, Mr. Okun most recently worked for Honeywell International as a Site Controller as well as for Coopers & Lybrand. Mr. Okun is a Certified Public Accountant and earned his Master of Business Administration from the University of Virginia. He completed his undergraduate degree at the University of Santa Barbara.
PART II
Item 5. Market for Registrant’s Common Equity, Related Stockholder Matters and Issuer Purchases of Equity Securities
Market Price of Common Stock
Our common stock is listed and traded on the New York Stock Exchange. The following table sets forth the high and low per share closing sale prices for our common stock on that exchange for each quarter in fiscal years 2016 and 2015.
| 2016 Fiscal Quarters | |||||||||||||||
| First | Second | Third | Fourth | ||||||||||||
| High | $53.01 | $55.56 | $56.92 | $56.43 | |||||||||||
| Low | 41.45 | 48.58 | 51.94 | 49.95 | |||||||||||
| 2015 Fiscal Quarters | |||||||||||||||
| First | Second | Third | Fourth | ||||||||||||
| High | $51.09 | $54.29 | $53.00 | $54.36 | |||||||||||
| Low | 42.66 | 50.30 | 44.45 | 46.74 |
As of February 24, 2017, we had approximately 4,079 holders of record of our common stock.
Stock Repurchase Program
We did not repurchase any of our common stock under our share repurchase program during the fourth quarter of fiscal year 2016.
Dividends
During fiscal years 2016 and 2015, we declared regular quarterly cash dividends on our common stock. The table below sets forth the cash dividends per share that we declared on our common stock during each of those fiscal years, by quarter.
| 2016 Fiscal Quarters | 2016 Total | ||||||||||||||||||
| First | Second | Third | Fourth | ||||||||||||||||
| Cash dividends declared per common share | $ | 0.07 | $ | 0.07 | $ | 0.07 | $ | 0.07 | $ | 0.28 | |||||||||
| 2015 Fiscal Quarters | 2015 Total | ||||||||||||||||||
| First | Second | Third | Fourth | ||||||||||||||||
| Cash dividends declared per common share | $ | 0.07 | $ | 0.07 | $ | 0.07 | $ | 0.07 | $ | 0.28 |
While it is our current intention to pay regular quarterly cash dividends, any decision to pay future cash dividends will be made by our Board and will depend on our earnings, financial condition and other factors. Our Board may reduce or eliminate our common stock dividend in order to fund investments for growth, repurchase shares or conserve capital resources. For further information related to our stockholders’ equity, see Note 19 to our consolidated financial statements included in this annual report on Form 10-K.
Stock Performance Graph
Set forth below is a line graph comparing the cumulative total shareholder return on our common stock against the cumulative total return of the S&P Composite-500 Index and a Peer Group Index for the five fiscal years from January 1, 2012 to January 1, 2017. Our Peer Group Index consists of Agilent Technologies Inc., Thermo Fisher Scientific Inc. ("Thermo Fisher"), and Waters Corporation. The peer group is the same as the peer group used in the stock performance graph in our Annual Report on Form 10-K for the fiscal year ended January 3, 2016, except that it does not include Affymetrix, Inc., which has been excluded due to its acquisition by Thermo Fisher during fiscal year 2016.
Comparison of Five-Year Cumulative Total Return
PerkinElmer, Inc. Common Stock, S&P Composite-500 and
Peer Group Index
TOTAL RETURN TO SHAREHOLDERS
(Includes reinvestment of dividends)
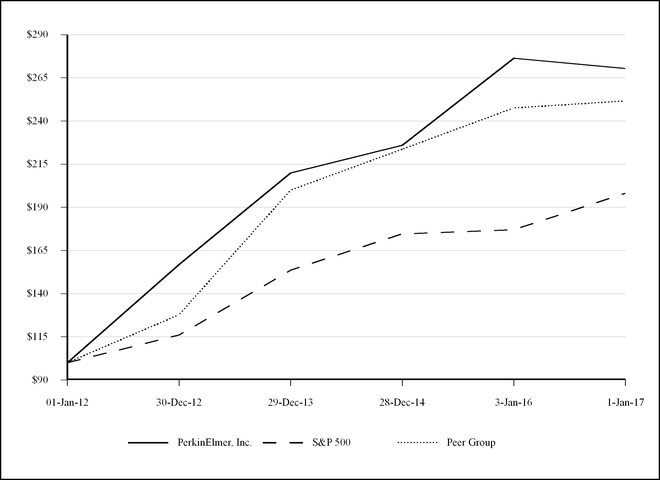
| 01-Jan-12 | 30-Dec-12 | 29-Dec-13 | 28-Dec-14 | 3-Jan-16 | 1-Jan-17 | ||||||||||||||||||
| PerkinElmer, Inc. | $ | 100.00 | $ | 156.82 | $ | 209.82 | $ | 226.00 | $ | 276.32 | $ | 270.47 | |||||||||||
| S&P 500 Index | $ | 100.00 | $ | 116.00 | $ | 153.58 | $ | 174.60 | $ | 177.01 | $ | 198.18 | |||||||||||
| Peer Group | $ | 100.00 | $ | 127.78 | $ | 199.93 | $ | 223.68 | $ | 247.56 | $ | 251.59 |
Item 6. Selected Financial Data
The following table sets forth selected historical financial information as of and for each of the fiscal years in the five-year period ended January 1, 2017. We derived the selected historical financial information for the balance sheets for the fiscal years ended January 1, 2017 and January 3, 2016 and the statement of operations for each of the fiscal years in the three-year period ended January 1, 2017 from our audited consolidated financial statements which are included elsewhere in this annual report on Form 10-K. We derived the selected historical financial information for the statements of operations for the fiscal years ended December 29, 2013 and December 30, 2012 from our audited consolidated financial statements which are not included in this annual report on Form 10-K. We derived the selected historical financial information for the balance sheets as of December 28, 2014, December 29, 2013 and December 30, 2012 from our audited consolidated financial statements which are not included in this annual report on Form 10-K. We adjusted the information in the consolidated financial statements, where appropriate, for discontinued operations.
Our historical financial information may not be indicative of our future results of operations or financial position.
The following selected historical financial information should be read together with our “Management’s Discussion and Analysis of Financial Condition and Results of Operations” and our consolidated financial statements, including the related notes, included elsewhere in this annual report on Form 10-K.
| Fiscal Years Ended | |||||||||||||||||||
| January 1, 2017 | January 3, 2016 | December 28, 2014 | December 29, 2013 | December 30, 2012 | |||||||||||||||
| (In thousands, except per share data) | |||||||||||||||||||
| Statement of Operations Data: | |||||||||||||||||||
| Revenue | $ | 2,115,517 | $ | 2,104,823 | $ | 2,069,880 | $ | 1,996,959 | $ | 1,940,202 | |||||||||
| Operating income from continuing operations(1)(2)(3) | 283,066 | 250,926 | 165,007 | 180,791 | 51,494 | ||||||||||||||
| Interest and other expense, net(4) | 38,998 | 42,119 | 41,139 | 64,110 | 47,956 | ||||||||||||||
| Income from continuing operations before income taxes | 244,068 | 208,807 | 123,868 | 116,681 | 3,538 | ||||||||||||||
| Income from continuing operations, net of income taxes(5) | 215,706 | 188,785 | 130,139 | 142,206 | 36,354 | ||||||||||||||
| Income from discontinued operations and dispositions, net of income taxes(6)(7) | 18,593 | 23,640 | 27,639 | 25,006 | 33,586 | ||||||||||||||
| Net income | $ | 234,299 | $ | 212,425 | $ | 157,778 | $ | 167,212 | $ | 69,940 | |||||||||
| Basic earnings per share: | |||||||||||||||||||
| Continuing operations | $ | 1.97 | $ | 1.68 | $ | 1.16 | $ | 1.27 | $ | 0.32 | |||||||||
| Discontinued operations | 0.17 | 0.21 | 0.25 | 0.22 | 0.30 | ||||||||||||||
| Net income | $ | 2.14 | $ | 1.89 | $ | 1.40 | $ | 1.49 | $ | 0.61 | |||||||||
| Diluted earnings per share: | |||||||||||||||||||
| Continuing operations | $ | 1.96 | $ | 1.67 | $ | 1.14 | $ | 1.25 | $ | 0.32 | |||||||||
| Discontinued operations | 0.17 | 0.21 | 0.24 | 0.22 | 0.29 | ||||||||||||||
| Net income | $ | 2.12 | $ | 1.87 | $ | 1.39 | $ | 1.47 | $ | 0.61 | |||||||||
| Weighted-average common shares outstanding: | |||||||||||||||||||
| Basic: | 109,478 | 112,507 | 112,593 | 112,254 | 113,728 | ||||||||||||||
| Diluted: | 110,313 | 113,315 | 113,739 | 113,503 | 114,860 | ||||||||||||||
| Cash dividends declared per common share | $ | 0.28 | $ | 0.28 | $ | 0.28 | $ | 0.28 | $ | 0.28 |
| As of | |||||||||||||||||||
| January 1, 2017 | January 3, 2016 | December 28, 2014 | December 29, 2013 | December 30, 2012 | |||||||||||||||
| (In thousands) | |||||||||||||||||||
| Balance Sheet Data: | |||||||||||||||||||
| Total assets(6) | $ | 4,276,683 | $ | 4,166,295 | $ | 4,127,576 | $ | 3,940,882 | $ | 3,894,451 | |||||||||
| Short-term debt | 1,172 | 1,123 | 1,075 | 2,624 | 1,772 | ||||||||||||||
| Long-term debt(4)(8) | 1,045,254 | 1,011,762 | 1,045,393 | 926,274 | 931,513 | ||||||||||||||
| Stockholders’ equity(1)(9) | 2,153,570 | 2,110,441 | 2,042,102 | 1,994,487 | 1,939,812 | ||||||||||||||
| Common shares outstanding(9) | 109,617 | 112,034 | 112,481 | 112,626 | 115,036 |
| (1) | Activity related to the mark-to-market adjustment on postretirement benefit plans was a pre-tax loss of $15.3 million in fiscal year 2016, a pre-tax loss of $12.4 million in fiscal year 2015, a pre-tax loss of $75.4 million in fiscal year 2014, a pre-tax income of $17.6 million in fiscal year 2013 and a pre-tax loss of $31.3 million in fiscal year 2012. |
| (2) | We recorded pre-tax restructuring and contract termination charges, net, of $5.1 million in fiscal year 2016, $13.5 million in fiscal year 2015, $13.3 million in fiscal year 2014, $33.5 million in fiscal year 2013 and $25.0 million in fiscal year 2012. |
| (3) | In fiscal year 2013, we recorded pre-tax impairment charges of $0.2 million as the carrying amounts of certain long-lived assets were not recoverable and exceeded their fair value. In fiscal year 2012, we recorded pre-tax impairment charges of $74.2 million as a result of a review of certain of our trade names within our portfolio as part of a realignment of our marketing strategy. |
| (4) | In fiscal years 2016, 2015, 2014, 2013 and 2012, interest expense was $41.5 million, $38.0 million, $36.3 million, $49.9 million and $45.8 million, respectively. In fiscal year 2013, we redeemed all of our 6% senior unsecured notes due in 2015 (the “2015 Notes”) that included a prepayment premium of $11.1 million, which is included in other expense, net, the write-off of $2.8 million for the remaining unamortized derivative losses for previously settled cash flow hedges, which is included in interest expense, and the write-off of $0.2 million for the remaining deferred debt issuance costs, which is included in interest expense. |
| (5) | In fiscal years 2016 and 2015, provision for income tax on continuing operations was $28.4 million and $20.0 million, respectively. The higher provision for income taxes in fiscal year 2016 was primarily due to higher income in higher tax rate jurisdictions, partially offset by an increase in tax benefit of $3.2 million related to discrete items from $6.4 million in fiscal year 2015 to $9.6 million in fiscal year 2016. In fiscal years 2014, 2013 and 2012, tax benefit on continuing operations was $6.3 million, $25.5 million and $32.8 million, respectively. The benefit from income taxes in fiscal year 2014 was primarily due to losses in higher tax rate jurisdictions and a tax benefit of $7.1 million related to discrete items, partially offset by a provision for income taxes related to profits in lower tax rate jurisdictions. The benefit from income taxes in fiscal year 2013 was primarily due to a tax benefit of $24.0 million related to discrete items and losses in higher tax rate jurisdictions, partially offset by a provision for income taxes related to profits in lower tax rate jurisdictions. The benefit from income taxes in fiscal year 2012 was primarily due to a tax benefit of $7.0 million related to discrete items and losses in higher tax rate jurisdictions, which included pre-tax impairment charges of $74.2 million, partially offset by provision for income taxes related to profits in lower tax rate jurisdictions. |
| (6) | In May 2014, we approved the shutdown of our microarray-based diagnostic testing laboratory in the United States. The shutdown resulted in a $0.1 million net pre-tax gain primarily related to the disposal of fixed assets, which was partially offset by the sale of a building in fiscal year 2014. |
| (7) | In December 2016, we entered into a Master Purchase and Sale Agreement for the sale of our Medical Imaging business. We accounted for this business as discontinued operations beginning in 2016 and the financial information relating to fiscal years 2015, 2014, 2013 and 2012 has been retrospectively adjusted to reflect the inclusion of this business in discontinued operations. |
| (8) | In July 2016, we issued and sold ten-year senior notes at a rate of 1.875% with a face value of €500.0 million and received €492.3 million of net proceeds from the issuance. The debt, which matures in July 2026, is unsecured. |
| (9) | In fiscal year 2016, we repurchased in the open market 3.2 million shares of our common stock at an aggregate cost of $148.2 million, including commissions under a stock repurchase program authorized by our Board on October 23, 2014 ("the Repurchase Program"). In fiscal year 2015, we repurchased in the open market 1.5 million shares of our common stock at an aggregate cost of $72.0 million, including commissions under the Repurchase Program. In fiscal year 2014, we repurchased in the open market 1.4 million shares of our common stock at an aggregate cost of $61.3 million, including commissions, under both the Repurchase Program and a stock repurchase program originally announced in October 2012 that expired in October 2014 (the "Former Repurchase Program"). In fiscal year 2013, we repurchased in the open market 3.6 million shares of our common stock at an aggregate cost of $123.0 million, including commissions, under the Former Repurchase Program. In fiscal year 2012, we did not repurchase any shares |
of our common stock. The repurchased shares have been reflected as additional authorized but unissued shares, with the payments reflected in common stock and capital in excess of par value.
Item 7. Management’s Discussion and Analysis of Financial Condition and Results of Operations
This annual report on Form 10-K, including the following management’s discussion and analysis, contains forward-looking information that you should read in conjunction with the consolidated financial statements and notes to consolidated financial statements that we have included elsewhere in this annual report on Form 10-K. For this purpose, any statements contained in this report that are not statements of historical fact may be deemed to be forward-looking statements. Words such as “believes,” “plans,” “anticipates,” “expects,” “will” and similar expressions are intended to identify forward-looking statements. Our actual results may differ materially from the plans, intentions or expectations we disclose in the forward-looking statements we make. We have included important factors above under the heading “Risk Factors” in Item 1A above that we believe could cause actual results to differ materially from the forward-looking statements we make. We are not obligated to publicly update any forward-looking statements, whether as a result of new information, future events or otherwise.
Accounting Period
Our fiscal year ends on the Sunday nearest December 31. We report fiscal years under a 52/53 week format and as a result, certain fiscal years will contain 53 weeks. Each of the fiscal years ended January 1, 2017 ("fiscal year 2016") and December 28, 2014 ("fiscal year 2014") included 52 weeks. The fiscal year ended January 3, 2016 ("fiscal year 2015") included 53 weeks. The additional week in fiscal year 2015 has been reflected in our third quarter. The fiscal year ending December 31, 2017 will include 52 weeks.
Overview of Fiscal Year 2016
We realigned our businesses at the beginning of the fourth quarter of fiscal year 2016 to better organize around customer requirements, positioning us to grow in attractive end markets and expand share with our core product offerings. We created two new reporting segments, Discovery & Analytical Solutions and Diagnostics, which will enable us to deliver improved customer focus, more value-add collaboration and breakthrough innovations. Microfluidics and automation products within our former research business were moved to a new applied genomics group within the Diagnostics segment. In addition, we also moved our Medical Imaging business into discontinued operations due to its pending sale. The results reported for fiscal year 2016 reflect our new segment structure and the exclusion of our Medical Imaging business from continuing operations. Financial information in this report relating to fiscal years 2015 and 2014 has been retrospectively adjusted to reflect these changes.
During fiscal year 2016, we continued to see good performance from acquisitions, investments in our ongoing technology and sales and marketing initiatives. Our overall revenue in fiscal year 2016 increased $10.7 million, or 1%, as compared to fiscal year 2015, reflecting an increase of $26.1 million, or 5%, in our Diagnostics segment revenue, which was partially offset by a decrease of $15.4 million, or 1%, in our Discovery & Analytical Solutions segment revenue. The decrease in our Discovery & Analytical Solutions segment was primarily driven by decreases in revenue in our academic and government product offerings within our life sciences research market and a decrease in our environmental and food businesses due to weak harvest conditions, which were partially offset by increased demand in our laboratory services business. The increase in our Diagnostics segment revenue during fiscal year 2016 was primarily due to strong performance of our newborn and infectious disease screening solutions in emerging markets such as China, as well as in Europe.
In our Discovery & Analytical Solutions segment, excluding the unfavorable impact of foreign currency exchange, we experienced flat growth during fiscal year 2016 in several of our products within our life science research end market, as compared to fiscal year 2015. During fiscal year 2016, we experienced increased demand for our OneSource laboratory service and informatics businesses. Our OneSource laboratory service business offers services designed to enable our customers to increase efficiencies and production time while reducing maintenance costs, all of which continue to be critical for them. This was offset by decreases in revenue in our environmental and food business due to weak harvest conditions as well as in our academic and government product offerings due to reduced government funding. We anticipate that the continued development of contaminant regulations and corresponding testing protocols will result in increased demand for efficient, analytically sensitive and information rich testing solutions.
In our Diagnostics segment, we experienced growth from continued expansion in our newborn screening, blood banking and screening businesses. Birth rates in the United States continue to stabilize and demand for greater access to newborn screening in rural areas outside the United States is also increasing, as evidenced by prenatal trends we saw during fiscal year 2016. The growth in our Diagnostics segment was partially offset by unfavorable impacts from foreign currency as the U.S. dollar strengthened. As the rising cost of healthcare continues to be one of the critical issues facing our customers, we anticipate that the benefits of providing earlier detection of disease, which can result in a reduction of long-term health care costs as well as create better outcomes for patients, are increasingly valued and we expect to see continued growth in these markets.
Our consolidated gross margins increased 209 basis points in fiscal year 2016, as compared to fiscal year 2015, primarily due to favorable changes in product mix, with an increase in sales of higher gross margin product offerings, and benefits from our initiatives to improve our supply chain. Our consolidated operating margin increased 146 basis points in fiscal year 2016, as compared to fiscal year 2015 primarily due to higher gross margins and lower costs as a result of cost containment and productivity initiatives, which were partially offset by increased costs related to investments in new product development.
We continue to believe that we are well positioned to take advantage of the spending trends in our end markets and to promote efficiencies in markets where current conditions may increase demand for certain services. Overall, we believe that our strategic focus on diagnostics and discovery and analytical solutions markets, coupled with our deep portfolio of technologies and applications, leading market positions, global scale and financial strength will provide us with a foundation for growth.
Consolidated Results of Continuing Operations
Revenue
2016 Compared to 2015. Revenue for fiscal year 2016 was $2,115.5 million, as compared to $2,104.8 million for fiscal year 2015, an increase of $10.7 million, or 1%, which includes an approximate 1% decrease in revenue attributable to changes in foreign exchange rates with minimal impact from acquisitions and divestitures. In addition, our fiscal year 2015 had an additional week, which consisted of 53 weeks, as compared to fiscal year 2016, which consisted of 52 weeks. The analysis in the remainder of this paragraph compares segment revenue for fiscal year 2016 as compared to fiscal year 2015 and includes the effect of foreign exchange rate fluctuations and acquisitions and divestitures. The total increase in revenue reflects an increase in our Diagnostics segment revenue of $26.1 million, or 5%, due to continued expansion in our newborn screening, blood banking and screening businesses. Our Discovery & Analytical Solutions segment revenue decreased by $15.4 million, or 1%, due to a decrease in environmental, food and industrial markets revenue of $20.8 million and life sciences research market revenue of $0.6 million, which was partially offset by an increase in laboratory
Showing the first 8K of 143K characters. Open the full section
Item 7A. Quantitative and Qualitative Disclosures About Market Risk
Quantitative and Qualitative Disclosures about Market Risk
Financial Instruments
Financial instruments that potentially subject us to concentrations of credit risk consist principally of temporary cash investments, derivatives, marketable securities and accounts receivable. We believe we had no significant concentrations of credit risk as of January 1, 2017.
We use derivative instruments as part of our risk management strategy only, and include derivatives utilized as economic hedges that are not designated as hedging instruments. By nature, all financial instruments involve market and credit risks. We enter into derivative instruments with major investment grade financial institutions and have policies to monitor the credit risk of those counterparties. We do not enter into derivative contracts for trading or other speculative purposes, nor do we use
leveraged financial instruments. Approximately 60% of our business is conducted outside of the United States, generally in foreign currencies. As a result, fluctuations in foreign currency exchange rates can increase the costs of financing, investing and operating the business.
In the ordinary course of business, we enter into foreign exchange contracts for periods consistent with our committed exposures to mitigate the effect of foreign currency movements on transactions denominated in foreign currencies. The intent of these economic hedges is to offset gains and losses that occur on the underlying exposures from these currencies, with gains and losses resulting from the forward currency contracts that hedge these exposures. Transactions covered by hedge contracts include intercompany and third-party receivables and payables. The contracts are primarily in European and Asian currencies, have maturities that do not exceed 12 months, have no cash requirements until maturity, and are recorded at fair value on our condensed consolidated balance sheets. The unrealized gains and losses on our foreign currency contracts are recognized immediately in interest and other expense, net. The cash flows related to the settlement of these hedges are included in cash flows from operating activities within our condensed consolidated statement of cash flows.
Principal hedged currencies include the British Pound, Euro, Japanese Yen and Singapore Dollar. We held forward foreign exchange contracts, designated as economic hedges, with U.S. dollar equivalent notional amounts totaling $137.5 million at January 1, 2017, $127.3 million at January 3, 2016 and $95.0 million at December 28, 2014, and the fair value of these foreign currency derivative contracts was insignificant. The gains and losses realized on these foreign currency derivative contracts are not material. The duration of these contracts was generally 30 days or less during each of fiscal years 2016, 2015 and 2014.
In addition, in connection with certain intercompany loan agreements utilized to finance our acquisitions and stock repurchase program, we enter into forward foreign exchange contracts intended to hedge movements in foreign exchange rates prior to settlement of such intercompany loans denominated in foreign currencies. We record these hedges at fair value on our condensed consolidated balance sheets. The unrealized gains and losses on these hedges, as well as the gains and losses associated with the remeasurement of the intercompany loans, are recognized immediately in interest and other expense, net. The cash flows related to the settlement of these hedges are included in cash flows from financing activities within our condensed consolidated statement of cash flows.
As of January 1, 2017, the outstanding forward exchange contracts designated as economic hedges, that were intended to hedge movements in foreign exchange rates prior to the settlement of certain intercompany loan agreements included combined Euro notional amounts of €58.6 million, combined U.S. Dollar notional amounts of $8.7 million and combined Swedish Krona notional amounts of kr969.5 million. The combined Euro notional amounts of these outstanding hedges was €107.4 million and €238.2 million as of January 3, 2016 and December 28, 2014, respectively. The net gains and losses on these derivatives, combined with the gains and losses on the remeasurement of the hedged intercompany loans were not material for the fiscal years ended January 1, 2017 and January 3, 2016. We paid $1.9 million and received $18.7 million during the fiscal years ended January 1, 2017 and January 3, 2016, respectively, from the settlement of these hedges.
During fiscal year 2016, we entered into a series of foreign currency forward contracts with a notional amount of €492.3 million to hedge our investments in certain foreign subsidiaries. Realized and unrealized translation adjustments from these hedges were included in the foreign currency translation component of accumulated other comprehensive income ("AOCI"), which offsets the translation adjustments on the underlying net assets of foreign subsidiaries. The cumulative translation gains or losses will remain in AOCI until the foreign subsidiaries are liquidated or sold. The foreign currency forward contracts were settled during fiscal year 2016 and we recorded a net realized foreign exchange gain in AOCI amounting to $1.8 million during the fiscal year 2016.
During fiscal year 2016, in connection with the issuance of the 2026 Notes, we designated the 2026 Notes to hedge our investments in certain foreign subsidiaries. Realized and unrealized translation adjustments from these hedges will be included in the foreign currency translation component of AOCI, which will offset translation adjustments on the underlying net assets of foreign subsidiaries. The cumulative translation gains or losses will remain in AOCI until the foreign subsidiaries are liquidated or sold. As of January 1, 2017, the total notional amount of foreign currency denominated debt designated to hedge investments in foreign subsidiaries was €495.8 million. The unrealized foreign exchange loss recorded in AOCI related to the net investment hedge was $23.8 million during the fiscal year 2016.
Market Risk
Market Risk. We are exposed to market risk, including changes in interest rates and currency exchange rates. To manage the volatility relating to these exposures, we enter into various derivative transactions pursuant to our policies to hedge against known or forecasted market exposures.
Foreign Exchange Risk. The potential change in foreign currency exchange rates offers a substantial risk to us, as approximately 60% of our business is conducted outside of the United States, generally in foreign currencies. Our risk management strategy currently uses forward contracts to mitigate certain balance sheet foreign currency transaction exposures. The intent of these economic hedges is to offset gains and losses that occur on the underlying exposures, with gains and losses resulting from the forward contracts that hedge these exposures. Moreover, we are able to partially mitigate the impact that fluctuations in currencies have on our net income as a result of our manufacturing facilities located in countries outside the United States, material sourcing and other spending which occur in countries outside the United States, resulting in natural hedges.
Although we attempt to manage our foreign currency exchange risk through the above activities, when the U.S. dollar weakens against other currencies in which we transact business, sales and net income will in general be positively but not proportionately impacted. Conversely, when the U.S. dollar strengthens against other currencies in which we transact business, sales and net income will in general be negatively but not proportionately impacted.
Foreign Currency Risk—Value-at-Risk Disclosure. We utilize a Value-at-Risk model to determine the potential earning/fair value exposures presented by our foreign currency related financial instruments. As discussed above, we seek to minimize this exposure through our hedging program. Our Value-at-Risk computation is based on the Monte Carlo simulation, utilizing a 95% confidence interval and a holding period of 30 days. As of January 1, 2017, this computation estimated that there is a 5% chance that the market value of the underlying exposures and the corresponding derivative instruments either increase or decrease due to foreign currency fluctuations by more than $0.3 million. This Value-At-Risk measure is consistent with our financial statement disclosures relative to our foreign currency hedging program. Specifically, during each of the four quarters ended in fiscal year 2016, the Value-At-Risk ranged between $0.1 million and $0.6 million, with an average of approximately $0.3 million.
Interest Rate Risk. As of January 1, 2017, we had no outstanding borrowings under our senior unsecured revolving credit facility; however, as described above in “Item 7. Management’s Discussion and Analysis of Financial Condition and Results of Operations-Liquidity and Capital Resources,” amounts drawn under our senior unsecured revolving credit facility would bear interest at variable rates. Our cash and cash equivalents, for which we receive interest at variable rates, were $359.3 million at January 1, 2017. Fluctuations in interest rates can therefore have a direct impact on both our short-term cash flows, as they relate to interest, and our earnings. To manage the volatility relating to these exposures, we periodically enter into various derivative transactions pursuant to our policies to hedge against known or forecasted interest rate exposures.
Interest Rate Risk—Sensitivity. Our current earnings exposure for changes in interest rates can be summarized as follows:
(i) Changes in interest rates can cause our cash flows to fluctuate. An increase of 10%, or approximately 17 basis points, in current interest rates would cause our cash outflows to increase by $0.1 million for fiscal year 2017.
(ii) Changes in interest rates can cause our interest income and cash flows to fluctuate.
Item 8. Financial Statements and Supplemental Data
TABLE OF CONTENTS
REPORT OF INDEPENDENT REGISTERED PUBLIC ACCOUNTING FIRM
To the Board of Directors and Stockholders of PerkinElmer, Inc.
Waltham, Massachusetts
We have audited the accompanying consolidated balance sheets of PerkinElmer, Inc. and subsidiaries (the “Company”) as of January 1, 2017 and January 3, 2016, and the related consolidated statements of operations, comprehensive income, stockholders’ equity, and cash flows for each of the three years in the period ended January 1, 2017. Our audits also included the financial statement schedule listed in the Index at Item 15. These financial statements and financial statement schedule are the responsibility of the Company’s management. Our responsibility is to express an opinion on these financial statements and the financial statement schedule based on our audits.
We conducted our audits in accordance with the standards of the Public Company Accounting Oversight Board (United States). Those standards require that we plan and perform the audit to obtain reasonable assurance about whether the financial statements are free of material misstatement. An audit includes examining, on a test basis, evidence supporting the amounts and disclosures in the financial statements. An audit also includes assessing the accounting principles used and significant estimates made by management, as well as evaluating the overall financial statement presentation. We believe that our audits provide a reasonable basis for our opinion.
In our opinion, such consolidated financial statements present fairly, in all material respects, the financial position of PerkinElmer, Inc. and subsidiaries as of January 1, 2017 and January 3, 2016, and the results of their operations and their cash flows for each of the three years in the period ended January 1, 2017, in conformity with accounting principles generally accepted in the United States of America. Also, in our opinion, such financial statement schedule, when considered in relation to the basic consolidated financial statements taken as a whole, presents fairly, in all material respects, the information set forth therein.
We have also audited, in accordance with the standards of the Public Company Accounting Oversight Board (United States), the Company’s internal control over financial reporting as of January 1, 2017, based on the criteria established in Internal Control—Integrated Framework (2013) issued by the Committee of Sponsoring Organizations of the Treadway Commission and our report dated February 28, 2017 expressed an unqualified opinion on the Company’s internal control over financial reporting.
/s / DELOITTE & TOUCHE LLP
Boston, Massachusetts
February 28, 2017
CONSOLIDATED STATEMENTS OF OPERATIONS
For the Fiscal Years Ended
| January 1, 2017 | January 3, 2016 | December 28, 2014 | |||||||||
| (In thousands, except per share data) | |||||||||||
| Revenue | |||||||||||
| Product revenue | $ | 1,396,896 | $ | 1,395,102 | $ | 1,372,736 | |||||
| Service revenue | 718,621 | 709,721 | 697,144 | ||||||||
| Total revenue | 2,115,517 | 2,104,823 | 2,069,880 | ||||||||
| Cost of product revenue | 664,803 | 696,461 | 708,016 | ||||||||
| Cost of service revenue | 437,361 | 444,131 | 427,266 | ||||||||
| Selling, general and administrative expenses | 600,885 | 587,219 | 648,209 | ||||||||
| Research and development expenses | 124,278 | 112,539 | 108,057 | ||||||||
| Restructuring and contract termination charges, net | 5,124 | 13,547 | 13,325 | ||||||||
| Operating income from continuing operations | 283,066 | 250,926 | 165,007 | ||||||||
| Interest and other expense, net | 38,998 | 42,119 | 41,139 | ||||||||
| Income from continuing operations before income taxes | 244,068 | 208,807 | 123,868 | ||||||||
| Provision for (benefit from) income taxes | 28,362 | 20,022 | (6,271 | ) | |||||||
| Income from continuing operations | 215,706 | 188,785 | 130,139 | ||||||||
| Income from discontinued operations before income taxes | 22,229 | 35,205 | 40,776 | ||||||||
| Gain (loss) on disposition of discontinued operations before income taxes | 619 | (28 | ) | (260 | ) | ||||||
| Provision for income taxes on discontinued operations and dispositions | 4,255 | 11,537 | 12,877 | ||||||||
| Income from discontinued operations and dispositions | 18,593 | 23,640 | 27,639 | ||||||||
| Net income | $ | 234,299 | $ | 212,425 | $ | 157,778 | |||||
| Basic earnings per share: | |||||||||||
| Income from continuing operations | $ | 1.97 | $ | 1.68 | $ | 1.16 | |||||
| Income from discontinued operations and dispositions | 0.17 | 0.21 | 0.25 | ||||||||
| Net income | $ | 2.14 | $ | 1.89 | $ | 1.40 | |||||
| Diluted earnings per share: | |||||||||||
| Income from continuing operations | $ | 1.96 | $ | 1.67 | $ | 1.14 | |||||
| Income from discontinued operations and dispositions | 0.17 | 0.21 | 0.24 | ||||||||
| Net income | $ | 2.12 | $ | 1.87 | $ | 1.39 |
The accompanying notes are an integral part of these consolidated financial statements.
CONSOLIDATED STATEMENTS OF COMPREHENSIVE INCOME
For the Fiscal Years Ended
| January 1, 2017 | January 3, 2016 | December 28, 2014 | |||||||||
| (In thousands) | |||||||||||
| Net income | $ | 234,299 | $ | 212,425 | $ | 157,778 | |||||
| Other comprehensive loss | |||||||||||
| Foreign currency translation adjustments | (54,077 | ) | (70,178 | ) | (52,951 | ) | |||||
| Unrecognized prior service costs, net of tax | (860 | ) | (316 | ) | 146 | ||||||
| Unrealized gains (losses) on securities, net of tax | 32 | (262 | ) | 14 | |||||||
| Other comprehensive loss | (54,905 | ) | (70,756 | ) | (52,791 | ) | |||||
| Comprehensive income | $ | 179,394 | $ | 141,669 | $ | 104,987 |
The accompanying notes are an integral part of these consolidated financial statements.
CONSOLIDATED BALANCE SHEETS
As of the Fiscal Years Ended
| | | | | | | | | | --- | --- | --- | --- | --- | ---
Showing the first 8K of 242K characters. Open the full section
Item 9. Changes in and Disagreements with Accountants on Accounting and Financial Disclosure
Not applicable.
Item 9A. Controls and Procedures
Conclusion Regarding the Effectiveness of Disclosure Controls and Procedures
Our management, with the participation of our Chief Executive Officer and Chief Financial Officer, evaluated the effectiveness of our disclosure controls and procedures as of January 1, 2017. The term “disclosure controls and procedures” as defined in Rules 13a-15(e) and 15d-15(e) under the Securities Exchange Act of 1934, as amended (the “Exchange Act”), means controls and other procedures of a company that are designed to provide reasonable assurance that information required to be disclosed by the company in the reports that it files or submits under the Exchange Act is recorded, processed, summarized and reported, within the time periods specified in the Securities and Exchange Commission’s rules and forms. Disclosure controls and procedures include, without limitation, controls and procedures designed to ensure that information required to be disclosed by a company in the reports that it files or submits under the Exchange Act is accumulated and communicated to the company’s management, including its principal executive and principal financial officers, as appropriate to allow timely decisions regarding required disclosure. Management recognizes that any controls and procedures, no matter how well designed and operated, can provide only reasonable assurance of achieving their objectives, and management necessarily applies its judgment in evaluating the cost-benefit relationship of possible controls and procedures. Based on the evaluation of our disclosure controls and procedures as of January 1, 2017, our Chief Executive Officer and Chief Financial Officer concluded that, as of such date, our disclosure controls and procedures were effective at the reasonable assurance level.
Management’s Report on Internal Control Over Financial Reporting
Our management is responsible for establishing and maintaining adequate internal control over financial reporting. Internal control over financial reporting is defined in Rule 13a-15(f) or 15d-15(f) promulgated under the Exchange Act as a process designed by, or under the supervision of, the company’s principal executive and principal financial officers and effected by the company’s board of directors, management and other personnel, to provide reasonable assurance regarding the reliability of financial reporting and the preparation of financial statements for external purposes in accordance with generally accepted accounting principles, and includes those policies and procedures that:
| • | Pertain to the maintenance of records that in reasonable detail accurately and fairly reflect the transactions and dispositions of the assets of the company; |
| • | Provide reasonable assurance that transactions are recorded as necessary to permit preparation of financial statements in accordance with generally accepted accounting principles, and that receipts and expenditures of the company are being made only in accordance with authorizations of management and directors of the company; and |
| • | Provide reasonable assurance regarding prevention or timely detection of unauthorized acquisition, use or disposition of the company’s assets that could have a material effect on the financial statements. |
Because of its inherent limitations, internal control over financial reporting may not prevent or detect misstatements. Projections of any evaluation of effectiveness to future periods are subject to the risk that controls may become inadequate because of changes in conditions, or that the degree of compliance with the policies or procedures may deteriorate.
Our management assessed the effectiveness of our internal control over financial reporting as of January 1, 2017. In making this assessment, our management used the criteria set forth by the Committee of Sponsoring Organizations of the Treadway Commission (“COSO”) in the 2013 Internal Control-Integrated Framework.
Based on this assessment, our management concluded that, as of January 1, 2017, our internal control over financial reporting was effective based on those criteria.
Our registered public accounting firm has issued an attestation report on our internal control over financial reporting. This report appears below.
REPORT OF INDEPENDENT REGISTERED PUBLIC ACCOUNTING FIRM
To the Board of Directors and Stockholders of PerkinElmer, Inc.
Waltham, Massachusetts
We have audited the internal control over financial reporting of PerkinElmer, Inc. and subsidiaries (the “Company”) as of January 1, 2017, based on criteria established in Internal Control—Integrated Framework (2013) issued by the Committee of Sponsoring Organizations of the Treadway Commission. The Company’s management is responsible for maintaining effective internal control over financial reporting and for its assessment of the effectiveness of internal control over financial reporting, included in the accompanying Management’s Report on Internal Control Over Financial Reporting. Our responsibility is to express an opinion on the Company’s internal control over financial reporting based on our audit.
We conducted our audit in accordance with the standards of the Public Company Accounting Oversight Board (United States). Those standards require that we plan and perform the audit to obtain reasonable assurance about whether effective internal control over financial reporting was maintained in all material respects. Our audit included obtaining an understanding of internal control over financial reporting, assessing the risk that a material weakness exists, testing and evaluating the design and operating effectiveness of internal control based on the assessed risk, and performing such other procedures as we considered necessary in the circumstances. We believe that our audit provides a reasonable basis for our opinion.
A company’s internal control over financial reporting is a process designed by, or under the supervision of, the company’s principal executive and principal financial officers, or persons performing similar functions, and effected by the company’s board of directors, management, and other personnel to provide reasonable assurance regarding the reliability of financial reporting and the preparation of financial statements for external purposes in accordance with generally accepted accounting principles. A company’s internal control over financial reporting includes those policies and procedures that (1) pertain to the maintenance of records that, in reasonable detail, accurately and fairly reflect the transactions and dispositions of the assets of the company; (2) provide reasonable assurance that transactions are recorded as necessary to permit preparation of financial statements in accordance with generally accepted accounting principles, and that receipts and expenditures of the company are being made only in accordance with authorizations of management and directors of the company; and (3) provide reasonable assurance regarding prevention or timely detection of unauthorized acquisition, use, or disposition of the company’s assets that could have a material effect on the financial statements.
Because of the inherent limitations of internal control over financial reporting, including the possibility of collusion or improper management override of controls, material misstatements due to error or fraud may not be prevented or detected on a timely basis. Also, projections of any evaluation of the effectiveness of the internal control over financial reporting to future periods are subject to the risk that the controls may become inadequate because of changes in conditions, or that the degree of compliance with the policies or procedures may deteriorate.
In our opinion, the Company maintained, in all material respects, effective internal control over financial reporting as of January 1, 2017, based on the criteria established in Internal Control—Integrated Framework (2013) issued by the Committee of Sponsoring Organizations of the Treadway Commission.
We have also audited, in accordance with the standards of the Public Company Accounting Oversight Board (United States), the consolidated financial statements and financial statement schedule as of and for the year ended January 1, 2017 of the Company and our report dated February 28, 2017 expressed an unqualified opinion on those financial statements and financial statement schedule.
/s/ DELOITTE & TOUCHE LLP
Boston, Massachusetts
February 28, 2017
Changes in Internal Control Over Financial Reporting
No change in our internal control over financial reporting (as defined in Rules 13a-15(f) and 15d-15(f) under the Exchange Act) occurred during the fiscal quarter ended January 1, 2017 that has materially affected, or is reasonably likely to materially affect, our internal control over financial reporting.
Item 9B. Other Information
Not applicable.
PART III
Item 10. Directors, Executive Officers and Corporate Governance
The information required to be disclosed by this Item pursuant to Item 401 of Regulation S-K with respect to our executive officers is contained in Part I of this annual report on Form 10-K under the caption, “Executive Officers of the Registrant.” The remaining information required to be disclosed by the Item pursuant to Item 401 and Item 407 of Regulation S-K is contained in the proxy statement for our annual meeting of stockholders to be held on April 25, 2017 under the captions “Proposal No. 1 Election of Directors” and “Information Relating to Our Board of Directors and Its Committees” and is incorporated in this annual report on Form 10-K by reference.
The information required to be disclosed by this Item pursuant to Item 405 of Regulation S-K is contained in the proxy statement for our annual meeting of stockholders to be held on April 25, 2017 under the caption “Section 16(a) Beneficial Ownership Reporting Compliance,” and is incorporated in this annual report on Form 10-K by reference.
We have adopted a code of ethics, our Standards of Business Conduct, that applies to our principal executive officer, principal financial officer, principal accounting officer or controller, and persons performing similar functions. Our Standards of Business Conduct, as well as our corporate governance guidelines and the charters for the audit, compensation and benefits, nominating and corporate governance, executive and finance committees of our Board of Directors, are each accessible under the “Corporate Governance” heading of the “Investors” section of our website, http://www.perkinelmer.com. This information is also available in print to any stockholder who requests it, by writing to PerkinElmer, Inc., 940 Winter Street, Waltham, Massachusetts 02451, Attention: Investor Relations. We also intend to disclose in the same location on our website, any amendments to, or waivers from, our Standards of Business Conduct that are required to be disclosed pursuant to the disclosure requirements of Item 5.05 of Form 8-K.
Item 11. Executive Compensation
The information required to be disclosed by this Item pursuant to Item 402 and Item 407(e) of Regulation S-K is contained in the proxy statement for our annual meeting of stockholders to be held on April 25, 2017 under the captions “Information Relating to Our Board of Directors and Its Committees—Director Compensation,” “Information Relating to Our Board of Directors and Its Committees—Compensation Committee Interlocks and Insider Participation,” and “Executive Compensation,” and is incorporated in this annual report on Form 10-K by reference.
Item 12. Security Ownership of Certain Beneficial Owners and Management and Related Stockholder Matters
The information required to be disclosed by this Item pursuant to Item 403 of Regulation S-K is contained in the proxy statement for our annual meeting of stockholders to be held on April 25, 2017 under the caption “Beneficial Ownership of Common Stock,” and is incorporated in this annual report on Form 10-K by reference.
The information required to be disclosed by this Item pursuant to Item 201(d) of Regulation S-K is contained in the proxy statement for our annual meeting of stockholders to be held on April 25, 2017 under the caption “Executive Compensation—Equity Compensation Plan Information,” and is incorporated in this annual report on Form 10-K by reference.
Item 13. Certain Relationships and Related Transactions, and Director Independence
The information required to be disclosed by this Item pursuant to Item 404 of Regulation S-K is contained in the proxy statement for our annual meeting of stockholders to be held on April 25, 2017 under the caption “Information Relating to Our Board of Directors and Its Committees—Certain Relationships and Policies on Related Party Transactions,” and is incorporated in this annual report on Form 10-K by reference.
The information required to be disclosed by this Item pursuant to Item 407(a) of Regulation S-K is contained in the proxy statement for our annual meeting of stockholders to be held on April 25, 2017 under the caption “Information Relating to Our Board of Directors and Its Committees—Determination of Independence,” and is incorporated in this annual report on Form 10-K by reference.
Item 14. Principal Accountant Fees and Services
The information required to be disclosed by this Item pursuant to Item 9(e) of Schedule 14A is contained in the proxy statement for our annual meeting of stockholders to be held on April 25, 2017 under the caption “Information Relating to Our Board of Directors and Its Committees—Independent Registered Public Accounting Firm Fees and Other Matters”, and is incorporated in this annual report on Form 10-K by reference.
PART IV
Item 15. Exhibits and Financial Statement Schedules
(a) DOCUMENTS FILED AS PART OF THIS REPORT:
- FINANCIAL STATEMENTS
Included in Part II, Item 8:
Report of Independent Registered Public Accounting Firm
Consolidated Statements of Operations for Each of the Three Fiscal Years in the Period Ended January 1, 2017
Consolidated Statements of Comprehensive Income for Each of the Three Fiscal Years in the Period Ended January 1, 2017
Consolidated Balance Sheets as of January 1, 2017 and January 3, 2016
Consolidated Statements of Stockholders’ Equity for Each of the Three Fiscal Years in the Period Ended January 1, 2017
Consolidated Statements of Cash Flows for Each of the Three Fiscal Years in the Period Ended January 1, 2017
Notes to Consolidated Financial Statements
- FINANCIAL STATEMENT SCHEDULE
Schedule II—Valuation and Qualifying Accounts
We have omitted financial statement schedules, other than those we note above, because of the absence of conditions under which they are required, or because the required information is given in the financial statements or notes thereto.
- EXHIBITS
| Exhibit No. | Exhibit Title | ||||
| 2.1(1) | Share Purchase Agreement, dated November 21, 2014, by and among Valedo Partners Fund I AB, the Other Sellers party thereto and PerkinElmer Holding Luxembourg S.à.r.l., filed with the Commission on November 28, 2014 as Exhibit 2.1 to our current report on Form 8-K and herein incorporated by reference. | ||||
| 2.2(1) | Master Purchase and Sale Agreement, dated as of December 21, 2016, by and between PerkinElmer, Inc. and Varian Medical Systems, Inc., filed with the Commission on December 22, 2016 as Exhibit 2.1 to our current report on Form 8-K and herein incorporated by reference. | ||||
| 3.1 | PerkinElmer, Inc.'s Restated Articles of Organization, filed with the Commission on May 11, 2007 as Exhibit 3.1 to our quarterly report on Form 10-Q and herein incorporated by reference. | ||||
| 3.2 | PerkinElmer, Inc.'s Amended and Restated By-laws, filed with the Commission on July 27, 2016 as Exhibit 3.2 to our current report on Form 8-K and herein incorporated by reference. | ||||
| 4.1 | Specimen Certificate of PerkinElmer, Inc.'s Common Stock, $1 par value, filed with the Commission on August 15, 2001 as Exhibit 4.1 to our quarterly report on Form 10-Q and herein incorporated by reference. | ||||
| 4.2 | Indenture dated as of October 25, 2011 between PerkinElmer, Inc. and U.S. Bank National Association, filed with the Commission on October 27, 2011 as Exhibit 99.1 to our current report on Form 8-K and herein incorporated by reference. | ||||
| 4.3 | Supplemental Indenture dated as of October 25, 2011 between PerkinElmer, Inc. and U.S. Bank National Association, filed with the Commission on October 27, 2011 as Exhibit 99.2 to our current report on Form 8-K and herein incorporated by reference. | ||||
| 4.4 | Second Supplemental Indenture dated as of December 22, 2011 between PerkinElmer, Inc. and U.S. Bank National Association, filed with the Commission on February 28, 2012 as Exhibit 4.4 to our annual report on Form 10-K and herein incorporated by reference. | ||||
| Exhibit No. | Exhibit Title | ||||
| 4.5 | Third Supplemental Indenture, dated as of July 19, 2016, among PerkinElmer, Inc., U.S. Bank National Association, as trustee, and Elavon Financial Services DAC, UK Branch, as paying agent, filed with the Commission on July 19, 2016 as Exhibit 4.2 to our current report on Form 8-K and herein incorporated by reference. | ||||
| 4.6 | Paying Agency Agreement, dated July 19, 2016, between the Company, U.S. Bank National Association, as trustee, Elavon Financial Services DAC, UK Branch, as paying agent, and Elavon Financial Services DAC, as transfer agent and registrar, filed with the Commission on July 19, 2016 as Exhibit 4.3 to our current report on Form 8-K and herein incorporated by reference. | ||||
| 10.1 | Credit Agreement, dated as of August 11, 2016, among PerkinElmer, Inc., Wallac Oy, and PerkinElmer Health Sciences, Inc. as Borrowers, JPMorgan Chase Bank, N.A., as Administrative Agent, Bank of America, N.A. and Barclays Bank PLC as Co-Syndication Agents, Citibank, N.A., Mizuho Bank, Ltd., TD Bank, N.A., U.S. Bank National Association and Wells Fargo Bank, National Association as Co-Documentation Agents, and J.P. Morgan Chase Bank, N.A., Merrill Lynch, Pierce, Fenner & Smith Incorporated and Barclays Bank PLC as Joint Bookrunners and Joint Lead Arrangers, and the other Lenders party thereto, filed with the Commission on August 12, 2016 as Exhibit 10.1 to our current report on Form 8-K and herein incorporated by reference. | ||||
| 10.2* | Employment Contracts: | ||||
| (1) Third Amended and Restated Employment Agreement between PerkinElmer, Inc. and Robert F. Friel, dated as of December 16, 2008, filed with the Commission on February 26, 2009 as Exhibit 10.4(2) to our annual report on Form 10-K and herein incorporated by reference; | |||||
| (2) Employment Agreement by and between Joel S. Goldberg and PerkinElmer, Inc. dated as of July 21, 2008, filed with the Commission on August 8, 2008 as Exhibit 10.1 to our quarterly report on Form 10-Q and herein incorporated by reference; | |||||
| (3) Employment Agreement by and between Frank A. Wilson and PerkinElmer, Inc. dated as of April 28, 2009, filed with the Commission on April 30, 2009 as Exhibit 10.1 to our current report on Form 8-K and herein incorporated by reference; | |||||
| (4) Form of Amendment, entered into by and between PerkinElmer, Inc. and each of the following executive officers on the dates indicated below, filed with the Commission on March 1, 2011 as Exhibit 10.4(7) to our annual report on Form 10-K and herein incorporated by reference: | |||||
| Executive Officer | Date | ||||
| Joel S. Goldberg Frank A. Wilson | December 3, 2010 December 21, 2010 | ||||
| (5) Employment Agreement between James Corbett and PerkinElmer, Inc. dated as of February 1, 2012, filed with the Commission on May 8, 2012 as Exhibit 10.1 to our quarterly report on Form 10-Q and herein incorporated by reference. | |||||
| (6) Employment Agreement between Jonathan DiVincenzo and PerkinElmer, Inc. dated as of December 2, 2013, filed with the Commission on February 25, 2014 as Exhibit 10.2(9) to our annual report on Form 10-K and herein incorporated by reference. | |||||
| (7) Amended and Restated Employment Agreement between Andrew Okun and PerkinElmer, Inc. dated as of January 1, 2014, filed with the Commission on February 25, 2014 as Exhibit 10.2(10) to our annual report on Form 10-K and herein incorporated by reference. | |||||
| (8) Employment Agreement between Daniel R. Tereau and PerkinElmer, Inc. dated as of February 1, 2016, filed with the Commission on March 1, 2016 as Exhibit 10.2(8) to our annual report on Form 10-K and herein incorporated by reference. | |||||
| (9) Employment Agreement between Deborah A. Butters and PerkinElmer, Inc. dated as of July 11, 2016, filed with the Commission on November 8, 2016 as Exhibit 10.2(9) to our quarterly report on Form 10-Q and herein incorporated by reference. | |||||
| (10) Employment Agreement between Prahlad Singh and PerkinElmer, Inc. dated as of October 3, 2016, attached hereto as Exhibit 10.2(10). | |||||
| 10.3* | PerkinElmer, Inc.'s 2009 Incentive Plan, filed with the Commission on March 12, 2014 as Appendix A to our definitive proxy statement on Schedule 14A and herein incorporated by reference. | ||||
| Exhibit No. | Exhibit Title | ||||
| 10.4* | PerkinElmer, Inc.'s 2008 Deferred Compensation Plan, filed with the Commission on December 12, 2008 as Exhibit 10.1 to our current report on Form 8-K and herein incorporated by reference. | ||||
| 10.5* | First Amendment to PerkinElmer, Inc.'s 2008 Deferred Compensation Plan, filed with the Commission on March 1, 2011 as Exhibit 10.9 to our annual report on Form 10-K and herein incorporated by reference. | ||||
| 10.6* | PerkinElmer, Inc.'s 2008 Supplemental Executive Retirement Plan, filed with the Commission on December 12, 2008 as Exhibit 10.2 to our current report on Form 8-K and herein incorporated by reference. | ||||
| 10.7* | PerkinElmer, Inc.'s Performance Unit Program Description, filed with the Commission on February 6, 2009 as Exhibit 10.10 to our annual report on Form 10-K and herein incorporated by reference. | ||||
| 10.8* | PerkinElmer, Inc. 1998 Employee Stock Purchase Plan as Amended and Restated on December 10, 2009, filed with the Commission on March 1, 2010 as Exhibit 10.15 to our annual report on Form 10-K and herein incorporated by reference. | ||||
| 10.9* | Form of Stock Option Agreement given by PerkinElmer, Inc. to its chief executive officer for use under the 2009 Incentive Plan, filed with the Commission on April 28, 2009 as Exhibit 10.2 to our current report on Form 8-K and herein incorporated by reference. | ||||
| 10.10* | Form of Stock Option Agreement given by PerkinElmer, Inc. to its executive officers for use under the 2009 Incentive Plan, filed with the Commission on April 28, 2009 as Exhibit 10.3 to our current report on Form 8-K and herein incorporated by reference. | ||||
| 10.11* | Form of Stock Option Agreement given by PerkinElmer, Inc. to its non-employee directors for use under the 2009 Incentive Plan, filed with the Commission on April 28, 2009 as Exhibit 10.4 to our current report on Form 8-K and herein incorporated by reference. | ||||
| 10.12* | Form of Restricted Stock Agreement with time-based vesting for use under the 2009 Incentive Plan, filed with the Commission on April 28, 2009 as Exhibit 10.5 to our current report on Form 8-K and herein incorporated by reference. | ||||
| 10.13* | Form of Restricted Stock Agreement with performance-based vesting for use under the 2009 Incentive Plan, filed with the Commission on April 28, 2009 as Exhibit 10.6 to our current report on Form 8-K and herein incorporated by reference. | ||||
| 10.14* | Form of Restricted Stock Unit Agreement with time-based vesting for use under the 2009 Incentive Plan, filed with the Commission on April 28, 2009 as Exhibit 10.7 to our current report on Form 8-K and herein incorporated by reference. | ||||
| 10.15* | Form of Restricted Stock Unit Agreement with performance-based vesting for use under the 2009 Incentive Plan, filed with the Commission on April 28, 2009 as Exhibit 10.8 to our current report on Form 8-K and herein incorporated by reference. | ||||
| 10.16* | Form of Restricted Stock Agreement with time-based vesting for use under the 2009 Incentive Plan, filed with the Commission on May 10, 2011 as Exhibit 10.2 to our quarterly report on Form 10-Q and herein incorporated by reference. | ||||
| 10.17* | Form of Stock Option Agreement for use under the 2009 Incentive Plan, filed with the Commission on May 10, 2011 as Exhibit 10.3 to our quarterly report on Form 10-Q and herein incorporated by reference. | ||||
| 10.18* | Form of Restricted Stock Unit Agreement given by PerkinElmer, Inc. to its non-employee directors for use under the 2009 Incentive Plan, filed with the Commission on February 24, 2015 as Exhibit 10.25 to our annual report on Form 10-K and herein incorporated by reference. | ||||
| 10.19* | Form of 162(m)-compliant Restricted Stock Agreement with single-trigger acceleration for use under the 2009 Incentive Plan, attached hereto as Exhibit 10.19. | ||||
| 10.20* | Form of 162(m)-compliant Restricted Stock Agreement with double-trigger acceleration for use under the 2009 Incentive Plan, attached hereto as Exhibit 10.20. | ||||
| 10.21* | Form of 162(m)-compliant Restricted Stock Unit Agreement with single-trigger acceleration for use under the 2009 Incentive Plan, attached hereto as Exhibit 10.21. | ||||
| 10.22* | Form of 162(m)-compliant Restricted Stock Unit Agreement with double-trigger acceleration for use under the 2009 Incentive Plan, attached hereto as Exhibit 10.22. | ||||
| 10.23* | PerkinElmer, Inc. Savings Plan Amended and Restated effective January 1, 2012, filed with the Commission on February 26, 2013 as Exhibit 10.36 to our annual report on Form 10-K and herein incorporated by reference. | ||||
| Exhibit No. | Exhibit Title | ||||
| 10.24* | PerkinElmer, Inc. Employees Retirement Plan Amended and Restated effective January 1, 2012, filed with the Commission on February 26, 2013 as Exhibit 10.37 to our annual report on Form 10-K and herein incorporated by reference. | ||||
| 10.25* | PerkinElmer, Inc.'s Amended and Restated Performance Incentive Plan (Executive Officers), filed with the Commission on February 25, 2014 as Exhibit 10.37 to our annual report on Form 10-K and herein incorporated by reference. | ||||
| 12.1 | Statement regarding computation of ratio of earnings to fixed charges, attached hereto as Exhibit 12.1. | ||||
| 21 | Subsidiaries of PerkinElmer, Inc., attached hereto as Exhibit 21. | ||||
| 23 | Consent of Independent Registered Public Accounting Firm, attached hereto as Exhibit 23. | ||||
| 31.1 | Certification of Chief Executive Officer pursuant to Rule 13a-14(a) under the Securities Exchange Act of 1934, attached hereto as Exhibit 31.1. | ||||
| 31.2 | Certification of Chief Financial Officer pursuant to Rule 13a-14(a) under the Securities Exchange Act of 1934, attached hereto as Exhibit 31.2. | ||||
| 32.1 | Certification of Chief Executive Officer and Chief Financial Officer pursuant to 18 U.S.C. Section 1350, as adopted pursuant to Section 906 of the Sarbanes-Oxley Act of 2002, attached hereto as Exhibit 32.1. | ||||
| 101.INS | XBRL Instance Document. | ||||
| 101.SCH | XBRL Taxonomy Extension Schema Document. | ||||
| 101.CAL | XBRL Calculation Linkbase Document. | ||||
| 101.DEF | XBRL Definition Linkbase Document. | ||||
| 101.LAB | XBRL Labels Linkbase Document. | ||||
| 101.PRE | XBRL Presentation Linkbase Document. |
| (1) | The exhibits and schedules to this agreement have been omitted from this filing pursuant to Item 601(b)(2) of Regulation S-K. The registrant agrees to furnish copies of any of such exhibits or schedules to the SEC upon request. |
| * | Management contract or compensation plan or arrangement required to be filed as an exhibit pursuant to Item 15(b) of Form 10-K. |
Attached as Exhibit 101 to this report are the following formatted in XBRL (Extensible Business Reporting Language):
(i) Consolidated Statements of Operations for each of the three years in the period ended January 1, 2017, (ii) Consolidated Balance Sheets as of January 1, 2017 and January 3, 2016, (iii) Consolidated Statements of Comprehensive Income for each of the three years in the period ended January 1, 2017, (iv) Consolidated Statements of Stockholders' Equity for each of the three years in the period ended January 1, 2017, (v) Consolidated Statements of Cash Flows for each of the three years in the period ended January 1, 2017, (vi) Notes to Consolidated Financial Statements, and (vii) Financial Schedule of Valuation and Qualifying Accounts.
SCHEDULE II
PERKINELMER, INC. AND SUBSIDIARIES
VALUATION AND QUALIFYING ACCOUNTS
For the Three Years Ended January 1, 2017
| Description | Balance at Beginning of Year | Provisions | Charges/ Write- offs | Other(1) | Balance at End of Year | |||||||||||||||
| (In thousands) | ||||||||||||||||||||
| Reserve for doubtful accounts: | ||||||||||||||||||||
| Year ended December 28, 2014 | $ | 28,143 | $ | 9,447 | $ | (4,125 | ) | $ | (608 | ) | $ | 32,857 | ||||||||
| Year ended January 3, 2016 | 32,857 | 3,564 | (5,709 | ) | (846 | ) | 29,866 | |||||||||||||
| Year ended January 1, 2017 | 29,866 | 5,346 | (5,499 | ) | (501 | ) | 29,212 |
| (1) | Other amounts primarily relate to the impact of acquisitions, discontinued operations and foreign exchange movements. |
SIGNATURES
Pursuant to the requirements of Section 13 or 15(d) of the Securities Exchange Act of 1934, the registrant has duly caused this report to be signed on its behalf by the undersigned, thereunto duly authorized.
| Signature | PERKINELMER, INC. Title | Date | |||
| By: | /S/ ROBERT F. FRIEL | Chairman, Chief Executive Officer | February 28, 2017 | ||
| Robert F. Friel | and President (Principal Executive Officer) | ||||
| By: | /S/ FRANK A. WILSON | Sr. Vice President and | February 28, 2017 | ||
| Frank A. Wilson | Chief Financial Officer (Principal Financial Officer) | ||||
| By: | /S/ ANDREW OKUN | Vice President and | February 28, 2017 | ||
| Andrew Okun | Chief Accounting Officer (Principal Accounting Officer) |
POWER OF ATTORNEY AND SIGNATURES
We, the undersigned officers and directors of PerkinElmer, Inc., hereby severally constitute Robert F. Friel and Frank A. Wilson, and each of them singly, our true and lawful attorneys with full power to them, and each of them singly, to sign for us and in our names, in the capacities indicated below, this Annual Report on Form 10-K and any and all amendments to said Annual Report on Form 10-K, and generally to do all such things in our name and behalf in our capacities as officers and directors to enable PerkinElmer, Inc. to comply with the provisions of the Securities Exchange Act of 1934, and all requirements of the Securities and Exchange Commission, hereby rectifying and confirming signed by our said attorneys, and any and all amendments thereto.
Pursuant to the requirements of the Securities Exchange Act of 1934, this report has been signed below by the following persons on behalf of the registrant and in the capacities and on the dates indicated:
| Signature | Title | Date | |||
| By: | /S/ ROBERT F. FRIEL | Chairman, Chief Executive Officer | February 28, 2017 | ||
| Robert F. Friel | and President (Principal Executive Officer) | ||||
| By: | /S/ FRANK A. WILSON | Sr. Vice President and | February 28, 2017 | ||
| Frank A. Wilson | Chief Financial Officer (Principal Financial Officer) | ||||
| By: | /S/ ANDREW OKUN | Vice President and | February 28, 2017 | ||
| Andrew Okun | Chief Accounting Officer (Principal Accounting Officer) | ||||
| By: | /S/ PETER BARRETT | Director | February 28, 2017 | ||
| Peter Barrett | |||||
| By: | /S/ SAMUEL R. CHAPIN | Director | February 28, 2017 | ||
| Samuel R. Chapin | |||||
| By: | /S/ SYLVIE GRÉGOIRE, PharmD | Director | February 28, 2017 | ||
| Sylvie Grégoire, PharmD | |||||
| By: | /S/ NICHOLAS A. LOPARDO | Director | February 28, 2017 | ||
| Nicholas A. Lopardo | |||||
| By: | /S/ ALEXIS P. MICHAS | Director | February 28, 2017 | ||
| Alexis P. Michas | |||||
| By: | /S/ VICKI L. SATO, PhD | Director | February 28, 2017 | ||
| Vicki L. Sato, PhD | |||||
| By: | /S/ KENTON J. SICCHITANO | Director | February 28, 2017 | ||
| Kenton J. Sicchitano | |||||
| By: | /S/ PATRICK J. SULLIVAN | Director | February 28, 2017 | ||
| Patrick J. Sullivan | |||||
| By: | /S/ FRANK WITNEY, PhD | Director | February 28, 2017 | ||
| Frank Witney, PhD |
EXHIBIT INDEX
| Exhibit No. | Exhibit Title | ||||
| 2.1(1) | Share Purchase Agreement, dated November 21, 2014, by and among Valedo Partners Fund I AB, the Other Sellers party thereto and PerkinElmer Holding Luxembourg S.à.r.l., filed with the Commission on November 28, 2014 as Exhibit 2.1 to our current report on Form 8-K and herein incorporated by reference. | ||||
| 2.2(1) | Master Purchase and Sale Agreement, dated as of December 21, 2016, by and between PerkinElmer, Inc. and Varian Medical Systems, Inc., filed with the Commission on December 22, 2016 as Exhibit 2.1 to our current report on Form 8-K and herein incorporated by reference. | ||||
| 3.1 | PerkinElmer, Inc.'s Restated Articles of Organization, filed with the Commission on May 11, 2007 as Exhibit 3.1 to our quarterly report on Form 10-Q and herein incorporated by reference. | ||||
| 3.2 | PerkinElmer, Inc.'s Amended and Restated By-laws, filed with the Commission on July 27, 2016 as Exhibit 3.2 to our current report on Form 8-K and herein incorporated by reference. | ||||
| 4.1 | Specimen Certificate of PerkinElmer, Inc.'s Common Stock, $1 par value, filed with the Commission on August 15, 2001 as Exhibit 4.1 to our quarterly report on Form 10-Q and herein incorporated by reference. | ||||
| 4.2 | Indenture dated as of October 25, 2011 between PerkinElmer, Inc. and U.S. Bank National Association, filed with the Commission on October 27, 2011 as Exhibit 99.1 to our current report on Form 8-K and herein incorporated by reference. | ||||
| 4.3 | Supplemental Indenture dated as of October 25, 2011 between PerkinElmer, Inc. and U.S. Bank National Association, filed with the Commission on October 27, 2011 as Exhibit 99.2 to our current report on Form 8-K and herein incorporated by reference. | ||||
| 4.4 | Second Supplemental Indenture dated as of December 22, 2011 between PerkinElmer, Inc. and U.S. Bank National Association, filed with the Commission on February 28, 2012 as Exhibit 4.4 to our annual report on Form 10-K and herein incorporated by reference. | ||||
| 4.5 | Third Supplemental Indenture, dated as of July 19, 2016, among PerkinElmer, Inc., U.S. Bank National Association, as trustee, and Elavon Financial Services DAC, UK Branch, as paying agent, filed with the Commission on July 19, 2016 as Exhibit 4.2 to our current report on Form 8-K and herein incorporated by reference. | ||||
| 4.6 | Paying Agency Agreement, dated July 19, 2016, between the Company, U.S. Bank National Association, as trustee, Elavon Financial Services DAC, UK Branch, as paying agent, and Elavon Financial Services DAC, as transfer agent and registrar, filed with the Commission on July 19, 2016 as Exhibit 4.3 to our current report on Form 8-K and herein incorporated by reference. | ||||
| 10.1 | Credit Agreement, dated as of August 11, 2016, among PerkinElmer, Inc., Wallac Oy, and PerkinElmer Health Sciences, Inc. as Borrowers, JPMorgan Chase Bank, N.A., as Administrative Agent, Bank of America, N.A. and Barclays Bank PLC as Co-Syndication Agents, Citibank, N.A., Mizuho Bank, Ltd., TD Bank, N.A., U.S. Bank National Association and Wells Fargo Bank, National Association as Co-Documentation Agents, and J.P. Morgan Chase Bank, N.A., Merrill Lynch, Pierce, Fenner & Smith Incorporated and Barclays Bank PLC as Joint Bookrunners and Joint Lead Arrangers, and the other Lenders party thereto, filed with the Commission on August 12, 2016 as Exhibit 10.1 to our current report on Form 8-K and herein incorporated by reference. | ||||
| 10.2* | Employment Contracts: | ||||
| (1) Third Amended and Restated Employment Agreement between PerkinElmer, Inc. and Robert F. Friel, dated as of December 16, 2008, filed with the Commission on February 26, 2009 as Exhibit 10.4(2) to our annual report on Form 10-K and herein incorporated by reference; | |||||
| (2) Employment Agreement by and between Joel S. Goldberg and PerkinElmer, Inc. dated as of July 21, 2008, filed with the Commission on August 8, 2008 as Exhibit 10.1 to our quarterly report on Form 10-Q and herein incorporated by reference; | |||||
| (3) Employment Agreement by and between Frank A. Wilson and PerkinElmer, Inc. dated as of April 28, 2009, filed with the Commission on April 30, 2009 as Exhibit 10.1 to our current report on Form 8-K and herein incorporated by reference; | |||||
| (4) Form of Amendment, entered into by and between PerkinElmer, Inc. and each of the following executive officers on the dates indicated below, filed with the Commission on March 1, 2011 as Exhibit 10.4(7) to our annual report on Form 10-K and herein incorporated by reference: | |||||
| Executive Officer | Date |
| Exhibit No. | Exhibit Title | ||||
| Joel S. Goldberg Frank A. Wilson | December 3, 2010 December 21, 2010 | ||||
| (5) Employment Agreement between James Corbett and PerkinElmer, Inc. dated as of February 1, 2012, filed with the Commission on May 8, 2012 as Exhibit 10.1 to our quarterly report on Form 10-Q and herein incorporated by reference. | |||||
| (6) Employment Agreement between Jonathan DiVincenzo and PerkinElmer, Inc. dated as of December 2, 2013, filed with the Commission on February 25, 2014 as Exhibit 10.2(9) to our annual report on Form 10-K and herein incorporated by reference. | |||||
| (7) Amended and Restated Employment Agreement between Andrew Okun and PerkinElmer, Inc. dated as of January 1, 2014, filed with the Commission on February 25, 2014 as Exhibit 10.2(10) to our annual report on Form 10-K and herein incorporated by reference. | |||||
| (8) Employment Agreement between Daniel R. Tereau and PerkinElmer, Inc. dated as of February 1, 2016, filed with the Commission on March 1, 2016 as Exhibit 10.2(8) to our annual report on Form 10-K and herein incorporated by reference. | |||||
| (9) Employment Agreement between Deborah A. Butters and PerkinElmer, Inc. dated as of July 11, 2016, filed with the Commission on November 8, 2016 as Exhibit 10.2(9) to our quarterly report on Form 10-Q and herein incorporated by reference. | |||||
| (10) Employment Agreement between Prahlad Singh and PerkinElmer, Inc. dated as of October 3, 2016, attached hereto as Exhibit 10.2(10). | |||||
| 10.3* | PerkinElmer, Inc.'s 2009 Incentive Plan, filed with the Commission on March 12, 2014 as Appendix A to our definitive proxy statement on Schedule 14A and herein incorporated by reference. | ||||
| 10.4* | PerkinElmer, Inc.'s 2008 Deferred Compensation Plan, filed with the Commission on December 12, 2008 as Exhibit 10.1 to our current report on Form 8-K and herein incorporated by reference. | ||||
| 10.5* | First Amendment to PerkinElmer, Inc.'s 2008 Deferred Compensation Plan, filed with the Commission on March 1, 2011 as Exhibit 10.9 to our annual report on Form 10-K and herein incorporated by reference. | ||||
| 10.6* | PerkinElmer, Inc.'s 2008 Supplemental Executive Retirement Plan, filed with the Commission on December 12, 2008 as Exhibit 10.2 to our current report on Form 8-K and herein incorporated by reference. | ||||
| 10.7* | PerkinElmer, Inc.'s Performance Unit Program Description, filed with the Commission on February 6, 2009 as Exhibit 10.10 to our annual report on Form 10-K and herein incorporated by reference. | ||||
| 10.8* | PerkinElmer, Inc. 1998 Employee Stock Purchase Plan as Amended and Restated on December 10, 2009, filed with the Commission on March 1, 2010 as Exhibit 10.15 to our annual report on Form 10-K and herein incorporated by reference. | ||||
| 10.9* | Form of Stock Option Agreement given by PerkinElmer, Inc. to its chief executive officer for use under the 2009 Incentive Plan, filed with the Commission on April 28, 2009 as Exhibit 10.2 to our current report on Form 8-K and herein incorporated by reference. | ||||
| 10.10* | Form of Stock Option Agreement given by PerkinElmer, Inc. to its executive officers for use under the 2009 Incentive Plan, filed with the Commission on April 28, 2009 as Exhibit 10.3 to our current report on Form 8-K and herein incorporated by reference. | ||||
| 10.11* | Form of Stock Option Agreement given by PerkinElmer, Inc. to its non-employee directors for use under the 2009 Incentive Plan, filed with the Commission on April 28, 2009 as Exhibit 10.4 to our current report on Form 8-K and herein incorporated by reference. | ||||
| 10.12* | Form of Restricted Stock Agreement with time-based vesting for use under the 2009 Incentive Plan, filed with the Commission on April 28, 2009 as Exhibit 10.5 to our current report on Form 8-K and herein incorporated by reference. | ||||
| 10.13* | Form of Restricted Stock Agreement with performance-based vesting for use under the 2009 Incentive Plan, filed with the Commission on April 28, 2009 as Exhibit 10.6 to our current report on Form 8-K and herein incorporated by reference. | ||||
| 10.14* | Form of Restricted Stock Unit Agreement with time-based vesting for use under the 2009 Incentive Plan, filed with the Commission on April 28, 2009 as Exhibit 10.7 to our current report on Form 8-K and herein incorporated by reference. | ||||
| Exhibit No. | Exhibit Title | ||||
| 10.15* | Form of Restricted Stock Unit Agreement with performance-based vesting for use under the 2009 Incentive Plan, filed with the Commission on April 28, 2009 as Exhibit 10.8 to our current report on Form 8-K and herein incorporated by reference. | ||||
| 10.16* | Form of Restricted Stock Agreement with time-based vesting for use under the 2009 Incentive Plan, filed with the Commission on May 10, 2011 as Exhibit 10.2 to our quarterly report on Form 10-Q and herein incorporated by reference. | ||||
| 10.17* | Form of Stock Option Agreement for use under the 2009 Incentive Plan, filed with the Commission on May 10, 2011 as Exhibit 10.3 to our quarterly report on Form 10-Q and herein incorporated by reference. | ||||
| 10.18* | Form of Restricted Stock Unit Agreement given by PerkinElmer, Inc. to its non-employee directors for use under the 2009 Incentive Plan, filed with the Commission on February 24, 2015 as Exhibit 10.25 to our annual report on Form 10-K and herein incorporated by reference. | ||||
| 10.19* | Form of 162(m)-compliant Restricted Stock Agreement with single-trigger acceleration for use under the 2009 Incentive Plan, attached hereto as Exhibit 10.19. | ||||
| 10.20* | Form of 162(m)-compliant Restricted Stock Agreement with double-trigger acceleration for use under the 2009 Incentive Plan, attached hereto as Exhibit 10.20. | ||||
| 10.21* | Form of 162(m)-compliant Restricted Stock Unit Agreement with single-trigger acceleration for use under the 2009 Incentive Plan, attached hereto as Exhibit 10.21. | ||||
| 10.22* | Form of 162(m)-compliant Restricted Stock Unit Agreement with double-trigger acceleration for use under the 2009 Incentive Plan, attached hereto as Exhibit 10.22. | ||||
| 10.23* | PerkinElmer, Inc. Savings Plan Amended and Restated effective January 1, 2012, filed with the Commission on February 26, 2013 as Exhibit 10.36 to our annual report on Form 10-K and herein incorporated by reference. | ||||
| 10.24* | PerkinElmer, Inc. Employees Retirement Plan Amended and Restated effective January 1, 2012, filed with the Commission on February 26, 2013 as Exhibit 10.37 to our annual report on Form 10-K and herein incorporated by reference. | ||||
| 10.25* | PerkinElmer, Inc.'s Amended and Restated Performance Incentive Plan (Executive Officers), filed with the Commission on February 25, 2014 as Exhibit 10.37 to our annual report on Form 10-K and herein incorporated by reference. | ||||
| 12.1 | Statement regarding computation of ratio of earnings to fixed charges, attached hereto as Exhibit 12.1. | ||||
| 21 | Subsidiaries of PerkinElmer, Inc., attached hereto as Exhibit 21. | ||||
| 23 | Consent of Independent Registered Public Accounting Firm, attached hereto as Exhibit 23. | ||||
| 31.1 | Certification of Chief Executive Officer pursuant to Rule 13a-14(a) under the Securities Exchange Act of 1934, attached hereto as Exhibit 31.1. | ||||
| 31.2 | Certification of Chief Financial Officer pursuant to Rule 13a-14(a) under the Securities Exchange Act of 1934, attached hereto as Exhibit 31.2. | ||||
| 32.1 | Certification of Chief Executive Officer and Chief Financial Officer pursuant to 18 U.S.C. Section 1350, as adopted pursuant to Section 906 of the Sarbanes-Oxley Act of 2002, attached hereto as Exhibit 32.1. | ||||
| 101.INS | XBRL Instance Document. | ||||
| 101.SCH | XBRL Taxonomy Extension Schema Document. | ||||
| 101.CAL | XBRL Calculation Linkbase Document. | ||||
| 101.DEF | XBRL Definition Linkbase Document. | ||||
| 101.LAB | XBRL Labels Linkbase Document. | ||||
| 101.PRE | XBRL Presentation Linkbase Document. |
| (1) | The exhibits and schedules to this agreement have been omitted from this filing pursuant to Item 601(b)(2) of Regulation S-K. The registrant agrees to furnish copies of any of such exhibits or schedules to the SEC upon request. |
| * | Management contract or compensation plan or arrangement required to be filed as an exhibit pursuant to Item 15(b) of Form 10-K. |
Attached as Exhibit 101 to this report are the following formatted in XBRL (Extensible Business Reporting Language):
(i) Consolidated Statements of Operations for each of the three years in the period ended January 1, 2017, (ii) Consolidated Balance Sheets as of January 1, 2017 and January 3, 2016, (iii) Consolidated Statements of Comprehensive Income for each of the three years in the period ended January 1, 2017, (iv) Consolidated Statements of Stockholders' Equity for each of the three years in the period ended January 1, 2017, (v) Consolidated Statements of Cash Flows for each of the three years in the period ended January 1, 2017, (vi) Notes to Consolidated Financial Statements, and (vii) Financial Schedule of Valuation and Qualifying Accounts.