 filings.tools
Revvity (RVTY) 10-K risk factor changes: FY2017 vs FY2016
The 2017-01-01 10-K against the 2016-01-03 one, compared heading by heading and sentence by sentence. One of these filings carries no fiscal year tag, so its year is the calendar year of the period end.
Item 1A18 rewritten8 added3 removed309 unchanged
All filing items1,048 rewritten1,035 added591 removed2,555 unchanged
Summary
counted, not written
- Item 1A headings could not be compared: only 0 carried over between the two years, which usually means one filing was read wrongly, so none is reported as new or removed.
- Sentence by sentence, 1,035 added, 591 removed, 1,048 rewritten and 2,555 unchanged across 18 items that differ.
Sentences by item
21 items, with every count and a link to each item that changed
Underlined words on a shaded ground are new in FY2017; struck-through words were in FY2016. Sentences that are wholly new or wholly gone are labelled rather than marked.
Item 1A. Risk Factors
18 rewritten, 8 added, 3 removed, 309 unchanged
Our business is affected by global economic [removed: conditions] and [added: political conditions as well as] the state of the financial markets, particularly as the United States and other countries balance concerns around debt, inflation, growth and budget allocations in their policy initiatives.
While we take precautions to prevent production or service interruptions at our global facilities, a major earthquake, fire, flood, power loss or other catastrophic event that results in the destruction or delay of any of our critical business operations [added: could result in our incurring significant liability to customers or other third parties, cause significant reputational damage or have a material adverse effect on our business, operating results or financial condition.]
We may not be able to successfully execute acquisitions or [added: divestitures,] license technologies, integrate acquired businesses or licensed technologies into our existing businesses, [added: or] make acquired businesses or licensed technologies [removed: profitable, or successfully divest businesses.][added: profitable.]
We have in the past supplemented, and may in the future supplement, our internal growth by acquiring businesses and licensing technologies that complement or augment our existing product lines, such as our acquisition of [removed: Perten Instruments Group AB] [added: Bioo Scientific] in the [removed: fourth] [added: third] quarter of fiscal year [removed: 2014.][added: 2016.]
If, for example, we are unable to successfully commercialize products and services related to significant [removed: IPR&D] [added: in-process research and development] that we have capitalized, we may have to impair the value of such assets.
We may not be successful in this regard and may encounter other difficulties in integrating acquired businesses into our existing operations, such as incompatible management, information or other systems, cultural differences, loss of key personnel, unforeseen [removed: regulatory requirements, previously undisclosed liabilities or difficulties in predicting financial results.]
Additionally, if we are not successful in selling businesses we seek to divest, the activity of such businesses may dilute our earnings and we may not be able to achieve the [added: expected benefits of such divestitures.]
[removed: As a result of these rules, we may incur additional costs in complying with the disclosure requirements and in satisfying those customers who require that the] components used in our products be certified as conflict-free, and the potential lack of availability of these materials at competitive prices could increase our production costs.
Some of [removed: the products produced by] our [removed: Human Health segment] [added: products] are subject to regulation by the United States Food and Drug Administration and similar foreign and domestic agencies.
Our sales originating outside the United States represented the majority of our total revenue in fiscal year [removed: 2015.][added: 2016.]
If we experience a significant disruption in, or breach in security [removed: of] [added: of,] our information technology systems, or inadvertent transfer of information, or if we fail to implement new systems, software and technologies successfully, our business could be adversely affected.
Our senior unsecured revolving credit [removed: facility and our 5%] [added: facility,] senior unsecured notes due in 2021 [removed: (the "2021] [added: ("2021] Notes") [added: and senior unsecured notes due in 2026 ("2026 Notes")] include restrictive covenants that limit our ability to engage in activities that could otherwise benefit our company.
Our failure to comply with any of the restrictions in our senior unsecured revolving credit facility, [removed: our] [added: the] 2021 [added: Notes, the 2026] Notes or any future indebtedness may result in an event of default under those debt instruments, which could permit acceleration of the debt under those debt instruments, and require us to prepay that debt before its scheduled due date under certain circumstances.
As of January [removed: 3, 2016,] [added: 1, 2017,] our total assets included [removed: $2.8] [added: $2.7] billion of net intangible assets.
Net intangible assets consist principally of goodwill associated with acquisitions and costs associated with securing patent rights, trademark rights, customer relationships, core technology and technology [removed: licenses,] [added: licenses and in-process research and development,] net of accumulated amortization.
Adverse changes in our business, adverse changes in the assumptions used to determine the fair value of our reporting units, or the failure to grow our [removed: Human Health] [added: Discovery & Analytical Solutions] and [removed: Environmental Health] [added: Diagnostics] segments may result in impairment of our intangible assets, which could adversely affect our results of operations.
On October [removed: 29, 2015,] [added: 26, 2016,] we announced that our Board had declared a quarterly dividend of $0.07 per share for the fourth quarter of fiscal year [removed: 2015] [added: 2016] that was paid in February [removed: 2016.][added: 2017.]
[added: On January 27, 2017, we announced that our Board had declared a] quarterly dividend of $0.07 per share for the first quarter of fiscal year [removed: 2016] [added: 2017] that will be payable in May [removed: 2016.][added: 2017.]
regulatory requirements, previously undisclosed liabilities or difficulties in predicting financial results.
As a result of these rules, we may incur additional costs in complying with the disclosure requirements and in satisfying those customers who require that the
We have a substantial amount of debt and other financial obligations.
The approval of the Brexit Referendum in the U.K. may have an adverse impact on our results of operations.
In a referendum vote held on June 23, 2016, the United Kingdom voted to leave the European Union.
Nearly 3% of our net sales from continuing operations in 2016 came from the U.K. At this time, we are not able to predict the impact that this vote will have on the economy in Europe, including in the U.K., or on the Great Britain Pound (the “GBP”) or other European exchange rates.
Weakening of economic conditions or economic uncertainties tend to harm our business, and if such conditions emerge in the U.K. or in the rest of Europe, it may have a material adverse effect on our sales.
In addition, any significant weakening of the GBP to the U.S. dollar will have an adverse impact on our European revenues due to the importance of U.K. sales.
could result in our incurring significant liability to customers or other third parties, cause significant reputational damage or have a material adverse effect on our business, operating results or financial condition.
expected benefits of such divestitures.
On January 28, 2016, we announced that our Board had declared a
Item 7. Management’s Discussion and Analysis of Financial Condition and Results of Operations
275 rewritten, 238 added, 151 removed, 362 unchanged
Each of the fiscal years ended [removed: December 28, 2014] [added: January 1, 2017] ("fiscal year [removed: 2014")] [added: 2016")] and December [removed: 29, 2013] [added: 28, 2014] ("fiscal year [removed: 2013")] [added: 2014")] included 52 weeks.
The fiscal year ending [removed: January 1,] [added: December 31,] 2017 will include 52 weeks.
Overview of Fiscal Year [removed: 2015][added: 2016]
Financial information in this report relating to fiscal years [removed: 2014] [added: 2015] and [removed: 2013] [added: 2014] has been retrospectively adjusted to reflect [removed: this change to our operating segments.][added: these changes.]
During fiscal year [removed: 2015,] [added: 2016,] we continued to see good performance from acquisitions, investments in our ongoing technology and sales and marketing initiatives.
Our overall revenue in fiscal year [removed: 2015] [added: 2016] increased [removed: $25.1] [added: $10.7] million, or 1%, as compared to fiscal year [removed: 2014,] [added: 2015,] reflecting an increase of [removed: $32.7] [added: $26.1] million, or [removed: 4%,] [added: 5%,] in our [removed: Environmental Health] [added: Diagnostics] segment revenue, which was partially offset by a decrease of [removed: $7.6] [added: $15.4] million, or 1%, in our [removed: Human Health] [added: Discovery & Analytical Solutions] segment revenue.
In our [removed: Human Health] [added: Discovery & Analytical Solutions] segment, excluding the unfavorable impact of foreign currency exchange, we experienced [added: flat] growth during fiscal year [removed: 2015] [added: 2016] in several of our products within [removed: both] our [added: life science] research [removed: and diagnostics] end [removed: markets,] [added: market,] as compared to fiscal year [removed: 2014.][added: 2015.]
In our [added: life sciences] research market, we experienced increased demand for our [removed: OneSource laboratory service and] informatics [removed: businesses,] [added: business,] as well as an increase in revenue from new product introductions, such as the Opera Phenix.
[removed: In] [added: Excluding the impact of unfavorable foreign currency, we experienced growth in] our diagnostics [removed: market, we] [added: business from] continued [removed: to expand] [added: expansion of] our newborn and infectious disease screening solutions in emerging markets such as China.
Birth rates in the United States continue to stabilize and demand for greater access to newborn screening in rural areas outside the United States is also increasing, as evidenced by prenatal trends we saw during fiscal year [removed: 2015.][added: 2016.]
The growth in our [removed: Human Health] [added: Discovery & Analytical Solutions] segment was more than offset by unfavorable impacts from foreign currency as the U.S. dollar strengthened, particularly versus the Euro.
[added: As the rising cost of healthcare continues to be one of the critical issues facing our customers, we anticipate that the benefits of providing earlier] detection of disease, which can result in a reduction of long-term health care costs as well as create better outcomes for patients, are increasingly valued and we expect to see continued growth in these markets.
The increase in revenue was primarily due to revenue from our acquisition of Perten in December 2014, as well as growth in our materials characterization product family within our environmental and industrial [removed: markets, which was partially offset by unfavorable impacts from foreign currency.][added: markets.]
Our consolidated gross margins increased [removed: 38] [added: 209] basis points in fiscal year [removed: 2015,] [added: 2016,] as compared to fiscal year [removed: 2014,] [added: 2015, primarily] due to [removed: increased] [added: favorable changes in product mix, with an increase in] sales [removed: volume,] [added: of higher gross margin product offerings, and] benefits from [added: our] initiatives to improve our supply [removed: chain, as well as a lower mark-to-market loss for our postretirement benefit plans in fiscal year 2015 as compared to fiscal year 2014.][added: chain.]
[removed: These items were] [added: In addition to the factors noted above, the increase in gross margin was primarily the result of benefits from our initiatives to improve our supply chain, which was] partially offset by unfavorable changes in product mix, with an increase in sales of lower gross margin product [removed: offerings,] [added: offerings] and negative impacts from foreign [removed: currency] exchange rates.
Our consolidated operating margin increased [removed: 323] [added: 146] basis points in fiscal year [removed: 2015,] [added: 2016,] as compared to fiscal year [removed: 2014,] [added: 2015] primarily due to [removed: a pre-tax loss of $12.4 million in fiscal year 2015 as compared to a pre-tax loss of $75.9 million in fiscal year 2014 for the mark-to-market adjustments for our postretirement plans,] higher gross [removed: margins,] [added: margins] and lower costs as a result of cost containment and productivity initiatives, which were partially offset by increased costs related to investments in new product development.
We [removed: believe we] continue to [removed: be] [added: believe that we are] well positioned to take advantage of the spending trends in our end markets and to promote efficiencies in markets where current conditions may increase demand for certain services.
Overall, we believe that our strategic focus on [removed: Human Health] [added: diagnostics] and [removed: Environmental Health] [added: discovery and analytical solutions markets,] coupled with our deep portfolio of technologies and applications, leading market positions, global scale and financial strength will provide us with a [removed: solid] foundation for growth.
Revenue for fiscal year 2015 was [removed: $2,262.4] [added: $2,104.8] million, as compared to [removed: $2,237.2] [added: $2,069.9] million for fiscal year 2014, an increase of [removed: $25.1] [added: $34.9] million, or [removed: 1%,] [added: 2%,] which includes an approximate 3% increase in revenue attributable to [removed: acquisitions,] [added: acquisitions and divestitures and] an approximate 6% decrease in revenue attributable to changes in foreign exchange [removed: rates and revenue attributable to an additional week during fiscal year 2015.][added: rates.]
The analysis in the remainder of this paragraph compares segment revenue for fiscal year 2015 as compared to fiscal year 2014 and includes the effect of foreign exchange rate fluctuations and [removed: acquisitions.][added: acquisitions and divestitures.]
The total increase in revenue reflects [removed: an] [added: a $44.3 million, or 3%,] increase in our [removed: Environmental Health] [added: Discovery & Analytical Solutions] segment [removed: of $32.7 million, or 4%,] [added: revenue,] due to an increase in [removed: environmental] [added: environmental, food] and industrial markets revenue of $44.9 [removed: million, which was] [added: million and life sciences research market revenue of $11.6 million] partially offset by a decrease in laboratory services market revenue of $12.2 million.
As a result of adjustments to deferred revenue related to certain acquisitions required by business combination rules, we did not recognize $0.8 million of revenue primarily related to our [removed: Human Health] [added: informatics business in our Diagnostics] segment for fiscal year 2015 and $2.9 million for fiscal year 2014 that otherwise would have been recorded by the acquired businesses during each of the respective periods.
Revenue for fiscal year [removed: 2014] [added: 2015] was [removed: $2,237.2] [added: $1,528.4] million, as compared to [removed: $2,157.6] [added: $1,484.1] million for fiscal year [removed: 2013,] [added: 2014,] an increase of [removed: $79.6] [added: $44.3] million, or [removed: 4%,] [added: 3%,] which includes an approximate [removed: 1%] [added: 5.0%] increase in revenue attributable to [added: the impact of] acquisitions and [added: divestitures and] an approximate [removed: 1%] [added: 7.0%] decrease in revenue attributable to changes in foreign exchange rates.
The analysis in the remainder of this paragraph compares segment revenue for fiscal year [removed: 2014] [added: 2016] as compared to fiscal year [removed: 2013] [added: 2015] and includes the effect of foreign exchange rate fluctuations and [removed: acquisitions.][added: acquisitions and divestitures.]
The total increase in revenue reflects [removed: a $58.3 million, or 4%,] [added: an] increase in our [removed: Human Health] [added: Diagnostics] segment [removed: revenue,] [added: revenue of $26.1 million, or 5%,] due to [removed: an increase] [added: continued expansion] in [removed: diagnostics market revenue of $39.8 million] [added: our newborn screening, blood banking] and [removed: an increase in research market revenue of $18.5 million.][added: screening businesses.]
As a result of adjustments to deferred revenue related to certain acquisitions required by business combination rules, we did not recognize [removed: $2.9] [added: $0.7] million of revenue primarily related to our [removed: informatics business in our Human Health] [added: Diagnostics] segment for fiscal year [removed: 2014] [added: 2016] and [removed: $7.3] [added: $0.8] million for fiscal year [removed: 2013] [added: 2015] that otherwise would have been recorded by the acquired businesses during each of the respective periods.
Cost of revenue for fiscal year 2015 was [removed: $1,237.9] [added: $1,140.6] million, as compared to [removed: $1,232.6] [added: $1,135.3] million for fiscal year 2014, an increase of approximately [removed: $5.2] [added: $5.3] million, or [removed: 0.4%.][added: 0.5%.]
As a percentage of revenue, cost of revenue decreased to [removed: 54.7%] [added: 52.1%] in fiscal year [removed: 2015] [added: 2016] from [removed: 55.1%] [added: 54.2%] in fiscal year [removed: 2014,] [added: 2015,] resulting in an increase in gross margin of approximately [removed: 38] [added: 209] basis [added: points to 47.9% in fiscal year 2016 from 45.8% in fiscal year 2015.]
Amortization of intangible assets decreased and was [removed: $43.5] [added: $42.4] million for fiscal year 2015, as compared to [removed: $49.7] [added: $48.7] million for fiscal year 2014.
The mark-to-market adjustment for postretirement benefit plans was a loss of $1.2 million for fiscal year 2015, as compared to a loss of [removed: $8.4] [added: $8.2] million for fiscal year 2014.
Stock-based compensation expense was $1.3 million for fiscal year 2015, as compared to [removed: $1.5] [added: $1.4] million for fiscal year 2014.
The amortization of purchase accounting adjustments to record the inventory from certain acquisitions added an incremental expense of $7.3 million [removed: for] [added: in] fiscal year [removed: 2015,] [added: 2015] as compared to $2.4 million [removed: for] [added: in] fiscal year 2014.
Acquisition [removed: related costs for integration,] [added: and divestiture-related expenses,] contingent consideration and other costs added an incremental expense of $0.1 million for each of fiscal years 2015 and 2014.
In addition to the factors noted above, the increase in gross margin was primarily the result of [removed: benefits from our initiatives to improve our supply chain, which was partially offset by unfavorable] [added: favorable] changes in product mix, with an increase in sales of [removed: lower] [added: higher] gross margin product [removed: offerings,] [added: offerings] and [removed: negative impacts] [added: benefits] from [removed: foreign currency exchange rates.][added: our initiatives to improve our supply chain.]
[removed: As a percentage of revenue, cost of revenue increased to 55.1%] [added: 54.2%] in fiscal year [removed: 2014] [added: 2015] from 54.8% in fiscal year [removed: 2013,] [added: 2014,] resulting in [removed: a decrease] [added: an increase] in gross margin of approximately [removed: 34] [added: 66] basis points to [removed: 44.9%] [added: 45.8%] in fiscal year [removed: 2014] [added: 2015] from 45.2% in fiscal year [removed: 2013.][added: 2014.]
Amortization of intangible assets decreased and was [removed: $49.7] [added: $30.3] million for fiscal year [removed: 2014,] [added: 2016,] as compared to [removed: $52.0] [added: $42.4] million for fiscal year [removed: 2013.][added: 2015.]
The mark-to-market adjustment for postretirement benefit plans was a loss of [removed: $8.4 million for fiscal year 2014, as compared to a loss of $0.8] [added: $0.1] million for fiscal year [removed: 2013.][added: 2015.]
Stock-based compensation expense was [removed: $1.5] [added: $1.0] million for fiscal year [removed: 2014,] [added: 2016,] as compared to $1.3 million for fiscal year [removed: 2013.][added: 2015.]
The amortization of purchase accounting adjustments to record the inventory from certain acquisitions was [removed: $2.4] [added: $7.3] million for fiscal year [removed: 2014,] [added: 2015,] as compared to [removed: $0.2] [added: $2.4] million for fiscal year [removed: 2013.][added: 2014.]
Acquisition [removed: related costs for integration,] [added: and divestiture-related costs,] contingent consideration and other costs added an incremental expense of [removed: $0.1] [added: $0.6] million for fiscal year [removed: 2014,] [added: 2016,] as compared to [removed: $0.2] [added: $0.4] million for fiscal year [removed: 2013.][added: 2015.]
We realigned our businesses at the beginning of the fourth quarter of fiscal year 2016 to better organize around customer requirements, positioning us to grow in attractive end markets and expand share with our core product offerings.
We created two new reporting segments, Discovery & Analytical Solutions and Diagnostics, which will enable us to deliver improved customer focus, more value-add collaboration and breakthrough innovations.
Microfluidics and automation products within our former research business were moved to a new applied genomics group within the Diagnostics segment.
In addition, we also moved our Medical Imaging business into discontinued operations due to its pending sale.
The results reported for fiscal year 2016 reflect our new segment structure and the exclusion of our Medical Imaging business from continuing operations.
The decrease in our Discovery & Analytical Solutions segment was primarily driven by decreases in revenue in our academic and government product offerings within our life sciences research market and a decrease in our environmental and food businesses due to weak harvest conditions, which were partially offset by increased demand in our laboratory services business.
The increase in our Diagnostics segment revenue during fiscal year 2016 was primarily due to strong performance of our newborn and infectious disease screening solutions in emerging markets such as China, as well as in Europe.
During fiscal year 2016, we experienced increased demand for our OneSource laboratory service and informatics businesses.
This was offset by decreases in revenue in our environmental and food business due to weak harvest conditions as well as in our academic and government product offerings due to reduced government funding.
In our Diagnostics segment, we experienced growth from continued expansion in our newborn screening, blood banking and screening businesses.
The growth in our Diagnostics segment was partially offset by unfavorable impacts from foreign currency as the U.S. dollar strengthened.
2016 Compared to 2015.
In addition, our fiscal year 2015 had an additional week, which consisted of 53 weeks, as compared to fiscal year 2016, which consisted of 52 weeks.
Our Discovery & Analytical Solutions segment revenue decreased by $15.4 million, or 1%, due to a decrease in environmental, food and industrial markets revenue of $20.8 million and life sciences research market revenue of $0.6 million, which was partially offset by an increase in laboratory services market revenue of $6.0 million.
Our Diagnostics segment revenue decreased by $9.3 million, or 2%.
2016 Compared to 2015.
Cost of revenue for fiscal year 2016 was $1,102.2 million, as compared to $1,140.6 million for fiscal year 2015, a decrease of approximately $38.4 million, or 3%.
As a percentage of revenue, cost of revenue decreased to
2016 Compared to 2015.
During fiscal year 2015, we recorded $0.8 million in legal costs for a particular case compared to $6.6 million for fiscal year 2014.
2016 Compared to 2015.
In addition to the above items, the increase in research and development expenses was primarily the result of investments in new product development, primarily the results of our investments in Vanadis focused on non-invasive prenatal screening and ionics mass spectrometry focused on food and environmental safety applications.
The mark-to-market
We implemented a restructuring plan in the third quarter of fiscal year 2016 consisting of workforce reductions principally intended to focus resources on higher growth product lines (the "Q3 2016 Plan").
We implemented a restructuring plan in the second quarter of fiscal year 2016 consisting of workforce reductions principally intended to focus resources on higher growth end markets (the "Q2 2016 Plan").
| Q3 2016 Plan | 22 | | | $ | 41 | | | $ | 1,779 | | | $ | — | | | $ | — | | | $ | 1,820 | | | Q4 FY2017 | | — |
| Q2 2016 Plan | 72 | | | 561 | | | | 4,106 | | | | — | | | | — | | | | 4,667 | | | | Q3 FY2017 | | — |
| Q2 2015 Plan | 95 | | | 673 | | | | 5,290 | | | | — | | | | — | | | | 5,963 | | | | Q2 FY2016 | | — |
| Q2 2014 Plan | 21 | | | 235 | | | | 435 | | | | — | | | | — | | | | 670 | | | | Q2 FY2015 | | — |
| Q3 2016 Plan | — | | | | $ | — | | | $ | — | | | $ | — | | | $ | — | | | $ | — | | | $ | — | | | $ | 1,820 | | | $ | (612 | ) | | $ | 1,208 | |
| Q2 2016 Plan | — | | | | — | | | | — | | | | — | | | | — | | | | — | | | | — | | | | 4,667 | | | | (3,231 | | ) | | 1,436 | | |
| Q2 2015 Plan(2) | — | | | | — | | | | — | | | | — | | | | 5,423 | | | | (4,322 | | ) | | 1,101 | | | | (533 | | ) | | (370 | | ) | | 198 | | |
| Previous Plans including 2013 plans | 35,200 | | | | (2,508 | | ) | | (19,572 | | ) | | 13,120 | | | | (204 | | ) | | (4,222 | | ) | | 8,694 | | | | 35 | | | | (3,299 | | ) | | 5,430 | | |
| Restructuring | 35,200 | | | | 11,780 | | | | (23,458 | | ) | | 23,522 | | | | 13,464 | | | | (14,968 | | ) | | 22,018 | | | | 5,036 | | | | (16,630 | | ) | | 10,424 | | |
| Total Restructuring and Contract Termination | $ | 35,500 | | | $ | 13,325 | | | $ | (24,999 | ) | | $ | 23,826 | | | $ | 13,547 | | | $ | (15,223 | ) | | $ | 22,150 | | | $ | 5,124 | | | $ | (16,733 | ) | | $ | 10,541 | |
| Gain on disposition of businesses and assets, net | (5,562 | | ) | | — | | | | — | | |
2016 Compared to 2015.
The decrease in interest and other
expense, net, in fiscal year 2016 as compared to fiscal year 2015 was primarily due to a gain on disposition of businesses and assets, net recognized in fiscal year 2016 which was partially offset by an increase in interest expense of $3.5 million for fiscal year 2016 as compared to fiscal year 2015 due to the issuance of the new higher interest rate 2026 Notes, which replaced our lower cost debt outstanding on our previous senior unsecured revolving credit facility.
The effective tax rates on continuing operations were 11.6%, 9.6% and (5.1)% for fiscal years 2016, 2015 and 2014, respectively.
We realigned our organization at the beginning of fiscal year 2015 to enable us to both deliver complete solutions targeted towards certain end markets and develop value-added applications and solutions to foster further expansion of those markets.
OneSource, our multivendor laboratory service business that serves the life sciences end market, was moved from our Environmental Health segment into our Human Health segment.
The results reported for fiscal year 2015 reflect this new alignment of our operating segments.
As a result of the realignment, we reallocated goodwill from our Environmental Health segment to our Human Health segment based on the relative fair value, determined using the income approach, of the OneSource business within the historical Environmental Health segment.
The realignment resulted in $41.2 million of goodwill being reallocated from our Environmental Health segment to our Human Health segment as of December 28, 2014.
The increase in our Environmental Health segment revenue during fiscal year 2015 was primarily due to revenue from our acquisition of Perten Instruments Group AB ("Perten") in December 2014, as well as increased demand in our laboratory services business, which was partially offset by unfavorable impacts from foreign currency.
During fiscal year 2015, our Human Health segment revenue decreased due to unfavorable impacts from foreign currency, however we experienced increased demand for our OneSource laboratory service and informatics businesses, within our research market, as well as increased demand in our newborn and infectious disease screening business within our diagnostics market.
In addition, new product introductions within our research market, such as the Opera Phenix, increased revenue in our Human Health segment.
Our medical imaging business experienced slight growth due to increased demand for our CMOS and cassette panels, which was partially offset by a decrease in demand in our radiography and radiation oncology end markets.
As the rising cost of healthcare continues to be one of the critical issues facing our customers, we anticipate that the benefits of providing earlier
In our Environmental Health segment, we had an increase in revenue in fiscal year 2015, as compared to fiscal year 2014, despite unfavorable impacts from foreign currency.
In addition, we had an increased demand in our laboratory services business, despite unfavorable impacts from foreign currency.
2015 Compared to 2014.
Our Human Health segment revenue decreased $7.6 million, or 1%, due to a decrease in research market revenue of $4.0 million and a decrease in diagnostics market revenue of $3.6 million.
The effect of foreign currency changes from prior year period on revenue is approximately $142.0 million in fiscal year 2015.
2014 Compared to 2013.
Our Environmental Health segment revenue increased $21.3 million, or 3%, due to an increase in laboratory services market revenue of $17.8 million and an increase in environmental and industrial markets revenue of $3.5 million.
points to 45.3% in fiscal year 2015 from 44.9% in fiscal year 2014.
The effect of foreign currency changes from prior year period on cost of revenue is approximately $66.0 million in fiscal year 2015.
Cost of revenue for fiscal year 2014 was $1,232.6 million, as compared to $1,181.4 million for fiscal year 2013, an increase of approximately $51.2 million, or 4%.
The effect of foreign currency changes from prior year period on selling, general and administrative expense is approximately $31.6 million in fiscal year 2015.
During fiscal year 2014, we recorded a benefit of $2.3 million for cost reimbursements related to a particular site, of which $1.2 million was for future monitoring and mitigation activities, as compared to expense of $4.6 million for environmental costs for fiscal year 2013.
The effect of foreign currency changes from prior year period on research and development expenses is approximately $8.6 million in fiscal year 2015.
In addition to the above items, the decrease in research and development expenses was primarily the result of the consolidation of research and development activities into our newly opened Center for Innovation.
We directed research and development efforts similarly during fiscal years 2014 and 2013, primarily toward the diagnostics and research markets within our Human Health segment, and the environmental, industrial and laboratory services markets within our Environmental Health segment, in order to help accelerate our growth initiatives.
We implemented restructuring plans in the fourth and third quarters of fiscal year 2013 consisting of workforce reductions and the closure of excess facility space principally intended to shift certain of our research and development resources into our newly opened Center for Innovation (the "Q4 2013 Plan" and "Q3 2013 Plan", respectively).
We implemented a restructuring plan in the second quarter of fiscal year 2013 consisting of workforce reductions and the closure of excess facility space principally intended to shift certain of our operations into a newly established shared service center, as well as realign operations, research and development resources, and production resources as a result of previous acquisitions (the "Q2 2013 Plan").
We expect no significant impact on future operating results or cash flows from the restructuring activities executed in fiscal year 2015.
| Q2 2015 Plan | 97 | | | 1,850 | | | | 4,160 | | | | — | | | | — | | | | 6,010 | | | | Q2 FY2016 | | — |
| Q2 2014 Plan | 22 | | | 545 | | | | 190 | | | | — | | | | — | | | | 735 | | | | Q2 FY2015 | | — |
| Q4 2013 Plan | 73 | | | 955 | | | | 2,953 | | | | 7,271 | | | | — | | | | 11,179 | | | | Q4 FY2014 | | Q1 FY2019 |
| Q3 2013 Plan | 29 | | | 394 | | | | — | | | | 138 | | | | — | | | | 532 | | | | Q1 FY2014 | | Q4 FY2013 |
| Q2 2013 Plan(1) | 264 | | | 9,523 | | | | 8,609 | | | | 522 | | | | 50 | | | | 18,704 | | | | Q4 FY2014 | | Q3 FY2014 |
| Q1 2013 Plan | 62 | | | 2,340 | | | | 245 | | | | — | | | | — | | | | 2,585 | | | | Q3 FY2013 | | — |
____________________________
| | |
| --- | --- |
| (1) | Subsequent to the initial charge, during fiscal year 2013, we recorded an additional $0.6 million pre-tax restructuring charge in our Human Health segment for the Q2 2013 Plan for services that were provided for one-time termination benefits in which the employee was required to render service beyond the legal notification period. |
| Q2 2015 Plan(1) | — | | | | — | | | | — | | | | — | | | | — | | | | — | | | | — | | | | 5,471 | | | | (4,322 | | ) | | 1,149 | | |
| Previous Plans including 2013 plans(5) | 27,151 | | | | 33,196 | | | | (25,112 | | ) | | 35,235 | | | | (2,508 | | ) | | (19,603 | | ) | | 13,124 | | | | (209 | | ) | | (4,222 | | ) | | 8,693 | | |
An excerpt. Shown here: 40 of 275 rewritten, 40 of 238 added and 40 of 151 removed. The counts are complete. For every sentence, read Item 7. Management’s Discussion and Analysis of Financial Condition and Results of Operations in the FY2017 filing and the FY2016 filing.
Item 7A. Quantitative and Qualitative Disclosures About Market Risk
21 rewritten, 11 added, 10 removed, 37 unchanged
We believe we had no significant concentrations of credit risk as of January [removed: 3, 2016.][added: 1, 2017.]
We do not enter into derivative contracts for trading or other speculative purposes, nor do we use [removed: leveraged financial instruments.]
The contracts are primarily in European and Asian currencies, have maturities that do not exceed 12 months, have no cash requirements until maturity, and are recorded at fair value on [removed: the] [added: our condensed] consolidated balance sheets.
The cash flows related to the settlement of these hedges are included in cash flows from operating activities within our [added: condensed] consolidated statement of cash flows.
We held forward foreign exchange contracts, designated as economic hedges, with U.S. dollar equivalent notional amounts totaling [added: $137.5 million at January 1, 2017,] $127.3 million at January 3, [removed: 2016,] [added: 2016 and] $95.0 million at December 28, [removed: 2014 and $138.4 million at December 29, 2013,] [added: 2014,] and the fair value of these foreign currency derivative contracts was insignificant.
The gains and losses realized on these foreign currency derivative [added: contracts are not material.]
The duration of these contracts was generally 30 days or less during each of fiscal years [removed: 2015, 2014] [added: 2016, 2015] and [removed: 2013.][added: 2014.]
In addition, in connection with certain intercompany loan agreements utilized to finance our [removed: acquisitions,] [added: acquisitions and stock repurchase program,] we enter into forward foreign exchange contracts intended to hedge movements in foreign exchange rates prior to settlement of such intercompany loans denominated in foreign currencies.
We record these hedges at fair value on our [added: condensed] consolidated balance sheets.
The cash flows related to the settlement of these hedges are included in cash flows from financing activities within our [added: condensed] consolidated statement of cash flows.
[removed: During fiscal year 2014, we entered into five forward foreign exchange contracts, designated as economic hedges, with settlement dates in fiscal year 2015 and combined Euro denominated notional amounts] [added: As] of [removed: €238.2 million] [added: January 1, 2017, the] outstanding [removed: as of December 28, 2014,] [added: forward exchange contracts] designated as economic hedges, that were intended to hedge movements in foreign exchange rates prior to [added: the] settlement of certain intercompany loan [removed: agreements.][added: agreements included combined Euro notional amounts of €58.6 million, combined U.S. Dollar notional amounts of $8.7 million and combined Swedish Krona notional amounts of kr969.5 million.]
The combined Euro [removed: denominated] notional amounts of these outstanding hedges was €107.4 million and €238.2 million as of January 3, 2016 and December 28, 2014, respectively.
The net gains and losses on these derivatives, combined with the gains and losses on the remeasurement of the hedged intercompany [removed: loans,] [added: loans] were not material for [added: the] fiscal years [removed: 2015] [added: ended January 1, 2017] and [removed: 2014.][added: January 3, 2016.]
[removed: During fiscal year 2015, we] [added: We paid $1.9 million and] received $18.7 million [removed: as a result of] [added: during] the [added: fiscal years ended January 1, 2017 and January 3, 2016, respectively, from the] settlement of these hedges.
As of January [removed: 3, 2016,] [added: 1, 2017,] this computation estimated that there is a 5% chance that the market value of the underlying exposures and the corresponding derivative instruments either increase or decrease due to foreign currency fluctuations by more than [removed: $0.5] [added: $0.3] million.
Specifically, during each of the four quarters ended in fiscal year [removed: 2015,] [added: 2016,] the Value-At-Risk ranged between [removed: $0.3] [added: $0.1] million and [removed: $0.9] [added: $0.6] million, with an average of approximately [removed: $0.5] [added: $0.3] million.
Management’s Discussion and Analysis of Financial Condition and Results of Operations-Liquidity and Capital Resources,” [added: amounts drawn under] our [removed: debt portfolio includes] [added: senior unsecured revolving credit facility would bear interest at] variable [removed: rate instruments.][added: rates.]
[removed: In addition, our] [added: Our] cash and cash equivalents, for which we receive interest at variable rates, were [removed: $237.9] [added: $359.3] million at January [removed: 3, 2016.][added: 1, 2017.]
An increase of 10%, or approximately [removed: 14] [added: 17] basis points, in current interest rates would cause [removed: an additional pre-tax charge to] our [removed: earnings of $0.7] [added: cash outflows to increase by $0.1] million for fiscal year [removed: 2016.][added: 2017.]
[removed: (ii)] [added: (i)] Changes in interest rates can cause our cash flows [removed: relative] to [removed: interest payments on variable rate debt to] fluctuate.
[removed: (iii)] [added: (ii)] Changes in interest rates can cause our interest income and cash flows to fluctuate.
leveraged financial instruments.
During fiscal year 2016, we entered into a series of foreign currency forward contracts with a notional amount of €492.3 million to hedge our investments in certain foreign subsidiaries.
Realized and unrealized translation adjustments from these hedges were included in the foreign currency translation component of accumulated other comprehensive income ("AOCI"), which offsets the translation adjustments on the underlying net assets of foreign subsidiaries.
The cumulative translation gains or losses will remain in AOCI until the foreign subsidiaries are liquidated or sold.
The foreign currency forward contracts were settled during fiscal year 2016 and we recorded a net realized foreign exchange gain in AOCI amounting to $1.8 million during the fiscal year 2016.
During fiscal year 2016, in connection with the issuance of the 2026 Notes, we designated the 2026 Notes to hedge our investments in certain foreign subsidiaries.
Realized and unrealized translation adjustments from these hedges will be included in the foreign currency translation component of AOCI, which will offset translation adjustments on the underlying net assets of foreign subsidiaries.
The cumulative translation gains or losses will remain in AOCI until the foreign subsidiaries are liquidated or sold.
As of January 1, 2017, the total notional amount of foreign currency denominated debt designated to hedge investments in foreign subsidiaries was €495.8 million.
The unrealized foreign exchange loss recorded in AOCI related to the net investment hedge was $23.8 million during the fiscal year 2016.
As of January 1, 2017, we had no outstanding borrowings under our senior unsecured revolving credit facility; however, as described above in “Item 7.
contracts are not material.
During fiscal year 2015, we settled several of these forward exchange contracts.
During fiscal year 2015, we also entered into new forward foreign exchange contracts that settled in fiscal year 2015 or will settle in fiscal year 2016.
In May 2008, we settled forward interest rate contracts with notional amounts totaling $150.0 million upon the issuance of our 2015 Notes, and recognized $8.4 million, net of taxes of $5.4 million, of accumulated derivative losses in other comprehensive (loss) income.
During fiscal year 2013, we amortized a pre-tax loss of $2.0 million into interest and other expense, net.
In addition, during fiscal year 2013, we redeemed all of our 2015 Notes and recognized a pre-tax loss of $2.8 million for the remaining unamortized derivative losses into interest and other expense, net.
As described above in “Item 7.
As of January 3, 2016, our debt portfolio consisted of $482.0 million of variable rate debt.
(i) Changes in interest rates can cause interest charges on our variable rate debt, consisting of $482.0 million of revolving debt facilities, to fluctuate.
As described above, an increase of 10%, or approximately 14 basis points, in current interest rates would cause our cash outflows to increase by $0.7 million for fiscal year 2016.
Item 1. Business
70 rewritten, 103 added, 45 removed, 287 unchanged
We are a leading provider of products, services and solutions [removed: to] [added: for] the diagnostics, [removed: research,] [added: food,] environmental, [removed: industrial] [added: industrial, life sciences research] and laboratory services markets.
Through our advanced [removed: technologies, solutions,] [added: technologies] and [removed: services,] [added: differentiated solutions,] we address critical issues that help to improve [removed: the health and safety of people] [added: lives] and the [removed: environment.][added: world around us.]
As of January [removed: 3, 2016,] [added: 1, 2017,] we employed approximately 8,000 employees in our continuing operations.
| • | Achieving significant growth in both of our [added: new] core business segments, [removed: Human Health] [added: Discovery & Analytical Solutions] and [removed: Environmental Health,] [added: Diagnostics,] through strategic acquisitions and licensing; |
The results reported for fiscal year [removed: 2015] [added: 2016] reflect this new alignment of our operating segments.
Financial information in this report relating to fiscal years [removed: 2014] [added: 2015] and [removed: 2013] [added: 2014] has been retrospectively adjusted to reflect this change to our operating segments.
Acquisitions in Fiscal Year [removed: 2015:][added: 2016:]
We completed the acquisition of [removed: five] [added: two] businesses in fiscal year [removed: 2015] [added: 2016] for a total consideration of [removed: $77.1 million,] [added: $72.2 million] in cash.
We reported the operations for [removed: all of] these acquisitions within the results of our [removed: Human Health] [added: Diagnostics] and [removed: Environmental Health] [added: Discovery & Analytical Solutions] segments from the acquisition dates.
During fiscal year [removed: 2015,] [added: 2016,] we recorded pre-tax restructuring charges of [removed: $4.4] [added: $0.6] million in our [removed: Human Health] [added: Diagnostics] segment and [removed: $13.2] [added: $5.9] million in our [removed: Environmental Health] [added: Discovery & Analytical Solutions] segment related to a workforce reduction from restructuring activities.
[added: Our] management approved these plans principally to [removed: realign resources to emphasize growth initiatives and to] focus resources on higher growth [added: product lines and] end markets.
We also recorded pre-tax restructuring reversals of [removed: $2.3] [added: $0.3] million in our [removed: Human Health] [added: Diagnostics] segment and [removed: $3.9] [added: $1.2] million in our [removed: Environmental Health] [added: Discovery & Analytical Solutions] segment related to lower than expected costs associated with workforce reductions.
This pre-tax restructuring activity has been reported as restructuring and contract termination charges and is included as a component of [removed: operating expenses] [added: income] from continuing operations.
We expect no significant impact on future operating results or cash flows from the restructuring activities executed in fiscal year [removed: 2015.][added: 2016.]
The [added: New] Repurchase Program will expire on [removed: October 23, 2016] [added: July 26, 2018] unless terminated earlier by our Board, and may be suspended or discontinued at any time.
During [added: the] fiscal year [removed: 2015,] [added: 2016,] we repurchased [removed: 1.5] [added: 3.2] million shares of common stock in the open market at an aggregate cost of [removed: $72.0] [added: $148.2] million, including commissions, under the Repurchase Program.
As of January [removed: 3, 2016, 5.9] [added: 1, 2017, 8.0] million shares remained available for repurchase under the [added: New] Repurchase Program.
We report our business in two segments: [removed: Human Health] [added: Discovery & Analytical Solutions] and [removed: Environmental Health.][added: Diagnostics.]
Our [removed: Human Health segment] [added: Diagnostics business] generated revenue of [removed: $1,376.6] [added: $602.5] million in fiscal year [removed: 2015.][added: 2016.]
[added: Life Sciences] Research Market:
In the [added: life science] research market, we provide a broad suite of solutions including reagents, [removed: liquid handling systems,] [added: informatics,] and detection and imaging technologies that enable scientists to improve life [removed: sciences] [added: science] research and [added: facilitate the] drug discovery processes.
Our research portfolio includes a wide range of systems consisting of [removed: instrumentation for automation and] [added: imaging,] detection [added: and extraction instrumentation] for use [added: on] in [removed: vitro and] [added: vitro,] ex vivo, [removed: as well as] [added: and] in vivo [removed: imaging and] [added: models,] analysis hardware and software, plus a [added: wide] range of consumable [removed: products, such as] [added: products including] drug discovery and research reagents.
[removed: In addition, our] [added: Our] OneSource laboratory service business is aligned with customers' needs to accelerate science by enabling efficiency gains within their labs.
Our principal products and services for [removed: Human Health] [added: Diagnostics] applications include the following:
| • | The DELFIA® Xpress screening platform, a complete solution for prenatal and maternal health screening, [removed: and] [added: which] includes a fast continuous loading system. It is supported by kits for both first and second trimester analyses for prenatal screening and clinically validated LifeCycle™ software. |
| • | ViaCord® umbilical cord blood banking services for the banking of stem cells harvested from umbilical cord [removed: blood,] [added: blood and cord tissue,] for potential therapeutic [removed: application.] [added: application in transplant and regenerative medicine.] |
| • | Phenoptics™ quantitative pathology research solutions provide oncologists and cancer immunologists a new way to visualize and measure tumor cells and multiple immune-cell phenotypes simultaneously in FFPE tissue by combining the power of [removed: Opal™] [added: Opal®™] multiplexed immunohistochemistry reagents with the Mantra™ or Vectra® 3 Multispectral Imaging System, enabling visualization and analysis of complex cell interactions in ways that are difficult to achieve with other methods. |
| • | Radiometric detection solutions, including over 1,100 [removed: NEN®] radiochemicals [added: NEN] and the Tri-carb®, Quantulus™ GCT families of liquid scintillation analyzers, Wizard2® Gamma counters and MicroBeta2® plate based LSA, are used for beta, gamma and luminescence counting in microplate and vial formats utilized in research, environmental and drug discovery applications. |
| • | A wide range of homogeneous biochemical and cell based assay reagents, including LANCE® Ultra™ and Alpha™ Technology assay platforms [removed: are] used for the detection of drug discovery targets such as G-protein coupled receptors (“GPCR”), kinases, biomarkers and the modification of epigenetic enzymes. |
| • | AlphaScreen®, AlphaLISA® and AlphaPlex® research assays, including over [removed: 200] [added: 500] no-wash biomarker [added: detection] kits for both biotherapeutics and small molecule drug discovery and development in a variety of therapeutic areas including cancer, inflammation, metabolic disorders, neurodegeneration and virology. |
| • | In vivo imaging technologies [added: and reagents] for preclinical research, including the IVIS® Spectrum™ series and the FMT® series for 3D imaging, including the Spectrum™ BL for 2D and 3D optical imaging, and the IVIS® Lumina™ series for 2D [removed: imaging.] [added: imaging, along with a suite of bioluminescent and fluorescent imaging agents, cell lines and dyes.] These technologies are designed to provide for non-invasive longitudinal monitoring of disease progression, cell trafficking and gene expression patterns in living animals and are complemented by a broad portfolio of fluorescent and bioluminescent in vivo imaging reagents that can be useful for identifying, characterizing and quantifying a range of disease biomarkers and therapeutic efficacy in living animal models. |
| • | Quantum GX™ microCT platform is an in vivo microCT scanner that offers industry leading microCT resolution for pre-clinical imaging applications or eight second scan times for higher throughput with lower doses of radiation. With Quantum GX™, 3D data from the [removed: IVIS] [added: IVIS®] and [removed: FMT] [added: FMT®] imaging platforms can be coregistered with microCT. |
| • | Automated liquid handling platforms (JANUS®, Sciclone® and Zephyr®) that offer a choice of [removed: automated] [added: robotic] solutions in genomics, biotherapeutics, high throughput screening and high content analysis to assist life science research from bench to clinic. |
| • | The LabChip [removed: GXII] [added: GXII®] Touch provides a means of characterizing multiple protein product attributes for research labs through QC. |
| • | The [removed: cell::explorer™ and plate::explorer™] [added: cell::explorer®™] automated [removed: workstations allow] [added: workstation allows] integration of multiple laboratory instrumentation using a centralized robotic interface, allowing high throughput and turnkey-application focused solutions. |
| • | High Content Profiler™ powered by TIBCO® Spotfire® [added: technology] provides automated workflows for quality control and hit classification for truly multi-parametric cellular drug screens. |
| • | Licensing for the exclusive, worldwide rights to the TIBCO® Spotfire® software platform in certain scientific research and development markets, and certain clinical markets through an exclusive strategic relationship with [removed: TIBCO®] [added: TIBCO] Software, Inc. |
| • | OneSource® Dashboard, a TIBCO® Spotfire® [added: technology] driven interactive graphical platform provides visibility to a customer’s global asset population, service event and downtime distribution, as well as key performance indicators to assist in asset operation. |
Significant new products introduced or acquired for [removed: Human Health] [added: Diagnostics] applications in fiscal year [removed: 2015] [added: 2016] include the following:
| • | Opal® [added: 4,] 5, 6, and 7 color multiplexed staining kits for amplified detection of immunohistochemistry utilized for multiple biomarker assessment in a single FFPE tumor cross section. |
We realigned our businesses at the beginning of the fourth quarter of fiscal year 2016 to better organize around customer requirements, positioning us to grow in attractive end markets and expand share with our core product offerings.
We created two new reporting segments, Discovery & Analytical Solutions and Diagnostics, which will enable us to deliver improved customer focus, more value-add collaboration and breakthrough innovations.
Our Diagnostics business became a standalone reporting segment targeted towards better meeting the needs of clinically-oriented customers, especially within the growing areas of reproductive health, emerging market diagnostics and applied genomics.
Microfluidics and automation products within our former research business were moved to a new applied genomics group within the Diagnostics segment.
Our former environmental health business and the remaining products within the legacy research business were combined to form our new Discovery & Analytical Solutions reporting segment, focused on better serving and innovating for applications-oriented customers.
Discovery & Analytical Solutions customers span the environmental, food, industrial, life sciences research and laboratory services markets.
We realigned our businesses at the beginning of the fourth quarter of fiscal year 2016 to better organize around customer requirements, positioning us to grow in attractive end markets and expand share with our core product offerings.
We created two new operating segments, Discovery & Analytical Solutions and Diagnostics, which will enable us to deliver improved customer focus, more value-add collaboration and breakthrough innovations.
The acquired businesses were Bioo Scientific Corporation, which was acquired for total consideration of $63.5 million in cash and one other business acquired for a total consideration of $8.8 million in cash.
On July 27, 2016, our Board authorized us to immediately terminate the Repurchase Program and further authorized us to repurchase up to 8.0 million shares of common stock under a new stock repurchase program (the "New Repurchase Program").
No shares remain available for repurchase under the Repurchase Program due to its cancellation.
From January 2, 2017 through February 24, 2017, there were no stock repurchases under the New Repurchase Program.
We realigned our businesses at the beginning of the fourth quarter of the fiscal year 2016 to better position us to grow in attractive end markets and expand share with our core product offerings through an improved customer focus, more value-add collaboration and breakthrough innovations.
The results reported for fiscal year 2016 reflect this new alignment of our operating segments.
Financial information in this report relating to fiscal years 2015 and 2014 has been retrospectively adjusted to reflect the changes in our operating segments.
Discovery & Analytical Solutions Segment
Our comprehensive portfolio of technologies helps life sciences researchers better understand diseases and develop treatments.
In addition, we help accelerate scientists' ability to detect, monitor and manage contaminants and toxic chemicals impacting our environment and food supply.
Food Market:
We provide a variety of solutions that help farmers and food producers provide a growing population with food that is safe, nutritious and appealing.
Our instruments confirm food quality, including the level of moisture in grain or the level of fat
in butter.
Our instruments are also used to detect the presence of potentially dangerous contaminants, such as lead and mercury in milk.
We provide services designed to enable our customers in the laboratory services market throughout the world to increase efficiencies and production time while reducing maintenance costs of their labs.
Environmental, Food & Industrial:
| • | AxION® 2 TOF MS is designed to simplify and streamline virtually any analytical workflow and provides mass accuracy, full spectrum capability, speed, sensitivity, and dynamic range. |
| • | AxION® Direct Sample Analysis (DSA®) is a sample introduction system that enables direct sample analysis with minimal sample preparation and no chromatography. |
| • | The 2400 Series II CHNS/O Elemental Analyzer is one of the leading organic elemental analyzers. It is ideal for the rapid determination of carbon, hydrogen, nitrogen, sulfur, and oxygen content in organic and other types of materials. |
| • | Our thermal analysis family includes DSC series that offers exclusive HyperDSC capability for unparalleled sensitivity and new insights into material processes. |
| • | Our Thermogravimetric (TG) and Simultaneous Thermal Analysis (STA) instruments, which can be coupled to Fourier Transform Infrared (FT-IR), Mass Spectrometry (MS), or Gas Chromatography/Mass Spectrometry (GC/MS) to provide greater analysis power and knowledge. |
| • | Perten's Falling Number and Glutomatic instruments determine the bread baking quality of wheat and flour. |
Life Sciences Research and Laboratory Services:
| • | The Operetta® CLS™ high content analysis system enables scientists to reveal fine sub-cellular details from everyday assays as well as more complex studies, for example using live cells, 3D and stem cells. |
Environmental, Food & Industrial:
| • | The Avio™ 200 is the smallest ICP-OES on the market, offering the lowest argon consumption of any ICP, the fastest ICP startup and the widest linear range with dual viewing technology for use in a variety of labs. |
| • | QSight Triple Quad LC/MS/MS is a flow-based mass spectrometry system that provides high sensitivity and enables high levels of efficiency and productivity to meet both standard and regulatory requirements. |
| • | The Delta range of milk quality analyzers help ensure the quality of dairy products and are used at Central Milk Testing labs as well as dairy processing facilities around the world. |
| • | The Bioo Scientific test kits for detection of toxins, veterinary drug residues and contaminants enable rapid and easy testing at different steps in the food value chain. |
Life Sciences Research:
| • | The Operetta® CLS™ high content analysis system enables scientists to reveal fine sub-cellular details from everyday assays as well as more complex studies, for example using live cells, 3D and stem cells. |
We realigned our organization at the beginning of fiscal year 2015 to enable us to both deliver complete solutions targeted towards certain end markets and develop value-added applications and solutions to foster further expansion of those markets.
OneSource, our multivendor laboratory service business that serves the life sciences end market, was moved from our Environmental Health segment into our Human Health segment.
The acquired businesses included Vanadis Diagnostics AB (“Vanadis”), which was acquired for total consideration of $35.1 million in cash, as further described in Note 21 to our consolidated financial statements included in this annual report on Form 10-K, and other acquisitions for an aggregate consideration of $42.0 million in cash.
We have a potential obligation to pay the shareholders of Vanadis additional contingent consideration of up to $93.0 million, which at closing had an estimated fair value of $56.9 million.
Our
In fiscal year 2015, we also recorded a pre-tax restructuring charge of $2.0 million in our Human Health segment relating to the closure of excess facility space and a pre-tax restructuring charge of $0.1 million in our Environmental Health segment primarily as a result of terminating various contractual commitments.
From January 4, 2016 through February 25, 2016, we repurchased 2.4 million shares of common stock in the open market at an aggregate cost of $109.7 million, including commissions, under the Repurchase Program.
We performed our annual impairment testing on January 1, 2015, the annual impairment date for our reporting units, and based on the first step of the impairment process (the comparison of the fair value to the carrying value of the reporting unit to determine if the carrying value exceeds the fair value), we concluded that there was no goodwill impairment.
Human Health Segment
Our Human Health segment concentrates on developing diagnostics, tools and applications to help detect diseases earlier and more accurately and to accelerate the discovery and development of critical new therapies.
Within our Human Health segment, we serve the diagnostics and research markets.
Research:
| • | The Operetta® high content imaging system is used to automate imaging and analysis for cell-based assays for drug discovery and basic cellular science research laboratories. |
Environmental Health Segment
Our Environmental Health segment provides products, services and solutions to facilitate a cleaner and safer environment, including the creation of secure food and consumer products.
We provide a variety of solutions that confirm food quality, including the level of moisture in grain or detecting the presence of potentially dangerous contaminants, such as lead and mercury in milk.
We have approximately 1,200 service personnel in our Environmental Health segment to support our customers in the laboratory services market throughout the world and to help them improve the productivity of their labs.
| • | The Flexar™ series of liquid chromatography and mass spectrometry instruments are controlled by the Chromera® chromatography data system and incorporate an ergonomic industrial design to deliver a wide range of pressure and detector options to address the application needs of high pressure liquid chromatography laboratories. These systems are used to identify and quantify compounds for applications in the environmental, food, beverage, and pharmaceutical industries. |
| • | The PinAAcle® 500 is a fully-integrated, flame-only atomic absorption spectrometer that can be coupled with a FAST Flame sample automation accessory and is used by laboratories to determine elemental content of a sample. |
| • | The Spotlight™ FT-IR Microscope System, a high performance microscopy platform, designed for scientists whose samples demand high sensitivity and simple analysis and workflows, for use in product defect analysis, impurity identification, forensics and academic research. |
| • | The LAMBDA™ 265 365 465 UV/Vis Systems benchtop UV/Vis instruments offering a variety of spectral bandwidths to accommodate a wide range of analytical functions related to materials testing, QA/QC and R&D. |
| • | The Perten® DA 7250 NIR Analyzer, a diode array based NIR instrument that analyzes samples of grains, flakes, pellet powders, pastes, slurries and liquids and can determine moisture, protein, fat, ash, starch and many other parameters. |
Our Environmental Health segment offers additional products under various brand names, including Altus®, AAnalyst™, Chromera®, Clarus®, DairyGuard™, Flexar™, Frontier™, HyperDSC®, LAMBDA™, NexION®, OilExpress™, OilPrep™, Optima™, Perten®, PinAAcle®, Spectrum™, Spectrum Two™, Spotlight™, Supra-clean®, Supra-d™, Supra-poly®, Torion® and Ultraspray®.
During fiscal year 2013, we accrued an additional $5.7 million related to a particular site for increased monitoring and mitigation activities, of which $4.6 million was recorded in the fourth quarter of fiscal year 2013.
| Human Health | | | | | | | | | | | |
| Product revenue | $ | 976,451 | | | $ | 996,767 | | | $ | 957,022 | |
| Service revenue | 400,193 | | | | 387,456 | | | | 368,872 | | |
| Total revenue | 1,376,644 | | | | 1,384,223 | | | | 1,325,894 | | |
| Operating income from continuing operations(1) | 251,743 | | | | 233,689 | | | | 168,794 | | |
| Environmental Health | | | | | | | | | | | |
| Product revenue | 576,187 | | | | 543,308 | | | | 541,048 | | |
| Service revenue | 309,528 | | | | 309,688 | | | | 290,644 | | |
| Total revenue | 885,715 | | | | 852,996 | | | | 831,692 | | |
| Operating income from continuing operations | 89,544 | | | | 95,605 | | | | 84,710 | | |
| Operating loss from continuing operations(2)(3) | (55,153 | | ) | | (118,552 | | ) | | (25,710 | | ) |
| Product revenue | $ | 1,552,638 | | | $ | 1,540,075 | | | $ | 1,498,070 | |
| Total revenue | 2,262,359 | | | | 2,237,219 | | | | 2,157,586 | | |
| Operating income from continuing operations | 286,134 | | | | 210,742 | | | | 227,794 | | |
| (1) | Legal costs for a particular case in our Human Health segment were $0.8 million for fiscal year 2015. We also recognized a $0.2 million pre-tax impairment charge in our Human Health segment in fiscal year 2013. Both of these items have been included in operating income from continuing operations in our Human Health segment. |
| Human Health | $ | 81,335 | | | $ | 92,604 | | | $ | 100,941 | | | $ | 16,091 | | | $ | 16,922 | | | $ | 22,999 | |
An excerpt. Shown here: 40 of 70 rewritten, 40 of 103 added and 40 of 45 removed. The counts are complete. For every sentence, read Item 1. Business in the FY2017 filing and the FY2016 filing.
Item 3. Legal Proceedings
1 rewritten, 0 added, 0 removed, 4 unchanged
Although we have established accruals for potential losses that we believe are probable and reasonably estimable, in the opinion of our management, based on its review of the information available at this time, the total cost of resolving these contingencies at January [removed: 3, 2016] [added: 1, 2017] should not have a material adverse effect on our consolidated financial statements included in this annual report on Form 10-K.
Cover and table of contents
24 rewritten, 2 added, 2 removed, 69 unchanged
| | For the fiscal year ended January [removed: 3, 2016] [added: 1, 2017] |
The aggregate market value of the common stock, $1 par value per share, held by non-affiliates of the registrant on [removed: June 26, 2015,] [added: July 1, 2016,] was [removed: $6,101,934,638] [added: $5,650,129,129] based upon the last reported sale of [removed: $54.29] [added: $52.66] per share of common stock on [removed: June 26, 2015.][added: July 1, 2016.]
As of February [removed: 25, 2016,] [added: 24, 2017,] there were outstanding [removed: 109,789,094] [added: 109,787,006] shares of common stock, $1 par value per share.
Portions of PerkinElmer, Inc.’s Definitive Proxy Statement for its Annual Meeting of Shareholders to be held on April [removed: 26, 2016] [added: 25, 2017] are incorporated by reference into Part III of this Form 10-K.
| Item 1. | [removed: [Business](#s0E7E15547EE2F012668D0412EB621F8F)] [added: [Business](#s19CBC994CAB8AEA75A3D72E38282CF7C)] | [removed: [3](#s0E7E15547EE2F012668D0412EB621F8F)] [added: [3](#s19CBC994CAB8AEA75A3D72E38282CF7C)] |
| Item 1A. | [Risk [removed: Factors](#s023FA28BF6B5EFDCEC2904130144A2B3)] [added: Factors](#s5A12682F28A50DC08B9572E3D8DE3473)] | [removed: [12](#s023FA28BF6B5EFDCEC2904130144A2B3)] [added: [13](#s5A12682F28A50DC08B9572E3D8DE3473)] |
| Item 1B. | [Unresolved Staff [removed: Comments](#s5DE3686CBEE38EEEC30A04130150E7D2)] [added: Comments](#s84609FE9687A557C9FDC72E3D901F150)] | [removed: [19](#s5DE3686CBEE38EEEC30A04130150E7D2)] [added: [20](#s84609FE9687A557C9FDC72E3D901F150)] |
| Item 2. | [removed: [Properties](#sFB6FEE77095CB2F111F50412EDA816BD)] [added: [Properties](#sAC06F3049FDEB3DE64CE72E39BAF48E7)] | [removed: [19](#sFB6FEE77095CB2F111F50412EDA816BD)] [added: [20](#sAC06F3049FDEB3DE64CE72E39BAF48E7)] |
| Item 3. | [Legal [removed: Proceedings](#sAEA751E397B06BD7BBA2041301A282CC)] [added: Proceedings](#s6B943C1415382508FA0972E3D953CDFB)] | [removed: [19](#sAEA751E397B06BD7BBA2041301A282CC)] [added: [20](#s6B943C1415382508FA0972E3D953CDFB)] |
| Item 4. | [Mine Safety [removed: Disclosures](#sBAD8AF3ED9FAD6237F48041301D39823)] [added: Disclosures](#s43C063956B58BCB2DD1D72E3D984B47E)] | [removed: [19](#sBAD8AF3ED9FAD6237F48041301D39823)] [added: [20](#s43C063956B58BCB2DD1D72E3D984B47E)] |
| Item 5. | [Market for Registrant’s Common Equity, Related Stockholder Matters and Issuer Purchases of Equity [removed: Securities](#sF8924703494CA5860BD70412ED28A1FE)] [added: Securities](#s84BF7924FEA92FC2E23F72E3848699C5)] | [removed: [22](#sF8924703494CA5860BD70412ED28A1FE)] [added: [23](#s84BF7924FEA92FC2E23F72E3848699C5)] |
| Item 6. | [Selected Financial [removed: Data](#s8FBD0E29DB4102618DF90412EC0B5041)] [added: Data](#sF120F3FE4A9B4AD9A4CE72E37C0BC0CD)] | [removed: [25](#s8FBD0E29DB4102618DF90412EC0B5041)] [added: [25](#sF120F3FE4A9B4AD9A4CE72E37C0BC0CD)] |
| Item 7. | [Management’s Discussion and Analysis of Financial Condition and Results of [removed: Operations](#sAF4E68A86799C1E1B690041302A7FEBC)] [added: Operations](#sD202535887AD2699BC7972E3DA4C8FC4)] | [removed: [28](#sAF4E68A86799C1E1B690041302A7FEBC)] [added: [28](#sD202535887AD2699BC7972E3DA4C8FC4)] |
| Item 7A. | [Quantitative and Qualitative Disclosures About Market [removed: Risk](#s95730A5360E7B1974A92041304E7E7A4)] [added: Risk](#sDB9ED5CBF56A61A8F3E072E3E0EF7EE3)] | [removed: [50](#s95730A5360E7B1974A92041304E7E7A4)] [added: [51](#sDB9ED5CBF56A61A8F3E072E3E0EF7EE3)] |
| Item 8. | [Financial Statements and Supplemental [removed: Data](#s45424465B4D328CD91DD041304FDF967)] [added: Data](#sDC56D6159BADA9EB10D672E3E2FE1081)] | [removed: [53](#s45424465B4D328CD91DD041304FDF967)] [added: [54](#sDC56D6159BADA9EB10D672E3E2FE1081)] |
| Item 9. | [Changes in and Disagreements with Accountants on Accounting and Financial [removed: Disclosure](#sAA99C31206EA962AA3C504130C1DC57E)] [added: Disclosure](#s26D3D0A618CBECDCAA7972E4383478A0)] | [removed: [102](#sAA99C31206EA962AA3C504130C1DC57E)] [added: [109](#s26D3D0A618CBECDCAA7972E4383478A0)] |
| Item 9A. | [Controls and [removed: Procedures](#s346351C5C2CE818B347F04130C3FCA7B)] [added: Procedures](#sF5B22D364EDAFDE0ACE572E43A2F963D)] | [removed: [103](#s346351C5C2CE818B347F04130C3FCA7B)] [added: [109](#sF5B22D364EDAFDE0ACE572E43A2F963D)] |
| Item 9B. | [Other [removed: Information](#sDFBC282FAA947FCDEF7504130C5EF0C8)] [added: Information](#s8F2A93095CA2CC41598972E43C3270BB)] | [removed: [105](#sDFBC282FAA947FCDEF7504130C5EF0C8)] [added: [111](#s8F2A93095CA2CC41598972E43C3270BB)] |
| Item 10. | [Directors, Executive Officers and Corporate [removed: Governance](#sD13B95A28BEE84D93CD104130CB29C32)] [added: Governance](#s558D7B0262739431469172E4401EF087)] | [removed: [106](#sD13B95A28BEE84D93CD104130CB29C32)] [added: [112](#s558D7B0262739431469172E4401EF087)] |
| Item 11. | [Executive [removed: Compensation](#s34CA09E9DC5D9CAB65E104130CE63391)] [added: Compensation](#s2AC1892FD0096599676472E4421A207B)] | [removed: [106](#s34CA09E9DC5D9CAB65E104130CE63391)] [added: [112](#s2AC1892FD0096599676472E4421A207B)] |
| Item 12. | [Security Ownership of Certain Beneficial Owners and Management and Related Stockholder [removed: Matters](#s5456BCB9D5DB0A08D3D804130D069BCD)] [added: Matters](#s53CF88F1D2A4DA73023C72E444100B55)] | [removed: [106](#s5456BCB9D5DB0A08D3D804130D069BCD)] [added: [112](#s53CF88F1D2A4DA73023C72E444100B55)] |
| Item 13. | [Certain Relationships and Related Transactions, and Director [removed: Independence](#s39561B0292BC4EAAB25304130D38DFF8)] [added: Independence](#s13217677149614918B8E72E4460D18E1)] | [removed: [106](#s39561B0292BC4EAAB25304130D38DFF8)] [added: [112](#s13217677149614918B8E72E4460D18E1)] |
| Item 14. | [Principal Accountant Fees and [removed: Services](#s837EEC67BA363F8925EE04130D5902C7)] [added: Services](#sC277D3C8826FB4B4E0E272E44808773F)] | [removed: [107](#s837EEC67BA363F8925EE04130D5902C7)] [added: [113](#sC277D3C8826FB4B4E0E272E44808773F)] |
| Item 15. | [Exhibits and Financial Statement [removed: Schedules](#sE3EECAEF7FB105B00DB70412ED778321)] [added: Schedules](#s59FF00F1CC6E1092FDD072E3868BB0C1)] | [removed: [108](#sE3EECAEF7FB105B00DB70412ED778321)] [added: [114](#s59FF00F1CC6E1092FDD072E3868BB0C1)] |
10-K 1 pki0101201710k.htm 10-K
| [Signatures](#s960B8BD80944B3F493A372E44E23C2F3) | | [119](#s960B8BD80944B3F493A372E44E23C2F3) |
10-K 1 pki-0103201610k.htm 10-K
| [Signatures](#sE65EC7DC61E30777195A04130DE06384) | | [113](#sE65EC7DC61E30777195A04130DE06384) |
Item 2. Properties
6 rewritten, 3 added, 3 removed, 9 unchanged
As of January [removed: 3, 2016,] [added: 1, 2017,] our continuing operations occupied [removed: 2,539,386] [added: 2,566,797] square feet in over [removed: 126] [added: 121] locations.
We own [removed: 318,601] [added: 317,809] square feet of this space, and lease the balance.
We conduct our operations in manufacturing and assembly plants, research laboratories, administrative offices and other facilities located in [removed: 15] [added: 16] states and [removed: 36] [added: 31] foreign countries.
Facilities outside of the United States account for approximately [removed: 1,548,497] [added: 1,438,823] square feet of our owned and leased property, or approximately [removed: 60%] [added: 56%] of our total occupied space.
The following table indicates, as of January [removed: 3, 2016,] [added: 1, 2017,] the approximate square footage of real property owned and leased attributable to the continuing operations of our reporting segments:
| Corporate offices | — | | | [removed: 60,307] [added: 55,342] | | | [removed: 60,307] [added: 55,342] | |
| Discovery & Analytical Solutions | 105,020 | | | 1,561,535 | | | 1,666,555 | |
| Diagnostics | 212,789 | | | 632,111 | | | 844,900 | |
| Continuing operations | 317,809 | | | 2,248,988 | | | 2,566,797 | |
| Human Health | 305,620 | | | 1,177,378 | | | 1,482,998 | |
| Environmental Health | 12,981 | | | 983,100 | | | 996,081 | |
| Continuing operations | 318,601 | | | 2,220,785 | | | 2,539,386 | |
Item 4. Mine Safety Disclosures
15 rewritten, 23 added, 11 removed, 47 unchanged
Listed below are our executive officers as of [removed: March 1, 2016.][added: February 28, 2017.]
| Robert F. Friel | | Chairman, Chief Executive Officer and President | | [removed: 60] [added: 61] |
| Frank A. Wilson | | Senior Vice President and Chief Financial Officer | | [removed: 57] [added: 58] |
| Joel S. Goldberg | | Senior Vice President, Administration, General Counsel and Secretary | | [removed: 47] [added: 48] |
| James Corbett | | [removed: Senior] [added: Executive] Vice President and President, [removed: Human Health] [added: Discovery & Analytical Solutions] | | [removed: 53] [added: 54] |
| Daniel R. Tereau | | Senior Vice President, Strategy and Business Development | | [removed: 49] [added: 50] |
| Andrew Okun | | Vice President and Chief Accounting Officer | | [removed: 46] [added: 47] |
Previously, Mr. Wilson worked for several years at AlliedSignal Inc., now Honeywell International, where he last served as Vice President of Finance and Chief Financial Officer for Commercial [removed: Aviations] [added: Aviation] Systems.
James Corbett, [removed: 53.][added: 54.]
Mr. Corbett also serves on the national board of trustees for the March of Dimes [removed: Foundation.][added: Foundation and on the board of directors for the Analytical, Life Science & Diagnostics Association.]
Mr. Tereau was appointed Senior Vice President, Strategy and Business Development in January 2016 and [removed: has been] [added: had joined the Company in April 2014 as] a Vice President, Strategy and Business [removed: Development since he joined PerkinElmer in April 2014.][added: Development.]
Prior to joining PerkinElmer, Mr. Tereau served on Novartis’ leadership team as Senior Vice President and Global Head of Strategy, Business Development and [removed: Licensing,] [added: Licensing from 2011 to 2014,] where he was responsible for global strategy and business development for the Consumer Health division.
[added: Prior to 2011,] Mr. Tereau held similar roles at Thermo Fisher Scientific and GE Healthcare.
Mr. Tereau holds a Bachelor of Science degree in finance from Ferris State [removed: University and] [added: University,] a Juris Doctorate from Wayne State University, and earned his Master of Business Administration from Yale University.
Andrew Okun, [removed: 46.][added: 47.]
| Prahlad Singh | | Senior Vice President and President, Diagnostics | | 52 |
| Deborah Butters | | Senior Vice President, Chief Human Resources Officer | | 47 |
Friel, 61.
Wilson, 58.
Goldberg, 48.
Mr. Corbett was appointed President of our Discovery & Analytical Solutions business and Executive Vice President of PerkinElmer in October 2016.
Prahlad Singh, 52.
Mr. Singh joined PerkinElmer as the President of our Diagnostics business in May 2014.
He has been a Senior Vice President and officer of PerkinElmer since September 2016.
Prior to joining PerkinElmer, Mr. Singh was General Manager of GE Healthcare’s Women’s Health Business from 2012 to 2014.
In this role, he had worldwide responsibility for GE Healthcare’s Mammography and Bone Densitometry businesses.
Before that, Mr. Singh held senior executive level roles in Strategy, Business Development and Mergers & Acquisitions at both GE Healthcare from 2011 to 2012 and Philips Healthcare from 2007 to 2011.
From 1995 to 2007, he held leadership roles of increasing responsibility at DuPont Pharmaceuticals and subsequently Bristol Myers Squibb Medical Imaging which included managing the Asia Pacific and Middle East region.
Mr. Singh holds a doctoral degree in chemistry from the University of Missouri-Columbia and a Master of Business Administration from Northeastern University.
His research work has resulted in several issued patents and publications in peer reviewed journals.
Tereau, 50.
Deborah Butters, 47.
Ms. Butters joined PerkinElmer in July 2016 as Senior Vice President, Chief Human Resources Officer.
Prior to joining us, she served as Head of North America Human Resources at IBM, where she led all aspects of the Human Resource function for IBM’s largest geography, which included 35,000 employees and was responsible for over $30B of IBM’s revenue.
During her 17 year career there, she significantly helped shape IBM’s HR programs and practices, including leading its enterprise-wide, people transformation strategy to optimize employee engagement and business performance.
Ms. Butters was with Lotus Development for eight years prior to its acquisition by IBM.
Ms. Butters’ experiences working in the United Kingdom and Germany for Lotus Development, and in Switzerland and the United States for IBM, ranged from leading functional roles across workforce planning and talent management, to serving in five HR business partner roles in both software and consulting within IBM and Lotus Development, with the largest being IBM’s North America Consulting business.
Ms. Butters holds a Bachelor of Science degree from the University of Bath and a diploma in Human Resources from London University.
| Jon DiVincenzo | | Senior Vice President and President, Environmental Health | | 50 |
Friel, 60.
Wilson, 57.
Goldberg, 47.
Jon DiVincenzo, 50.
Mr. DiVincenzo was appointed Senior Vice President and President of our Environmental Health business in November 2013.
Prior to joining us, Mr. DiVincenzo served as the President and Chief Executive Officer of Enzymatics, now a part of Qiagen, a provider of molecular biology reagents, from 2012 to 2013.
He previously worked at Millipore for 18 years, where he last served as President of the Bioscience division and also led the company's Lab Water business.
Mr. DiVincenzo holds a Bachelor of Science in mechanical engineering from Northeastern University where he currently serves on the College of Engineering's Advisory Council.
He is also a member of the Corporate Executive Board for Innovation and member of the Board of Directors of the Analytical Life Sciences and Diagnostics Association.
Tereau, 49.
Item 5. Market for Registrant’s Common Equity, Related Stockholder Matters and Issuer Purchases of Equity Securities
9 rewritten, 7 added, 19 removed, 37 unchanged
The following table sets forth the high and low per share closing sale prices for our common stock on that exchange for each quarter in fiscal years [removed: 2015] [added: 2016] and [removed: 2014.][added: 2015.]
| | [removed: 2014] [added: 2016] Fiscal Quarters | | | | | | | | | | | | | | |
As of February [removed: 25, 2016,] [added: 24, 2017,] we had approximately [removed: 4,263] [added: 4,079] holders of record of our common stock.
During fiscal years [removed: 2015] [added: 2016] and [removed: 2014,] [added: 2015,] we declared regular quarterly cash dividends on our common stock.
| | [removed: 2014] [added: 2016] Fiscal Quarters | | | | | | | | | | | | | | | | [removed: 2014] [added: 2016] Total | | |
Set forth below is a line graph comparing the cumulative total shareholder return on our common stock against the cumulative total return of the S&P Composite-500 Index and a Peer Group Index for the five fiscal years from January [removed: 2, 2011] [added: 1, 2012] to January [removed: 3, 2016.][added: 1, 2017.]
Our Peer Group Index consists of [removed: Affymetrix, Inc.,] Agilent Technologies Inc., Thermo Fisher Scientific [removed: Inc.,] [added: Inc. ("Thermo Fisher"),] and Waters Corporation.
[removed: ][added: 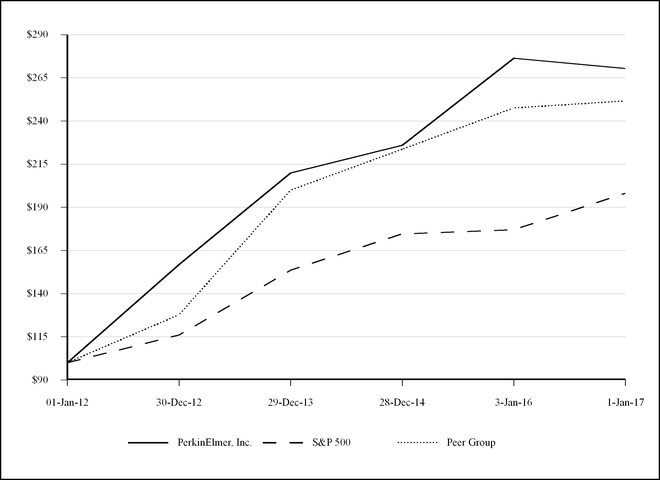]
| | [removed: 02-Jan-11 | | | |] 01-Jan-12 | | | | 30-Dec-12 | | | | 29-Dec-13 | | | | 28-Dec-14 | | | | 3-Jan-16 | | | [added: | 1-Jan-17 | | |]
| High | | $53.01 | | | | $55.56 | | | | $56.92 | | | | $56.43 | |
| Low | 41.45 | | | | 48.58 | | | | 51.94 | | | | 49.95 | | |
We did not repurchase any of our common stock under our share repurchase program during the fourth quarter of fiscal year 2016.
The peer group is the same as the peer group used in the stock performance graph in our Annual Report on Form 10-K for the fiscal year ended January 3, 2016, except that it does not include Affymetrix, Inc., which has been excluded due to its acquisition by Thermo Fisher during fiscal year 2016.
| PerkinElmer, Inc. | $ | 100.00 | | | $ | 156.82 | | | $ | 209.82 | | | $ | 226.00 | | | $ | 276.32 | | | $ | 270.47 | |
| S&P 500 Index | $ | 100.00 | | | $ | 116.00 | | | $ | 153.58 | | | $ | 174.60 | | | $ | 177.01 | | | $ | 198.18 | |
| Peer Group | $ | 100.00 | | | $ | 127.78 | | | $ | 199.93 | | | $ | 223.68 | | | $ | 247.56 | | | $ | 251.59 | |
| High | | $46.21 | | | | $47.52 | | | | $48.25 | | | | $45.76 | |
| Low | 40.94 | | | | 41.97 | | | | 43.51 | | | | 39.83 | | |
The following table provides information with respect to the shares of common stock repurchased by us for the periods indicated.
| | | | | | | | | | | | | |
| --- | --- | --- | --- | --- | --- | --- | --- | --- | --- | --- | --- | --- |
| | Issuer Repurchases of Equity Securities | | | | | | | | | | | |
| Period | Total Number of Shares Purchased(1)(2) | | | Average Price Paid Per Share | | | | Total Number of Shares Purchased as Part of Publicly Announced Plans or Programs | | | Maximum Number of Shares that May Yet Be Purchased Under the Plans or Programs | |
| October 5, 2015—November 1, 2015 | 496 | | | $ | 47.16 | | | — | | | 5,900,000 | |
| November 2, 2015—November 29, 2015 | 1,523 | | | 50.96 | | | | — | | | 5,900,000 | |
| November 30, 2015—January 3, 2016 | 3,552 | | | 50.80 | | | | — | | | 5,900,000 | |
| Activity for quarter ended January 3, 2016 | 5,571 | | | $ | 50.52 | | | — | | | 5,900,000 | |
____________________________
| | |
| --- | --- |
| (1) | On October 23, 2014, our Board authorized us to repurchase up to 8.0 million shares of common stock under a stock repurchase program (the "Repurchase Program"). The Repurchase Program will expire on October 23, 2016 unless terminated earlier by our Board, and may be suspended or discontinued at any time. During the fourth quarter of fiscal year 2015, we did not repurchase shares of common stock in the open market. As of January 3, 2016, 5.9 million shares remained available for repurchase under the Repurchase Program. From January 4, 2016 through February 25, 2016, we repurchased 2.4 million shares of common stock in the open market at an aggregate cost of $109.7 million, including commissions, under the Repurchase Program. |
| (2) | Our Board has authorized us to repurchase shares of common stock to satisfy minimum statutory tax withholding obligations in connection with the vesting of restricted stock awards and restricted stock unit awards granted pursuant to our equity incentive plans and to satisfy obligations related to the exercise of stock options made pursuant to our equity incentive plans. During the fourth quarter of fiscal year 2015, we repurchased 5,571 shares of common stock for this purpose. The repurchased shares have been reflected as additional authorized but unissued shares, with the payments reflected in common stock and capital in excess of par value. |
| PerkinElmer, Inc. | $ | 100.00 | | | $ | 78.38 | | | $ | 122.92 | | | $ | 164.45 | | | $ | 177.14 | | | $ | 216.58 | |
| S&P 500 Index | $ | 100.00 | | | $ | 102.11 | | | $ | 118.45 | | | $ | 156.82 | | | $ | 178.29 | | | $ | 180.75 | |
| Peer Group | $ | 100.00 | | | $ | 84.52 | | | $ | 107.65 | | | $ | 169.08 | | | $ | 189.24 | | | $ | 209.25 | |
Item 6. Selected Financial Data
25 rewritten, 12 added, 10 removed, 40 unchanged
The following table sets forth selected historical financial information as of and for each of the fiscal years in the five-year period ended January [removed: 3, 2016.][added: 1, 2017.]
We derived the selected historical financial information for the balance sheets for the fiscal years ended January [added: 1, 2017 and January] 3, 2016 and [removed: December 28, 2014 and] the statement of operations for each of the fiscal years in the three-year period ended January [removed: 3, 2016] [added: 1, 2017] from our audited consolidated financial statements which are included elsewhere in this annual report on Form 10-K.
We derived the selected historical financial information for the statements of operations for the fiscal years ended December [removed: 30, 2012] [added: 29, 2013] and [removed: January 1,] [added: December 30,] 2012 from our audited consolidated financial statements which are not included in this annual report on Form 10-K.
We derived the selected historical financial information for the balance sheets as of December [added: 28, 2014, December] 29, [removed: 2013,] [added: 2013 and] December 30, 2012 [removed: and January 1, 2012] from our audited consolidated financial statements which are not included in this annual report on Form 10-K.
| | January [added: 1, 2017 | | | | January] 3, 2016 | | | | December 28, 2014 | | | | December 29, 2013 | | | | December 30, 2012 | | | [removed: | January 1, 2012 | | |]
| Interest and other expense, net(4) | [removed: 42,119] [added: 38,998] | | | | [removed: 41,139] [added: 42,119] | | | | [removed: 64,110] [added: 41,139] | | | | [removed: 47,956] [added: 64,110] | | | | [removed: 26,774] [added: 47,956] | | |
| [removed: (Loss on) income] [added: Income] from discontinued operations and dispositions, net of income [removed: taxes(6)] [added: taxes(6)(7)] | [removed: (263] [added: 18,593] | | [removed: )] | | [removed: (3,388] [added: 23,640] | | [removed: )] | | [removed: (7,055] [added: 27,639] | | [removed: )] | | [removed: (1,349] [added: 25,006] | | [removed: )] | | [removed: 4,272] [added: 33,586] | | |
| Net income | $ | [removed: 212,425] [added: 234,299] | | | $ | [removed: 157,778] [added: 212,425] | | | $ | [removed: 167,212] [added: 157,778] | | | $ | [removed: 69,940] [added: 167,212] | | | $ | [removed: 7,655] [added: 69,940] | |
| Net income | $ | [removed: 1.89] [added: 2.14] | | | $ | [removed: 1.40] [added: 1.89] | | | $ | [removed: 1.49] [added: 1.40] | | | $ | [removed: 0.61] [added: 1.49] | | | $ | [removed: 0.07] [added: 0.61] | |
| Net income | $ | [removed: 1.87] [added: 2.12] | | | $ | [removed: 1.39] [added: 1.87] | | | $ | [removed: 1.47] [added: 1.39] | | | $ | [removed: 0.61] [added: 1.47] | | | $ | [removed: 0.07] [added: 0.61] | |
| Basic: | [removed: 112,507] [added: 109,478] | | | | [removed: 112,593] [added: 112,507] | | | | [removed: 112,254] [added: 112,593] | | | | [removed: 113,728] [added: 112,254] | | | | [removed: 112,976] [added: 113,728] | | |
| Diluted: | [removed: 113,315] [added: 110,313] | | | | [removed: 113,739] [added: 113,315] | | | | [removed: 113,503] [added: 113,739] | | | | [removed: 114,860] [added: 113,503] | | | | [removed: 113,864] [added: 114,860] | | |
| Total [removed: assets(6)(7)] [added: assets(6)] | $ | [removed: 4,166,295] [added: 4,276,683] | | | $ | [removed: 4,127,576] [added: 4,166,295] | | | $ | [removed: 3,940,882] [added: 4,127,576] | | | $ | [removed: 3,894,451] [added: 3,940,882] | | | $ | [removed: 3,847,130] [added: 3,894,451] | |
| Short-term debt | [removed: 1,123] [added: 1,172] | | | | [removed: 1,075] [added: 1,123] | | | | [removed: 2,624] [added: 1,075] | | | | [removed: 1,772] [added: 2,624] | | | | [removed: —] [added: 1,772] | | |
| Long-term [removed: debt(4)(7)(8)] [added: debt(4)(8)] | [removed: 1,011,762] [added: 1,045,254] | | | | [removed: 1,045,393] [added: 1,011,762] | | | | [removed: 926,274] [added: 1,045,393] | | | | [removed: 931,513] [added: 926,274] | | | | [removed: 936,397] [added: 931,513] | | |
| Stockholders’ equity(1)(9) | [removed: 2,110,441] [added: 2,153,570] | | | | [removed: 2,042,102] [added: 2,110,441] | | | | [removed: 1,994,487] [added: 2,042,102] | | | | [removed: 1,939,812] [added: 1,994,487] | | | | [removed: 1,842,216] [added: 1,939,812] | | |
| Common shares outstanding(9) | [removed: 112,034] [added: 109,617] | | | | [removed: 112,481] [added: 112,034] | | | | [removed: 112,626] [added: 112,481] | | | | [removed: 115,036] [added: 112,626] | | | | [removed: 113,157] [added: 115,036] | | |
| (1) | Activity related to the mark-to-market adjustment on postretirement benefit plans was a pre-tax loss of [removed: $12.4] [added: $15.3] million in fiscal year [removed: 2015,] [added: 2016,] a pre-tax loss of [removed: $75.9] [added: $12.4] million in fiscal year [removed: 2014,] [added: 2015, a] pre-tax [removed: income] [added: loss] of [removed: $17.6] [added: $75.4] million in fiscal year [removed: 2013,] [added: 2014,] a pre-tax [removed: loss] [added: income] of [removed: $31.8] [added: $17.6] million in fiscal year [removed: 2012] [added: 2013] and a pre-tax loss of [removed: $67.9] [added: $31.3] million in fiscal year [removed: 2011.] [added: 2012.] |
| (2) | We recorded pre-tax restructuring and contract termination charges, net, of [removed: $13.6] [added: $5.1] million in fiscal year [removed: 2015, $13.4] [added: 2016, $13.5] million in fiscal year [removed: 2014, $33.9] [added: 2015, $13.3] million in fiscal year [removed: 2013, $25.1] [added: 2014, $33.5] million in fiscal year [removed: 2012] [added: 2013] and [removed: $13.4] [added: $25.0] million in fiscal year [removed: 2011.] [added: 2012.] |
| (3) | In fiscal year 2013, we recorded pre-tax impairment charges of $0.2 million as the carrying amounts of certain long-lived assets were not recoverable and exceeded their fair value. In fiscal year 2012, we recorded pre-tax impairment charges of $74.2 million as a result of a review of certain of our trade names within our portfolio as part of a realignment of our marketing strategy. [removed: In fiscal year 2011, we recorded a pre-tax impairment charge of $3.0 million for the full impairment of license agreements that we no longer intend to use.] |
| (4) | In fiscal years [added: 2016,] 2015, 2014, [removed: 2013, 2012] [added: 2013] and [removed: 2011,] [added: 2012,] interest expense was [added: $41.5 million,] $38.0 million, $36.3 million, $49.9 [removed: million, $45.8] million and [removed: $24.8] [added: $45.8] million, respectively. In fiscal year 2013, we redeemed all of our 6% senior unsecured notes due in 2015 (the “2015 Notes”) that included a prepayment premium of $11.1 million, which is included in other expense, net, the write-off of $2.8 million for the remaining unamortized derivative losses for previously settled cash flow hedges, which is included in interest expense, and the write-off of $0.2 million for the remaining deferred debt issuance costs, which is included in interest expense. [removed: During fiscal year 2011, acquisition related financing costs added an additional expense of $3.1 million, which is included in interest expense, and interest expense was lower due to less debt outstanding throughout the year.] |
| (5) | [removed: The] [added: In] fiscal [removed: year 2015 effective] [added: years 2016 and 2015, provision for income] tax [removed: rate] on continuing operations [removed: of 12.8%] was [added: $28.4 million and $20.0 million, respectively. The higher provision for income taxes in fiscal year 2016 was] primarily due to higher income in higher tax rate jurisdictions, partially offset by [removed: a] [added: an increase in] tax benefit of [removed: $7.2] [added: $3.2] million related to discrete [removed: items. The] [added: items from $6.4 million in] fiscal year [removed: 2014 effective] [added: 2015 to $9.6 million in fiscal year 2016. In fiscal years 2014, 2013 and 2012,] tax [removed: rate] [added: benefit] on continuing operations [removed: of 5.0%] was [added: $6.3 million, $25.5 million and $32.8 million, respectively. The benefit from income taxes in fiscal year 2014 was] primarily due to [removed: income in lower tax rate jurisdictions, partially offset by] losses in higher tax rate jurisdictions and a tax benefit of [removed: $7.0] [added: $7.1] million related to discrete [removed: items.] [added: items, partially offset by a provision for income taxes related to profits in lower tax rate jurisdictions.] The benefit from income taxes in fiscal year 2013 was primarily due to a tax benefit of $24.0 million related to discrete items and losses in higher tax rate jurisdictions, [added: partially] offset by a provision [removed: from] [added: for] income taxes related to profits in lower tax rate jurisdictions. The benefit from income taxes in fiscal year 2012 was primarily due to a tax benefit of $7.0 million related to discrete items and losses in higher tax rate jurisdictions, which included pre-tax impairment charges of $74.2 million, partially offset by [removed: a] provision [removed: from] [added: for] income taxes related to profits in lower tax rate jurisdictions. [removed: The fiscal year 2011 effective tax rate on continuing operations of 95.0% was primarily due to the fiscal year 2011 provision of $79.7 million related to our planned $350.0 million repatriation of previously unremitted earnings.] |
| (6) | In May 2014, we approved the shutdown of our microarray-based diagnostic testing laboratory in the United States. The shutdown resulted in a $0.1 million net pre-tax [removed: loss] [added: gain] primarily related to the disposal of fixed assets, which was partially offset by the sale of a building in fiscal year 2014. |
| (8) | In [removed: October 2011,] [added: July 2016,] we issued and sold ten-year senior notes at a rate of [removed: 5%] [added: 1.875%] with a face value of [removed: $500.0] [added: €500.0] million and received [removed: $496.9] [added: €492.3] million of net proceeds from the issuance. The debt, which matures in [removed: November 2021,] [added: July 2026,] is unsecured. |
| (9) | In fiscal year [added: 2016, we repurchased in the open market 3.2 million shares of our common stock at an aggregate cost of $148.2 million, including commissions under a stock repurchase program authorized by our Board on October 23, 2014 ("the Repurchase Program"). In fiscal year] 2015, we repurchased in the open market 1.5 million shares of our common stock at an aggregate cost of $72.0 million, including commissions under the Repurchase Program. In fiscal year 2014, we repurchased in the open market 1.4 million shares of our common stock at an aggregate cost of $61.3 million, including [removed: commissions] [added: commissions,] under both the Repurchase Program and a stock repurchase program originally announced in October 2012 that expired in October 2014 (the "Former Repurchase Program"). In fiscal year 2013, we repurchased in the open market 3.6 million shares of our common stock at an aggregate cost of $123.0 million, including commissions, under the Former Repurchase Program. In fiscal year 2012, we did not repurchase any shares [removed: of our common. In fiscal year 2011, we repurchased in the open market 4.0 million shares of our common stock at an aggregate cost of $107.8 million,] |
We adjusted the information in the consolidated financial statements, where appropriate, for discontinued operations.
| Revenue | $ | 2,115,517 | | | $ | 2,104,823 | | | $ | 2,069,880 | | | $ | 1,996,959 | | | $ | 1,940,202 | |
| Operating income from continuing operations(1)(2)(3) | 283,066 | | | | 250,926 | | | | 165,007 | | | | 180,791 | | | | 51,494 | | |
| Income from continuing operations before income taxes | 244,068 | | | | 208,807 | | | | 123,868 | | | | 116,681 | | | | 3,538 | | |
| Income from continuing operations, net of income taxes(5) | 215,706 | | | | 188,785 | | | | 130,139 | | | | 142,206 | | | | 36,354 | | |
| Continuing operations | $ | 1.97 | | | $ | 1.68 | | | $ | 1.16 | | | $ | 1.27 | | | $ | 0.32 | |
| Discontinued operations | 0.17 | | | | 0.21 | | | | 0.25 | | | | 0.22 | | | | 0.30 | | |
| Continuing operations | $ | 1.96 | | | $ | 1.67 | | | $ | 1.14 | | | $ | 1.25 | | | $ | 0.32 | |
| Discontinued operations | 0.17 | | | | 0.21 | | | | 0.24 | | | | 0.22 | | | | 0.29 | | |
| | January 1, 2017 | | | | January 3, 2016 | | | | December 28, 2014 | | | | December 29, 2013 | | | | December 30, 2012 | | |
| (7) | In December 2016, we entered into a Master Purchase and Sale Agreement for the sale of our Medical Imaging business. We accounted for this business as discontinued operations beginning in 2016 and the financial information relating to fiscal years 2015, 2014, 2013 and 2012 has been retrospectively adjusted to reflect the inclusion of this business in discontinued operations. |
of our common stock.
We adjusted the information in the consolidated financial statements, where appropriate, to account for the adoption of new guidance related to debt issuance costs and the provision for bad debts applicable for certain of our health care businesses, and for discontinued operations.
| Revenue | $ | 2,262,359 | | | $ | 2,237,219 | | | $ | 2,157,586 | | | $ | 2,105,188 | | | $ | 1,906,190 | |
| Operating income from continuing operations(1)(2)(3) | 286,134 | | | | 210,742 | | | | 227,794 | | | | 103,120 | | | | 94,777 | | |
| Income from continuing operations before income taxes | 244,015 | | | | 169,603 | | | | 163,684 | | | | 55,164 | | | | 68,003 | | |
| Income from continuing operations, net of income taxes(5) | 212,688 | | | | 161,166 | | | | 174,267 | | | | 71,289 | | | | 3,383 | | |
| Continuing operations | $ | 1.89 | | | $ | 1.43 | | | $ | 1.55 | | | $ | 0.63 | | | $ | 0.03 | |
| Discontinued operations | 0.00 | | | | (0.03 | | ) | | (0.06 | | ) | | (0.01 | | ) | | 0.04 | | |
| Continuing operations | $ | 1.88 | | | $ | 1.42 | | | $ | 1.54 | | | $ | 0.62 | | | $ | 0.03 | |
| (7) | In fiscal year 2015, we adopted Accounting Standards Update No. 2015-03, Interest - Imputation of Interest - Simplifying the Presentation of Debt Issuance Costs, which caused the reclassification of debt issuance costs of $6.5 million in fiscal year 2014, $5.8 million in 2013, $7.3 million in fiscal year 2012 and $8.5 million in fiscal year 2011 from other long-term assets to long-term debt. |
including commissions under our stock repurchase program originally announced in October 2008 that expired in October 2012.
Item 8. Financial Statements and Supplemental Data
542 rewritten, 572 added, 333 removed, 1,009 unchanged
| [Report of Independent Registered Public Accounting [removed: Firm](#s42CC0D56CDED235BD1C004130514A457)] [added: Firm](#s1BC1C36F177865E8A2A972E3E4F98C79)] | [removed: [54](#s42CC0D56CDED235BD1C004130514A457)] [added: [55](#s1BC1C36F177865E8A2A972E3E4F98C79)] |
| [Consolidated Statements of Operations for Each of the Three Fiscal Years in the Period Ended January [removed: 3, 2016](#sCFBC6D793625B9642C6D0412DEEBD3AD)] [added: 1, 2017](#sAF6E1DB727BE7594AC6372E36D729F99)] | [removed: [55](#sCFBC6D793625B9642C6D0412DEEBD3AD)] [added: [56](#sAF6E1DB727BE7594AC6372E36D729F99)] |
| [Consolidated Statements of Comprehensive Income for Each of the Three Fiscal Years in the Period Ended January [removed: 3, 2016](#sFD26D490D15AA2D97F5A0412DE9EB501)] [added: 1, 2017](#s8F290C8B03AE289DC32772E36D7ECF9C)] | [removed: [56](#sFD26D490D15AA2D97F5A0412DE9EB501)] [added: [57](#s8F290C8B03AE289DC32772E36D7ECF9C)] |
| [Consolidated Balance Sheets as of January [removed: 3, 2016] [added: 1, 2017] and [removed: December 28, 2014](#sDCD24F0506C726146A390412DFF5158C)] [added: January 3, 2016](#s308EE8AB01CBE779999572E36D834902)] | [removed: [57](#sDCD24F0506C726146A390412DFF5158C)] [added: [58](#s308EE8AB01CBE779999572E36D834902)] |
| [Consolidated Statements of Stockholders’ Equity for Each of the Three Fiscal Years in the Period Ended January [removed: 3, 2016](#s08C4E1E64DEB440EDD500412DE7F96A6)] [added: 1, 2017](#s8A70D9C1B517D22ABEDB72E36D94850A)] | [removed: [58](#s08C4E1E64DEB440EDD500412DE7F96A6)] [added: [59](#s8A70D9C1B517D22ABEDB72E36D94850A)] |
| [Consolidated Statements of Cash Flows for Each of the Three Fiscal Years in the Period Ended January [removed: 3, 2016](#s5BBF79271CBA657624300412DF7C6B23)] [added: 1, 2017](#sF265FE14F09A57E9B75972E36DE29946)] | [removed: [59](#s5BBF79271CBA657624300412DF7C6B23)] [added: [60](#sF265FE14F09A57E9B75972E36DE29946)] |
| [Notes to Consolidated Financial [removed: Statements](#s6E3EDC6AA0D16EF2345D0413063E512B)] [added: Statements](#s19400311AF063739D92D72E3F2F6F31A)] | [removed: [60](#s6E3EDC6AA0D16EF2345D0413063E512B)] [added: [61](#s19400311AF063739D92D72E3F2F6F31A)] |
We have audited the accompanying consolidated balance sheets of PerkinElmer, Inc. and subsidiaries (the “Company”) as of January [removed: 3, 2016] [added: 1, 2017] and [removed: December 28, 2014,] [added: January 3, 2016,] and the related consolidated statements of operations, comprehensive income, stockholders’ equity, and cash flows for each of the three years in the period ended January [removed: 3, 2016.][added: 1, 2017.]
In our opinion, such consolidated financial statements present fairly, in all material respects, the financial position of PerkinElmer, Inc. and subsidiaries as of January [removed: 3, 2016] [added: 1, 2017] and [removed: December 28, 2014,] [added: January 3, 2016,] and the results of their operations and their cash flows for each of the three years in the period ended January [removed: 3, 2016,] [added: 1, 2017,] in conformity with accounting principles generally accepted in the United States of America.
We have also audited, in accordance with the standards of the Public Company Accounting Oversight Board (United States), the Company’s internal control over financial reporting as of January [removed: 3, 2016,] [added: 1, 2017,] based on the criteria established in Internal Control—Integrated Framework (2013) issued by the Committee of Sponsoring Organizations of the Treadway Commission and our report dated [removed: March 1, 2016] [added: February 28, 2017] expressed an unqualified opinion on the Company’s internal control over financial reporting.
| | January [removed: 3, 2016] [added: 1, 2017] | | | | [removed: December 28, 2014] [added: January 3, 2016] | | | | December [removed: 29, 2013] [added: 28, 2014] | | |
| Service revenue | [removed: 709,721] [added: 718,621] | | | | [removed: 697,144] [added: 709,721] | | | | [removed: 659,516] [added: 697,144] | | |
| Cost of service revenue | [removed: 444,131] [added: 437,361] | | | | [removed: 427,266] [added: 444,131] | | | | [removed: 397,860] [added: 427,266] | | |
| Restructuring and contract termination charges, net | [removed: 13,590] [added: 568] | | | | [removed: 13,390] [added: 43] | | | | [removed: 33,892] [added: 1,111] | | |
| Interest and other expense, net | [removed: 42,119] [added: 38,998] | | | | [removed: 41,139] [added: 42,119] | | | | [removed: 64,110] [added: 41,139] | | |
| Income from continuing operations before income taxes | [removed: 244,015] [added: 244,068] | | | | [removed: 169,603] [added: 208,807] | | | | [removed: 163,684] [added: 123,868] | | |
| Provision for (benefit from) income taxes | [removed: 31,327] [added: 28,362] | | | | [removed: 8,437] [added: 20,022] | | | | [removed: (10,583] [added: (6,271] | | ) |
| [removed: Loss] [added: Income] from discontinued operations before income taxes | [removed: (3] [added: 22,229] | | [removed: )] | | [removed: (4,959] [added: 35,205] | | [removed: )] | | [removed: (10,352] [added: 40,776] | | [removed: )] |
| [removed: Loss] [added: Gain (loss)] on disposition of discontinued operations before income taxes | [removed: (28] [added: 619] | | [removed: )] | | [removed: (260] [added: (28] | | ) | | [removed: (1,810] [added: (260] | | ) |
| Provision for [removed: (benefit from)] income taxes on discontinued operations and dispositions | [removed: 232] [added: 4,255] | | | | [removed: (1,831] [added: 11,537] | | [removed: )] | | [removed: (5,107] [added: 12,877] | | [removed: )] |
| Net income | $ | [removed: 212,425] [added: 234,299] | | | $ | [removed: 157,778] [added: 212,425] | | | $ | [removed: 167,212] [added: 157,778] | |
| Income from continuing operations | $ | [removed: 1.89] [added: 1.97] | | | $ | [removed: 1.43] [added: 1.68] | | | $ | [removed: 1.55] [added: 1.16] | |
| Net income | $ | [removed: 1.89] [added: 2.14] | | | $ | [removed: 1.40] [added: 1.89] | | | $ | [removed: 1.49] [added: 1.40] | |
| Income from continuing operations | $ | [removed: 1.88] [added: 1.96] | | | $ | [removed: 1.42] [added: 1.67] | | | $ | [removed: 1.54] [added: 1.14] | |
| Net income | $ | [removed: 1.87] [added: 2.12] | | | $ | [removed: 1.39] [added: 1.87] | | | $ | [removed: 1.47] [added: 1.39] | |
| Other comprehensive [removed: (loss) income] [added: loss] | | | | | | | | | | | |
| Foreign currency translation adjustments | [removed: (70,178] [added: (54,077] | | ) | | [removed: (52,951] [added: (70,178] | | ) | | [removed: 8,756] [added: (52,951] | | [added: )] |
| Unrecognized prior service costs, net of tax | [removed: (316] [added: (860] | | ) | | [removed: 146] [added: (316] | | [added: )] | | [removed: (658] [added: 146] | | [removed: )] |
| Unrealized [removed: (losses)] gains [added: (losses)] on securities, net of tax | [removed: (262] [added: 32] | | [removed: )] | | [removed: 14] [added: (262] | | [added: )] | | [removed: 8] [added: 14] | | |
| Other comprehensive [removed: (loss) income] [added: loss] | [removed: (70,756] [added: (54,905] | | ) | | [removed: (52,791] [added: (70,756] | | ) | | [removed: 10,998] [added: (52,791] | | [added: )] |
| Comprehensive income | $ | [removed: 141,669] [added: 179,394] | | | $ | [removed: 104,987] [added: 141,669] | | | $ | [removed: 178,210] [added: 104,987] | |
| | January [added: 1, 2017 | | | | January] 3, 2016 | | | | December 28, 2014 | | |
| Cash and cash equivalents [removed: | $] [added: at beginning of year] | 237,932 | | | [removed: $] | 174,821 | | [added: | | 173,242 | | |]
| Total current assets | [removed: 1,033,161] [added: 1,189,931] | | | | [removed: 1,068,551] [added: 1,033,161] | | |
| Property, plant and [removed: equipment, net | 167,029 | | |] [added: equipment] | [removed: 176,194] [added: 7,542] | | |
| Marketable securities [removed: and investments] | [removed: 1,586] [added: $] | [added: 1,678] | | | [removed: 1,568] [added: $] | [added: 1,586] | |
| Total assets | $ | [added: 4,276,683 | | | $ |] 4,166,295 | | | $ | 4,127,576 | |
| Current portion of long-term debt | $ | [removed: 1,123] [added: 1,172] | | | $ | [removed: 1,075] [added: 1,123] | |
| Accrued restructuring and contract termination charges | [removed: 17,090] [added: 209] | | | | [removed: 17,124] [added: 48] | | |
| Accrued expenses and other current liabilities | [removed: 388,446] [added: 9,992] | | | | [removed: 403,021] [added: 8,212] | | |
February 28, 2017
| Product revenue | $ | 1,396,896 | | | $ | 1,395,102 | | | $ | 1,372,736 | |
| Total revenue | 2,115,517 | | | | 2,104,823 | | | | 2,069,880 | | |
| Cost of product revenue | 664,803 | | | | 696,461 | | | | 708,016 | | |
| Selling, general and administrative expenses | 600,885 | | | | 587,219 | | | | 648,209 | | |
| Research and development expenses | 124,278 | | | | 112,539 | | | | 108,057 | | |
| Operating income from continuing operations | 283,066 | | | | 250,926 | | | | 165,007 | | |
| Income from continuing operations | 215,706 | | | | 188,785 | | | | 130,139 | | |
| Income from discontinued operations and dispositions | 18,593 | | | | 23,640 | | | | 27,639 | | |
| Income from discontinued operations and dispositions | 0.17 | | | | 0.21 | | | | 0.25 | | |
| Income from discontinued operations and dispositions | 0.17 | | | | 0.21 | | | | 0.24 | | |
| Net income | $ | 234,299 | | | $ | 212,425 | | | $ | 157,778 | |
| | January 1, 2017 | | | | January 3, 2016 | | |
| Cash and cash equivalents | $ | 359,265 | | | $ | 237,932 | |
| Accounts receivable, net | 425,588 | | | | 415,064 | | |
| Inventories | 246,847 | | | | 259,486 | | |
| Other current assets | 99,246 | | | | 64,347 | | |
| Current assets of discontinued operations | 58,985 | | | | 56,332 | | |
| Property, plant and equipment, net | 145,494 | | | | 137,564 | | |
| Intangible assets, net | 420,224 | | | | 485,637 | | |
| Goodwill | 2,247,966 | | | | 2,236,863 | | |
| Other assets, net | 204,679 | | | | 198,041 | | |
| Long-term assets of discontinued operations | 68,389 | | | | 75,029 | | |
| Accounts payable | 168,033 | | | | 140,980 | | |
| Accrued restructuring and contract termination charges | 7,479 | | | | 17,042 | | |
| Accrued expenses and other current liabilities | 399,700 | | | | 382,334 | | |
| Current liabilities of discontinued operations | 26,971 | | | | 20,006 | | |
| Long-term liabilities | 459,544 | | | | 465,490 | | |
| Long-term liabilities of discontinued operations | 14,960 | | | | 17,117 | | |
| Adjustment to recognize prior year's unrecognized excess tax benefits upon adoption of ASU 2016-09 (see Note 1) | — | | | | 177 | | | | 14,051 | | | | — | | | | 14,228 | | |
| Net income | — | | | | — | | | | 234,299 | | | | — | | | | 234,299 | | |
| Other comprehensive loss | — | | | | — | | | | — | | | | (54,905 | | ) | | (54,905 | | ) |
| Dividends | — | | | | — | | | | (30,629 | | ) | | — | | | | (30,629 | | ) |
| Purchases of common stock | (3,275 | | ) | | (58,058 | | ) | | (90,468 | | ) | | — | | | | (151,801 | | ) |
| Balance, January 1, 2017 | $ | 109,617 | | | $ | 26,130 | | | $ | 2,118,684 | | | $ | (100,861 | ) | | $ | 2,153,570 | |
| Net income | $ | 234,299 | | | $ | 212,425 | | | $ | 157,778 | |
| Income from continuing operations | 215,706 | | | | 188,785 | | | | 130,139 | | |
| Restructuring and contract termination charges, net | 5,124 | | | | 13,547 | | | | 13,325 | | |
| Depreciation and amortization | 99,972 | | | | 105,364 | | | | 110,465 | | |
| Stock-based compensation | 17,158 | | | | 17,278 | | | | 14,057 | | |
| | |
| --- | --- |
As discussed in Note 1 to the consolidated financial statements, the Company adopted Financial Accounting Standards Board Accounting Standards Update 2015-17, Balance Sheet Classification of Deferred Taxes on a prospective basis.
Accordingly, such changes are reflected in the accompanying consolidated balance sheet as of January 3, 2016 but are not reflected in the accompanying consolidated balance sheet as of December 28, 2014.
March 1, 2016
| Product revenue | $ | 1,552,638 | | | $ | 1,540,075 | | | $ | 1,498,070 | |
| Total revenue | 2,262,359 | | | | 2,237,219 | | | | 2,157,586 | | |
| Cost of product revenue | 793,728 | | | | 805,345 | | | | 783,584 | | |
| Selling, general and administrative expenses | 598,848 | | | | 659,335 | | | | 581,898 | | |
| Research and development expenses | 125,928 | | | | 121,141 | | | | 132,400 | | |
| Asset impairment | — | | | | — | | | | 158 | | |
| Operating income from continuing operations | 286,134 | | | | 210,742 | | | | 227,794 | | |
| Income from continuing operations | 212,688 | | | | 161,166 | | | | 174,267 | | |
| Loss on discontinued operations and dispositions | (263 | | ) | | (3,388 | | ) | | (7,055 | | ) |
| Loss on discontinued operations and dispositions | 0.00 | | | | (0.03 | | ) | | (0.06 | | ) |
| Reclassification adjustments for losses on derivatives included in net income, net of tax | — | | | | — | | | | 2,892 | | |
| Accounts receivable, net | 439,015 | | | | 470,563 | | |
| Inventories | 288,028 | | | | 285,457 | | |
| Other current assets | 68,186 | | | | 137,710 | | |
| Intangible assets, net | 490,811 | | | | 490,265 | | |
| Goodwill | 2,276,149 | | | | 2,284,077 | | |
| Other assets, net | 197,559 | | | | 106,921 | | |
| Accounts payable | 152,726 | | | | 173,953 | | |
| Long-term liabilities | 482,607 | | | | 442,771 | | |
| Balance, December 30, 2012 | $ | 115,036 | | | $ | 209,610 | | | $ | 1,548,573 | | | $ | 66,593 | | | $ | 1,939,812 | |
| Net income | — | | | | — | | | | 167,212 | | | | — | | | | 167,212 | | |
| Other comprehensive income | — | | | | — | | | | — | | | | 10,998 | | | | 10,998 | | |
| Dividends | — | | | | — | | | | (31,421 | | ) | | — | | | | (31,421 | | ) |
| Purchases of common stock | (3,728 | | ) | | (123,670 | | ) | | — | | | | — | | | | (127,398 | | ) |
| Depreciation and amortization | 112,007 | | | | 116,736 | | | | 126,879 | | |
| Stock-based compensation | 17,719 | | | | 14,464 | | | | 14,053 | | |
| Losses (gains) on dispositions, net | — | | | | 108 | | | | (1,566 | | ) |
| Accounts receivable, net | 6,760 | | | | (16,989 | | ) | | (14,071 | | ) |
| Inventories | (28,700 | | ) | | (24,642 | | ) | | (14,171 | | ) |
| Accounts payable | (16,082 | | ) | | 8,103 | | | | (1,083 | | ) |
| Net cash provided by operating activities of continuing operations | 287,581 | | | | 282,268 | | | | 157,248 | | |
| Capital expenditures | (29,632 | | ) | | (29,072 | | ) | | (38,981 | | ) |
| Prepayment of long-term debt | — | | | | — | | | | (150,000 | | ) |
| Premium on prepayment of long-term debt | — | | | | — | | | | (11,119 | | ) |
| Cash and cash equivalents at beginning of year | 174,821 | | | | 173,242 | | | | 171,444 | | |
An excerpt. Shown here: 40 of 542 rewritten, 40 of 572 added and 40 of 333 removed. The counts are complete. For every sentence, read Item 8. Financial Statements and Supplemental Data in the FY2017 filing and the FY2016 filing.
Item 9A. Controls and Procedures
8 rewritten, 1 added, 1 removed, 39 unchanged
Our management, with the participation of our Chief Executive Officer and Chief Financial Officer, evaluated the effectiveness of our disclosure controls and procedures as of January [removed: 3, 2016.][added: 1, 2017.]
Based on the evaluation of our disclosure controls and procedures as of January [removed: 3, 2016,] [added: 1, 2017,] our Chief Executive Officer and Chief Financial Officer concluded that, as of such date, our disclosure controls and procedures were effective at the reasonable assurance level.
Our management assessed the effectiveness of our internal control over financial reporting as of January [removed: 3, 2016.][added: 1, 2017.]
Based on this assessment, our management concluded that, as of January [removed: 3, 2016,] [added: 1, 2017,] our internal control over financial reporting was effective based on those criteria.
We have audited the internal control over financial reporting of PerkinElmer, Inc. and subsidiaries (the “Company”) as of January [removed: 3, 2016,] [added: 1, 2017,] based on criteria established in Internal Control—Integrated Framework (2013) issued by the Committee of Sponsoring Organizations of the Treadway Commission.
In our opinion, the Company maintained, in all material respects, effective internal control over financial reporting as of January [removed: 3, 2016,] [added: 1, 2017,] based on the criteria established in Internal Control—Integrated Framework (2013) issued by the Committee of Sponsoring Organizations of the Treadway Commission.
We have also audited, in accordance with the standards of the Public Company Accounting Oversight Board (United States), the consolidated financial statements and financial statement schedule as of and for the year ended January [removed: 3, 2016] [added: 1, 2017] of the Company and our report dated [removed: March 1, 2016] [added: February 28, 2017] expressed an unqualified opinion on those financial statements and financial statement [removed: schedule and included an explanatory paragraph regarding the Company's adoption of the Financial Accounting Standards Board Accounting Standards Update 2015-17, Balance Sheet Classification of Deferred Taxes during the year ended January 3, 2016.][added: schedule.]
No change in our internal control over financial reporting (as defined in Rules 13a-15(f) and 15d-15(f) under the Exchange Act) occurred during the fiscal quarter ended January [removed: 3, 2016] [added: 1, 2017] that has materially affected, or is reasonably likely to materially affect, our internal control over financial reporting.
February 28, 2017
March 1, 2016
Item 10. Directors, Executive Officers and Corporate Governance
2 rewritten, 0 added, 0 removed, 6 unchanged
The information required to be disclosed by this Item pursuant to Item 401 of Regulation S-K with respect to our executive officers is contained in Part I of this annual report on Form 10-K under the caption, “Executive Officers of the Registrant.” The remaining information required to be disclosed by the Item pursuant to Item 401 and Item 407 of Regulation S-K is contained in the proxy statement for our annual meeting of stockholders to be held on April [removed: 26, 2016] [added: 25, 2017] under the captions “Proposal No. 1 Election of Directors” and “Information Relating to Our Board of Directors and Its Committees” and is incorporated in this annual report on Form 10-K by reference.
The information required to be disclosed by this Item pursuant to Item 405 of Regulation S-K is contained in the proxy statement for our annual meeting of stockholders to be held on April [removed: 26, 2016] [added: 25, 2017] under the caption “Section 16(a) Beneficial Ownership Reporting Compliance,” and is incorporated in this annual report on Form 10-K by reference.
Item 11. Executive Compensation
1 rewritten, 0 added, 0 removed, 2 unchanged
The information required to be disclosed by this Item pursuant to Item 402 and Item 407(e) of Regulation S-K is contained in the proxy statement for our annual meeting of stockholders to be held on April [removed: 26, 2016] [added: 25, 2017] under the captions “Information Relating to Our Board of Directors and Its Committees—Director Compensation,” “Information Relating to Our Board of Directors and Its Committees—Compensation Committee Interlocks and Insider Participation,” and “Executive Compensation,” and is incorporated in this annual report on Form 10-K by reference.
Item 12. Security Ownership of Certain Beneficial Owners and Management and Related Stockholder Matters
2 rewritten, 0 added, 0 removed, 2 unchanged
The information required to be disclosed by this Item pursuant to Item 403 of Regulation S-K is contained in the proxy statement for our annual meeting of stockholders to be held on April [removed: 26, 2016] [added: 25, 2017] under the caption “Beneficial Ownership of Common Stock,” and is incorporated in this annual report on Form 10-K by reference.
The information required to be disclosed by this Item pursuant to Item 201(d) of Regulation S-K is contained in the proxy statement for our annual meeting of stockholders to be held on April [removed: 26, 2016] [added: 25, 2017] under the caption “Executive Compensation—Equity Compensation Plan Information,” and is incorporated in this annual report on Form 10-K by reference.
Item 13. Certain Relationships and Related Transactions, and Director Independence
2 rewritten, 0 added, 0 removed, 2 unchanged
The information required to be disclosed by this Item pursuant to Item 404 of Regulation S-K is contained in the proxy statement for our annual meeting of stockholders to be held on April [removed: 26, 2016] [added: 25, 2017] under the caption “Information Relating to Our Board of Directors and Its Committees—Certain Relationships and Policies on Related Party Transactions,” and is incorporated in this annual report on Form 10-K by reference.
The information required to be disclosed by this Item pursuant to Item 407(a) of Regulation S-K is contained in the proxy statement for our annual meeting of stockholders to be held on April [removed: 26, 2016] [added: 25, 2017] under the caption “Information Relating to Our Board of Directors and Its Committees—Determination of Independence,” and is incorporated in this annual report on Form 10-K by reference.
Item 14. Principal Accountant Fees and Services
1 rewritten, 0 added, 0 removed, 3 unchanged
The information required to be disclosed by this Item pursuant to Item 9(e) of Schedule 14A is contained in the proxy statement for our annual meeting of stockholders to be held on April [removed: 26, 2016] [added: 25, 2017] under the caption “Information Relating to Our Board of Directors and Its Committees—Independent Registered Public Accounting Firm Fees and Other Matters”, and is incorporated in this annual report on Form 10-K by reference.
Item 15. Exhibits and Financial Statement Schedules
26 rewritten, 55 added, 3 removed, 281 unchanged
Consolidated Statements of Operations for Each of the Three Fiscal Years in the Period Ended January [removed: 3, 2016][added: 1, 2017]
Consolidated Statements of Comprehensive Income for Each of the Three Fiscal Years in the Period Ended January [removed: 3, 2016][added: 1, 2017]
Consolidated Balance Sheets as of January [added: 1, 2017 and January] 3, 2016 [removed: and December 28, 2014]
Consolidated Statements of Stockholders’ Equity for Each of the Three Fiscal Years in the Period Ended January [removed: 3, 2016][added: 1, 2017]
Consolidated Statements of Cash Flows for Each of the Three Fiscal Years in the Period Ended January [removed: 3, 2016][added: 1, 2017]
| 3.2 | | PerkinElmer, Inc.'s Amended and Restated [removed: By-Laws,] [added: By-laws,] filed with the Commission on [removed: April 28, 2009] [added: July 27, 2016] as Exhibit [removed: 3.1] [added: 3.2] to our current report on Form 8-K and herein incorporated by reference. | | | |
| 10.1 | | Credit Agreement, dated as of [removed: January 8, 2014,] [added: August 11, 2016,] among PerkinElmer, Inc., Wallac [removed: Oy] [added: Oy,] and PerkinElmer Health Sciences, Inc. as Borrowers, JPMorgan Chase [removed: Bank N.A.] [added: Bank, N.A.,] as Administrative Agent, Bank of America, N.A. and Barclays Bank PLC as Co-Syndication Agents, [removed: The Royal Bank of Scotland PLC,] Citibank, [removed: N.A. and HSBC] [added: N.A., Mizuho Bank, Ltd., TD Bank, N.A., U.S.] Bank [removed: USA,] National Association [added: and Wells Fargo Bank, National Association] as Co-Documentation Agents, [added: and] J.P. Morgan [removed: Securities LLC,] [added: Chase Bank, N.A.,] Merrill Lynch, Pierce, Fenner & Smith Incorporated and Barclays Bank PLC as Joint Bookrunners and Joint Lead Arrangers, and the other Lenders [removed: Party hereto,] [added: party thereto,] filed with the Commission on [removed: January 10, 2014] [added: August 12, 2016] as Exhibit 10.1 to our current report on Form 8-K and herein incorporated by reference. | | | |
| | | (3) Employment Agreement by and between Frank [removed: Anders] [added: A.] Wilson and PerkinElmer, Inc. dated as of April 28, 2009, filed with the Commission on April 30, 2009 as Exhibit 10.1 to our current report on Form 8-K and herein incorporated by reference; | | | |
| | | Joel S. Goldberg Frank [removed: Anders] [added: A.] Wilson | December 3, 2010 December 21, 2010 | | |
| | | [removed: (8)] [added: (10)] Employment Agreement between [removed: Daniel R. Tereau] [added: Prahlad Singh] and PerkinElmer, Inc. dated as of [removed: February 1,] [added: October 3,] 2016, attached hereto as Exhibit [removed: 10.2(8).] [added: 10.2(10).] | | | |
| [removed: 10.19*] [added: 10.23*] | | PerkinElmer, Inc. Savings Plan Amended and Restated effective January 1, 2012, filed with the Commission on February 26, 2013 as Exhibit 10.36 to our annual report on Form 10-K and herein incorporated by reference. | | | |
| [removed: 10.20*] [added: 10.24*] | | PerkinElmer, Inc. Employees Retirement Plan Amended and Restated effective January 1, 2012, filed with the Commission on February 26, 2013 as Exhibit 10.37 to our annual report on Form 10-K and herein incorporated by reference. | | | |
| [removed: 10.21*] [added: 10.25*] | | PerkinElmer, Inc.'s Amended and Restated Performance Incentive Plan (Executive Officers), filed with the Commission on February 25, 2014 as Exhibit 10.37 to our annual report on Form 10-K and herein incorporated by reference. | | | |
(i) Consolidated Statements of Operations for each of the three years in the period ended January [removed: 3, 2016,] [added: 1, 2017,] (ii) Consolidated Balance Sheets as of January [removed: 3, 2016] [added: 1, 2017] and [removed: December 28, 2014,] [added: January 3, 2016,] (iii) Consolidated Statements of Comprehensive Income for each of the three years in the period ended January [removed: 3, 2016,] [added: 1, 2017,] (iv) Consolidated Statements of Stockholders' Equity for each of the three years in the period ended January [removed: 3, 2016,] [added: 1, 2017,] (v) Consolidated Statements of Cash Flows for each of the three years in the period ended January [removed: 3, 2016,] [added: 1, 2017,] (vi) Notes to Consolidated Financial Statements, and (vii) Financial Schedule of Valuation and Qualifying Accounts.
For the Three Years Ended January [removed: 3, 2016][added: 1, 2017]
| (1) | Other amounts primarily relate to the impact of [removed: acquisitions] [added: acquisitions, discontinued operations] and foreign exchange movements. |
| By: | /S/ ROBERT F. FRIEL | | Chairman, Chief Executive Officer | | [removed: March 1, 2016] [added: February 28, 2017] |
| By: | /S/ FRANK A. WILSON | | Sr. Vice President and | | [removed: March 1, 2016] [added: February 28, 2017] |
| By: | /S/ ANDREW OKUN | | Vice President and | | [removed: March 1, 2016] [added: February 28, 2017] |
| By: | /S/ PETER BARRETT | | Director | | [removed: March 1, 2016] [added: February 28, 2017] |
| By: | /S/ SYLVIE GRÉGOIRE, PharmD | | Director | | [removed: March 1, 2016] [added: February 28, 2017] |
| By: | /S/ NICHOLAS A. LOPARDO | | Director | | [removed: March 1, 2016] [added: February 28, 2017] |
| By: | /S/ ALEXIS P. MICHAS | | Director | | [removed: March 1, 2016] [added: February 28, 2017] |
| By: | /S/ VICKI L. SATO, PhD | | Director | | [removed: March 1, 2016] [added: February 28, 2017] |
| By: | /S/ KENTON J. SICCHITANO | | Director | | [removed: March 1, 2016] [added: February 28, 2017] |
| By: | /S/ PATRICK J. SULLIVAN | | Director | | [removed: March 1, 2016] [added: February 28, 2017] |
| 2.2(1) | | Master Purchase and Sale Agreement, dated as of December 21, 2016, by and between PerkinElmer, Inc. and Varian Medical Systems, Inc., filed with the Commission on December 22, 2016 as Exhibit 2.1 to our current report on Form 8-K and herein incorporated by reference. | | | |
| 4.5 | | Third Supplemental Indenture, dated as of July 19, 2016, among PerkinElmer, Inc., U.S. Bank National Association, as trustee, and Elavon Financial Services DAC, UK Branch, as paying agent, filed with the Commission on July 19, 2016 as Exhibit 4.2 to our current report on Form 8-K and herein incorporated by reference. | | | |
| 4.6 | | Paying Agency Agreement, dated July 19, 2016, between the Company, U.S. Bank National Association, as trustee, Elavon Financial Services DAC, UK Branch, as paying agent, and Elavon Financial Services DAC, as transfer agent and registrar, filed with the Commission on July 19, 2016 as Exhibit 4.3 to our current report on Form 8-K and herein incorporated by reference. | | | |
| | | (8) Employment Agreement between Daniel R. Tereau and PerkinElmer, Inc. dated as of February 1, 2016, filed with the Commission on March 1, 2016 as Exhibit 10.2(8) to our annual report on Form 10-K and herein incorporated by reference. | | | |
| | | (9) Employment Agreement between Deborah A. Butters and PerkinElmer, Inc. dated as of July 11, 2016, filed with the Commission on November 8, 2016 as Exhibit 10.2(9) to our quarterly report on Form 10-Q and herein incorporated by reference. | | | |
| 10.19* | | Form of 162(m)-compliant Restricted Stock Agreement with single-trigger acceleration for use under the 2009 Incentive Plan, attached hereto as Exhibit 10.19. | | | |
| 10.20* | | Form of 162(m)-compliant Restricted Stock Agreement with double-trigger acceleration for use under the 2009 Incentive Plan, attached hereto as Exhibit 10.20. | | | |
| 10.21* | | Form of 162(m)-compliant Restricted Stock Unit Agreement with single-trigger acceleration for use under the 2009 Incentive Plan, attached hereto as Exhibit 10.21. | | | |
| 10.22* | | Form of 162(m)-compliant Restricted Stock Unit Agreement with double-trigger acceleration for use under the 2009 Incentive Plan, attached hereto as Exhibit 10.22. | | | |
| Year ended December 28, 2014 | | $ | 28,143 | | | $ | 9,447 | | | $ | (4,125 | ) | | $ | (608 | ) | | $ | 32,857 | |
| Year ended January 3, 2016 | | 32,857 | | | | 3,564 | | | | (5,709 | | ) | | (846 | | ) | | 29,866 | | |
| Year ended January 1, 2017 | | 29,866 | | | | 5,346 | | | | (5,499 | | ) | | (501 | | ) | | 29,212 | | |
| By: | /S/ ROBERT F. FRIEL | | Chairman, Chief Executive Officer | | February 28, 2017 |
| By: | /S/ FRANK A. WILSON | | Sr. Vice President and | | February 28, 2017 |
| By: | /S/ ANDREW OKUN | | Vice President and | | February 28, 2017 |
| By: | /S/ SAMUEL R. CHAPIN | | Director | | February 28, 2017 |
| | Samuel R. Chapin | | | | |
| By: | /S/ FRANK WITNEY, PhD | | Director | | February 28, 2017 |
| | Frank Witney, PhD | | | | |
| 2.2(1) | | Master Purchase and Sale Agreement, dated as of December 21, 2016, by and between PerkinElmer, Inc. and Varian Medical Systems, Inc., filed with the Commission on December 22, 2016 as Exhibit 2.1 to our current report on Form 8-K and herein incorporated by reference. | | | |
| 3.2 | | PerkinElmer, Inc.'s Amended and Restated By-laws, filed with the Commission on July 27, 2016 as Exhibit 3.2 to our current report on Form 8-K and herein incorporated by reference. | | | |
| 4.5 | | Third Supplemental Indenture, dated as of July 19, 2016, among PerkinElmer, Inc., U.S. Bank National Association, as trustee, and Elavon Financial Services DAC, UK Branch, as paying agent, filed with the Commission on July 19, 2016 as Exhibit 4.2 to our current report on Form 8-K and herein incorporated by reference. | | | |
| 4.6 | | Paying Agency Agreement, dated July 19, 2016, between the Company, U.S. Bank National Association, as trustee, Elavon Financial Services DAC, UK Branch, as paying agent, and Elavon Financial Services DAC, as transfer agent and registrar, filed with the Commission on July 19, 2016 as Exhibit 4.3 to our current report on Form 8-K and herein incorporated by reference. | | | |
| 10.1 | | Credit Agreement, dated as of August 11, 2016, among PerkinElmer, Inc., Wallac Oy, and PerkinElmer Health Sciences, Inc. as Borrowers, JPMorgan Chase Bank, N.A., as Administrative Agent, Bank of America, N.A. and Barclays Bank PLC as Co-Syndication Agents, Citibank, N.A., Mizuho Bank, Ltd., TD Bank, N.A., U.S. Bank National Association and Wells Fargo Bank, National Association as Co-Documentation Agents, and J.P. Morgan Chase Bank, N.A., Merrill Lynch, Pierce, Fenner & Smith Incorporated and Barclays Bank PLC as Joint Bookrunners and Joint Lead Arrangers, and the other Lenders party thereto, filed with the Commission on August 12, 2016 as Exhibit 10.1 to our current report on Form 8-K and herein incorporated by reference. | | | |
| | | (3) Employment Agreement by and between Frank A. Wilson and PerkinElmer, Inc. dated as of April 28, 2009, filed with the Commission on April 30, 2009 as Exhibit 10.1 to our current report on Form 8-K and herein incorporated by reference; | | | |
| | | Joel S. Goldberg Frank A. Wilson | December 3, 2010 December 21, 2010 | | |
| | | (8) Employment Agreement between Daniel R. Tereau and PerkinElmer, Inc. dated as of February 1, 2016, filed with the Commission on March 1, 2016 as Exhibit 10.2(8) to our annual report on Form 10-K and herein incorporated by reference. | | | |
| | | (9) Employment Agreement between Deborah A. Butters and PerkinElmer, Inc. dated as of July 11, 2016, filed with the Commission on November 8, 2016 as Exhibit 10.2(9) to our quarterly report on Form 10-Q and herein incorporated by reference. | | | |
| | | (10) Employment Agreement between Prahlad Singh and PerkinElmer, Inc. dated as of October 3, 2016, attached hereto as Exhibit 10.2(10). | | | |
| 10.19* | | Form of 162(m)-compliant Restricted Stock Agreement with single-trigger acceleration for use under the 2009 Incentive Plan, attached hereto as Exhibit 10.19. | | | |
| | | | | | |
| 10.20* | | Form of 162(m)-compliant Restricted Stock Agreement with double-trigger acceleration for use under the 2009 Incentive Plan, attached hereto as Exhibit 10.20. | | | |
| | | | | | |
| 10.21* | | Form of 162(m)-compliant Restricted Stock Unit Agreement with single-trigger acceleration for use under the 2009 Incentive Plan, attached hereto as Exhibit 10.21. | | | |
| | | | | | |
| 10.22* | | Form of 162(m)-compliant Restricted Stock Unit Agreement with double-trigger acceleration for use under the 2009 Incentive Plan, attached hereto as Exhibit 10.22. | | | |
| | | | | | |
| 10.23* | | PerkinElmer, Inc. Savings Plan Amended and Restated effective January 1, 2012, filed with the Commission on February 26, 2013 as Exhibit 10.36 to our annual report on Form 10-K and herein incorporated by reference. | | | |
| | | | | | |
| 10.24* | | PerkinElmer, Inc. Employees Retirement Plan Amended and Restated effective January 1, 2012, filed with the Commission on February 26, 2013 as Exhibit 10.37 to our annual report on Form 10-K and herein incorporated by reference. | | | |
| Year ended December 29, 2013 | | $ | 22,718 | | | $ | 9,427 | | | $ | (3,923 | ) | | $ | 34 | | | $ | 28,256 | |
| Year ended December 28, 2014 | | 28,256 | | | | 9,400 | | | | (4,058 | | ) | | (726 | | ) | | 32,872 | | |
| Year ended January 3, 2016 | | $ | 32,872 | | | $ | 3,595 | | | $ | (5,687 | ) | | $ | (882 | ) | | $ | 29,898 | |
An excerpt. Shown here: all 26 rewritten, 40 of 55 added and all 3 removed. The counts are complete. For every sentence, read Item 15. Exhibits and Financial Statement Schedules in the FY2017 filing and the FY2016 filing.