 filings.tools
Item 7. MANAGEMENT’S DISCUSSION AND ANALYSIS OF FINANCIAL CONDITION AND RESULTS OF OPERATIONS
48K characters. Original on sec.gov · Markdown
Item 7. MANAGEMENT’S DISCUSSION AND ANALYSIS OF FINANCIAL CONDITION AND RESULTS OF OPERATIONS
Forward-Looking Statements
This report contains some predictive statements about future events, including statements related to conditions in domestic or global economies, conditions in the steel and recycled metals market places, Steel Dynamics’ revenues, costs of purchased materials, future profitability and earnings, and the operation of new, existing or planned facilities. These statements, which we generally precede or accompany by such typical conditional words as "anticipate," "intend," "believe," "estimate," "plan," "seek," "project" or "expect," or by the words "may," "will," or "should," are intended to be made as “forward-looking,” subject to many risks and uncertainties, within the safe harbor protections of the Private Securities Litigation Reform Act of 1995. These statements speak only as of this date and are based upon information and assumptions, which we consider reasonable as of this date, concerning our businesses and the environments in which they operate. Such predictive statements are not guarantees of future performance, and we undertake no duty to update or revise any such statements. Some factors that could cause such forward-looking statements to turn out differently than anticipated include: (1) the effects of uncertain economic conditions; (2) cyclical and changing industrial demand; (3) changes in conditions in any of the steel or scrap-consuming sectors of the economy which affect demand for our products, including the strength of the non-residential and residential construction, automotive, manufacturing, appliance, pipe and tube, and other steel-consuming industries; (4) fluctuations in the cost of key raw materials and supplies (including steel scrap, iron units, zinc, graphite electrodes, and energy costs) and our ability to pass on any cost increases; (5) the impact of domestic and foreign imports, including trade policy, restrictions, or agreements; (6) unanticipated difficulties in integrating or starting up new, acquired or planned businesses or assets; (7) risks and uncertainties involving product and/or technology development; and (8) occurrences of unexpected plant outages or equipment failures.
More specifically, we refer you to our more detailed explanation of these and other factors and risks that may cause such predictive statements to turn out differently, as set forth in the sections titled Special Note Regarding Forward-Looking Statements at the beginning of Part I of this Report and Item 1A. Risk Factors, as well as in other subsequent reports we file with the Securities and Exchange Commission. These reports are available publicly on the Securities and Exchange Commission website, www.sec.gov, and on our website, www.steeldynamics.com under “Investors – SEC Filings.”
Operating Statement Classifications
Net Sales. Net sales from our operations are a factor of volumes shipped, product mix and related pricing. We charge premium prices for certain grades of steel, product dimensions, certain smaller volumes, and for value-added processing or coating of our steel products. Except for the steel fabrication operations, we recognize revenues from sales and the allowance for estimated returns and claims from these sales at the point in time control of the product transfers to the customer, upon shipment or delivery. Our steel fabrication operations recognize revenues over time based on completed fabricated tons to date as a percentage of total tons required for each contract.
Costs of Goods Sold. Our costs of goods sold represent all direct and indirect costs associated with the manufacture of our products. The principal elements of these costs are scrap and scrap substitutes (which represent the most significant single component of our consolidated costs of goods sold), steel substrate, direct and indirect labor and related benefits, alloys, zinc, transportation and freight, repairs and maintenance, utilities such as electricity and natural gas, and depreciation.
Selling, General and Administrative Expenses. Selling, general and administrative expenses consist of all costs associated with our sales, finance and accounting, and administrative departments. These costs include, among other items, labor and related benefits, professional services, insurance premiums, and property taxes. Company-wide profit sharing and amortization of intangible assets are each separately presented in the statement of income.
Interest Expense, net of Capitalized Interest. Interest expense consists of interest associated with our senior credit facilities and other debt net of interest costs that are required to be capitalized during the construction period of certain capital investment projects.
Other Income, net. Other income consists of interest income earned on our temporary cash deposits and short-term investments; any other non-operating income activity, including income from non-consolidated investments accounted for under the equity method. Other expense consists of any non-operating costs, such as certain acquisition and financing expenses.
2019 Overview
Our 2019 consolidated results were challenged by high customer steel inventories, as many customers purchased beyond normal demand levels in late 2018. Underlying domestic steel demand remained steady in 2019, but as customers began to destock
inventories, steel prices declined throughout the year in conjunction with weakening scrap prices, before firming in the fourth quarter as destocking subsided and inventory levels were right-sized. Declining ferrous scrap prices throughout much of 2019 negatively impacted our metals recycling operations financial results. The non-residential construction market remained strong, resulting in record steel fabrication shipments with increased selling prices and margins compared to 2018. In spite of the market challenges faced by our steel and metals recycling operations, our consolidated net sales of $10.5 billion and cash flows from operations of $1.4 billion were the second-best performance in company history, and our consolidated operating income was our third-best in company history. In addition, our steel fabrication operations segment achieved record shipments of 644,000 tons, resulting in record operating income of $119.1 million.
Consolidated operating income for 2019 decreased $735.5 million, or 43%, to $986.9 million, compared to the record $1.7 billion in 2018. Net income attributable to Steel Dynamics, Inc. for 2019 decreased $587.3 million, or 47%, to $671.1 million, compared to record 2018. Diluted earnings per share attributable to Steel Dynamics, Inc. was $3.04 for 2019, compared to $5.35 for 2018.
Refer to Item 7. Management’s Discussion and Analysis of Financial Condition and Results of Operations in Part II of our Annual Report on Form 10-K for the year ended December 31, 2018, for additional information regarding results of operations for the year ended December 31, 2018, as compared to the year ended December 31, 2017, and segment operating results for 2018 as compared to 2017.
Acquisition of United Steel Supply, LLC
On March 1, 2019, we purchased 75% of the equity interest of United Steel Supply, LLC (USS) for cash consideration of $93.4 million, plus a customary working capital transaction purchase price adjustment of $3.7 million, which was paid in September 2019. Additionally, we have an option to purchase, and the sellers have the option to require us to purchase, the remaining 25% equity interest of USS in the future. Headquartered in Austin, Texas, USS is a leading distributor of painted Galvalume® flat roll steel used for roofing and siding applications, with distribution centers strategically located in Mississippi, Indiana, Arkansas, and Oregon. USS provides the steel segment a new, complementary distribution channel and connects us to a rapidly growing industry segment with customers that do not traditionally purchase steel directly from a steel producer. USS’s operating results from and after March 1, 2019, are reflected in our financial statements in the steel operations reporting segment.
Segment Operating Results (dollars in thousands)
| | | | | | | | | |
|---|---|---|---|---|---|---|---|---|
| | | | | | | | | |
| | Years Ended December 31, | | ||||||
| | 2019 | | % Change | | 2018 | | ||
| | | | | | | | | |
| Net sales | | | | | | | | |
| Steel Operations | $ | 8,234,179 | | (11)% | | $ | 9,263,152 | |
| Metals Recycling Operations | | 2,494,014 | | (22)% | | | 3,202,214 | |
| Steel Fabrication Operations | | 963,259 | | 4% | | | 921,951 | |
| Other | | 400,747 | | (7)% | | | 429,060 | |
| | | 12,092,199 | | | | | 13,816,377 | |
| Intra-company | | (1,627,208) | | | | | (1,994,538) | |
| | $ | 10,464,991 | | (11)% | | $ | 11,821,839 | |
| | | | | | | | | |
| Operating income (loss) | | | | | | | | |
| Steel Operations | $ | 1,030,554 | | (44)% | | $ | 1,839,852 | |
| Metals Recycling Operations | | 16,308 | | (79)% | | | 75,891 | |
| Steel Fabrication Operations | | 119,099 | | 92% | | | 61,901 | |
| Other | | (186,159) | | 26% | | | (253,195) | |
| | | 979,802 | | | | | 1,724,449 | |
| Intra-company | | 7,078 | | | | | (2,040) | |
| | $ | 986,880 | | (43)% | | $ | 1,722,409 | |
| Steel Operations Segment |
Steel operations consist of our electric arc furnace steel mills, producing sheet and long products steel from ferrous scrap and scrap substitutes, utilizing continuous casting and automated rolling mills, with numerous downstream processing and coating lines, as well as IDI, our liquid pig iron production facility that supplies solely the Butler Flat Roll Division. Our steel operations sell a diverse portfolio of sheet and long products directly to end-users, steel fabricators, and service centers. These products are used in a wide variety of industry sectors, including the construction, automotive, manufacturing, transportation, heavy equipment and agriculture, and pipe and tube (including OCTG) markets (see Item 1. Business). Steel operations accounted for 76% and 75% of our consolidated net sales during 2019 and 2018, respectively.
Steel Operations Shipments (tons):
| | | | | | | |
|---|---|---|---|---|---|---|
| | | | | | | |
| | Years Ended December 31, | | ||||
| | 2019 | | % Change | | 2018 | |
| Total shipments | 10,816,641 | | 2% | | 10,609,763 | |
| Intra-segment shipments | (975,372) | | | | (612,655) | |
| Steel Operations Segment shipments | 9,841,269 | | (2)% | | 9,997,108 | |
| | | | | | | |
| External shipments | 9,402,608 | | (2)% | | 9,625,291 | |
Segment Results 2019 vs. 2018
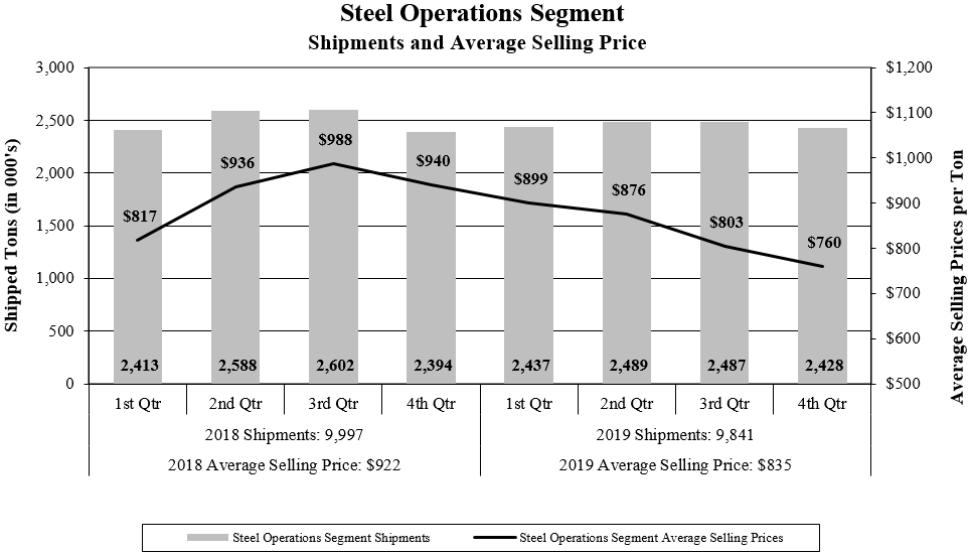
Overall domestic steel demand remained steady during 2019, with continued strength in the automotive, construction and other industrial sectors. However, a challenging steel pricing environment continued throughout 2019, due to customer inventory destocking in conjunction with weakening scrap prices, which led to decreasing steel selling prices compared to 2018. Steel operations segment shipments decreased 2% in 2019, as compared to 2018. Net sales for the steel operations decreased 11% in 2019
when compared to 2018, due primarily to decreases in overall steel selling prices, particularly in sheet steel, and decreased steel mill shipments.
Ferrous raw materials used in our electric arc furnaces represent our single most significant steel manufacturing cost, generally comprising approximately 55 to 60 percent of our steel mill operations’ manufacturing costs. Our metallic raw material cost per net ton consumed in our steel operations decreased $48, or 14%, in 2019 compared to 2018, consistent with overall decreased domestic scrap pricing.
As a result of average selling prices decreasing more than scrap costs, metal spread (which we define as the difference between average steel mill selling prices and the cost of ferrous scrap consumed in our steel mills) decreased 10% in 2019 compared to the record-high 2018. Due to this metal spread contraction, most notably in sheet steel, operating income for the steel operations decreased 44%, to $1.0 billion, in 2019 compared to the record results in 2018.
| Metals Recycling Operations Segment |
|---|
Metals recycling operations consists solely of OmniSource and includes both ferrous and nonferrous scrap metal processing, transportation, marketing, and brokerage services, strategically located primarily in close proximity to our steel mills and other end-user scrap consumers throughout the eastern half of the United States. In addition, OmniSource designs, installs, and manages customized scrap management programs for industrial manufacturing companies at hundreds of locations throughout North America. Our steel mills utilize a large portion (approximately 65%) of the ferrous scrap sold by OmniSource as raw material in our steelmaking operations, and the remainder is sold to other consumers, such as other steel manufacturers and foundries. Metals recycling operations accounted for 11% and 13% of our consolidated net sales during 2019 and 2018, respectively.
Metals Recycling Operations Shipments:
| | | | | | | | |
|---|---|---|---|---|---|---|---|
| | | | | | | | |
| | | Years Ended December 31, | | ||||
| | | 2019 | | % Change | | 2018 | |
| Ferrous metal (gross tons) | | | | | | | |
| Total | | 4,627,214 | | (10)% | | 5,123,553 | |
| Inter-company | | (3,061,257) | | (9)% | | (3,346,135) | |
| External shipments | | 1,565,957 | | (12)% | | 1,777,418 | |
| | | | | | | | |
| Nonferrous metals (thousands of pounds) | | | | | | | |
| Total | | 1,068,208 | | (6)% | | 1,131,412 | |
| Inter-company | | (144,229) | | | | (138,001) | |
| External shipments | | 923,979 | | (7)% | | 993,411 | |
Segment Results 2019 vs. 2018
Our metals recycling operations were negatively impacted throughout 2019 by falling ferrous and nonferrous scrap prices compared to 2018, as well as a challenging steel market in which customers were also reluctant to purchase during a falling pricing environment. Net sales for our metals recycling operations decreased 22% in 2019 as compared to 2018, driven by decreased shipments and ferrous scrap prices declining in eight of the twelve months during the year. Ferrous and nonferrous scrap average selling prices decreased 21% and 10%, respectively, during 2019 compared to 2018. Ferrous metal spread (which we define as the difference between average selling prices and the cost of purchased scrap) decreased 15%, while nonferrous metal spread decreased 7% in 2019 compared to 2018. Metals recycling operations operating income in 2019 of $16.3 million decreased 79% from 2018 operating income of $75.9 million, due to lower ferrous and nonferrous shipments, and metal spread contraction.
| Steel Fabrication Operations Segment |
|---|
Steel fabrication operations include our New Millennium Building Systems joist and deck plants located throughout the United States and in Northern Mexico. Revenues from these plants are generated from the fabrication of steel joists, trusses, girders and steel deck used within the non-residential construction industry. Steel fabrication operations accounted for 9% and 8% of our consolidated net sales during 2019 and 2018, respectively.
Segment Results 2019 vs. 2018
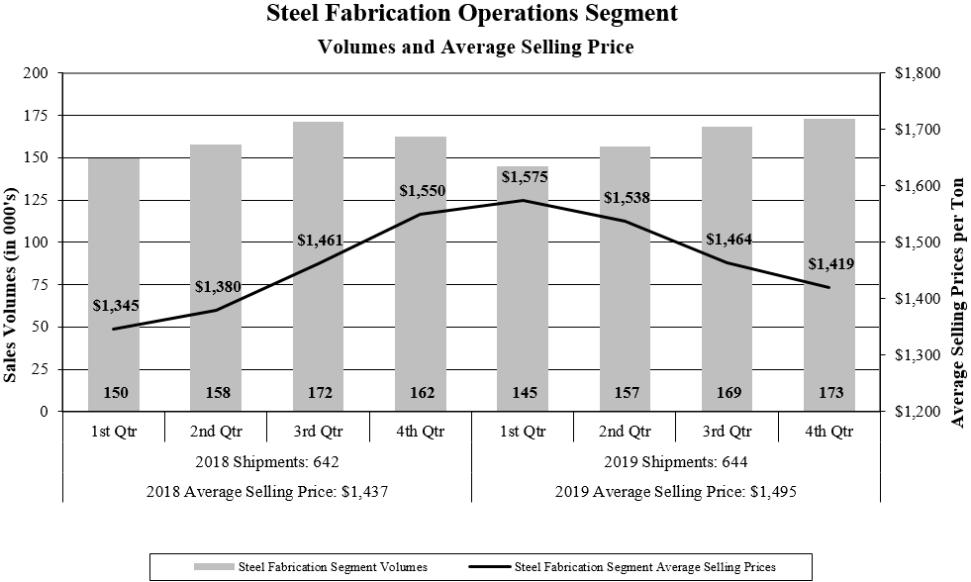
Net sales for the steel fabrication operations increased $41.3 million, or 4%, during 2019 compared to 2018, as shipments increased to a record 644,000 tons, while average selling prices increased $58 per ton, or 4%. Our steel fabrication operations continue to leverage our national operating footprint. Market demand, orders and backlog continue to be strong for non-residential construction project development, as customer sentiment remains positive.
The purchase of various steel products is the largest single cost of production for our steel fabrication operations, generally representing approximately two-thirds of the total cost of manufacturing. The average cost of steel consumed decreased by 7% in 2019, as compared to 2018, consistent with decreased steel selling prices discussed in the steel operations results, while average selling prices increased 4%, with resulting metal spread (which we define as the difference between average selling prices and the cost of purchased steel) increasing 22%. Operating income increased $57.2 million, or 92%, to $119.1 million in 2019 compared to 2018, due to the increases in volumes and metal spread, with selling prices outpacing steel input costs.
| Other Operations |
|---|
Consolidated Results 2019 vs. 2018
Selling, General and Administrative Expenses. Selling, general and administrative expenses increased 5%, or $19.9 million, to $436.5 million during 2019 compared to 2018, representing 4.2% and 3.5% of net sales, respectively. Profit sharing expense was $78.0 million in 2019, a decrease of $78.0 million from the record $156.0 million earned during 2018. The company-wide profit sharing plan represents 8% of pretax earnings; therefore, our lower 2019 earnings resulted in lower profit sharing.
Interest Expense, net of Capitalized Interest. During 2019, interest expense of $127.1 million was comparable to the $126.6 million incurred during 2018, based on consistent debt levels during the majority of both years.
Income Tax Expense. During 2019, income tax expense of $197.4 million, representing an effective income tax rate of 22.6%, was down 46% from the $364.0 million, representing an effective income tax rate of 22.5%, during 2018, consistent with lower pretax earnings.
Included in the balance of unrecognized tax benefits of $10.2 million at December 31, 2019, were potential benefits of $6.0 million that, if recognized, would affect our effective tax rate. We recognize interest and penalties related to our tax contingencies on a net-of-tax basis in income tax expense. During the year ended December 31, 2019, we recognized a benefit from the decrease of interest expense of $400,000, net of tax. In addition to the unrecognized tax benefits noted above, we had $1.4 million accrued for the payment of interest and penalties at December 31, 2019.
We file income tax returns in the United States federal jurisdiction as well as income tax returns in various state jurisdictions. We have concluded U.S. federal income tax audits through 2015. We are subject to examination and proposed adjustments by the IRS for years 2016 through 2018, and tax years 2015 through 2018 remain open to various state and local jurisdictions. At this time, we do not believe there will be any significant examination adjustments that would result in a material change to our financial position, results of operations or cash flows. It is reasonably possible that the amount of unrecognized tax benefits could change in the next twelve months in an amount ranging from zero to $3.3 million, as a result of the expiration of the statute of limitations and other federal and state income tax audits.
Liquidity and Capital Resources
Capital Resources and Long-term Debt. Our business is capital intensive and requires substantial expenditures for, among other things, the purchase and maintenance of equipment used in our steel, metals recycling, and steel fabrication operations, and to remain in compliance with environmental laws. Our short-term and long-term liquidity needs arise primarily from working capital requirements, capital expenditures, principal and interest payments related to our outstanding indebtedness, dividends to our shareholders, stock repurchases, and acquisitions. We have met these liquidity requirements primarily with cash provided by operations and long-term borrowings, and we also have availability under our unsecured Revolver. Our liquidity at December 31, 2019, is as follows (in thousands):
| | | | | | | | | | |
|---|---|---|---|---|---|---|---|---|---|
| | | | | | | | | | |
| | | | Cash and equivalents | | $ | 1,381,460 | | | |
| | | | Short-term investments | | | 262,174 | | | |
| | | | Unsecured revolver availability | | | 1,158,039 | | | |
| | | | Total liquidity | | $ | 2,801,673 | | | |
In October 2019, our corporate credit rating was upgraded to an investment grade credit designation by three credit rating agencies.
In December 2019, we entered into a new unsecured credit agreement which has a senior unsecured revolving credit facility (Facility), which provides a $1.2 billion unsecured Revolver, and matures in December 2024. Subject to certain conditions, we have the opportunity to increase the Facility size by $500.0 million. The unsecured Revolver is available to fund working capital, capital expenditures, and other general corporate purposes. The Facility contains financial covenants and other covenants pertaining to our ability to incur indebtedness and permit liens on property. Our ability to borrow funds within the terms of the unsecured Revolver is dependent upon our continued compliance with the financial and other covenants. At December 31, 2019, we had $1.2 billion of availability on the Revolver, $42.0 million of outstanding letters of credit and other obligations which reduce availability, and there were no borrowings outstanding.
The financial covenants under our Facility state that we must maintain an interest coverage ratio of not less than 2.50:1.00. Our interest coverage ratio is calculated by dividing our last-twelve-months (LTM) consolidated adjusted EBITDA (earnings before interest, taxes, depreciation, amortization, and certain other non-cash transactions as allowed in the Facility) by our LTM gross interest expense, less amortization of financing fees. In addition, a debt to capitalization ratio of not more than 0.60:1.00 must be maintained. At December 31, 2019, our interest coverage ratio and debt to capitalization ratio were 10.72:1.00 and 0.40:1.00, respectively. We were, therefore, in compliance with these covenants at December 31, 2019, and we anticipate we will continue to be in compliance during the next twelve months.
In December 2019, we issued $400.0 million of 2.800% senior notes due 2024 (the "2024 Notes"), and $600.0 million of 3.450% senior notes due 2030 (the “2030 Notes”), the net proceeds of which were used to fund the call and redemption of all $700.0 million of our 5.125% Senior Notes due 2021 (the "2021 Notes") in accordance with the indenture governing our 2021 Notes, and for general corporate purposes. Refer to Note 3. Long-term Debt to the consolidated financial statements elsewhere in this report for additional information regarding these transactions, and our long-term debt
Our total outstanding debt increased $357.6 million during 2019, due to our December 2019 issuance of the 2024 Notes and 2030 Notes as described above. Our total long-term debt to capitalization ratio (representing our long-term debt, including current maturities, divided by the sum of our long-term debt, redeemable noncontrolling interests, and our total stockholders’ equity) was 40.2% and 37.9% at December 31, 2019, and December 31, 2018, respectively.
Working Capital. We generated cash flow from operations of $1.4 billion in 2019. Operational working capital (representing amounts invested in trade receivables and inventories, less current liabilities other than income taxes payable and debt) decreased $339.5 million, excluding the effect of acquired USS working capital, to $1.6 billion at December 31, 2019, due primarily to decreased accounts receivable and inventories consistent with decreased sales and inventory costs.
Capital Investments. During 2019, we invested $451.9 million in property, plant and equipment, primarily within our steel operations segment, compared with $239.4 million invested during 2018. The increase in 2019 relates primarily to organic steel growth opportunities, including our new electric arc furnace flat roll steel mill currently under construction in Sinton, Texas.
Cash Dividends. As a reflection of continued confidence in our current and future cash flow generation ability and financial position, we increased our quarterly cash dividend by 28% to $0.2400 per share in the first quarter 2019 (from $0.1875 per share in 2018), resulting in declared cash dividends of $209.5 million during 2019, compared to $174.4 million during 2018. We paid cash dividends of $200.3 million and $168.9 million during 2019 and 2018, respectively. Our board of directors, along with executive management, approves the payment of dividends on a quarterly basis. The determination to pay cash dividends in the future is at the discretion of our board of directors, after taking into account various factors, including our financial condition, results of operations, outstanding indebtedness, current and anticipated cash needs and growth plans.
Other. In August 2018, our board of directors authorized a share repurchase program of up to $750 million of our common stock. Under the share repurchase program, purchases will take place, as and when, we determine in open market or private transactions made based upon the market price of our common stock, the nature of other investment opportunities or growth projects, our cash flows from operations, and general economic conditions. The share repurchase program does not require us to acquire any specific number of shares, and may be modified, suspended, extended or terminated by us at any time. We acquired 11.3 million shares of our common stock for $348.6 million in 2019, leaving $50.5 million remaining available to purchase under the program at December 31, 2019. See Part II, Item 5. Market for Registrant’s Common Equity, Related Stockholder Matters and Issuer Purchases of Equity Securities for additional information.
Our ability to meet our debt service obligations and reduce our total debt will depend upon our future performance which, in turn, will depend upon general economic, financial and business conditions, along with competition, legislation and regulatory factors that are largely beyond our control. In addition, we cannot assure that our operating results, cash flows, access to credit markets and capital resources will be sufficient for repayment of our indebtedness in the future. We believe that based upon current levels of operations and anticipated growth, cash flows from operations, together with other available sources of funds, including if necessary borrowings under our Revolver through its term, will be adequate for the next twelve months for making required payments of principal and interest on our indebtedness, funding working capital requirements, and anticipated capital expenditures.
Contractual Obligations and Other Long-Term Liabilities
We have the following minimum commitments under contractual obligations, including purchase obligations, as defined by the Securities and Exchange Commission. A “purchase obligation” is defined as an agreement to purchase goods or services that is enforceable and legally binding and that specifies all significant terms, including fixed or minimum quantities to be purchased; fixed, minimum or variable price provisions; and the approximate timing of the transaction. Other long-term liabilities are defined as long-term liabilities that are reflected on our balance sheet under generally accepted accounting principles. Based on this definition, the following table includes only those contracts which include fixed or minimum obligations. It does not include normal purchases, which are made in the ordinary course of business. The following table provides aggregated information about outstanding contractual obligations and other long-term liabilities as of December 31, 2019 (in thousands):
| | | | | | | | | | | | | | | |
|---|---|---|---|---|---|---|---|---|---|---|---|---|---|---|
| | | | | | | | | | | | | | | |
| | Payments Due By Period | |||||||||||||
| | Total | | 2020 | | 2021 & 2022 | | 2023 & 2024 | | 2025 & After | |||||
| Long-term debt (1) | $ | 2,764,472 | | $ | 89,356 | | $ | 7,976 | | $ | 1,307,082 | | $ | 1,360,058 |
| Estimated interest payments on debt (2) | | 710,920 | | | 121,513 | | | 236,952 | | | 192,709 | | | 159,746 |
| Purchase obligations (3) | | 677,652 | | | 240,832 | | | 223,621 | | | 62,640 | | | 150,559 |
| Construction commitments (4) | | 820,429 | | | 734,029 | | | 86,400 | | | - | | | - |
| Lease commitments | | 84,441 | | | 20,201 | | | 30,991 | | | 18,194 | | | 15,055 |
| Other commitments (5) | | 1,626 | | | 250 | | | 425 | | | 400 | | | 551 |
| Total (6) | $ | 5,059,540 | | $ | 1,206,181 | | $ | 586,365 | | $ | 1,581,025 | | $ | 1,685,969 |
| (1) | The long-term debt payment information presented above assumes that our senior notes remain outstanding until maturity. Refer to Note 3. Long-term Debt to the consolidated financial statements elsewhere in this report for additional information regarding these transactions, and our long-term debt. |
|---|
| (2) | The estimated interest payments shown above assume interest rates of 5¼% on our $400.0 million senior unsecured notes due April 2023; 2.800% on our $400.0 million senior unsecured notes due December 2024; 5.500% on our $500.0 million senior unsecured notes due October 2024; 4.125% on our $350.0 million senior unsecured notes due September 2025; 5.00% on our $400.0 million senior unsecured notes due December 2026; 3.450% on our $600.0 million senior unsecured notes due April 2030; 0.175% commitment fee on our available Revolver; and an average of 3.7% on our other debt of $114.5 million. |
|---|
| (3) | Purchase obligations include commitments we have for the purchase of such commodities as electricity, water, natural gas and its transportation services, fuel, air products, zinc, and electrodes. These arrangements have “take or pay” or other similar commitment provisions. We have utilized such “take or pay” requirements during the past three years under these contracts, except for certain air products at our Minnesota ironmaking operations which have been idle since May 2015. Purchase obligations related to the start-up of our new Southwest-Sinton Flat Roll Division total $137.3 million, starting in 2021. Refer to Note 9. Commitments and Contingencies to the consolidated financial statements elsewhere in this report for additional information. |
|---|
| (4) | Construction commitments relate to firm contracts we have with various vendors for the completion of certain construction projects at our various divisions at December 31, 2019. Construction commitments related to our new Southwest-Sinton Flat Roll Division mill comprise $681.9 million of this total, including the $86.4 million in 2021. Refer to Note 9. Commitments and Contingencies to the consolidated financial statements elsewhere in this report for additional information. |
|---|
| (5) | Other commitments principally relate to deferred compensation plan obligations. |
|---|
| (6) | We expect to make cash outlays in the future related to our unrecognized tax benefits; however, due to the uncertainty of the timing, we are unable to make reasonably reliable estimates regarding the period of cash settlement with the respective taxing authorities. Accordingly, unrecognized tax benefits and related interest and penalties of $11.6 million as of December 31, 2019, have been excluded from the contractual obligations table above. Refer to Note 4. Income Taxes to the consolidated financial statements elsewhere in this report for additional information. |
|---|
Other Matters
Inflation
We believe that inflation has not had a material effect on our results of operations.
Environmental and Other Contingencies
We have incurred, and in the future will continue to incur, capital expenditures and operating expenses for matters relating to environmental control, remediation, monitoring and compliance. During 2019, we incurred costs related to the monitoring and compliance of environmental matters in the amount of approximately $32.1 million and capital expenditures related to environmental compliance of approximately $2.3 million. Of the costs incurred during 2019 for monitoring and compliance, approximately 68% were related to the normal transportation of certain types of waste produced in our steelmaking processes and other facilities, in accordance with legal requirements. We incurred combined environmental remediation costs of approximately $1.3 million at all of our facilities during 2019. We have an accrual of $3.6 million recorded for environmental remediation related to our metals recycling operations, and $2.6 million related to our Minnesota ironmaking operations. We believe, apart from our dependence on environmental construction and operating permits for our existing and any future manufacturing facilities, that compliance with current environmental laws and regulations is not likely to have a materially adverse effect on our financial condition, results of operations or liquidity. However, environmental laws and regulations evolve and change, and we may become subject to more stringent environmental laws and regulations in the future, such as the impact of United States government or various governmental agencies introducing regulatory changes in response to the potential of climate change.
Critical Accounting Policies and Estimates
Management’s Discussion and Analysis of Our Financial Condition and Results of Operations is based upon our consolidated financial statements, which have been prepared in accordance with accounting principles generally accepted in the United States. We review the accounting policies we use in reporting our financial results on a regular basis. The preparation of these financial statements requires us to make estimates and judgments that affect the reported amounts of assets, liabilities, revenues and expenses and related disclosure of contingent liabilities. We evaluate the appropriateness of these estimations and judgments on an ongoing basis. We base our estimates on historical experience and on various other assumptions that are believed to be reasonable under the circumstances, the results of which form the basis for making judgments about the carrying value of assets and liabilities that are not readily apparent from other sources. Results may differ from these estimates due to actual outcomes being different from those on which we based our assumptions. We believe the following critical accounting policies affect our more significant judgments and estimates used in the preparation of our consolidated financial statements.
Revenue Recognition and Allowance for Doubtful Accounts. Except for our steel fabrication operations, we recognize revenues at the point in time the performance obligation is satisfied, and control of the product is transferred to the customer upon shipment or delivery, at the amount of consideration the company expects to receive, including any variable consideration. The variable consideration included in the company’s steel operations segment contracts, which is not constrained, include estimated product returns and customer claims, and may include volume rebates which are recorded on an expected value basis. Our steel fabrication operations segment recognizes revenue over time at the amount of consideration the company expects to receive. Revenue is measured on an output method representing completed fabricated tons to date as a percentage of total tons required for each contract. The company does not exercise significant judgements in determining the timing of satisfaction of performance obligations or the transaction price. Provision is made for estimated product returns and customer claims based on historical experience. If the historical data used in our estimates does not reflect future returns and claims trends, additional provision may be necessary. The allowance for doubtful accounts is based on our best estimate of known credit risks, historical experience, and current economic conditions affecting our customers, which estimates may or may not prove accurate.
We are exposed to credit risk in the event of nonpayment by our customers, which in steel operations are principally intermediate steel processors and service centers that sell our products to numerous industry sectors, including the construction, automotive, manufacturing, transportation, heavy and agriculture equipment, and pipe and tube (including OCTG) markets. Our metals recycling operations sell ferrous scrap to steel mills and foundries, and nonferrous scrap, such as copper, brass, aluminum and stainless steel to, among others, ingot manufacturers, copper refineries and mills, smelters, and specialty mills. Our steel fabrication operations sell fabricated steel joists and deck primarily to the non-residential construction market. We mitigate our exposure to credit risk, which we generally extend initially on an unsecured basis, by performing ongoing credit evaluations and taking further action when necessary, such as requiring letters of credit or other security interests to support the customer receivable. If the financial condition of our customers were to deteriorate, resulting in the impairment of their ability to make payments, additional allowance may be required.
Inventories. We record inventories at lower of cost or net realizable value. Cost is determined using a weighted average cost method for raw materials and supplies, and on a first-in, first-out, basis for other inventory. We record amounts required, if any, to reduce the carrying value of inventory to its net realizable value as a charge to cost of goods sold. If product selling prices were to decline in future periods, further write-down of inventory could result, specifically raw material inventory such as scrap purchased during periods of peak market pricing.
Impairments of Long-Lived Tangible and Definite-Lived Intangible Assets. We review long-lived assets for impairment whenever events or changes in circumstances indicate the carrying amount of such assets may not be fully recoverable. Impairment losses are recorded on long-lived assets used in operations when indicators of impairment are present and the undiscounted cash flows estimated to be generated by those assets are less than the assets’ carrying amounts. The impairment loss is measured by comparing the fair value of the asset to its carrying amount. We consider various factors and determine whether an impairment test is necessary, including by way of examples, a significant and prolonged deterioration in operating results and/or projected cash flows, significant changes in the extent or manner in which an asset is used, technological advances with respect to assets which would potentially render them obsolete, our strategy and capital planning, and the economic climate in markets to be served. When determining future cash flows and if necessary, fair value, we must make judgments as to the expected utilization of assets and estimated future cash flows related to those assets. We consider historical and anticipated future results, general economic and market conditions, the impact of planned business and operational strategies and all other available information at the time the estimates are made. Those estimates and judgments may or may not ultimately prove accurate.
A long-lived asset is classified as held for sale upon meeting specified criteria related to ability and intent to sell. An asset classified as held for sale is measured at the lower of its carrying amount or fair value less cost to sell. As of December 31, 2019, and 2018, the company reported $8.0 million and $8.3 million, respectively, of assets held for sale within other current assets in our consolidated balance sheet. An impairment loss is recognized for any initial or subsequent write-down of the asset held for sale to its fair value less cost to sell. For assets determined to be classified as held for sale in the year ended December 31, 2019 and 2018, the asset carrying amounts approximated their fair value less cost to sell. The company determined fair value using Level 3 fair value inputs as provided for under ASC 820, consisting of information provided by brokers and other external sources along with management’s own assumptions.
Goodwill.
Our goodwill, relating to various business combinations, consisted of the following at December 31 (in thousands):
| | | | | | | | | |
|---|---|---|---|---|---|---|---|---|
| | | | 2019 | | 2018 | | ||
| | | | | | | | | |
| | Steel Operations Segment | | $ | 272,133 | | $ | 245,473 | |
| | Metals Recycling Operations Segment | | | 178,857 | | | 182,247 | |
| | Steel Fabrication Operations Segment | | | 1,925 | | | 1,925 | |
| | | | $ | 452,915 | | $ | 429,645 | |
At least once annually (as of October 1), or when indicators of impairment exist, the company performs an impairment test for goodwill. Goodwill is allocated to various reporting units, which are generally one level below the company’s operating segments. The fair value of the reporting unit is determined by using an estimate of future cash flows utilizing a risk-adjusted discount rate to calculate the net present value of future cash flows (income approach), and by using a market approach based upon an analysis of valuation metrics of comparable peer companies, using Level 3 fair value inputs as provided for under ASC 820. If the fair value exceeds the carrying value of the reporting unit, there is no impairment. If the carrying amount exceeds the fair value, we recognize an impairment loss in the amount by which the carrying value of the net assets assigned to the reporting unit exceeds the fair value of the reporting unit, with the impairment loss not to exceed the amount of goodwill allocated to the reporting unit.
Key assumptions used to determine the estimated fair value of each reporting unit under the discounted cash flows method (income approach) include: (a) expected cash flows for the five-year period following the testing date (including market share, sales volumes and prices, costs to produce and estimated capital needs); (b) an estimated terminal value using a terminal year growth rate determined based on the growth prospects of the reporting unit; and (c) a risk-adjusted discount rate based on management’s best estimate of market participants’ after-tax weighted average cost of capital and market risk premiums. Key assumptions used to determine the estimated fair value of each reporting unit under the market approach include the expected revenues and cash flows in the next year. We consider historical and anticipated future results, general economic and market conditions, the impact of planned business and operational strategies and all available information at the time the fair values of its reporting units are estimated. Those estimates and judgments may or may not ultimately prove accurate.
Goodwill acquired in past transactions are naturally more susceptible to impairment, primarily due to the fact that they are recorded at fair value based on operating plans and economic conditions at the time of acquisition. Consequently, if operating results and/or economic conditions deteriorate after an acquisition, it could result in the impairment of the acquired assets. A deterioration of economic conditions may not only negatively impact the estimated operating cash flows used in our cash flow models but may also negatively impact other assumptions used in our analyses, including, but not limited to, the estimated cost of capital and/or discount rates. Additionally, we are required to ensure that assumptions used to determine fair value in our analyses are consistent with the assumptions a hypothetical marketplace participant would use. As a result, the cost of capital and/or discount rates used in our
analyses may increase or decrease based on market conditions and trends, regardless of whether our actual cost of capital has changed. Therefore, we may recognize an impairment in spite of realizing actual cash flows that are approximately equal to or greater than our previously forecasted amounts.
Our fourth quarter 2019, 2018, and 2017 annual goodwill impairment analyses did not result in any impairment charges. Management does not believe that it is reasonably likely that our reporting units will fail the goodwill impairment test in the near term, as the determined fair value of the reporting units with goodwill exceeded their carrying value by more than an insignificant amount. We will continue to monitor operating results within all reporting units throughout the upcoming year to determine if events and circumstances warrant interim impairment testing. Otherwise, all reporting units will again be subject to the required annual impairment test during the fourth quarter of 2020. Changes in judgments and estimates underlying our analysis of goodwill for possible impairment, including expected future operating cash flows and discount rate, could decrease the estimated fair value of our reporting units in the future and could result in an impairment of goodwill.
Income Taxes. We are required to estimate our income taxes as a part of the process of preparing our consolidated financial statements. This requires us to estimate our actual current tax exposure together with assessing temporary differences resulting from differing treatments of items for tax and accounting purposes. These differences result in deferred tax assets and liabilities, which are included within our consolidated balance sheet. We must then assess the likelihood that our deferred tax assets will be recovered from future taxable income and, to the extent we believe that recovery is not likely, we must establish a valuation allowance. We also establish reserves to reduce some or all of the tax benefit of any of our tax positions at the time we determine that the positions become uncertain. We adjust these reserves, including any impact on the related interest and penalties, in light of changing facts and circumstances, such as the progress of a tax audit. A number of years may elapse before a particular matter for which we have established a reserve is audited by a taxing authority and finally resolved. The number of years with open tax audits varies depending on the tax jurisdiction. The tax benefit that has been previously reserved because of a failure to meet the "more likely than not" recognition threshold would be recognized in our income tax expense in the first interim period when the uncertainty disappears. Settlement of any particular issue would usually require the use of cash.
Previous: Item 6. SELECTED FINANCIAL DATA · Next: Item 7A. QUANTITATIVE AND QUALITATIVE DISCLOSURES ABOUT MARKET RISK